Distinct neural networks for the volitional control of vocal and manual actions in the monkey homologue of Broca's area
- Animal Physiology, Institute of Neurobiology, University of Tübingen, Germany
Figures
Figure 1
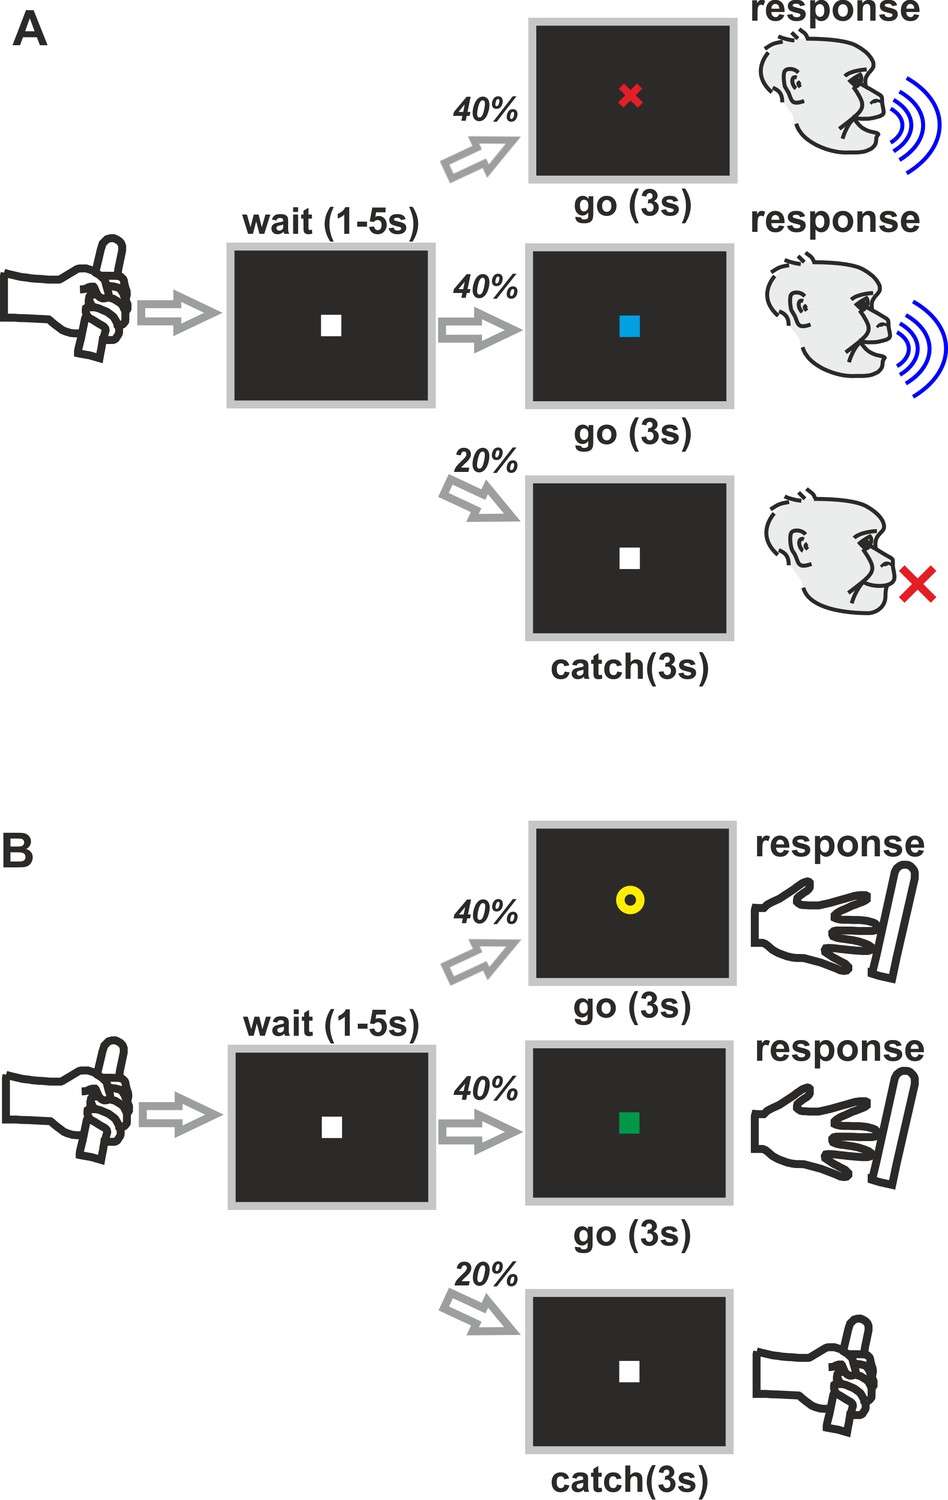
Experimental design.
Two monkeys were trained in a ‘go/nogo’ detection task. In alternating trial blocks, the animals had either to vocalize in response to one of two arbitrary visual cues (blue square or red cross) (A) or to release a bar in response to two other visual stimuli (green square or yellow circle) (B).
Figure 2

Example of a single session of monkey P.
Responses in ‘vocal’, ‘manual’ and ‘catch’ trials are sorted according to the length of the ‘pre-cue’ signal. Each line represents a single trial; blue circles indicate vocal onsets and green triangles indicate timing of the bar release. Pink circles and triangles indicate wrong responses. ‘go’ trials ignored by the monkey (‘misses’) are marked with a horizontal black bar at trial end.
Figure 3

Behavioral performance.
(A, B) Distribution of ‘hit’ and ‘false alarm’ rates for each response type and animal separately, averaged over 20 sessions for Monkey A and 41 for monkey P. (C, D) Sensitivity of signal detection for ‘vocal’ and ‘manual’ trials indicated by the d’ prime value. The dotted line indicates the detection threshold of 1.5. (E, F) Response probability of ‘vocal’ and ‘manual’ responses in the corresponding trial type. Normalized and averaged response over sessions are shown. Shaded areas indicate first and third quartiles.
Figure 4
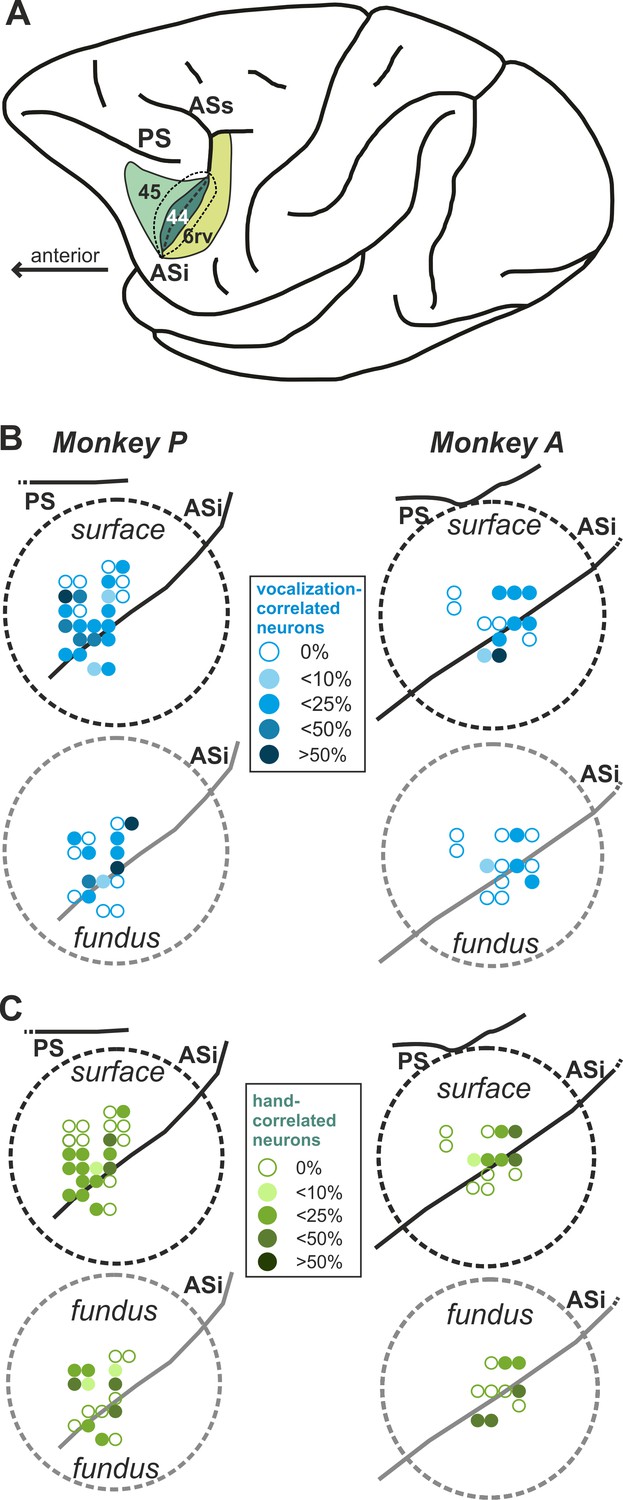
Recording sites in the inferior frontal lobe of both monkeys.
(A) Lateral view of the left hemisphere indicating the recording area: parts of the rostroventral premotor cortex (PMrv of area 6), the fundus of the inferior arcuate sulcus (ASi) encompassing area 44, and the ventral pre-arcuate region containing parts of area 45. The inferior arcuate sulcus is unfolded, with dotted lines marking the transition from the cortical surface to the gyral walls. PS, principal sulcus; ASi, inferior arcuate sulcus; ASs, superior arcuate sulcus (B, C) Precise recording sites inside each recording chamber (dotted circles). Recording sites with a depth >6 mm were defined as ASi sites. For better overview, recording sites within the fundus of the inferior AS (area 44) are depicted offset on the right side of each chamber. The proportion of vocalization-correlated neurons (B) in relation to all neurons recorded at a specific recording site is coded with different shades of blue. Similarly, the proportion of hand-correlated neurons (C) in relation to all neurons recorded at a specific recording site is coded with different shades of green color.
Figure 5
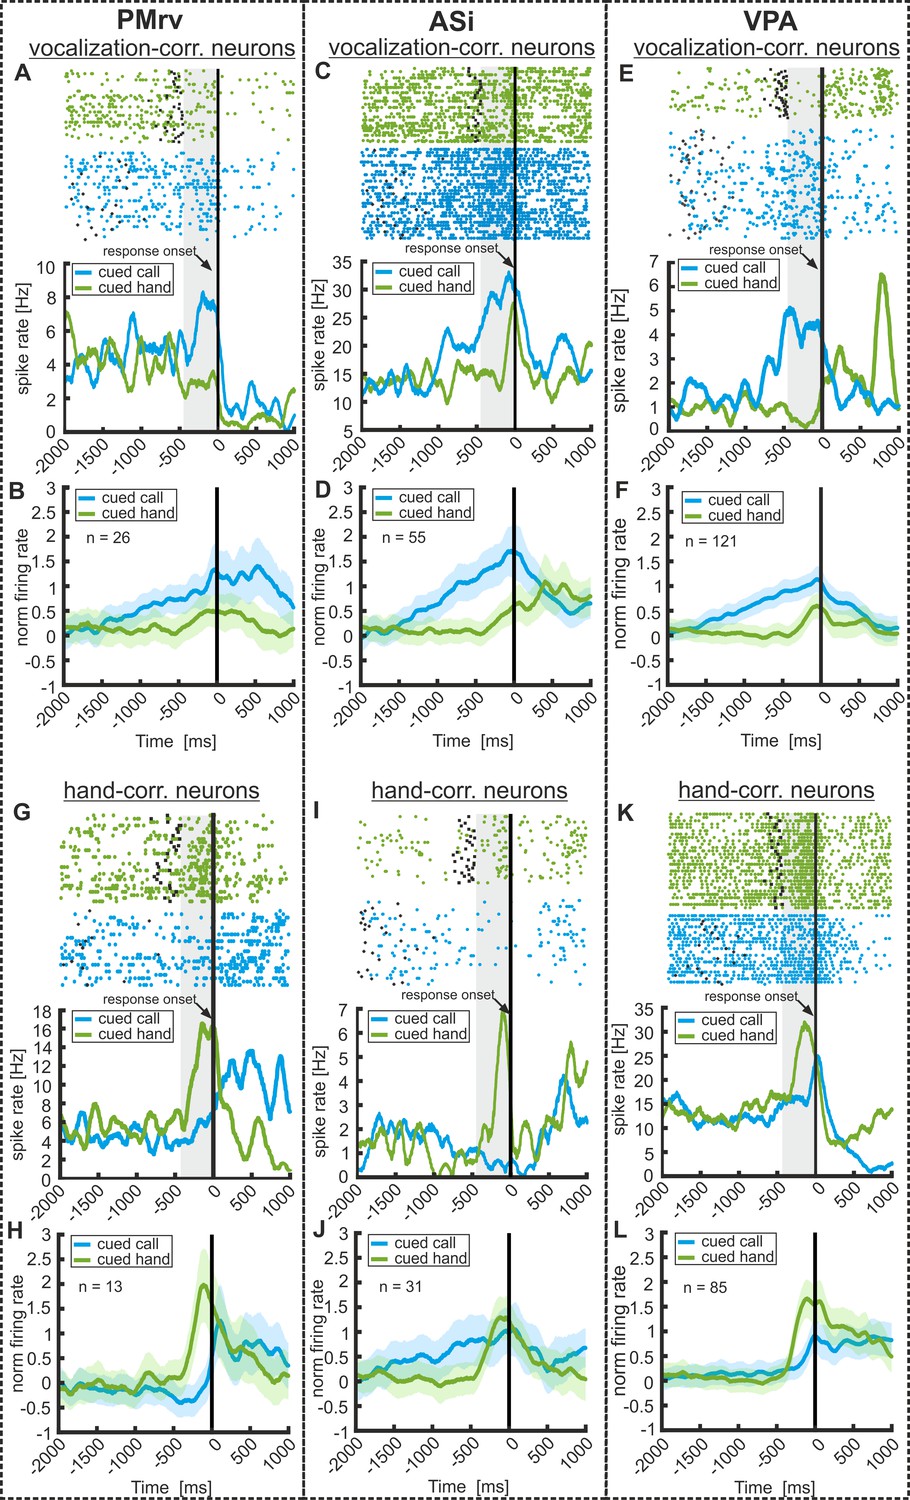
Neuronal responses to the preparation of volitional vocalizations and hand movements in PMrv (left), ASi (middle), and VPA (right).
Responses of three example vocalization-correlated neurons and three hand-correlated neurons in ‘vocal’ and ‘manual’ trials as well as averaged and normalized population responses for the corresponding examples. Responses are recorded in PMrv (left column), ASi (middle column), and VPA (right column). (A,C,E) Three example vocalization-correlated neurons that show a significant increase of neuronal activity during 450 ms before the instructed vocalization compared to baseline (450 ms before ‘go’ cue onset). At the same time, the neurons show only minor changes in activity preceding the response in ‘manual’ trials. Upper panel show the raster plot, black dots and asterisks indicate the ‘go’ cue onset in the ‘vocal’ and ‘manual’ trials, respectively. The lower panel represent the corresponding spike density histogram averaged and smoothed with a Gaussian kernel (150 ms) for illustration. The vertical black line indicates the response onset. Vocal responses have an average duration of 97 ± 40 ms. (B,D,F) Averaged and normalized activity of all vocalization correlated neurons recorded in the corresponding area. These-neurons show a significantly different activity prior to cued ‘vocal’ responses compared to cued ‘manual’ responses (activity tested in 450 ms before response onset; Mann Whitney U test: p<0.001). (G,I,K) Three example hand-correlated neurons showing a significant increase in firing rate before the instructed ‘manual’ response compared to baseline activity. The activity in ‘vocal’ trials remains at baseline level. (H,J,L) Averaged and normalized activity of all hand-movement-correlated neurons recorded in the corresponding area. Hand-correlated neurons show a significant change in firing rate only preceding ‘manual’ responses but not preceding ‘vocal’ responses (activity tested in 450 ms before response onset; Mann Whitney U test: (H,J) p<0.001, (L): p=0.115). Shaded area around the curves depicts the standard error of the mean (s.e.m.).
Figure 6
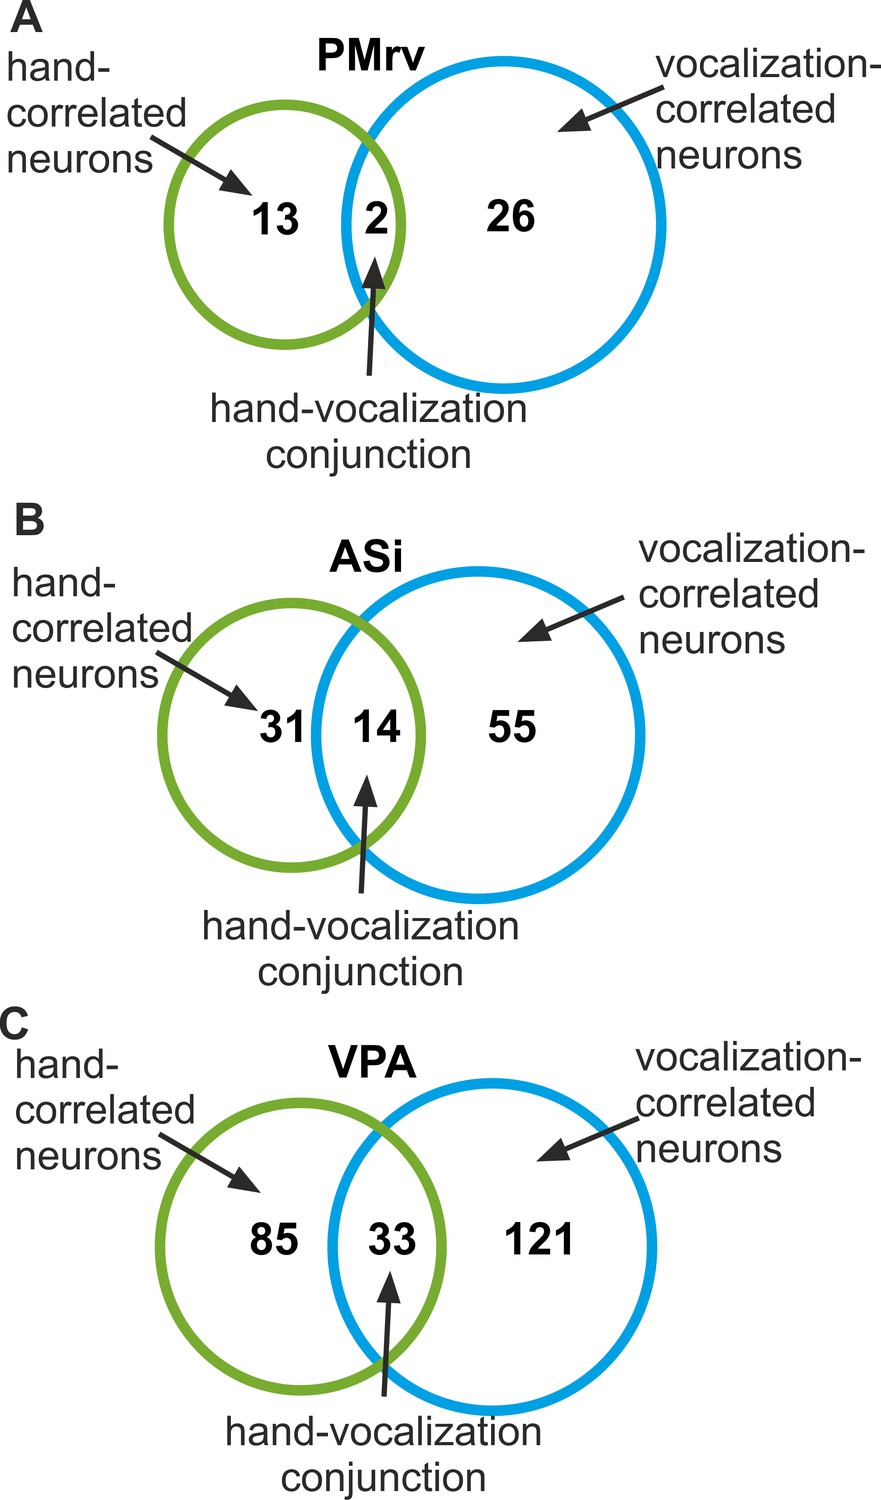
Proportions of hand- and vocalization-correlated neurons recorded in PMrv (A), ASi (B), and VPA (C).
The Venn diagrams depict the number of hand-correlated neurons and vocalization-correlated neurons that encode only one type of the response (‘vocal’ or ‘manual’) or both response types at the same time.
Figure 7
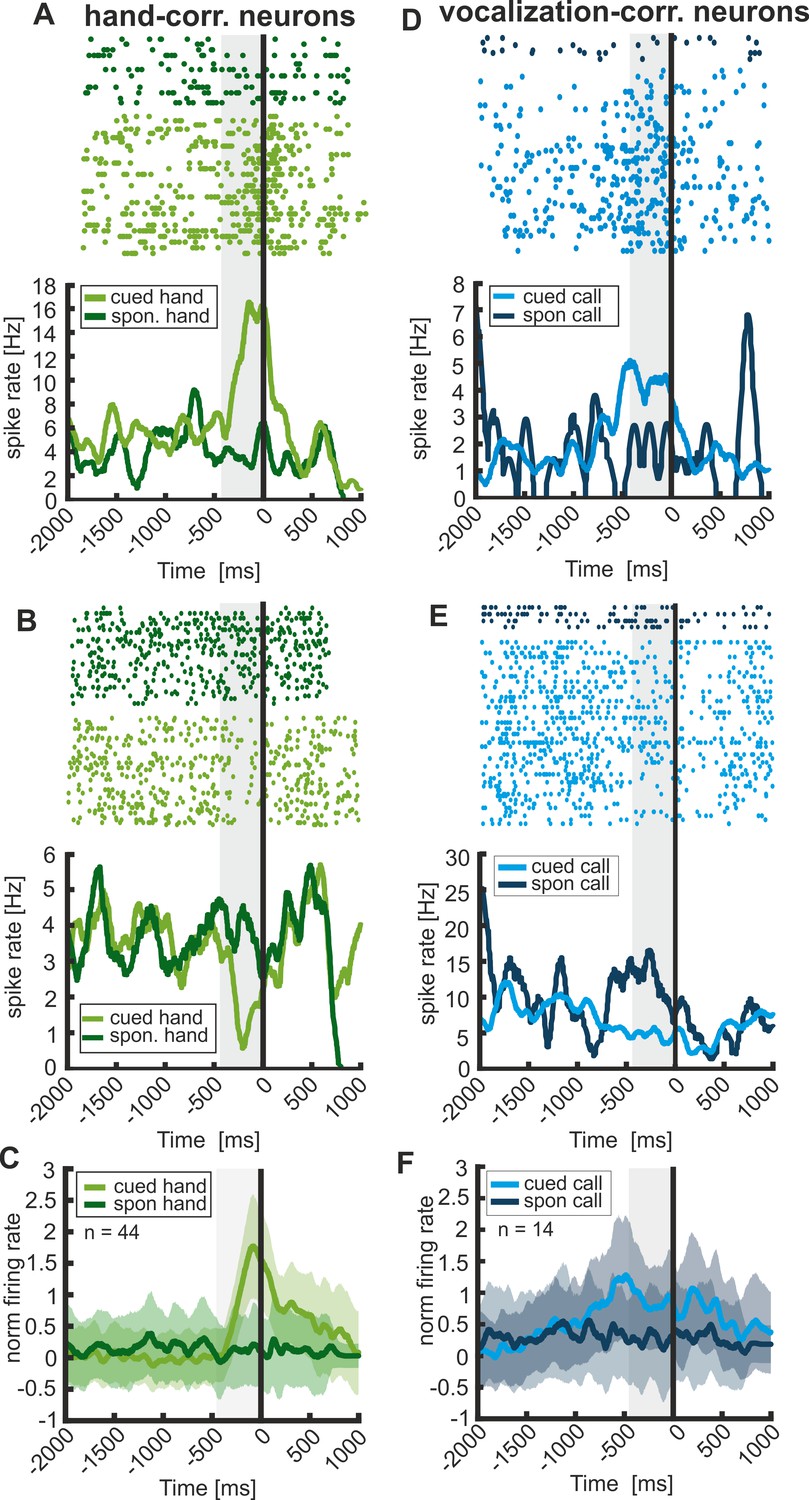
Response type correlated activity of vocalization- and hand-correlated neurons preceding cued and spontaneous responses.
Left and right column represent the activity in ‘cued’ and ‘spontaneous’ trials of two example hand- and vocalization-correlated neurons, respectively (A,B,D,E). Vocalization-correlated neurons show significantly increased or decreased activity prior to instructed calls but not prior to spontaneously uttered vocalizations. (C,F) Averaged and normalized population activity of 44 hand-correlated and 14 vocalization-correlated neurons that were recorded during ‘cued’ and ‘spontaneous’ trials. Hand-correlated neurons show a significantly different activity prior to cued ‘manual’ responses compared to ‘spontaneous manual’ responses (activity tested in 450 ms before response onset; Wilcoxon signed rank test: p<0.001). Similarly, vocalization-correlated neurons show a significantly different activity prior to ‘cued vocal’ responses compared to ‘spontaneous vocal’ responses (Wilcoxon signed rank test; p<0.01). Shaded area around the curves depicts s.e.m.
Figure 8
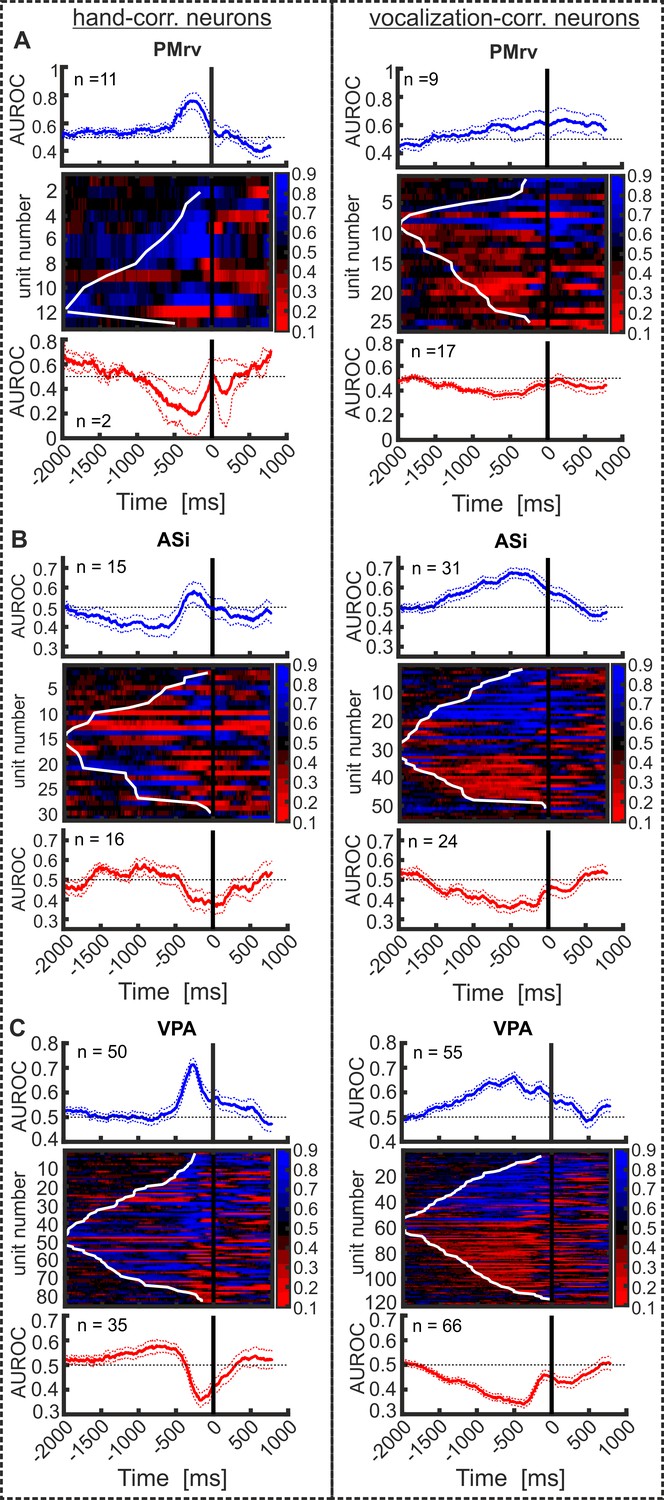
Quality and temporal evolution of response correlated activity for all hand-correlated neurons (left column) and all vocalization-correlated neurons (right column), recorded in PMrv (A), ASi (B), and VPA (C).
Neurons are sorted based in their activity profile (increased or decreased FR) in the pre-response period compared to baseline and the latency of response type coding. Top: average AUROC values of all hand- (left) or vocalization-correlated neurons (right) increasing their FR prior to ‘manual’ response. Middle: AUROC values of each individual hand- or vocalization-correlated neuron from 2000 ms before to 1000 ms after response onset. The black line at 0 ms indicates the response onset. The white line marks each neuron’s latency of response type discrimination. Bottom: average AUROC values of all hand- (left) or vocalization-correlated neurons (right) showing decreased activity prior to response onset. Dashed lines represent the s.e.m.
Figure 9
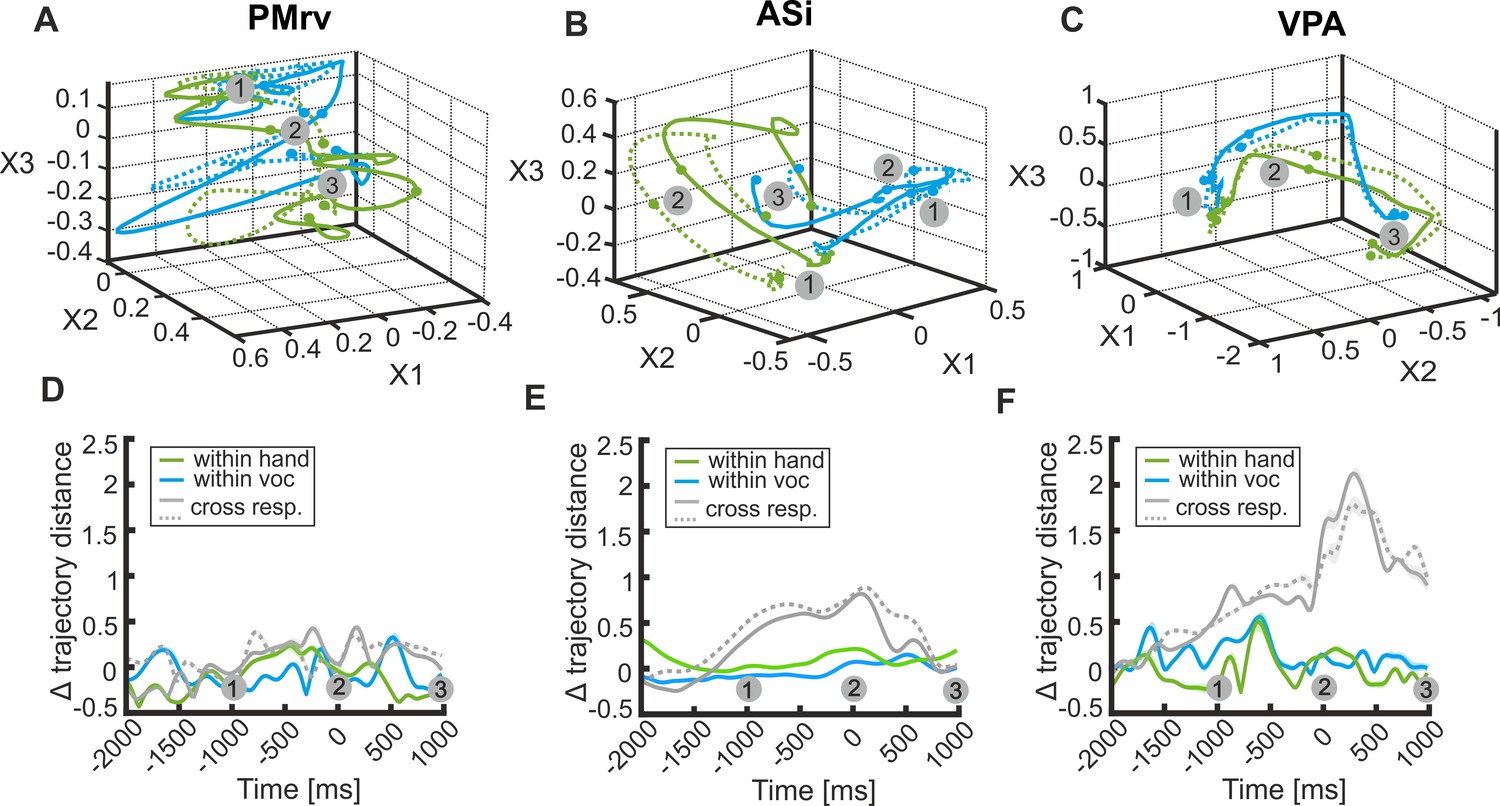
Temporal evolution of pre-response activity in the whole populations of neurons recorded in PMrv (left), ASi (middle), and VPA (right).
(A–C) Gaussian Process Factor Analysis delineating the state-space of neuronal population activity (PMrv: n = 36 neurons; ASi: n = 81 neurons; VPA: n = 180 neurons) over time for ‘manual’ (green) and ‘vocal’ trials (blue), respectively. Solid and dashed lines of the same color represent each one half of the trials from the same condition. Each trajectory represents the average of 100 repetitions of GPFA performed on randomly selected 17 trials (VPA) or 15 trials ASi and PMrv for each condition and each neuron. Dots and numbers indicate time point 1000 ms before response onset (1), the response onset (2) and time point 1000 ms after response onset (3). (D–F) Averaged inter-trajectory Euclidean distance over time, as a measure for within-response coding (colored lines) and cross-response coding (gray lines). Shaded area around the curves represents the s.e.m.
Additional files
Download links
A two-part list of links to download the article, or parts of the article, in various formats.
Downloads (link to download the article as PDF)
Open citations (links to open the citations from this article in various online reference manager services)
Cite this article (links to download the citations from this article in formats compatible with various reference manager tools)
Distinct neural networks for the volitional control of vocal and manual actions in the monkey homologue of Broca's area
eLife 10:e62797.
https://doi.org/10.7554/eLife.62797


