Ligand sensing enhances bacterial flagellar motor output via stator recruitment
- Department of Chemical Engineering, Indian Institute of Technology Bombay, India
Figures
Figure 1
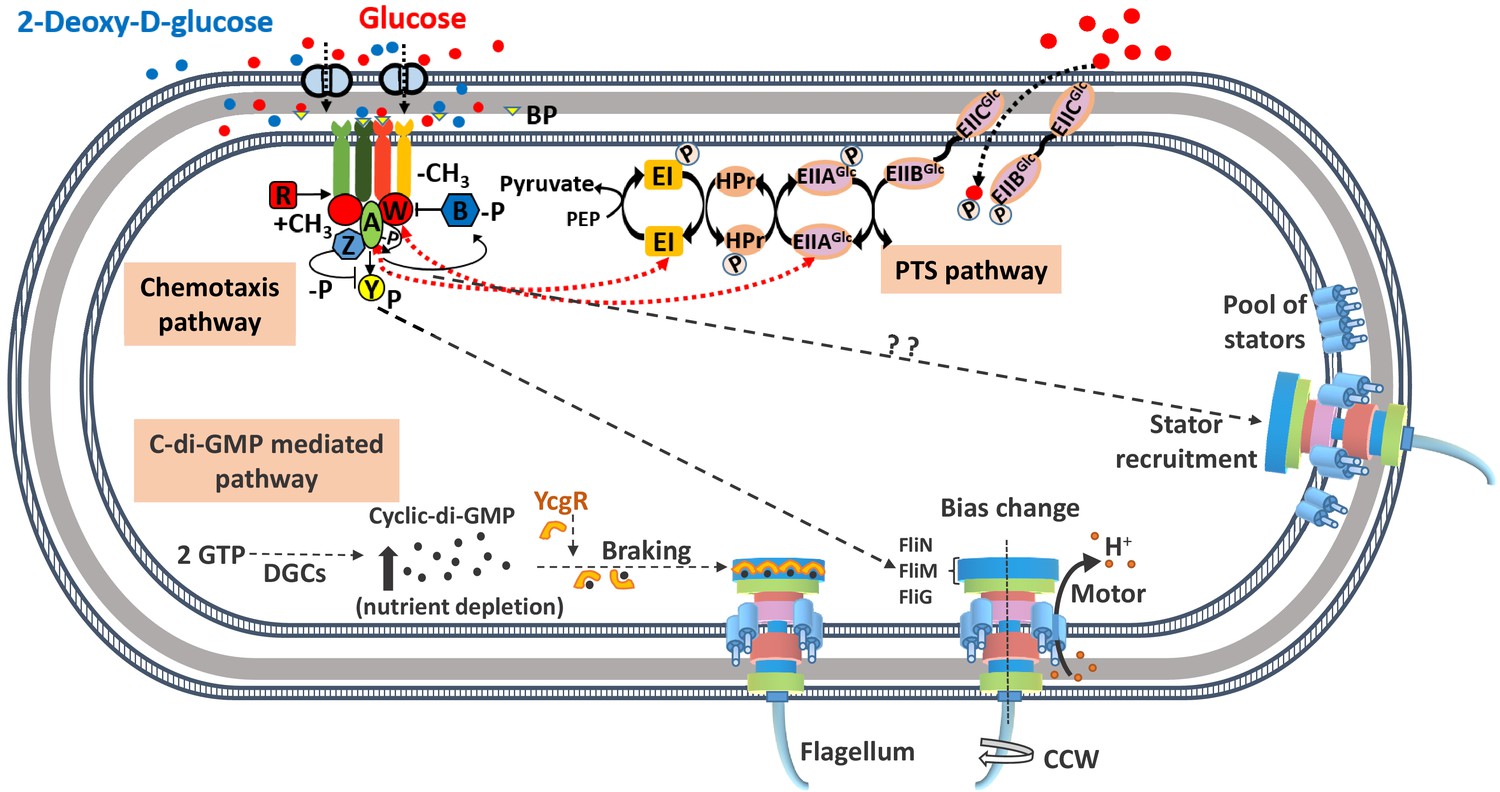
A schematic diagram of the known signaling pathways for control of locomotion in Escherichia coli.
The chemotaxis pathway controls the direction of motor rotation via CheY protein which, on phosphorylation, binds to the FliM protein of motor-switch complex (FliG, FliM, and FliN) and causes clockwise (CW) rotation of one or more flagella. The concentration of phosphorylated CheY (CheY-P) is dictated by the binding of ligands to their specific transmembrane receptors. Attractants such as glucose/2Dg bind to the periplasmic glucose-binding protein (BP) and are sensed by the Trg chemoreceptor protein. The binding results in a decrease in the autophosphorylation activity of CheA, which is part of CheA-CheW-receptor complex, leading to a lower concentration of CheY-P. The CheY-P binds to the FliM protein causing the motor to rotate in the CW direction. The proteins CheR and CheB control the degree of methylation of the receptors and allow the cell to adapt to the present concentration of attractant and sense subsequent changes. Additionally, glucose is a metabolizable ligand and is also sensed by an alternate pathway, namely, the phosphotransferase system (PTS), whose signals integrate into the chemotaxis pathway. The PTS generates a constant flow of phosphate groups via the PTS transporters (EI, HPr, and EII) from phosphoenolpyruvate (PEP) and activates the sensory complexes CheA-CheW thereby communicating with the motor via reduced levels of CheY-P. The CheZ protein accelerates the dephosphorylation of CheY-P. The motor rotation is generated via ion flow through the membrane-bound stator units comprising of proteins, MotA and MotB, while the speed is controlled via the intracellular concentration of the second messenger molecule, cyclic diguanosine monophosphate (c-di-GMP). The latter is produced by diguanylate cyclase (DGC) enzymes from GTP and degraded by specific phosphodiesterases. Nutrient depletion conditions trigger production of c-di-GMP, which forms complex with YcgR protein and hinders the motor rotation. The present study suggests a signaling pathway that links the chemotaxis receptor to the motor speed via stator unit recruitment.
Figure 2 with 2 supplements
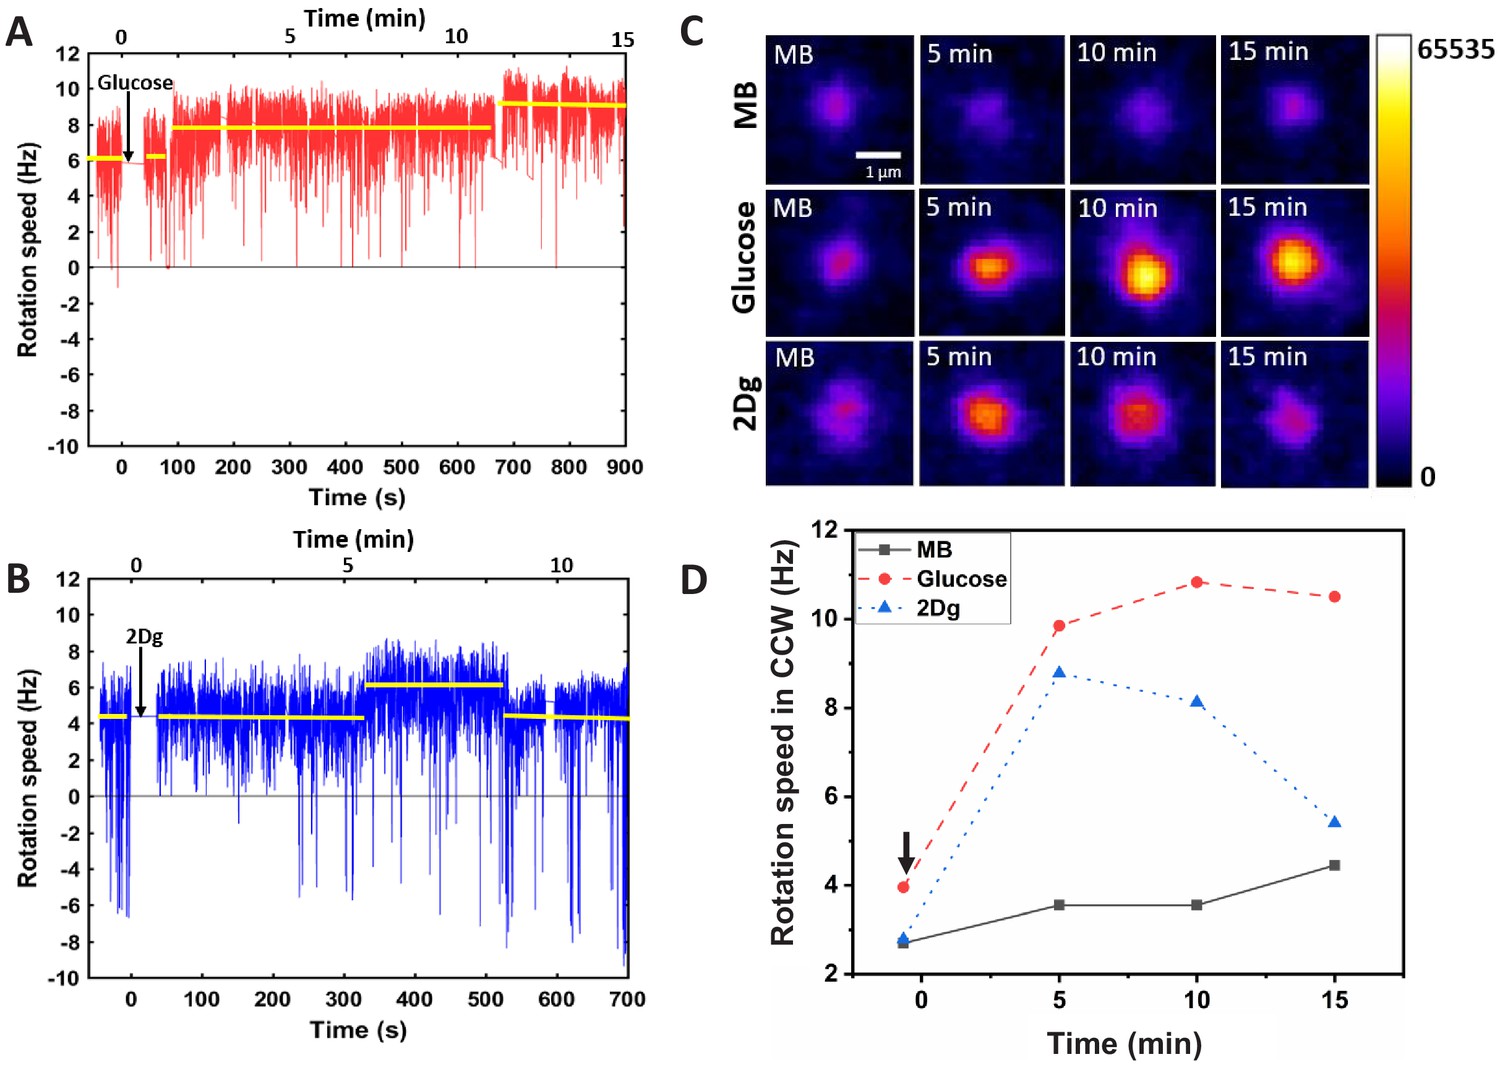
Effect of sensing and metabolism on stator unit recruitment and motor speed of a single motor.
The motor rotation speed was measured after a single wild-type (WT, RP437) cell was exposed (at ) to 1000 μM of (A) glucose and (B) 2Dg. The arrows indicate the time of introduction of the ligands. The reported values of rotational rate are averaged over 0.16 s (10 frames). Imaging is performed about 50 s after the introduction of the ligand to let the accompanying flow to stop. (C) The fluorescence intensity of the stator units (GFP-MotB in mutant strain JPA804) was measured at different time points after introduction of ligands, and (D) presents the corresponding motor rotation speeds (arrow indicates the time of introduction of ligand).
-
Figure 2—source data 1
Motor speed data for a single cell.
- https://cdn.elifesciences.org/articles/62848/elife-62848-fig2-data1-v2.xlsx
Figure 2—figure supplement 1
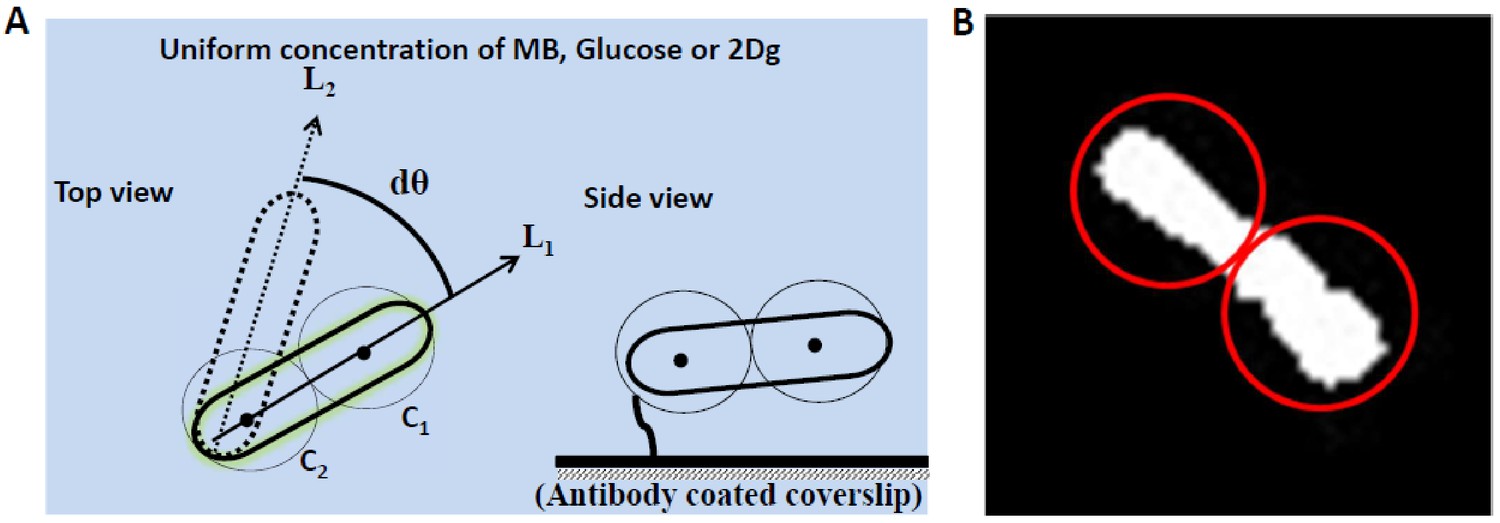
Illustration for motor speed calculation for a tethered cell.
(A) Illustration for motor speed calculation for a tethered cell (top and side view). Cells can be either tethered at the center or at the pole of the cell to an antibody-treated glass surface. In the acquired images, two circles are fitted along the length of the cell and their centers, C1 and C2, are tracked in each frame. The line joining the centers is tracked in time and is used to determine the rotation speed and the direction of rotation (between lines L1 and L2). (B) Top view of the cell fitted with two circles using Particle Tracker plugin for ImageJ software.
Figure 2—figure supplement 2
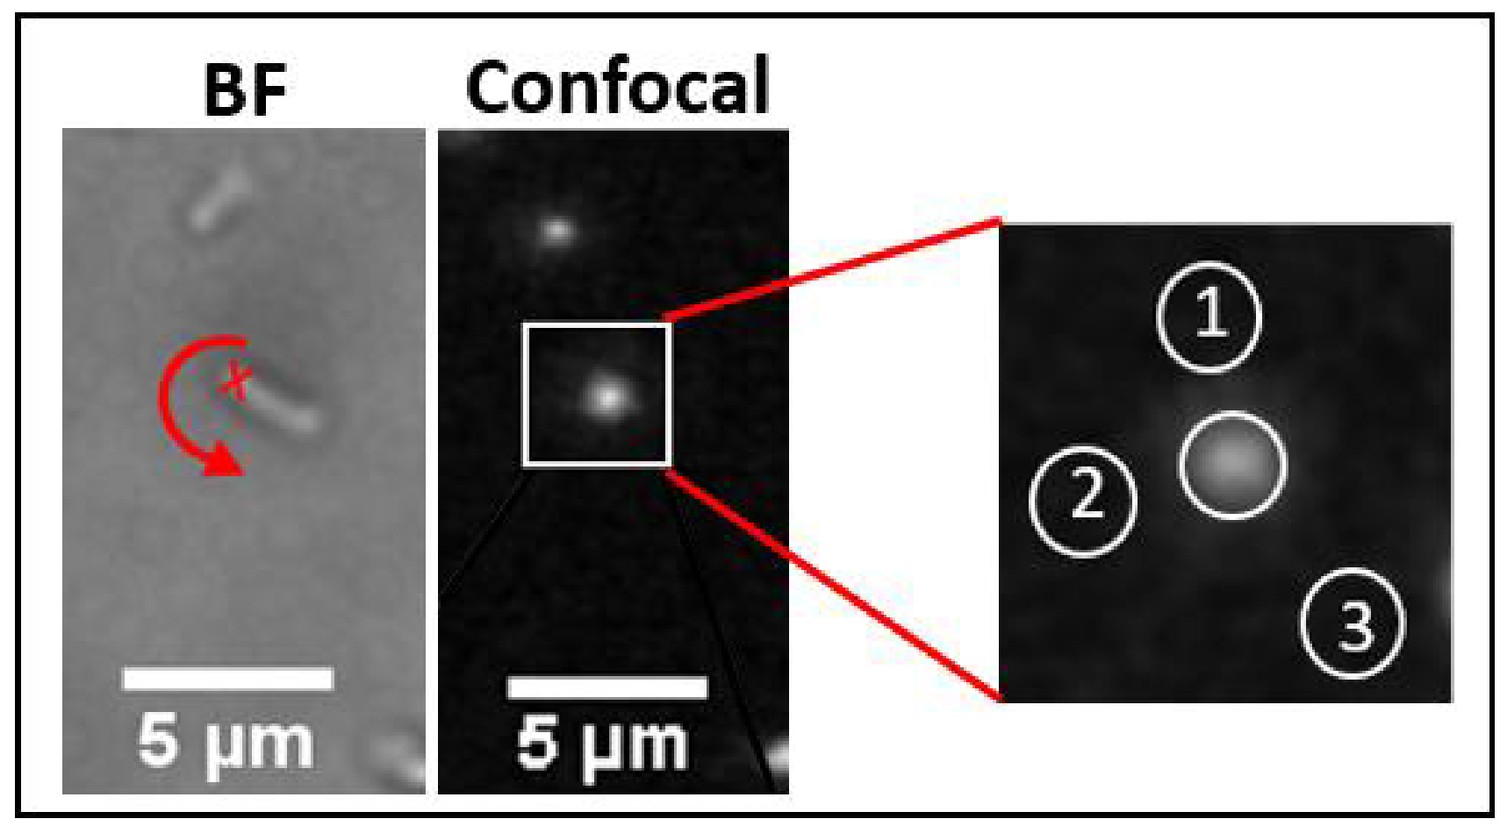
GFP-MotB intensity calculation using ImageJ.
The left panel corresponds to the brightfield image while the middle panel is the confocal image of the same location. The red cross indicates the location of the motor while the arrow indicates the direction of rotation. The fluorescence intensity of GFP-tagged MotB motor is obtained by noting the maximum intensity value in the motor region and then subtracting the average pixel intensity value from it. The latter was obtained from three, evenly spaced, neighboring circular patches around the cell, as shown in the enlarged image of the cell of interest (right panel). The average intensity value was independent of the exact location of the patches as long as they were evenly spaced.
Figure 3 with 7 supplements
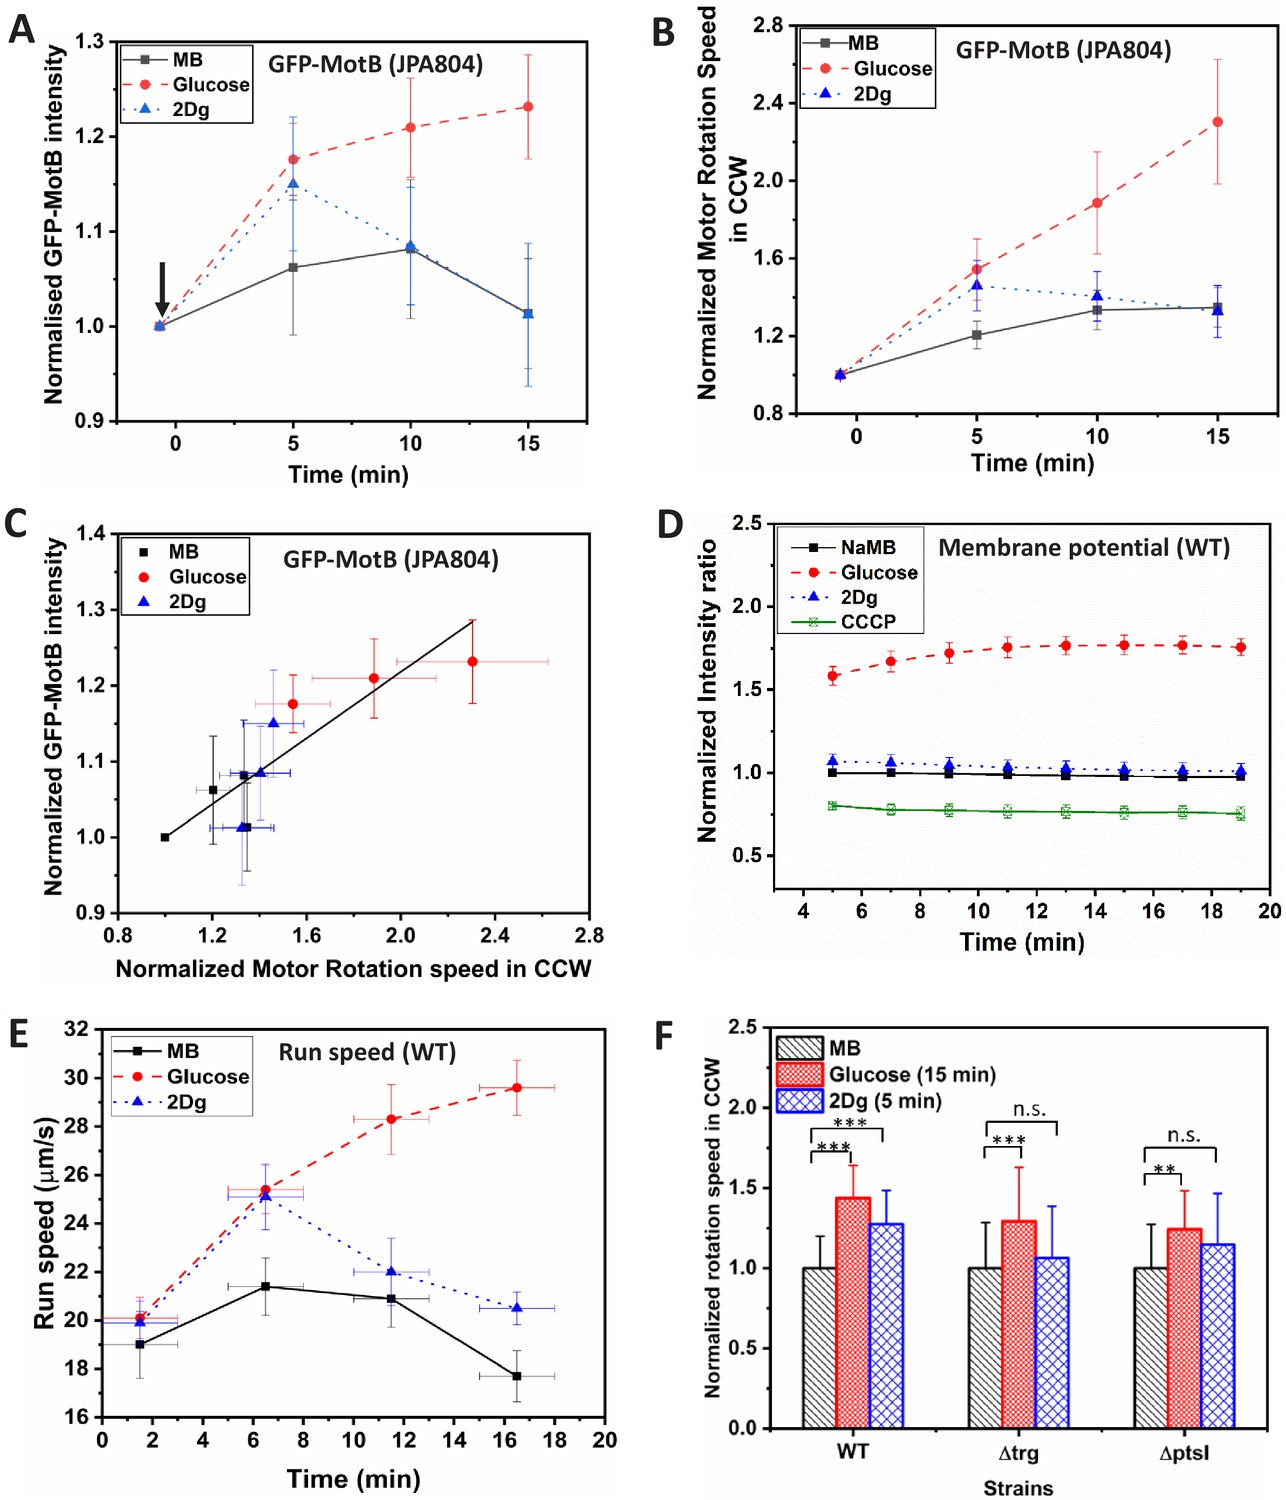
Effect of sensing and metabolism on stator unit recruitment, motor speed, membrane potential and swimming speed in a population of cells.
(A) Fluorescence (GFP-MotB) intensity variation in mutant strain JPA804 in 1000 μM glucose, 1000 μM 2Dg and motility buffer (MB). Measured intensity of individual cells was first obtained in MB and then measured again for the same cells exposed to 1000 μM of glucose and 1000 μM 2Dg (arrow indicates the point of introduction of ligand). Increase in GFP intensity in glucose at all time points and in 2Dg at 5 min is statistically significant at p<0.01 computed by paired t-test. The error bars represent standard error of means from six independent experiments. The intensity of about 21–22 motors per ligand were measured. (B) The normalized average motor speed in counterclockwise (CCW) bias obtained from the tethered cell experiments presented in (A). (C) Motor intensity versus motor speed from data plotted in (A) and (B). The straight line is a linear fit with an value of 0.91 (D) Time-dependent fluorescence intensity for membrane potential of wild type (WT) in the presence of 1000 μM of glucose, 2Dg, and sodium MB for a population (3.75×10⁸ cells/ml). The error bars represent standard error of means from three independent experiments. Values are significant at p<0.001 (one-way ANOVA). (E) Measured run speed between consecutive tumbles for a population of WT cells in the presence of MB and when exposed to ligands. Each data point is obtained by averaging over 2500 cells. Speed increase in glucose for all three strains and the observed increase in 2Dg for the WT strain (at 5 min) as compared to MB are statistically significant at p<0.001 (one-way ANOVA). The Y-error bars represent standard error of means from four independent experiments. (F) Comparison of motor speed in CCW bias for the WT cell in the presence of ligands with those measured for mutant strains, and at fixed time points. Data represents value from at least 20 paired cells for each strain. Here, *** represents significance value p<0.001 and ** represents p<0.01 as measured by paired t-test. Error bars represent standard deviation. The highest speed for 2Dg was observed at 5 min.
-
Figure 3—source data 1
GFP-MotB intensity, membrane potential, and swimming speed data for wild-type (WT) cells.
- https://cdn.elifesciences.org/articles/62848/elife-62848-fig3-data1-v2.xlsx
Figure 3—figure supplement 1
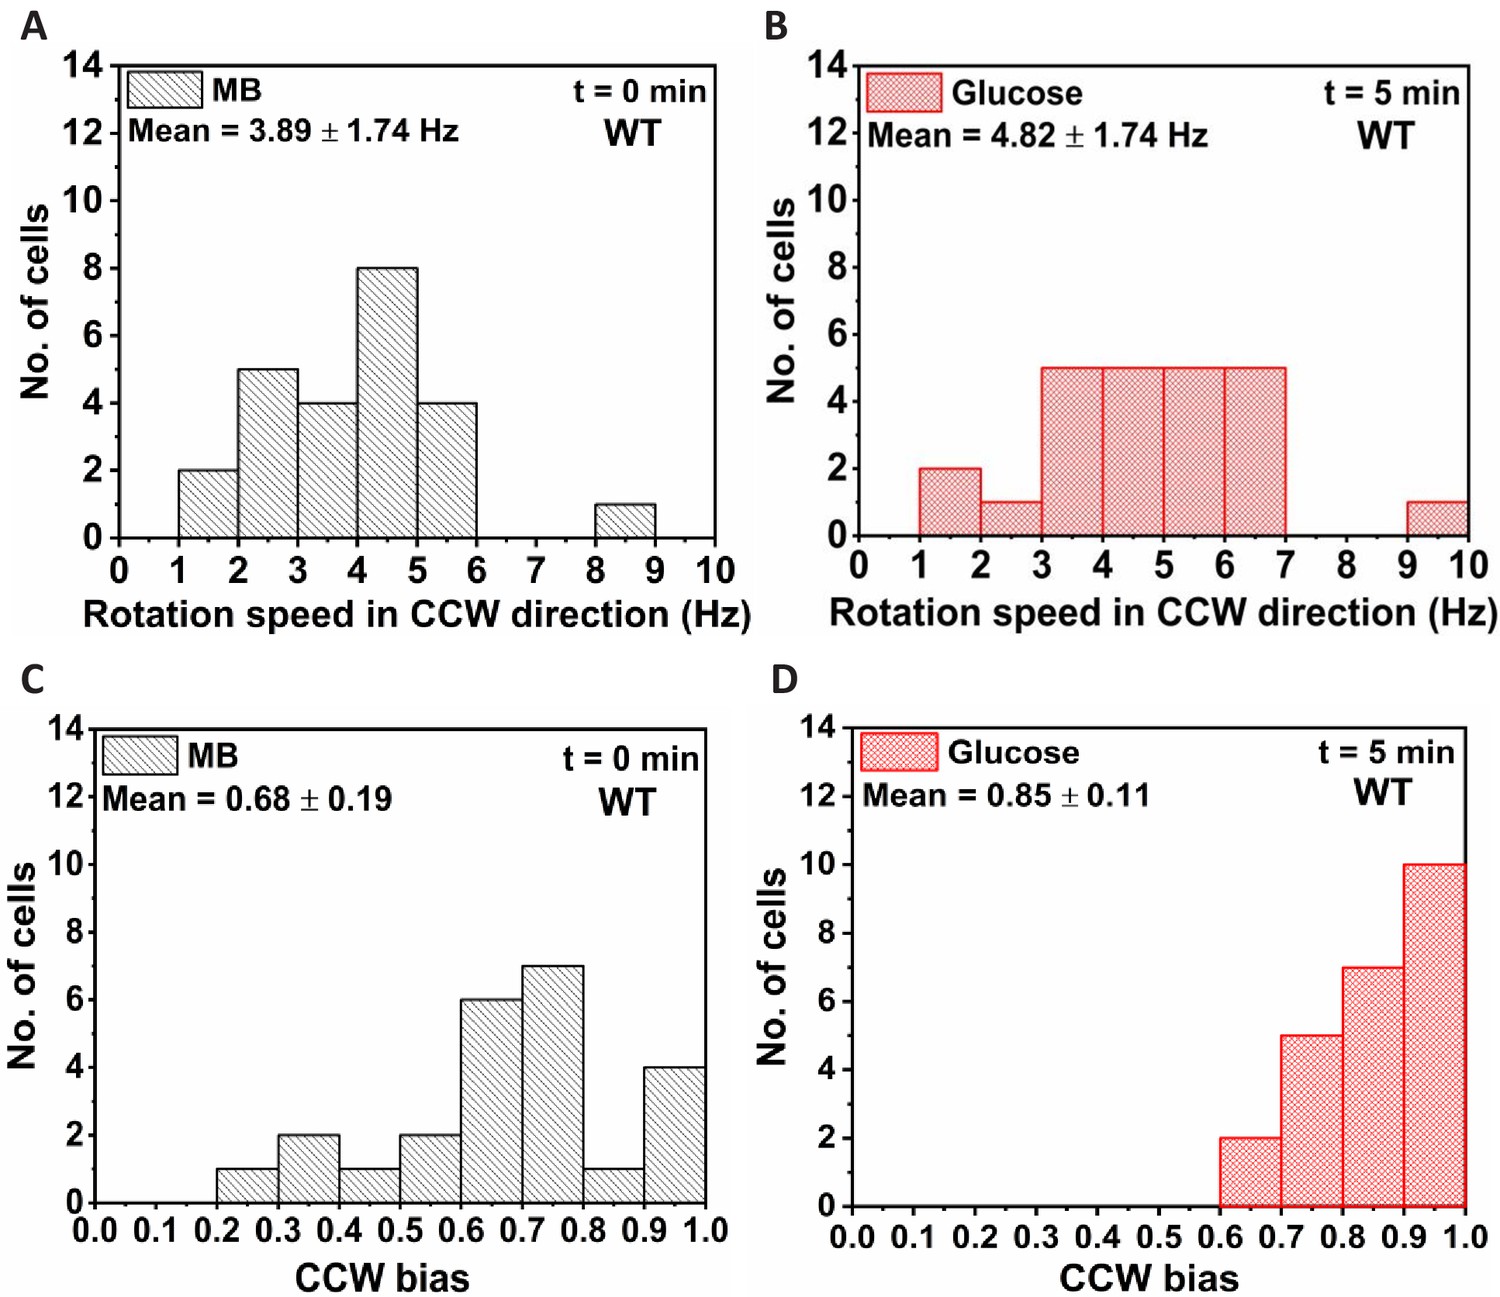
Response of wild type (WT) after 5 min of exposure to 1000 μM of glucose.
Rotation frequency of 24 cells in (A) motility buffer (MB) and (B) when exposed to 1000 μM glucose. The corresponding counterclockwise (CCW) directional bias is given in (C) and (D). The mean and standard deviation are obtained from four independent experiments. All values are significantly different from MB at p<0.001 computed by paired t-test.
Figure 3—figure supplement 2
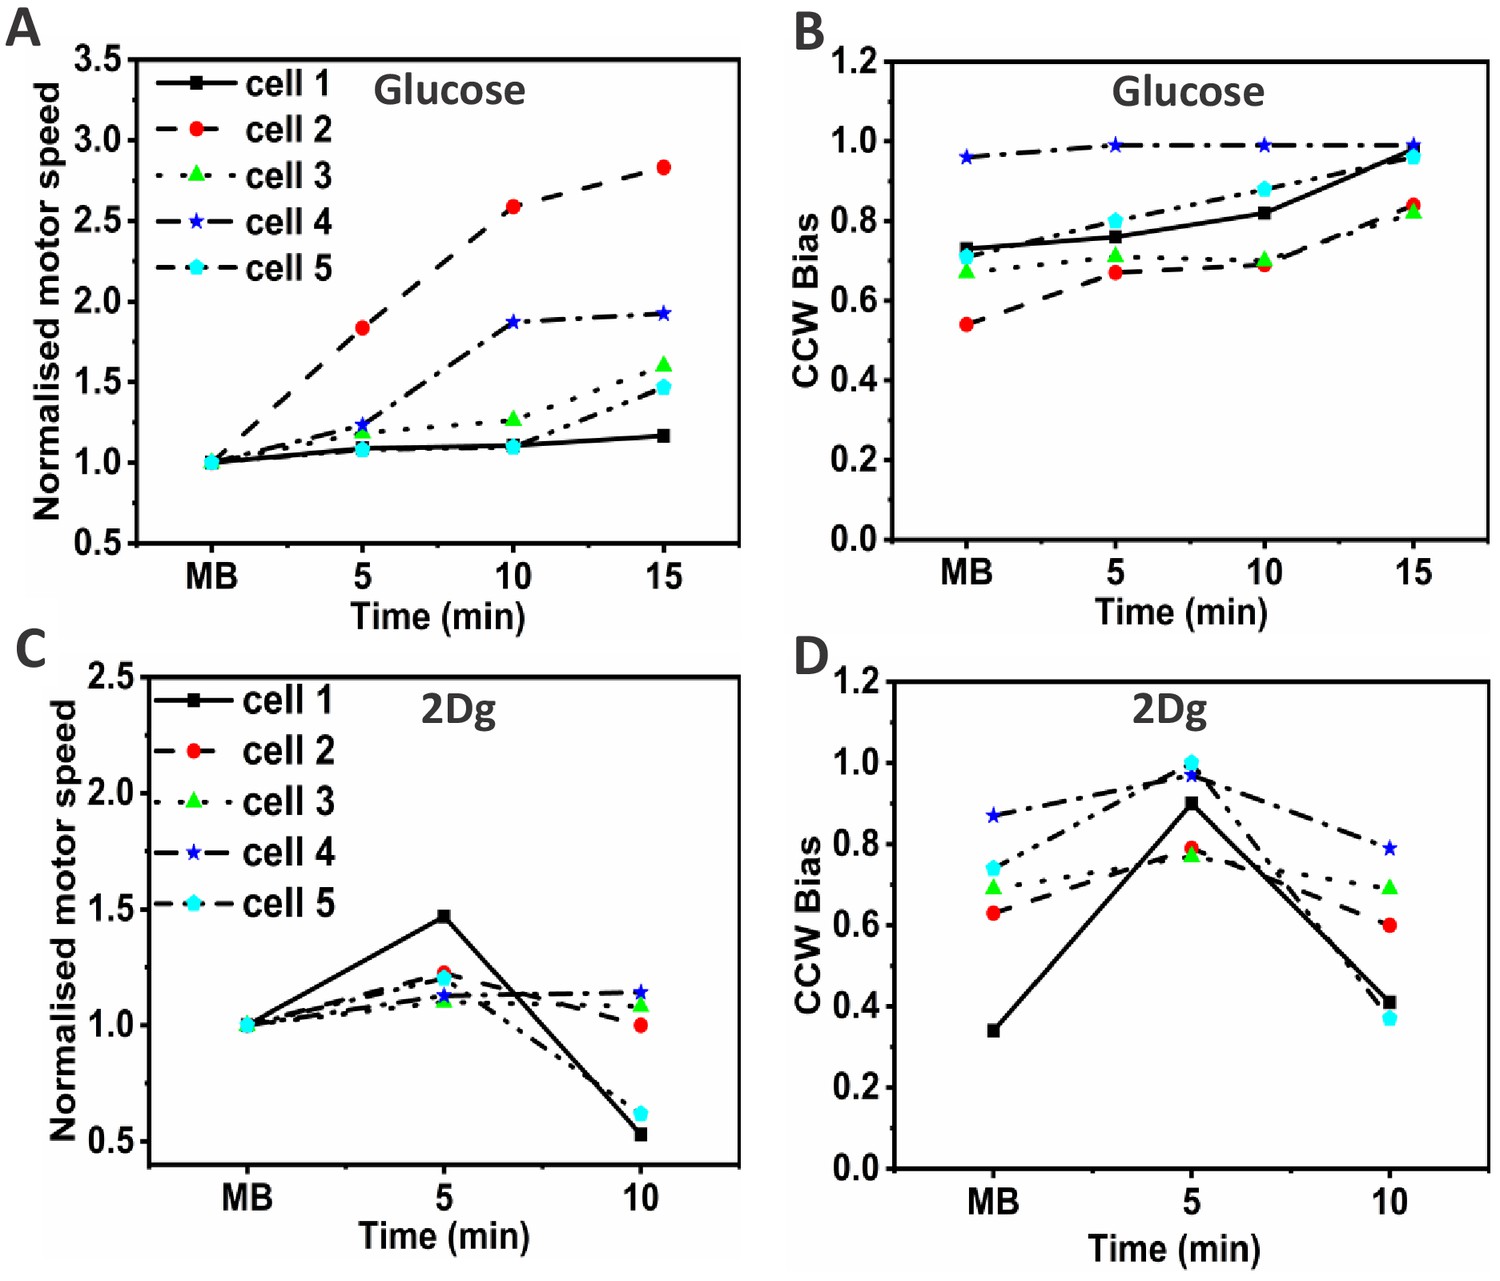
Rotation speed normalized with respect to the pre-stimulus value and the counterclockwise (CCW) bias of wild type (WT) at discrete time points in the presence of (A,B) 1000 μM glucose and (C,D) 1000 μM 2Dg.
Figure 3—figure supplement 3
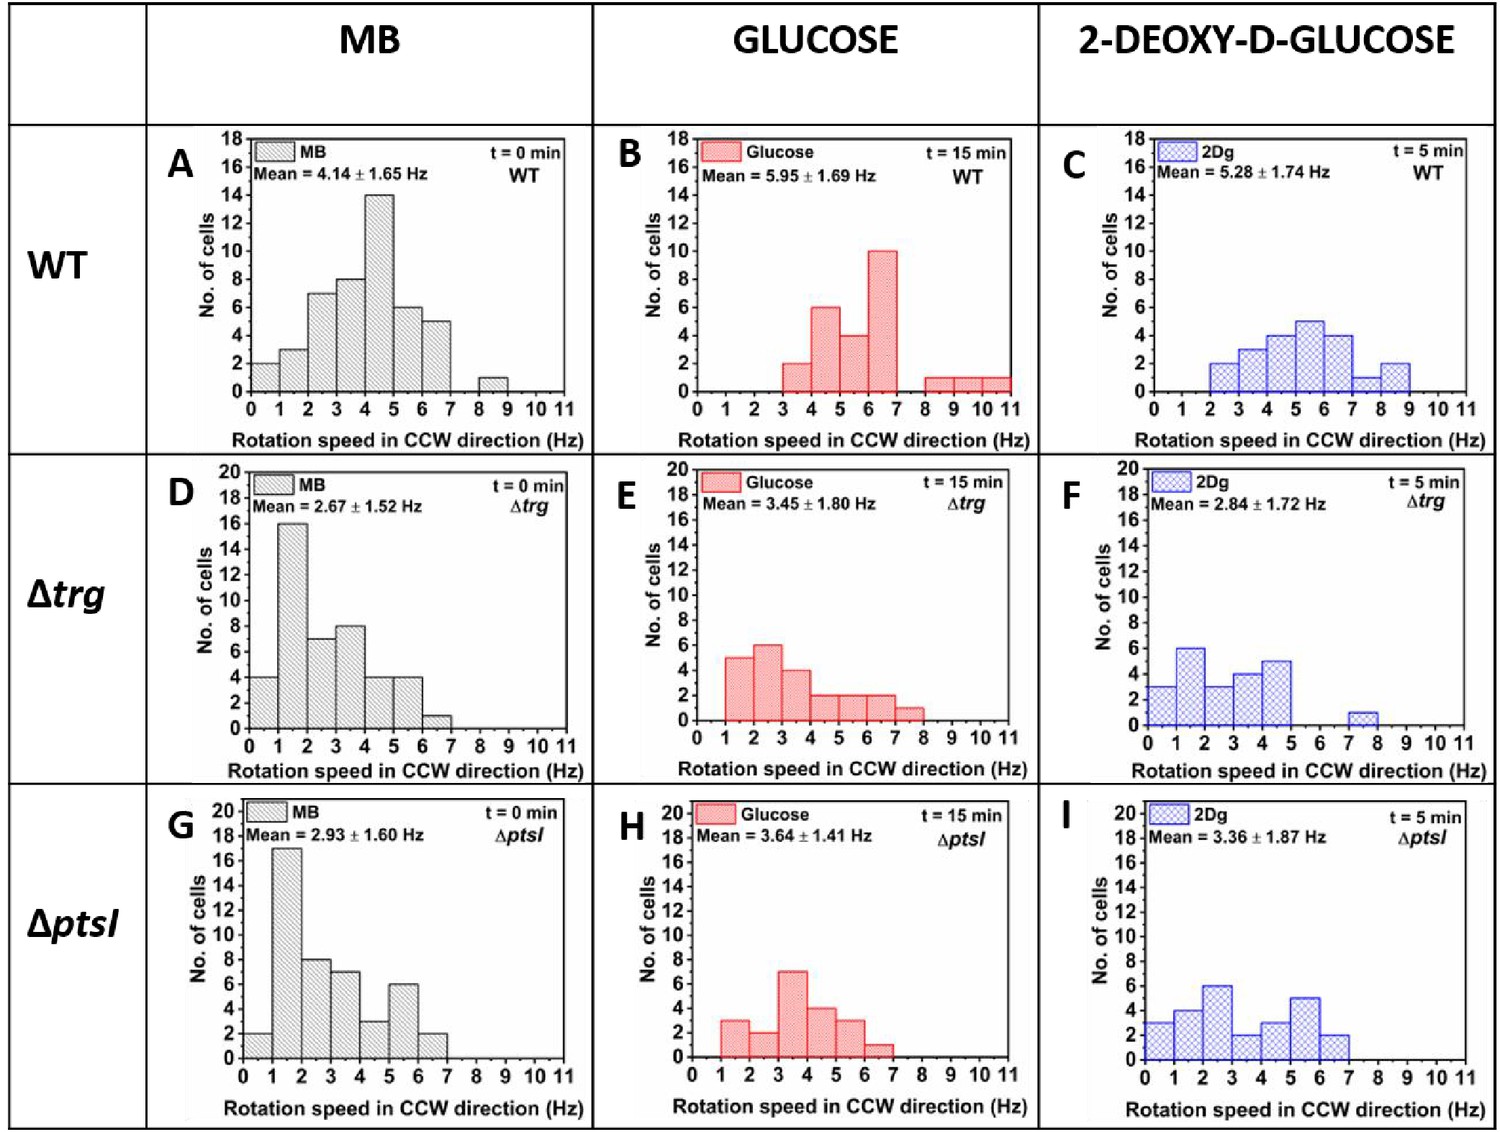
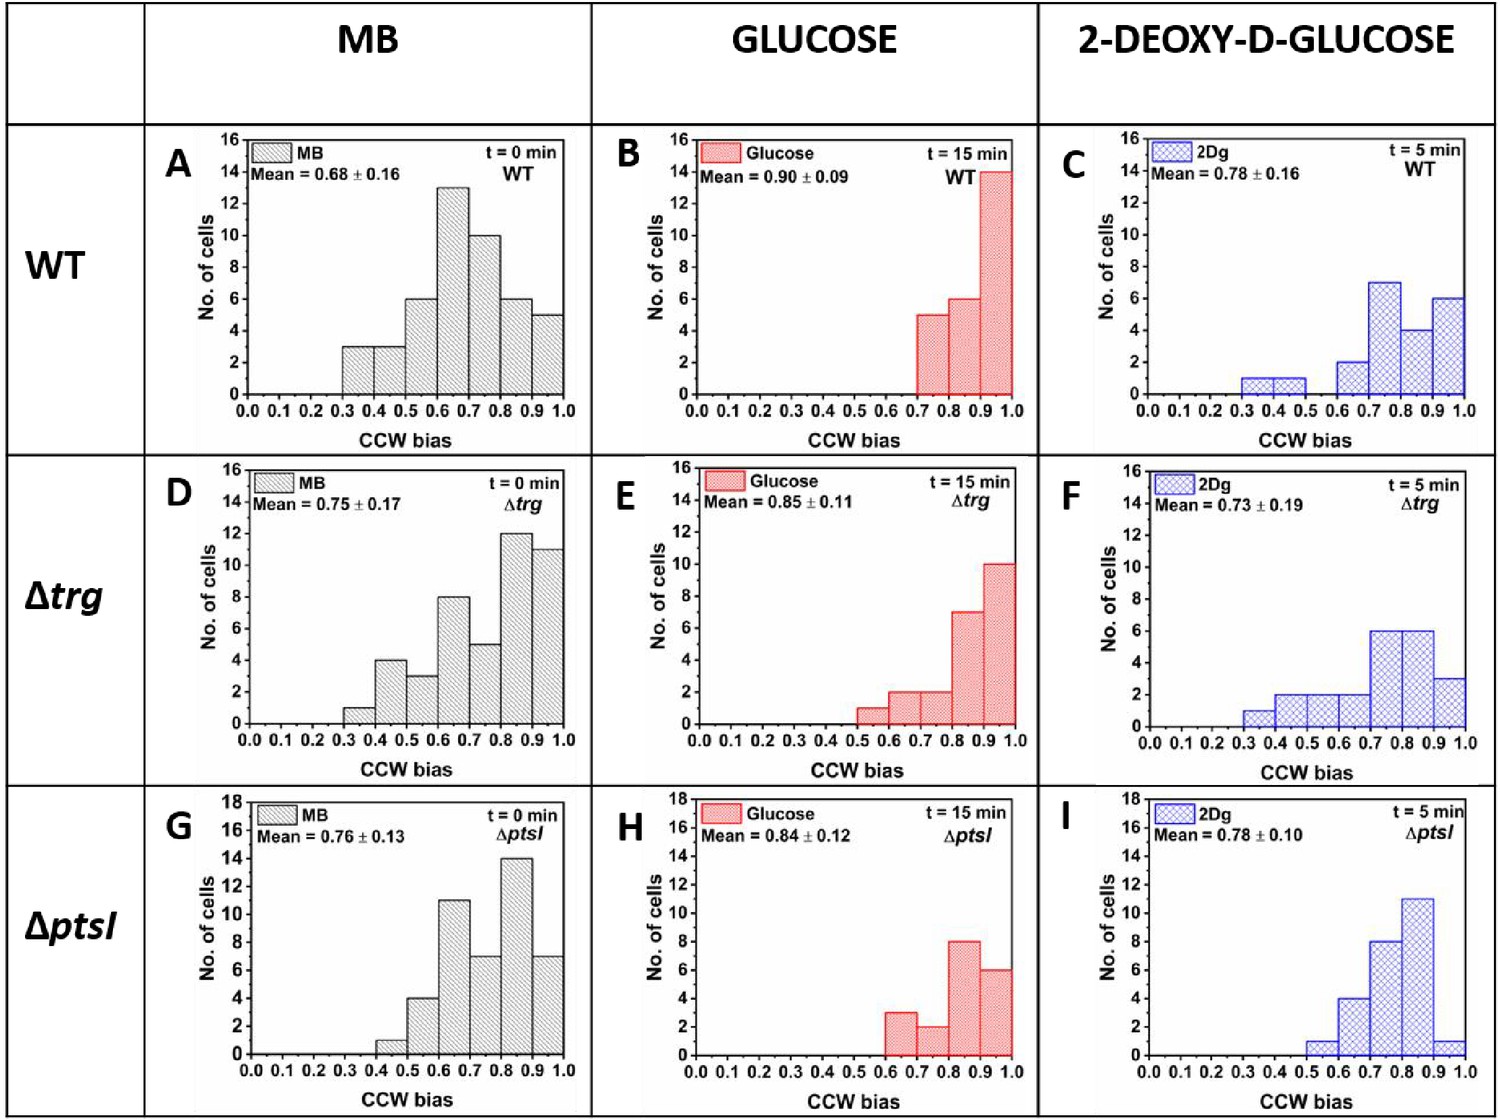
Rotation speed in counterclockwise (CCW) direction for wild-type (WT), , and cells.
Tethered cell experiment with the (A–C) WT, (D–F) , and (G–I) . Measured rotation speed of individual cells were first obtained in motility buffer (MB) and then measured again for the same cells exposed to 1000 μM of glucose and 2Dg. At least 20 such paired cells from four independent experiments were analyzed to determine the population behavior. The data for MB is obtained by combining the measurements from the pre-stimulus state of both glucose and 2Dg experiments. Values for glucose and 2Dg are obtained after 15 and 5 min of exposure, respectively. The mean and standard deviation are included in the figure. All values are significantly different from MB at p<0.05 computed by paired t-test except the bias and motor speed change from MB to 2Dg for strain, which was statistically insignificant.
Figure 3—figure supplement 4
Counterclockwise (CCW) bias for the wild-type (WT), , and cells measured in motility buffer (MB), and 1000 μM of glucose and 2Dg.
At least 20 such paired cells from four independent experiments were analyzed to determine the population behavior. The data for MB is obtained by combining the measurements from the pre-stimulus state of both glucose and 2Dg experiments. Values for glucose and 2Dg are obtained after 15 and 5 min of exposure, respectively. The mean and standard deviation are included in the figure. All values are significantly different from MB at p<0.05 computed by paired t-test except the change in bias from MB to 2Dg, which was statically insignificant.
Figure 3—figure supplement 5
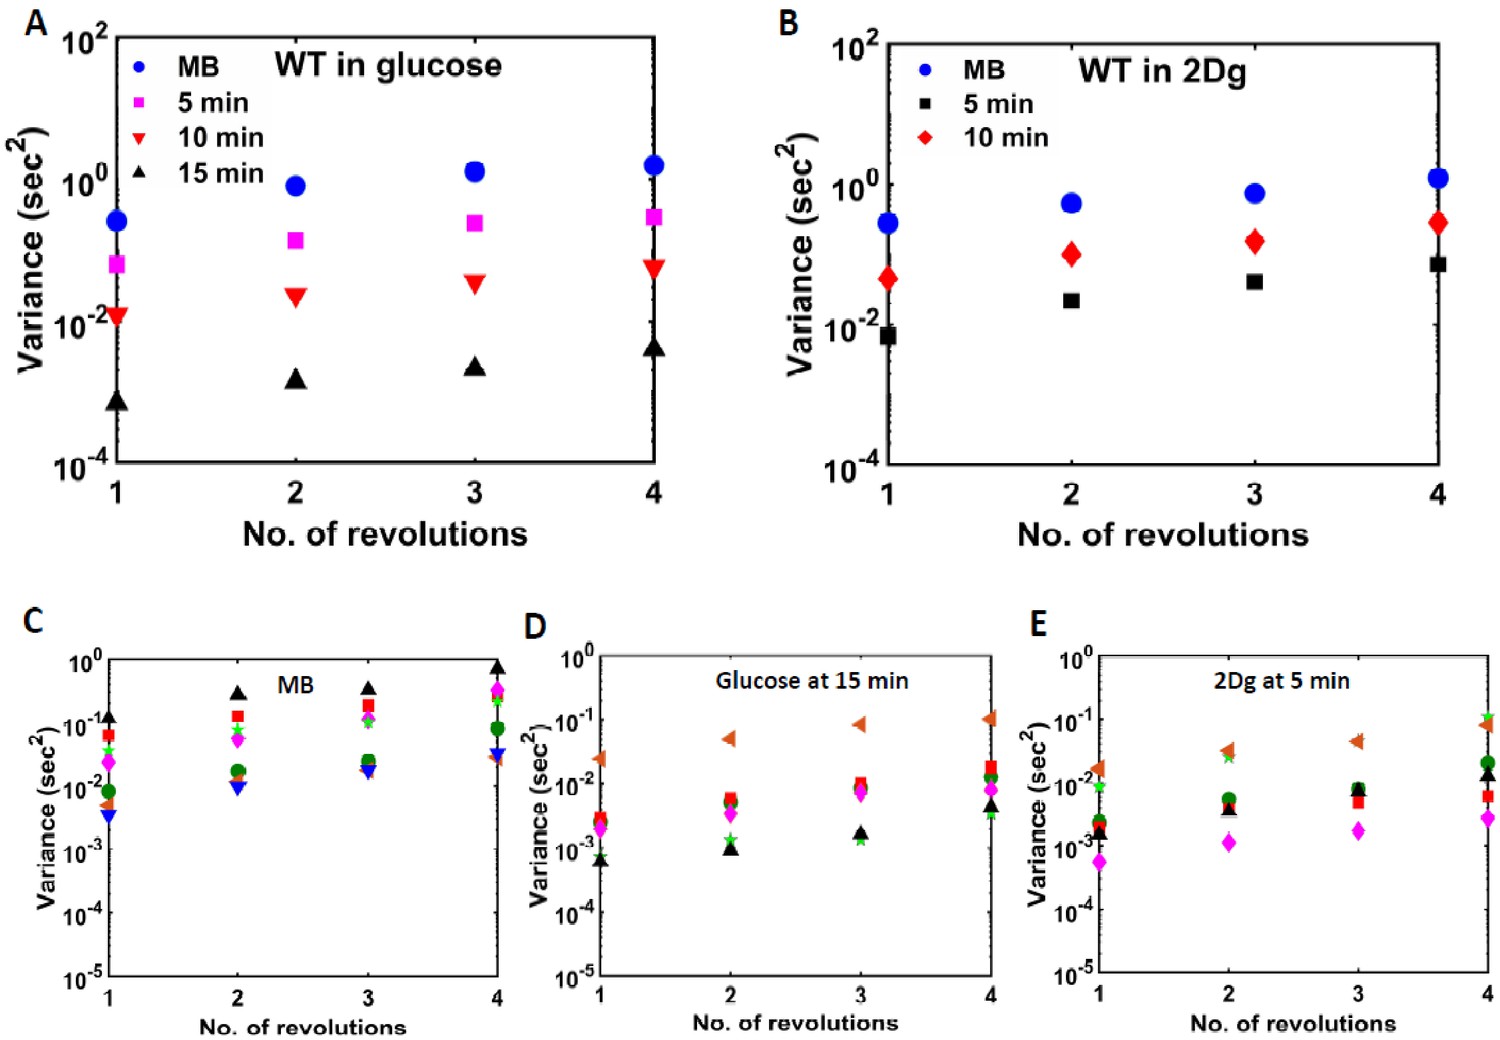
Variance of rotation rate for different number of revolutions determined at different times after exposing a single wild-type (WT) cell to 1000 μM of (A) glucose and (B) 2Dg.
As compared to (C) motility buffer (MB) (seven cells), the variance decreased on introduction of (D) glucose (after 15 min) (six cells) and (E) 2Dg (5 min) (six cells).
Figure 3—figure supplement 6
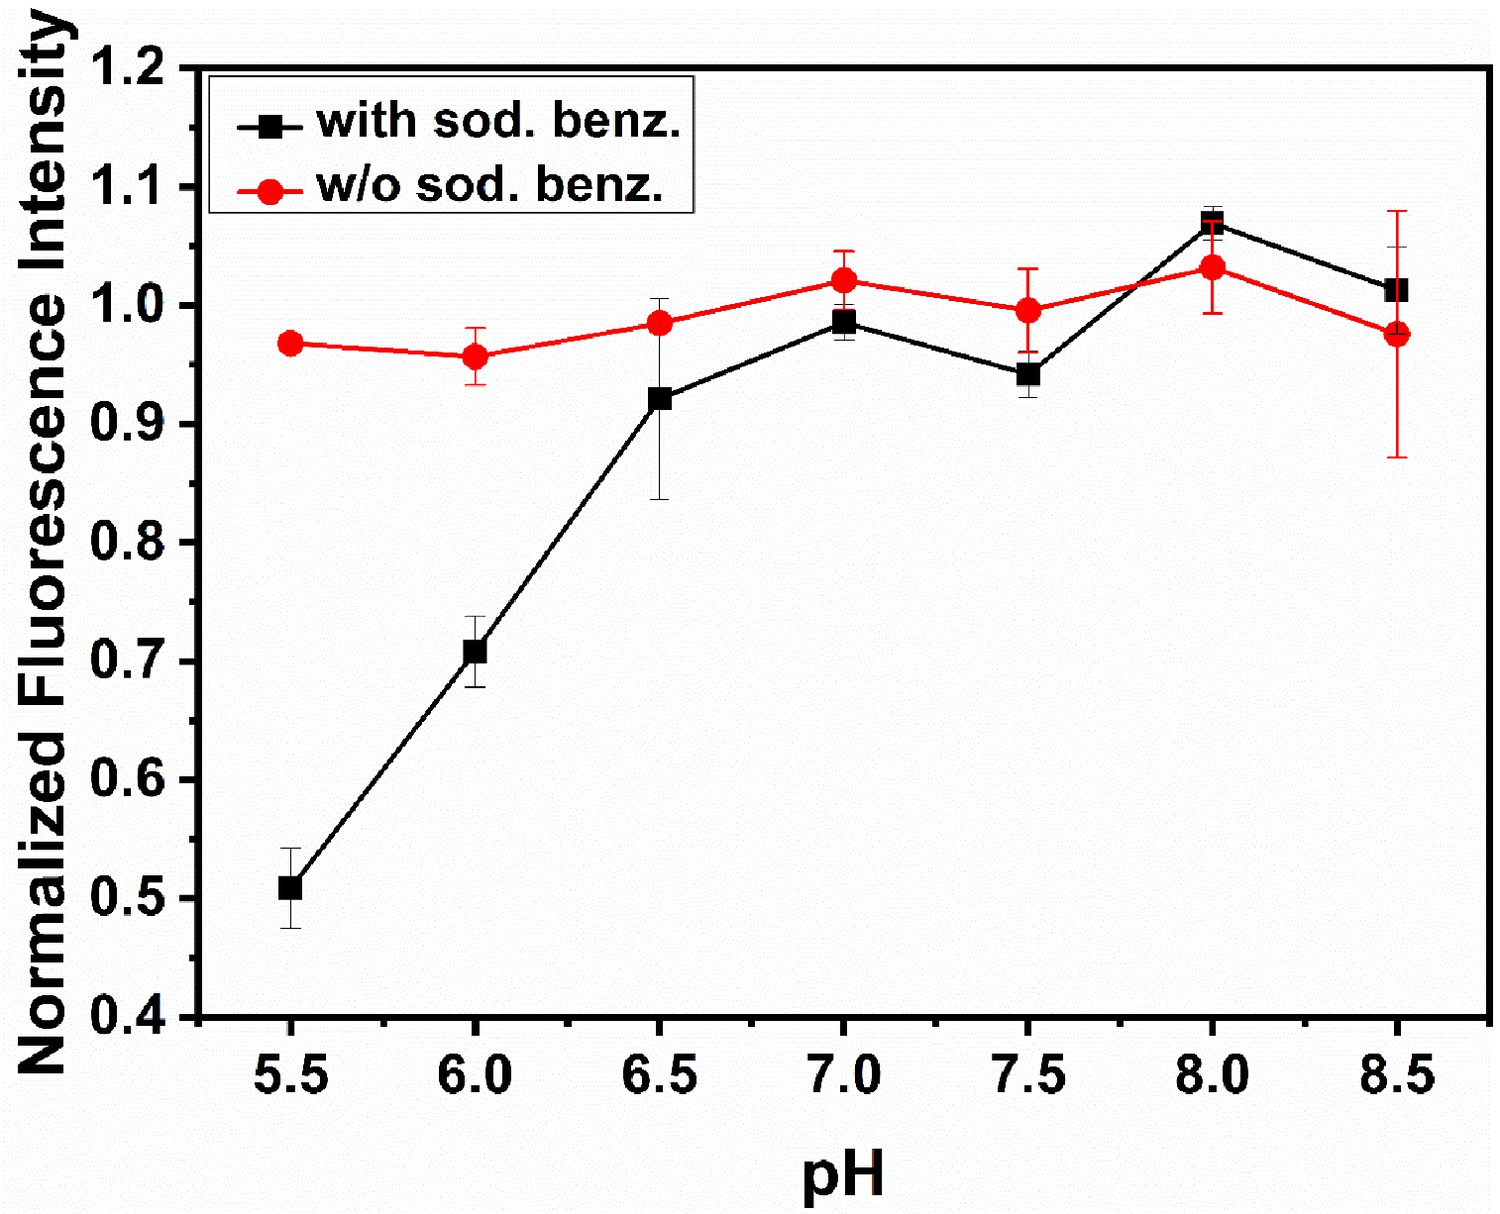
RP437 cells exhibiting pH homeostasis.
Response of RP437 cells to motility buffers with different pH values when exposed to sodium benzoate. Cells exhibit homeostasis when suspended in different pH buffers in the absence of sodium benzoate. Each data point corresponds to cells at OD 0.3. The error bars represent standard error of means from three independent experiments.
Figure 3—figure supplement 7
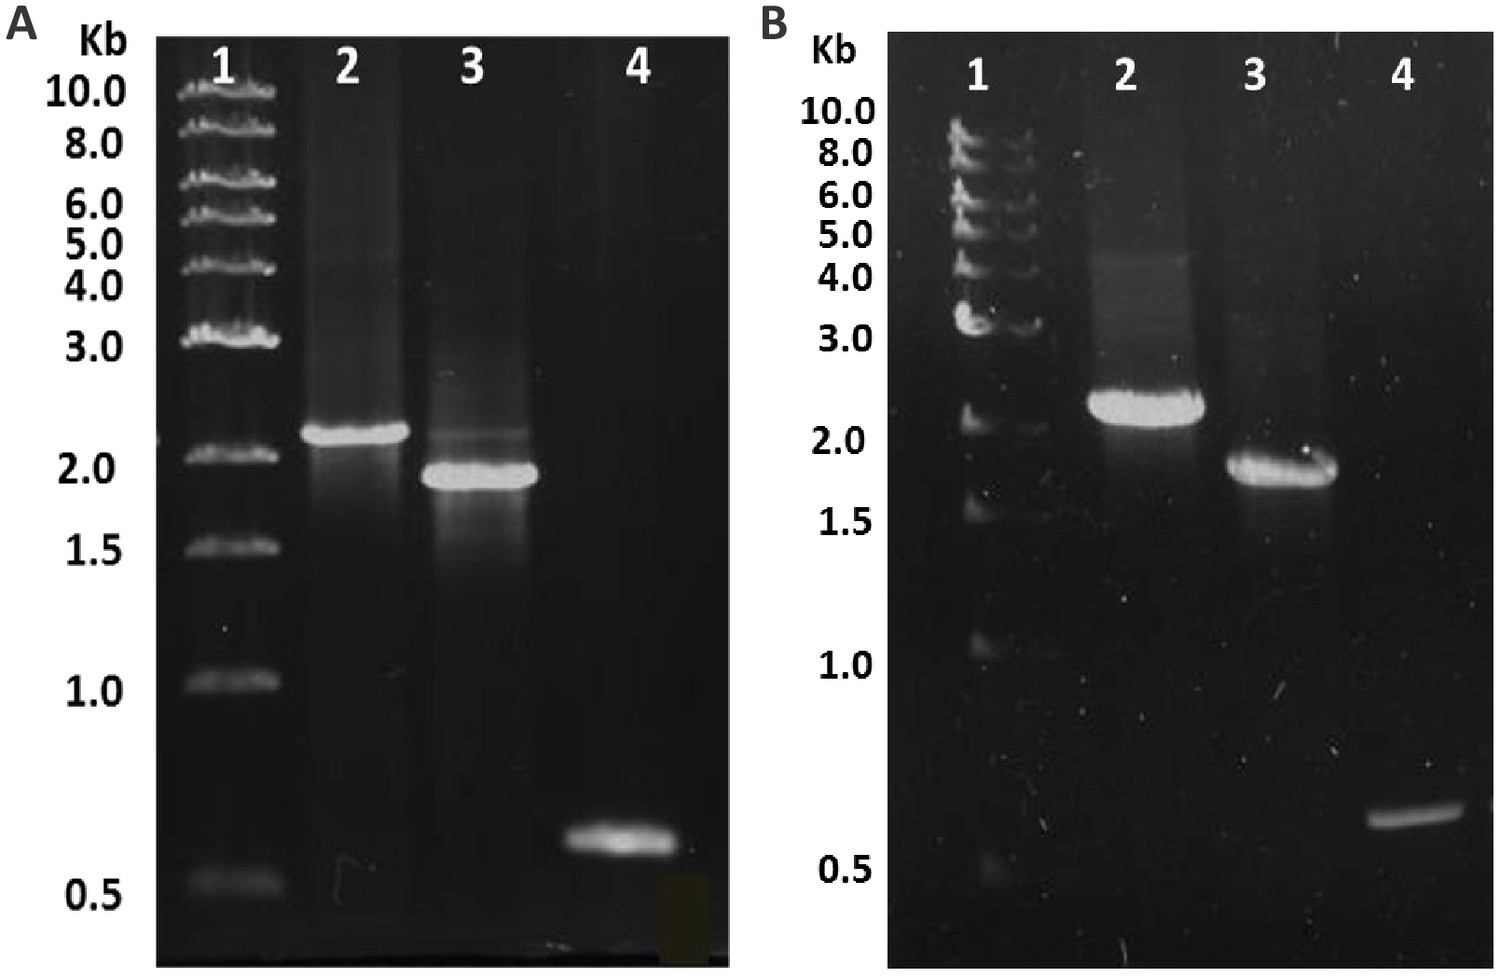
Agarose gel for PCR product verification.
Agarose gel (0.8%) showing the result of PCR with verification primers. (A) Mutation of trg gene in Escherichia coli, Lane 1, Marker; Lane 2, RP437 wild-type (WT) with trg gene (2.1 kb); Lane 3, ::kan (1.9 kb); Lane 4, (600 bp). (B) Mutation of ptsI gene in E. coli, Lane 1, Marker; Lane 2, WT with ptsI gene (2.2 kb); Lane 3, ::kan (1.9 kb); Lane 4, (600 bp).
Figure 4
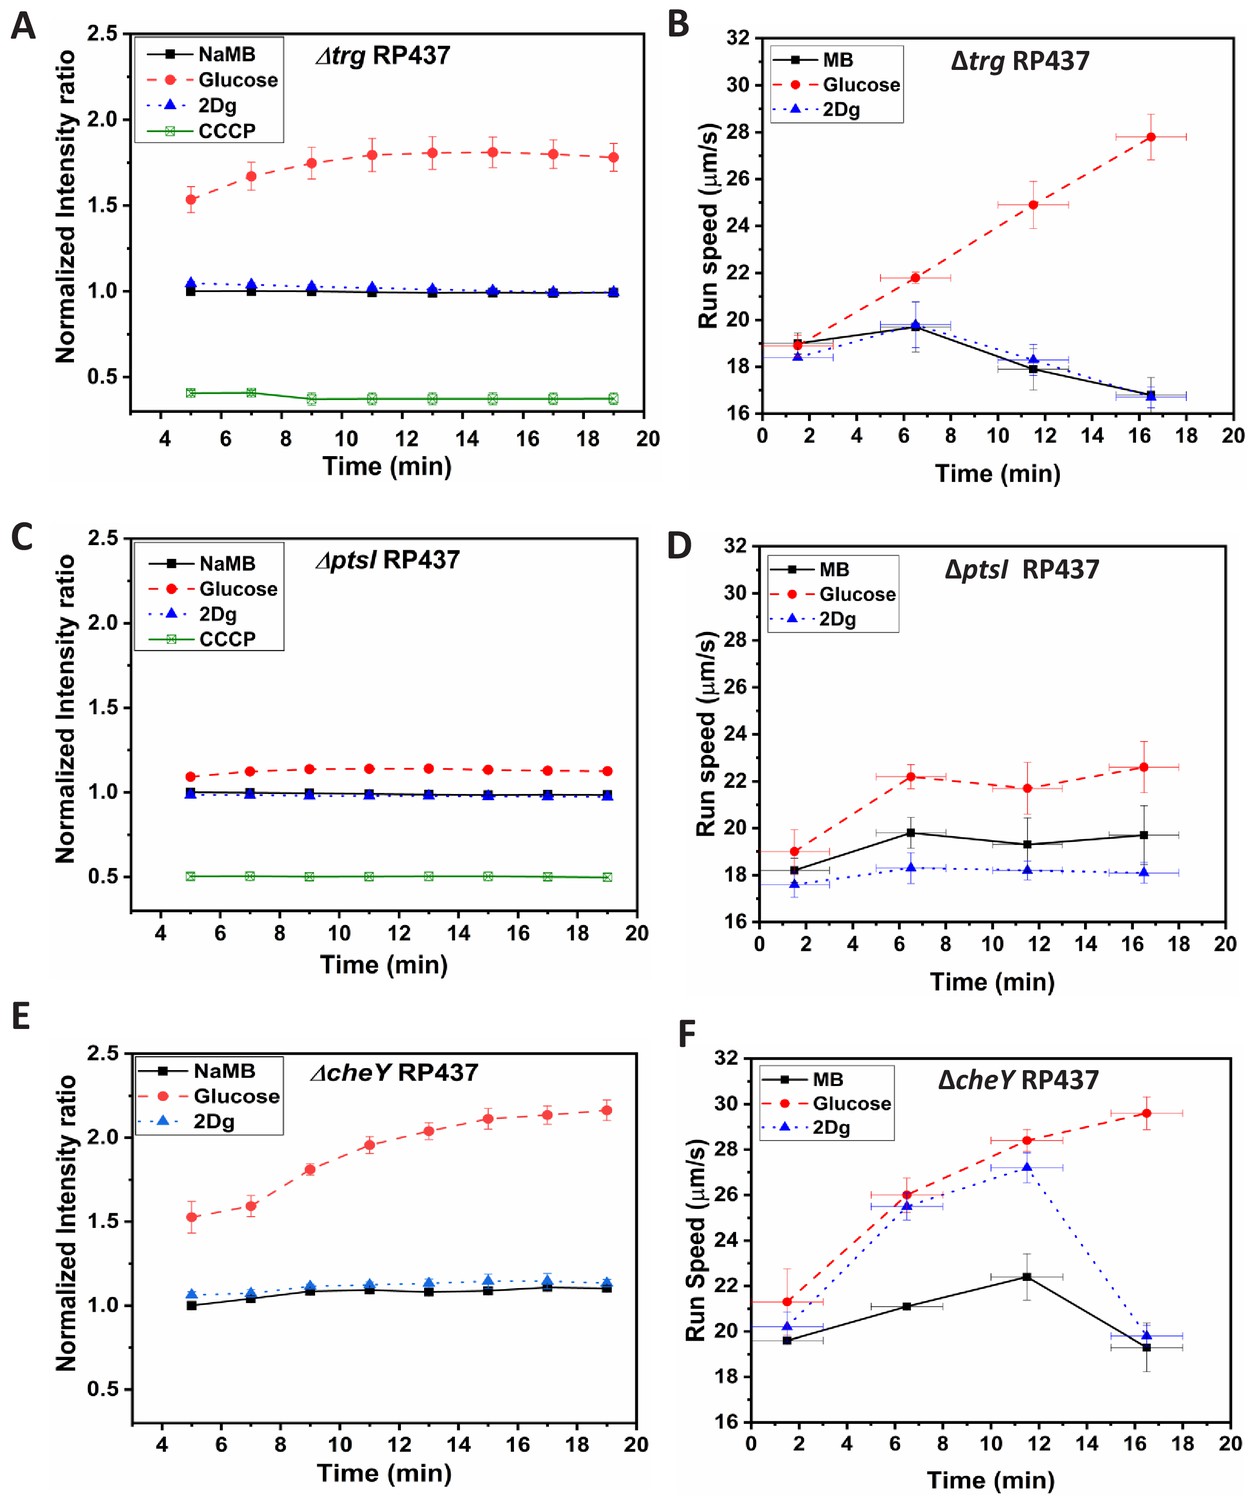
Time-dependent fluorescence intensity for membrane potential and time-dependent run speed variation for mutant strains, (A,B) RP437, (C,D) RP437, and (E,F) RP437 in the presence of MB, and 1000 μM of glucose and 2Dg.
Final concentration of cells for membrane potential measurement was cells/ml and the values for glucose compared to that for MB are significant at p<0.001 (one-way ANOVA). Each data point in the run speed plot is obtained by averaging over 2500 cells. Speed increase in glucose for all three strains and the observed increase in 2Dg for the wild-type (WT) strain and CheY mutant (at 5 min) as compared to motility buffer (MB) are statistically significant at p<0.001 (one-way ANOVA). The Y-error bars represent standard error of means from four independent experiments, while the X-error bars represent the duration of 3 min over which the measurements were made for each data point.
-
Figure 4—source data 1
Membrane potential and swimming speed data for different mutants.
- https://cdn.elifesciences.org/articles/62848/elife-62848-fig4-data1-v2.xlsx
Figure 5
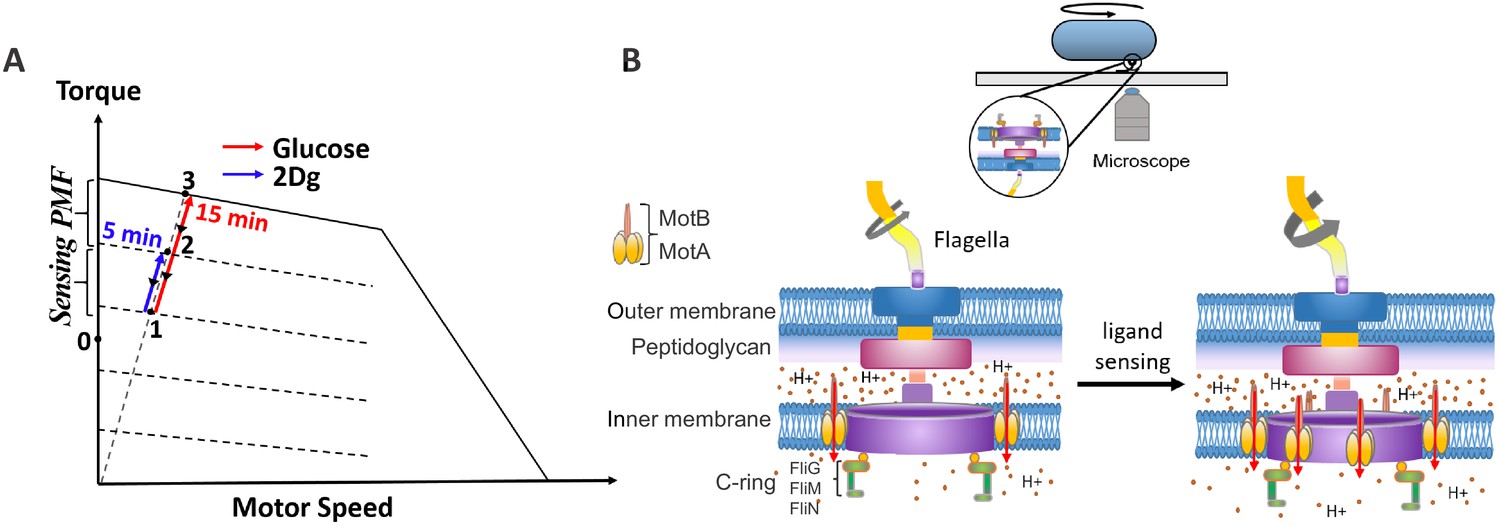
Schematic diagram on the effect of sensing and metabolism on the state of the flagellar motor.
(A) A representative plot of steady-state torque-speed curves for counterclockwise (CCW) rotation of the bacterial flagellar motor at varying loads along with the expected state of the motor along the load line at high load when the cell is exposed to 2Dg and glucose. (B) A schematic of the bacterial motor along with a cell tethered to a glass coverslip is included to the right. Motor speed increases as a result of stator unit recruitment upon ligand sensing.
Tables
Table 1
Escherichia coli strains used in this study.
| Strain | Relevant genotype | Parent strain | Comments, references |
|---|---|---|---|
| RP437 | Wild type, Parkinson, 1978 | ||
| RP5232 | RP437 | Parkinson, 1978 | |
| JPA804 | GFP MotB FliC-sticky | RP437 | Leake et al., 2006 |
| MTKV01 | ::Frt | RP437 | This study |
| MTKV04 | ::Frt | RP437 | This study |
Table 2
Oligonucleotides used as primers for gene knockout.
| Designation | 5’– 3’ Sequence | Function |
|---|---|---|
| PtsI- F1 | TAATTTCCCGGGTTCTTTTAAAAATCAGTCACAAGTAAGGTAGGGTTATG ATTCCGGGGATCCGTCGACC | ptsI deletion |
| PtsI-R2 | AAGCAGTAAATTGGGCCGCATCTCGTGGATTAGCAGATTGTTTTTTCTTC TGTAGGCTGGAGCTGCTTCG | |
| Trg-F1 | GCCGATGACTTTCTATCAGGAGTAAACCTGGACGAGAGACAACGGTAATGATTCCGGGGATCCGTCGACC | trg deletion |
| Trg-R2 | GGGATCTGTCGATCCCTCCTTGAACATTTTCACACCGTAGCGAAACTAACTGTAGGCTGGAGCTGCTTCG | |
| PtsI- VF1 | CTGCTGCCCAGTTTGTAAAA | Confirming ptsI deletion |
| PtsI- VR2 | TTTACCAATGGTGCCGTCTA | |
| Trg-VF1 | AGGCATCCTATGAGGTTTCCT | Confirming trg deletion |
| Trg-VR2 | CTATCTCGTCAACTTACGGTTGAAT |
Additional files
Download links
A two-part list of links to download the article, or parts of the article, in various formats.
Downloads (link to download the article as PDF)
Open citations (links to open the citations from this article in various online reference manager services)
Cite this article (links to download the citations from this article in formats compatible with various reference manager tools)
Ligand sensing enhances bacterial flagellar motor output via stator recruitment
eLife 10:e62848.
https://doi.org/10.7554/eLife.62848


