ATP activation of peritubular cells drives testicular sperm transport
- Department of Chemosensation, Institute for Biology II, RWTH Aachen University, Germany
- Research Training Group 2416 MultiSenses – MultiScales, RWTH Aachen University, Germany
- Institute of Imaging and Computer Vision, RWTH Aachen University, Germany
- Department of Cognitive Neurobiology, Tokyo Medical and Dental University, Japan
- Biomedical Center Munich (BMC), Cell Biology, Anatomy III, Ludwig-Maximilians-Universität München, Germany
Figures
Figure 1 with 2 supplements
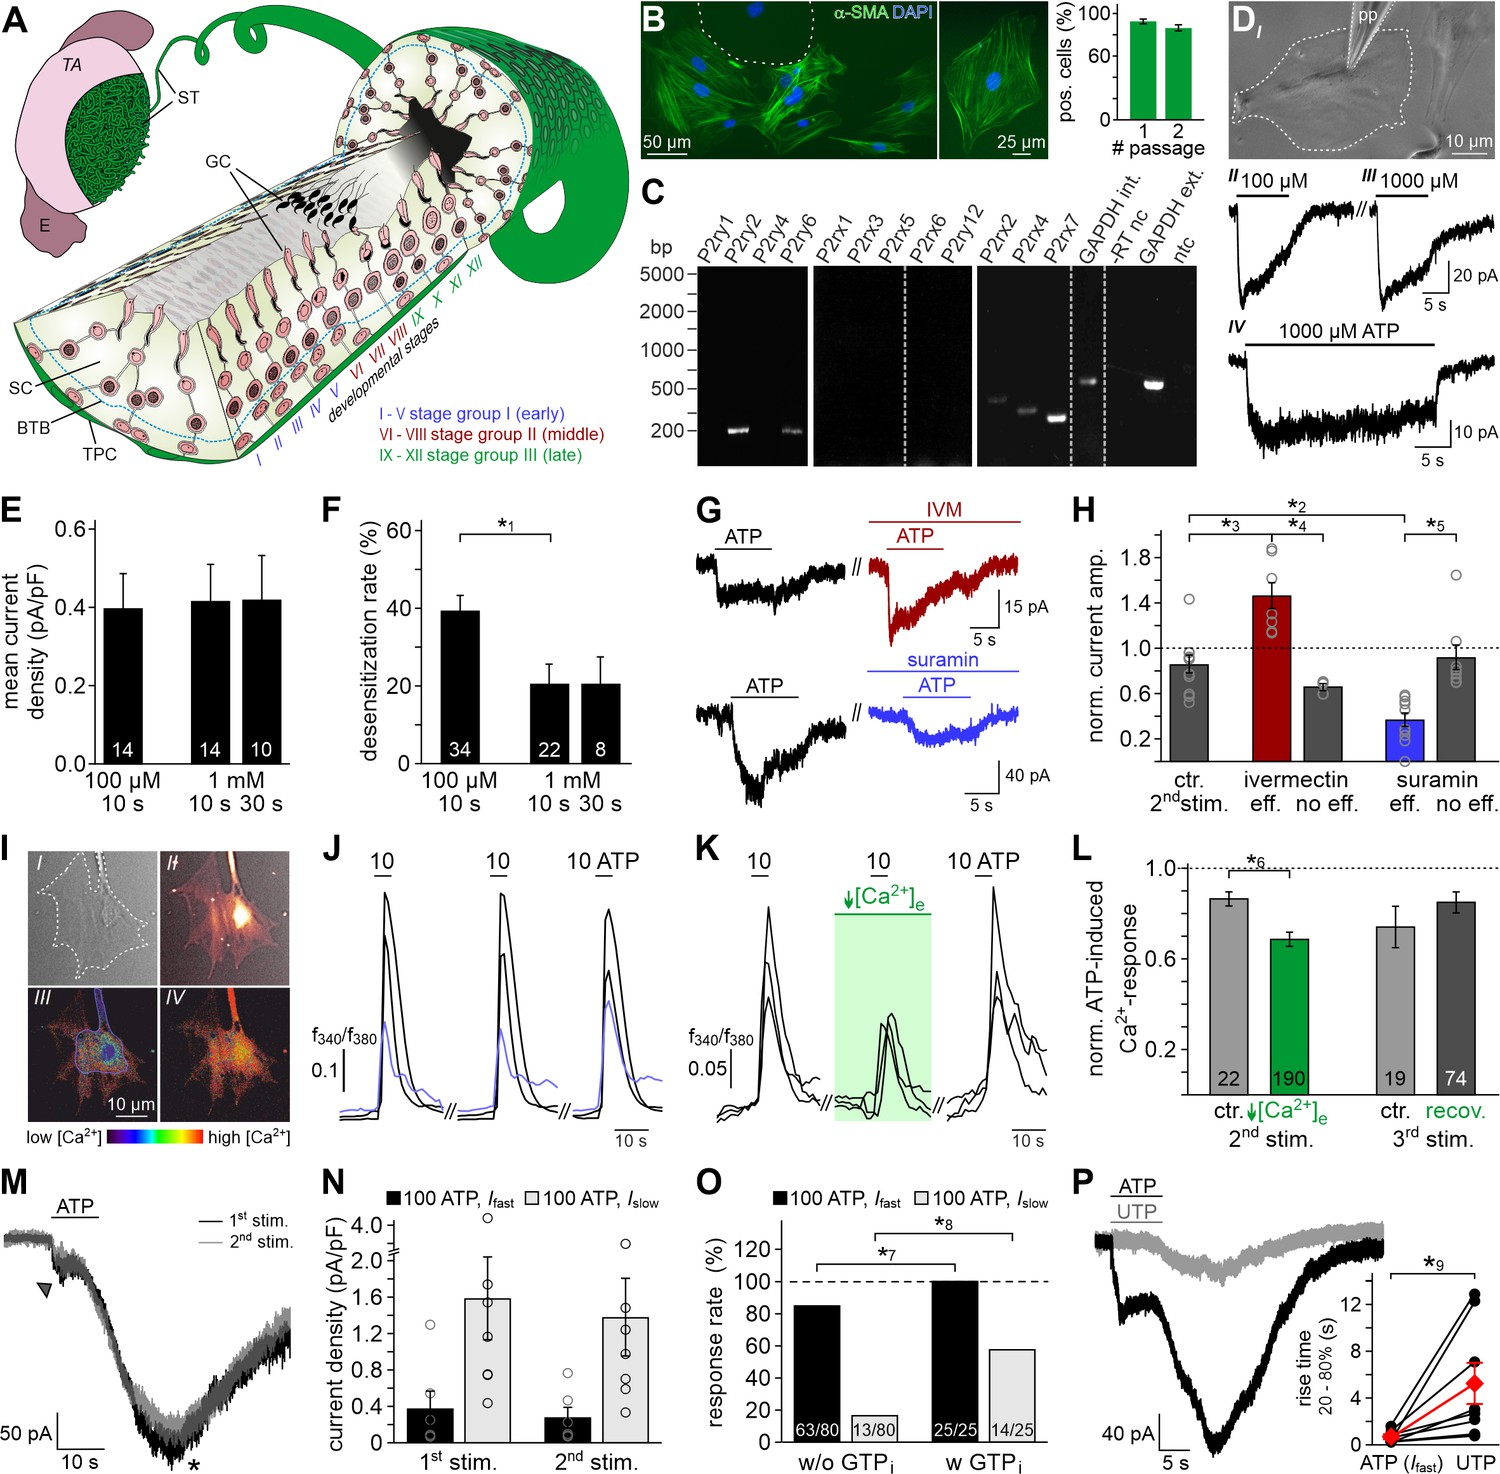
ATP is a potent TPC stimulus.
(A) Schematic sketch of the mouse seminiferous tubule (ST) highlighting 12 stages (I – XII) of the spermatogenic cycle (Hess and De Franca, 2008; Russell, 1990), which are arranged in consecutive order along the length of the tubule. A single layer of flat testicular peritubular cells (TPC; green) lines the tubular wall. Sertoli cells (SC) span the tubule from the basal lamina to the lumen. Developing germ cells (GC) are distributed between Sertoli cells. Spermatogonia are located near the basal membrane. Prophase spermatocytes move across the blood-testis barrier (BTB) to the adluminal compartment where they complete meiosis. The resulting haploid spherical cells (round spermatids) differentiate into elongated spermatids and, eventually, into highly condensed and compartmentalized spermatozoa (spermiogenesis). These mature, yet still immotile germ cells are then released into the lumen (spermiation). E, epididymis; TA, tunica albuginea; inspired by Hess and De Franca, 2008. (B) Immunostaining against α-smooth muscle actin (α-SMA, green) marks TPCs in vitro (Tung and Fritz, 1989). Cell count is determined by nuclear staining (DAPI, blue). Cultures retain high TPC purity for at least two passages (92 ± 2%, n = 1102 (#1); 86 ± 3%, n = 542 (#2)). Dashed line delimits one of the few α-SMA-negative cells. (C) RT-PCR profiling of purinoceptor isoforms in TPC cultures reveals P2rx2, P2rx4, P2rx7, P2ry2, and P2ry6 transcripts. Dashed gray vertical lines indicate cuts in a given gel. (D–H) ATP exposure triggers TPC transmembrane currents. (DI) Phase-contrast micrograph depicting a TPC (dashed line) targeted by a patch pipette (pp). (DII-DIV) Original whole-cell recordings illustrate representative currents in response to ATP stimulation (100 µM (DII) vs. 1000 µM (DIII) and 10 s (DIII) vs. 30 s (DIV), respectively). Vhold = −80 mV. (E, F) Quantification (bar charts; mean ± SEM; n as indicated) reveals saturation of peak current density at ≤100 µM ATP (E) and modest desensitization at a concentration-dependent rate (F). (G) Whole-cell voltage-clamp recordings show ATP-induced currents (100 µM; 10 s) that are potentiated by ivermectin (3 µM) and partially inhibited by suramin (100 µM), respectively (≥60 s preincubation). Vhold = −80 mV. (H) Quantification (bar charts; mean ± SEM; data normalized to initial control response) demonstrates dichotomy in drug sensitivity. Treatment was categorized as effective (eff) if current amplitudes deviate by ± SD from average control recordings (85 ± 24%, 2nd ATP stimulation). Note that each drug proved ineffective (no eff) in some cells. Gray circles depict data from individual cells. (I–L) ATP-dependent Ca2+ mobilization in cultured TPCs. Ca2+ transients in response to repetitive stimulation (10 µM, 10 s) are monitored by ratiometric (fura-2) fluorescence imaging. (I) Phase contrast (I) and merged fluorescence (f380; II) images of a TPC in vitro. Bottom pseudocolor frames (rainbow 256 color map) illustrate relative cytosolic Ca2+ concentration ([Ca2+]c) before (III) and during (IV) ATP stimulation. (J, K) Representative original traces from time-lapse fluorescence ratio (f340/f380) recordings depict repetitive [Ca2+]c elevations upon ATP exposure under control conditions ((J) blue traces correspond to the TPC in (I)) and during reduced extracellular Ca2+ concentration ((K) [Ca2+]e = 100 nM; 60 s preincubation). (L) Bar chart depicting Ca2+ signal amplitudes (mean ± SEM; n as indicated) – normalized to the initial ATP response – under control conditions (gray) vs. low [Ca2+]e (green). Asterisks denote statistically significant differences (*1p=0.001; *2p=0.002; *3p=5.5e−5; *4p=0.0006; *5p=0.02; *6p=0.02; Student t-test (F, L), one-way ANOVA (H)). (M) Representative whole-cell voltage-clamp recordings (Vhold = −80 mV) of ATP-induced inward currents in cultured mouse TPCs. Two components – a fast relatively small current (arrow head) and a delayed lasting current (asterisk) – are triggered repeatedly by successive ATP exposure (100 μM; 90 s inter-stimulus interval). Notably, we never observed a delayed slow current without a fast response. (N) Bar chart quantifying peak densities (mean ± SEM, circles show individual values) of the fast (Ifast; black) and the delayed (Islow; gray) ATP-induced current components (1st stimulation: Ifast 0.37 ± 0.2 pA/pF; Islow 1.58 ± 0.5 pA/pF; 2nd stimulation Ifast 0.27 ± 0.1 pA/pF; Islow 1.37 ± 0.4 pA/pF). (O) Bar graph illustrating the frequency of Ifast (black) and Islow (gray) occurrence upon ATP (100 µM) stimulation in absence (w/o) and presence (w) of GTP (500 μM) in the pipette solution, respectively. Asterisks denote statistically significant differences (*7p=0.008, *8p=0.0003; Fisher‘s exact test); n as indicated in bars. (P) Representative whole-cell voltage-clamp recordings (Vhold = −80 mV) of inward currents induced by ATP (100 μM) and UTP (100 μM), respectively. Whenever ATP triggers both Ifast and Islow (left), Islow is also induced by UTP (right). UTP-dependent currents develop significantly slower than ATP-evoked Ifast (inset; *9p=0.03; paired t-test).
Figure 1—figure supplement 1
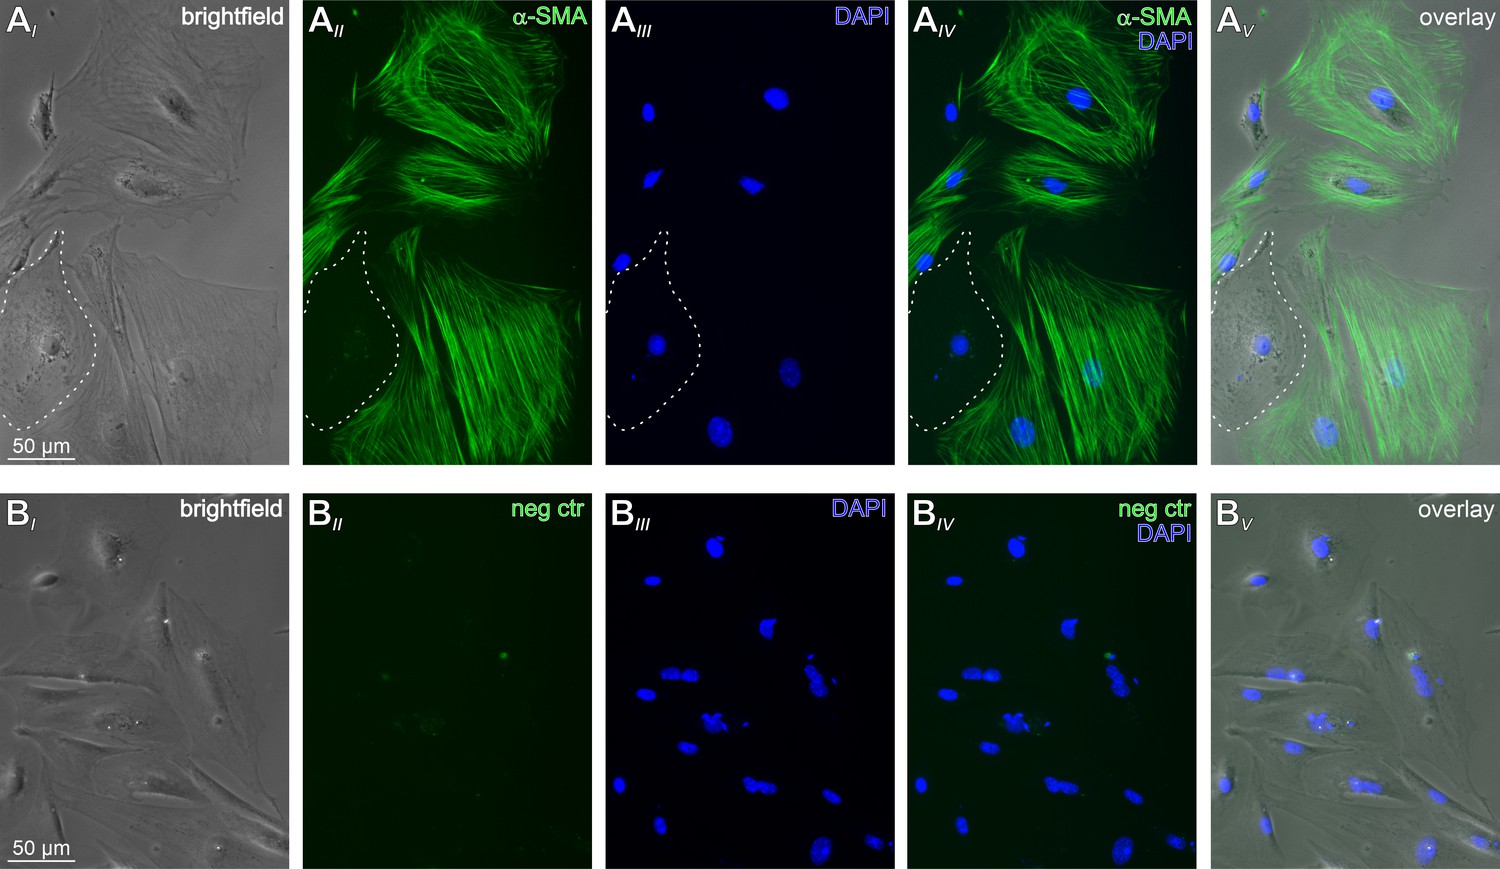
Mouse TPCs in primary culture.
(A) Representative phase contrast (AI) and epi-fluorescence images of TPCs in vitro. The vast majority of cultured cells are immunopositive for the TPC marker α-smooth muscle actin (α-SMA; green (AII)). The dotted white line delimits one of the few α-SMA-negative cells. Cell count was based on nuclear staining (DAPI, blue (AIII)). Merged images (AIV-V) allow categorization. (B) Corresponding control images taken after the primary α-SMA antibody was omitted.
Figure 1—figure supplement 2

ATP/UTP-dependent Islow in cultured mouse TPCs is largely carried by Cl–.
(A, B) When measured during peak Islow, short (200 ms) voltage ramp (−80 to 80 mV) recordings reveal current-voltage relationships of ATP-induced currents at different Cl– equilibrium potential (ECl; −40 mV (S1/S7; black trace) or 0 mV (S5/S7; gray trace)) (A). Note the corresponding shift in reversal potential (Vrev) that is quantified in (B) (n = 6). Black/gray dots represent measurements from individual cells, red diamonds depict mean values.
Figure 2
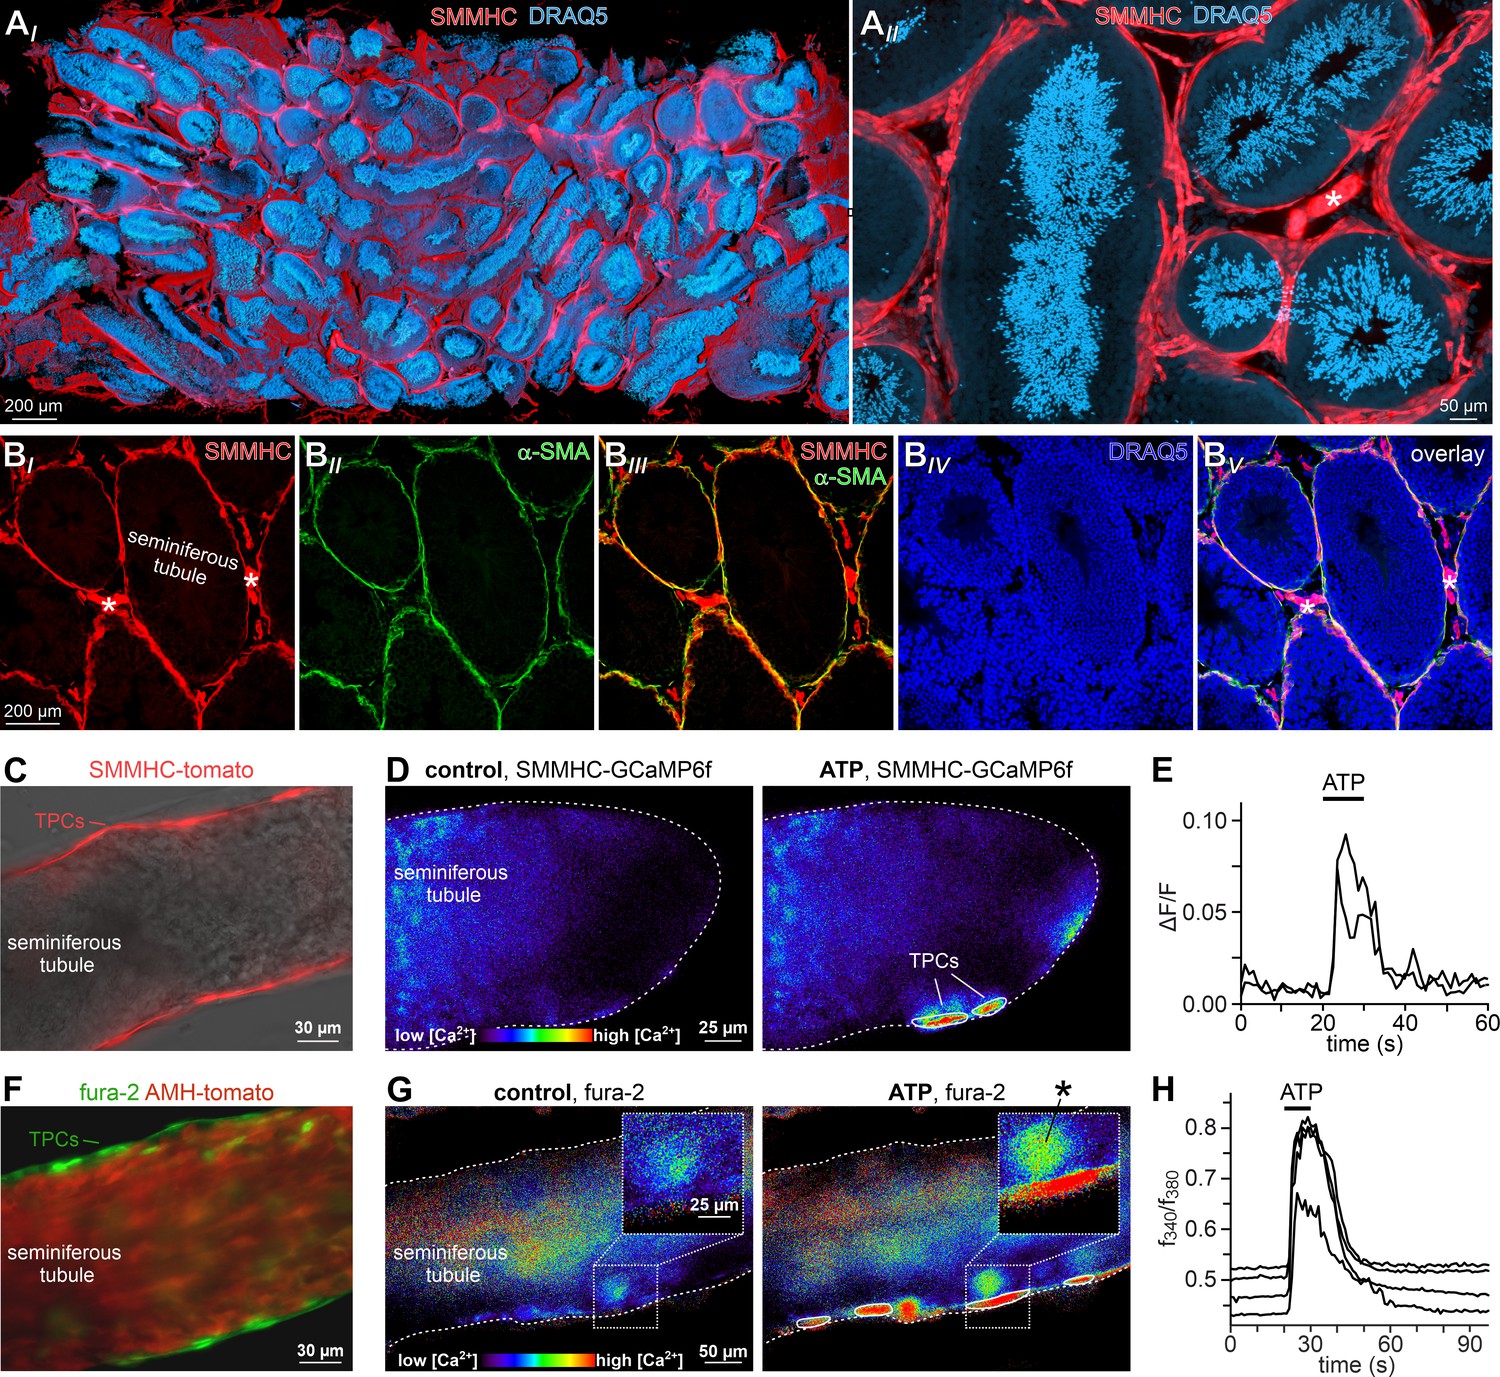
ATP triggers TPC Ca2+ signals in acute seminiferous tubule sections.
(A) 3D reconstruction of an intact 6 × 3 × 1.5 mm testis sample from a SMMHC-CreERT2 x Ai14D mouse after tissue clearing (CLARITY Chung and Deisseroth, 2013) reveals tdTomato expression (red) restricted to TPCs and vascular endothelial cells (asterisk in (AII)). Nuclear staining (DRAQ5; blue) is most prominent in post-meiotic germ cells because of their high degree of DNA condensation. (B) SMMHC-CreERT2-expressing cells in the tubule wall are TPCs. In testis cryosections from adult SMMHC-CreERT2 x Ai14D mice, Cre-driven tdTomato signals (BI) and α-SMA immunostaining (BII) colocalize at tubular margins (BIII). Nuclei are stained with DRAQ5 (blue (BIV)). Note that endothelial vasculature in interstitial regions (asterisks) is α-SMA-negative (merged image (BV)). (C–H) Both TPC-specific expression of a genetically encoded Ca2+ indicator (GCaMP6f) and bulk loading with a synthetic Ca2+ sensor (fura-2) allow for TPC-selective live cell Ca2+ imaging in acute seminiferous tubule sections. (C) Merged fluorescence and reflected light micrographs show the location of SMMHC-expressing TPCs (red) within the wall of an intact tubule. (D–E) Cre-dependent GCaMP6f expression in SMMHC-CreERT2 x Ai95D mice reveals Ca2+ transients in TPCs in response to ATP. Representative fluorescence images ((D) rainbow 256 color map) before and during ATP exposure (100 µM; 10 s), and corresponding traces (E) showing changes in GCaMP6f intensity (ΔF/F) over time. Traces from ROIs outlined in (D) (white solid lines). (F) Merged fluorescence image of an acute seminiferous tubule section from an AMH-Cre x Ai14D mouse after bulk loading with fura-2/AM (green). Anti-Müllerian hormone (AMH) dependent expression of tdTomato (red) specifically labels Sertoli cells that build the seminiferous epithelium. Note the narrow green band of marginal TPCs that are preferentially labeled by the Ca2+-sensitive dye. (G–H) Ratiometric Ca2+ imaging in fura-2-loaded tubules enables semi-quantitative live-cell monitoring of TPC activity. Representative fluorescence images ((G) rainbow 256 color map) before and during ATP exposure (100 µM; 10 s). Corresponding traces (H) show the fluorescence intensity ratio (f340/f380) from four ROIs (in (G); white solid lines) over time. Inset (G) shows a putative TPC and an adjacent putative spermatogonium (asterisk) at higher magnification.
Figure 3
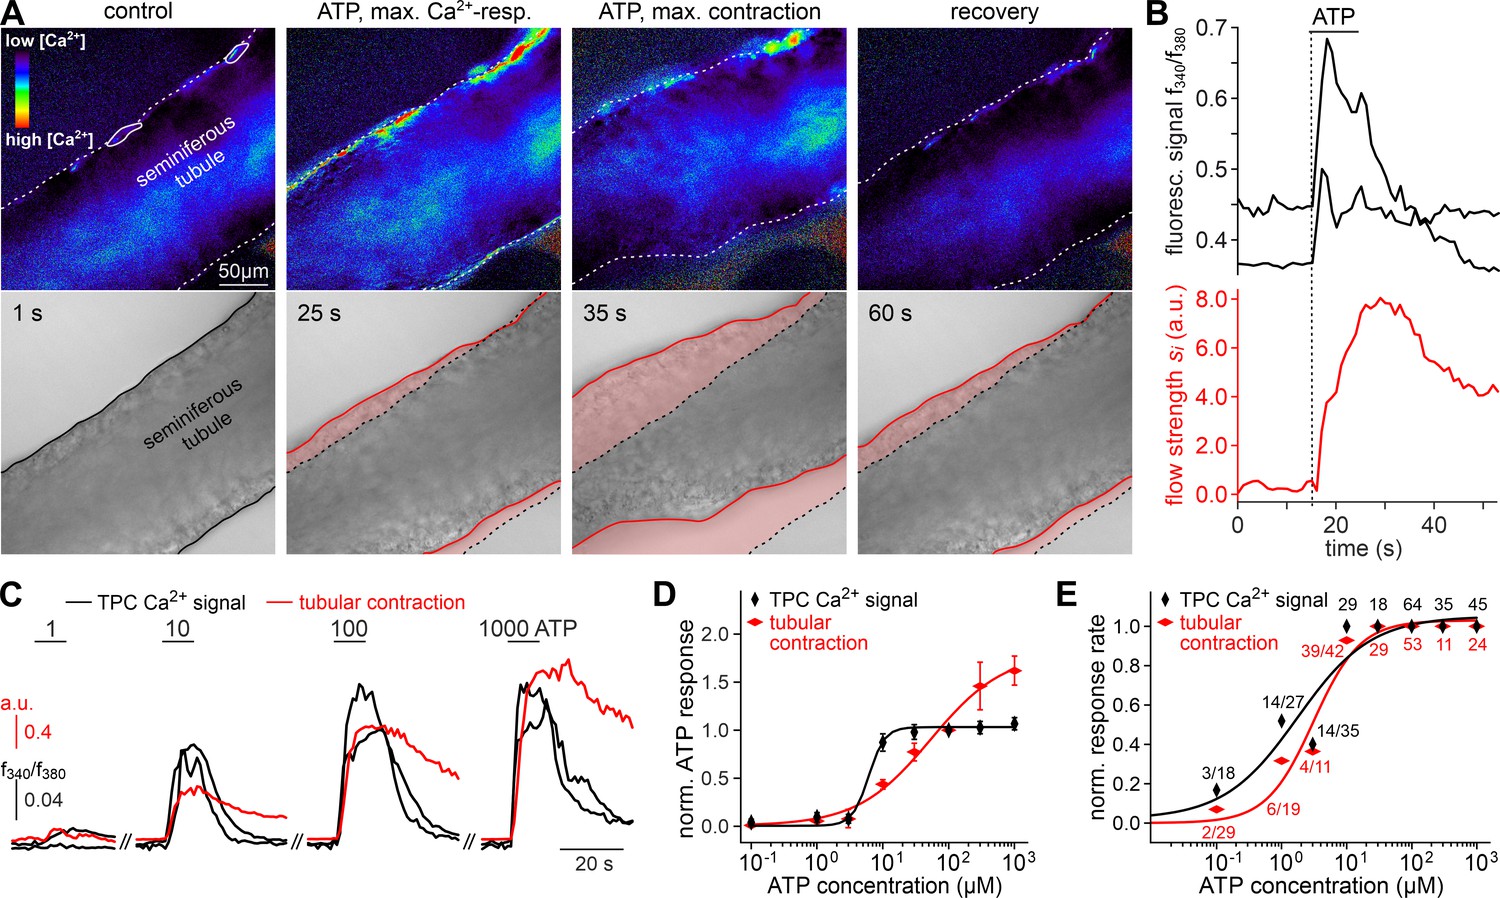
ATP triggers seminiferous tubule contractions.
(A) Quasi-simultaneous imaging of [Ca2+]c-dependent fluorescence (top; f340/f380; rainbow 256 color map) and tubular position (bottom; reflected light microscopy). Focus adjusted to provide sharp images of the seminiferous tubule’s edges. Individual frames correspond to the time points indicated, i.e. before, during, and after ATP exposure (see (B)). Dashed white lines (top) and corresponding solid black/red lines (bottom) depict the outline of the tubule in each image, respectively. Dotted black lines (bottom) show the contour at t = 1 s for comparison. Pink shades (bottom) accentuate areas that moved. (B) Fluorescence ratio (top; black traces correspond to regions-of-interest delimited by solid white lines in (A)) and integrated flow strength – a measure of strength and direction of pixel displacement (bottom; red trace) – over time. ATP (100 µM) stimulation as indicated (horizontal bar). With the t = 0 s image as reference, flow strength is calculated by custom code as the average whole tubule pixel shift vector (methods). Dashed vertical line marks the Ca2+ signal onset. (C–E) Ca2+ responses and tubular movement are dose-dependent. (C) Original traces depict [Ca2+]c (black) and tubule movement (red) from a representative experiment. Data calculated as in (B). Brief (10 s) stimulations with increasing ATP concentrations (1–1000 µM) trigger dose-dependent Ca2+ transients and corresponding contractions. (D, E) Data quantification. Dose-response curves illustrate peak signals (D) and the percentage of responding putative TPCs (black)/tubules (red) (E). Data are normalized to responses to 100 µM ATP (n as indicated in (E)).
Figure 4 with 1 supplement
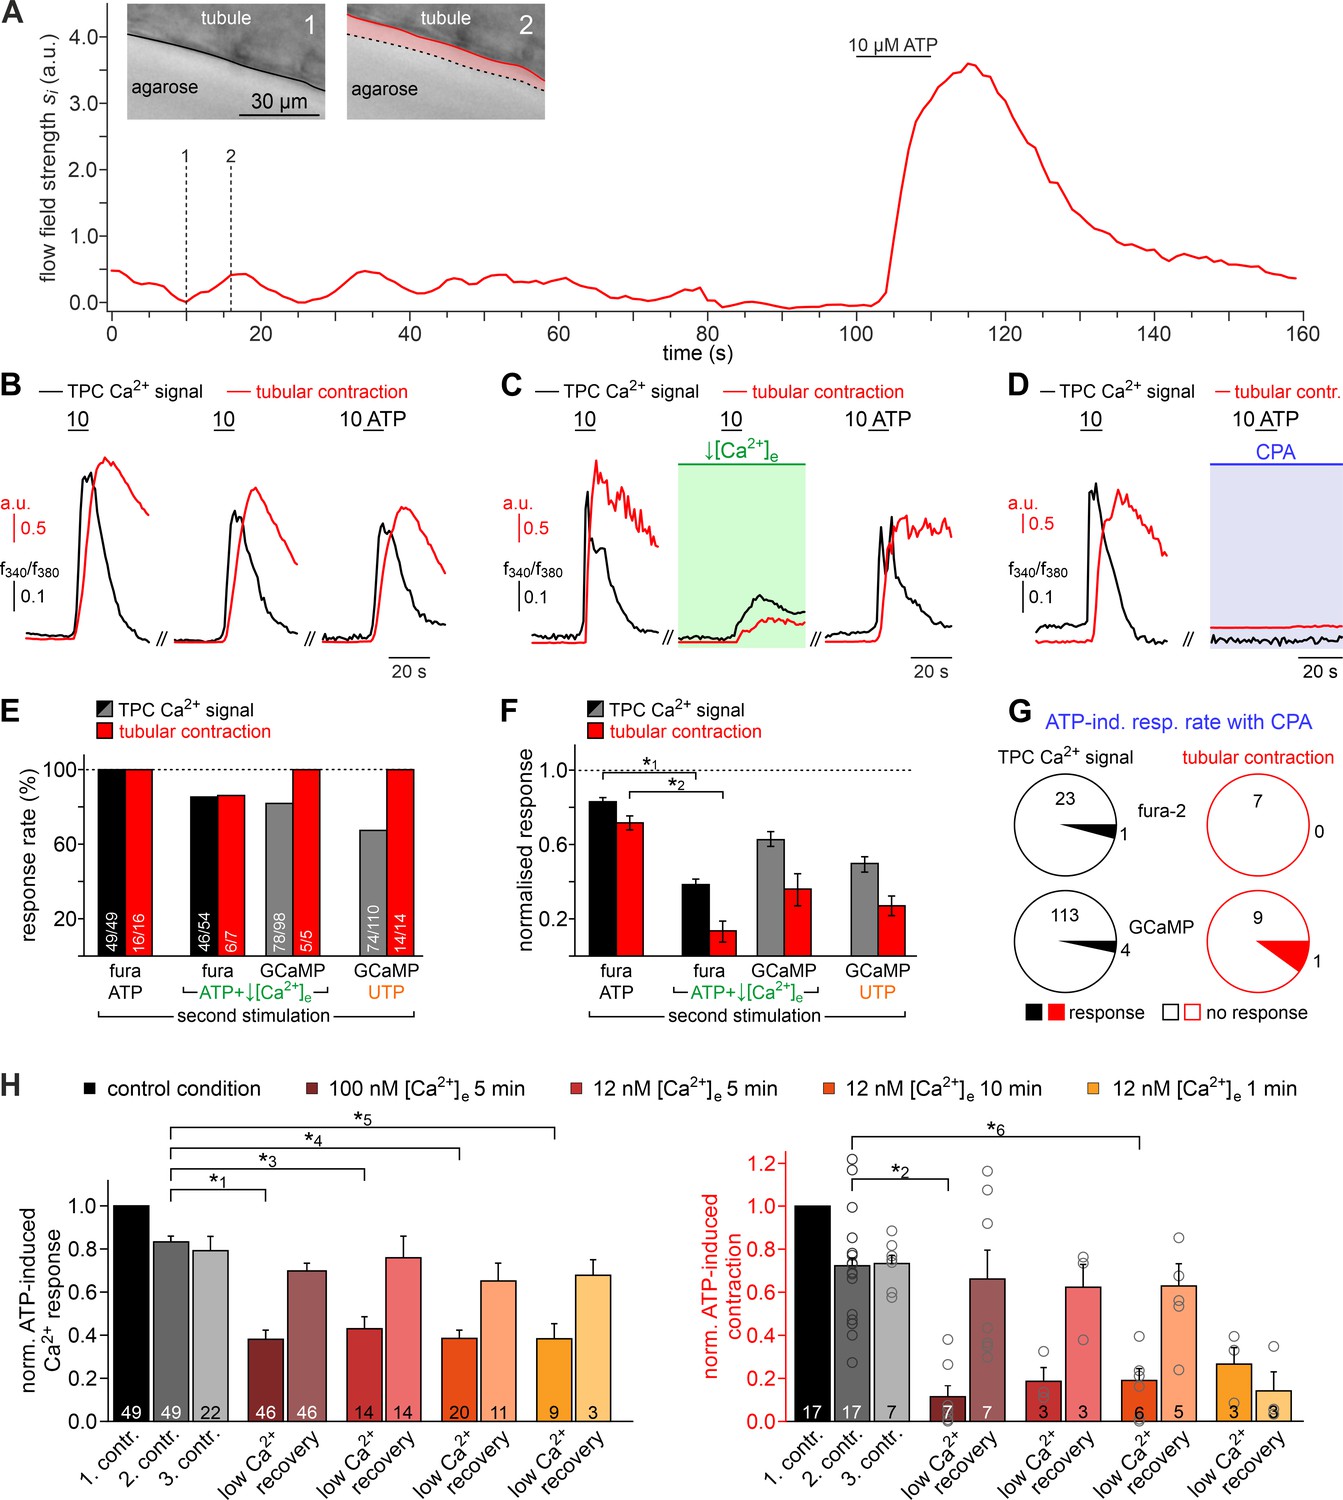
Both intra- and extracellular Ca2+ sources contribute to ATP-dependent TPC contractions.
(A) In situ imaging identifies spontaneous low-amplitude ‘vibratory’ movements in acute seminiferous tubule slices. Representative trace illustrating flow field strength analysis of tubular motion under control conditions and upon ATP exposure (10 µM; 10 s). Note that spontaneous indentations share small amplitudes and are restricted to the tubule edge (inset). Black/red lines (inset) depict the outline of the tubule in each image, respectively. Dotted black lines show the contour at t = 1 for comparison. Pink shades accentuate areas that moved. (B) Repeated purinergic stimulation triggers robust Ca2+ elevations and concurring seminiferous tubule contractions with only minor response adaptation. Traces depict changes in fura-2 intensity ratio (f340/f380; black) or tubular movement (red) upon brief ATP exposure (10 s; 10 µM; 5 min intervals) under control conditions. (C) Reducing [Ca2+]e (100 nM; 5 min incubation) strongly diminishes responses to ATP (10 s; 10 µM). (D) Depletion of internal Ca2+ stores (CPA Seidler et al., 1989; 90 µM; 18.8 ± 9.3 min incubation) essentially abolishes both Ca2+ signals and tubule contractions. (E–G) Quantification of data exemplified in (B–D). (E) Bar chart depicting ATP sensitivity (response rate; %), independent of signal strength. Occurrence of Ca2+ elevations (black) and tubule contractions (red) are plotted for different experimental conditions [i.e. stimulation with ATP or UTP, regular or reduced [Ca2+]e (1 mM or 100 nM, respectively), and Ca2+ indicator (fura-2 or GCaMP6f, respectively)]. Numbers of experiments are indicated in each bar. (F) Signal amplitudes (Ca2+, black; contractions, red) of responding TPCs/tubules, quantified as a function of stimulus, treatment, and Ca2+ sensor. Data (mean ± SEM) are normalized to the respective initial responses to ATP (10 µM) under control conditions (dotted horizontal line; see first stimulations in B and C). Experimental conditions and numbers of experiments as in (E). Asterisks denote statistical significance (*1p=2.2e−19 and *2p=5.6e−8; t-test; note: tests only performed when n > 5 and only one variable was changed). (G) Pie charts illustrating the profoundly reduced ATP sensitivity of TPCs/tubules after depletion of Ca2+ storage organelles (CPA; 90 µM). Numbers within pies correspond the total count of cells/tubules that responded to ATP before treatment. (H) Effects of lowering [Ca2+]e are comparable over both incubation periods and concentrations in the nanomolar range. Significantly reduced, though not abolished TPC Ca2+ signals (left) and seminiferous tubule contractions (right) are observed in presence of both 100 nM and 12 nM [Ca2+]e as well as for variable incubation periods lasting between 1 and 10 min, respectively. Asterisks denote statistical significance (*3p=2.8e−10, *4p=7.8e−14, *5p=3.8e−9, *6p=1.0e−6; one-way ANOVA with post-hoc Tukey HSD test; note: tests only performed when n ≥ 5).
Figure 4—figure supplement 1
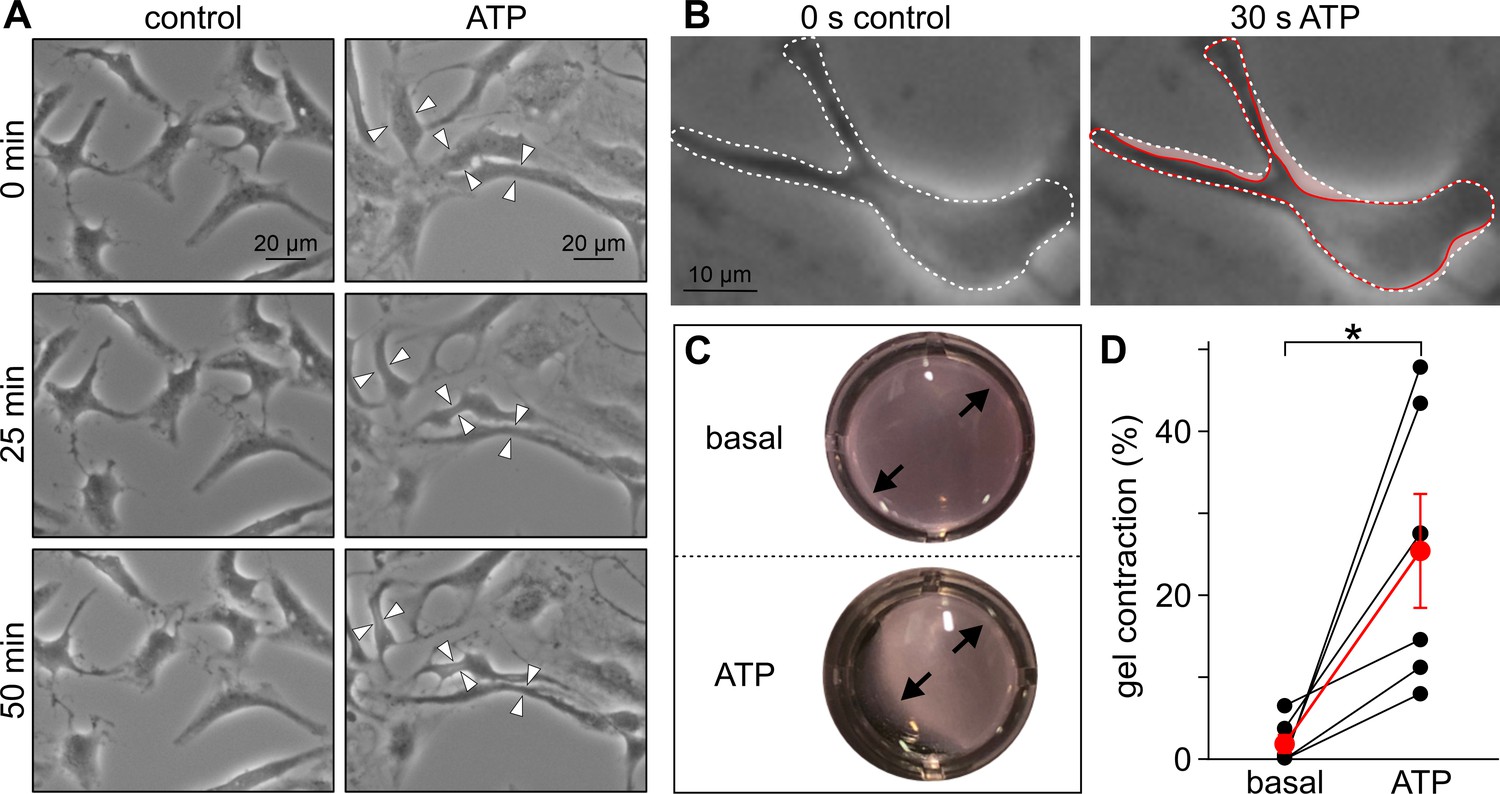
Purinergic stimulation mediates contractions in cultured human TPCs.
(A) Phase contrast micrographs of human TPC in primary culture (Walenta et al., 2018) that were monitored (50 min) under either control conditions (left) or during treatment with ATP (right; 1 mM). White arrow heads denote regions where a substantial reduction in cell surface area upon ATP exposure becomes readily apparent. (B) Some TPCs already ‘shrink’ within 30 s of treatment. Cell contour is indicated before (dashed white line) and during (solid red line) ATP exposure (red ‘shadow’ illustrates the putative contraction). (C, D) 24 hr collagen gel contraction assays (Ailenberg et al., 1990; Tung and Fritz, 1987) allow quantification of human TPC contractility in vitro. As exemplified in (C) and quantified in (D) ATP (1 mM) incubation of human TPCs that are embedded in collagen lattices mediates a massive reduction in gel area (ATP; 25.5 ± 7.0%, mean ± SEM; human TPCs from n = 3 patients, measured in duplicates). By contrast, gel size remains essentially unchanged under control conditions (basal). Asterisk denotes statistical significance (p=0.003; unpaired t-test).
Figure 5
ATP drives directional luminal transport.
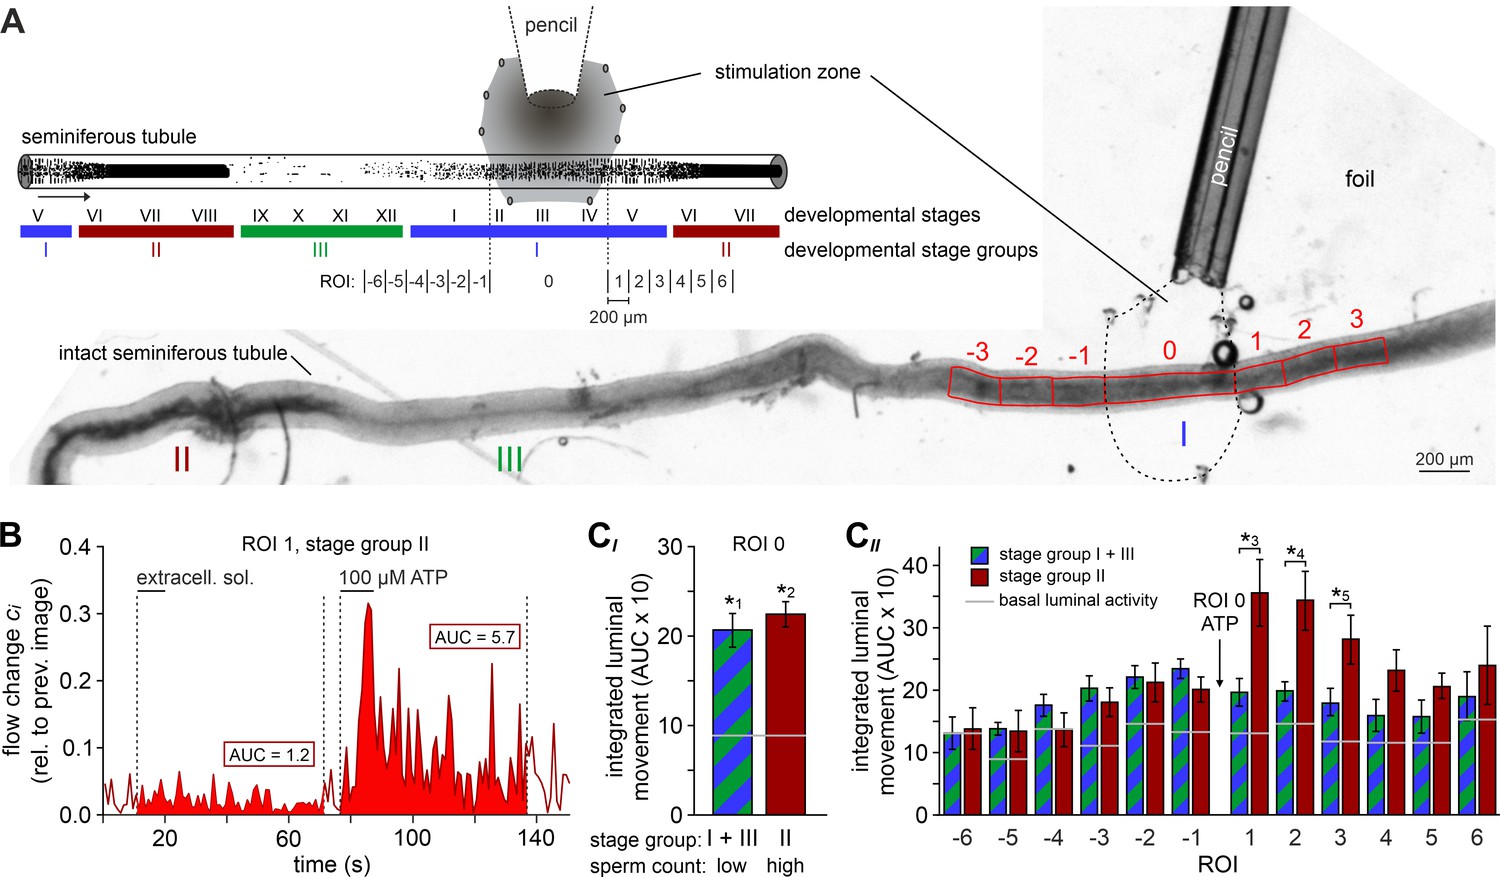
(A) Schematic drawing (top) and original low-magnification image (bottom) of the experimental setup. Intact seminiferous tubules are placed on transparent foil in a custom-built macroscopic imaging chamber. The tubule is kept stationary by gentle suction through tiny holes punched in the foil and vacuum underneath. As previously suggested (Hess and De Franca, 2008), tubules are coarsely categorized into three stages (I–III; color code) according to luminal sperm content. Precise mapping of stimulated regions is feasible by positioning both tubule and perfusion pencil within an area delimited by several holes that outline a stimulation zone (methods). The tubule region directly exposed to ATP is designated as ROI 0, with adjacent equidistant sections numbered consecutively (up to ROI ±6; schematic). In the original image shown, only ROIs ± 3 are outlined for clarity. (B) Analysis of luminal content movement by calculation of flow change relative to each previous image (methods) within a representative luminal ROI. Motion is quantified by measuring the area under curve (AUC; solid red) within 60 s after stimulation onset. Note that mechanical control stimulation (extracellular solution) does not affect basal luminal motion. (C) Bar charts depicting luminal content movement (means ± SEM) upon ATP stimulation (100 µM; 10 s) in either directly exposed regions (CI; n = 17) or adjacent areas (CII; n = 3–17). Green/blue (groups I and III) and red (group II) bars depict stages with a low vs. a high luminal sperm count, respectively. Horizontal gray lines mark the average basal luminal motion prior to stimulation. ATP induces significantly increased content movement in directly stimulated areas (ROI 0) independent of luminal sperm count/stage group (CI). Note that in adjacent regions (CII) unidirectional movement occurs exclusively in tubule sections with high luminal sperm density. Asterisks denote statistically significant differences (*1p=8.7e−5; *2p=6.7e−7; *3p=0.005; *4p=0.002; *5p=0.03; unpaired two-tailed t-test).
Figure 6
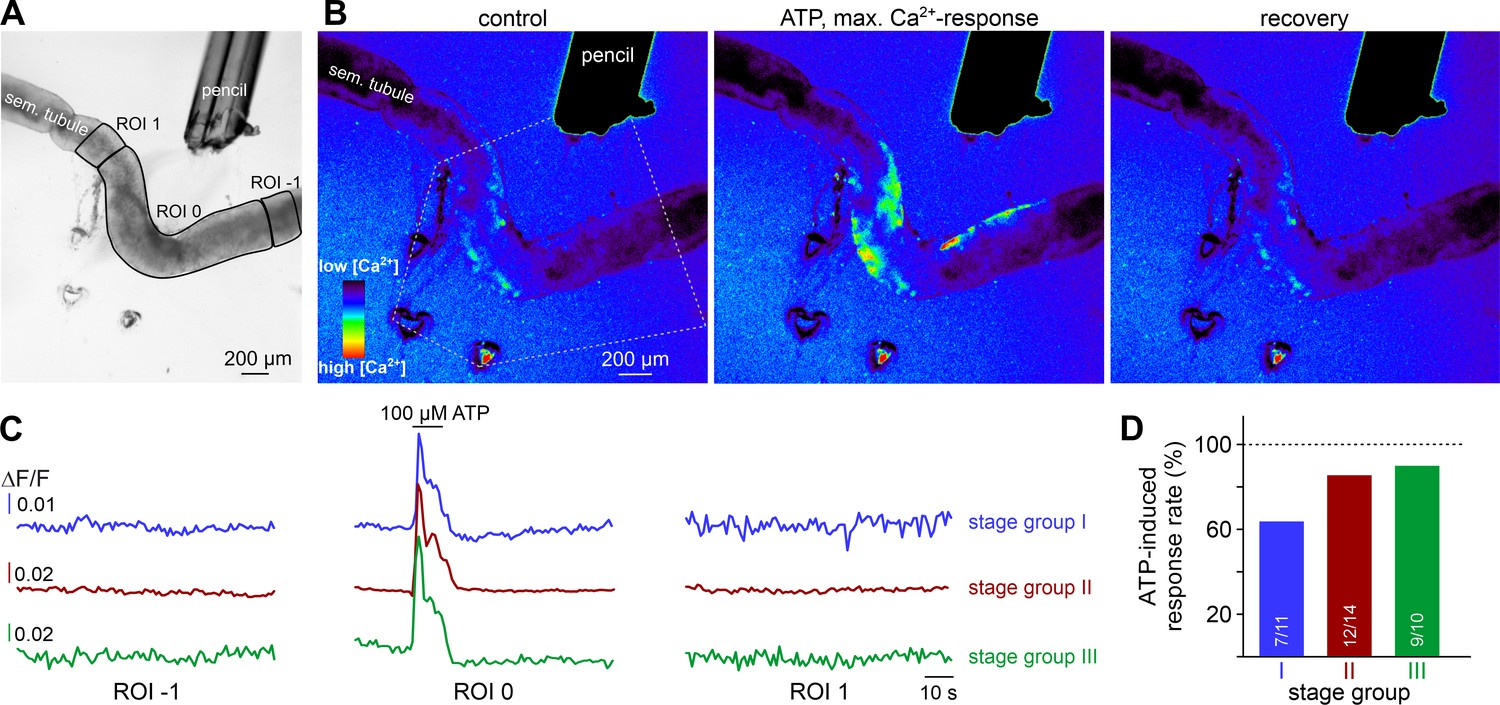
ATP causes Ca2+ elevations within a restricted paracrine radius.
(A) Low-magnification brightfield image of an intact seminiferous tubule segment dissected from SMMHC-CreERT2 x Ai95D mice and positioned directly in front of the tip of a 250 µm diameter perfusion pencil. ROIs (black lines) are drawn to encompass the area that is directly exposed to fluid flow (ROI 0) as well as adjacent regions (ROIs 1 and −1), respectively. Suction produced by negative pressure (applied through holes in the elastic foil pad beneath the tubule) limits the area of perfusion. (B) Pseudocolor GCaMP6f fluorescence intensity images of the tubule shown in (A) reveals Ca2+ transients in TPCs in response to ATP. Representative images (rainbow 256 color map) correspond to time points before, during, and after focal ATP exposure (100 µM; 10 s). The area directly challenged with ATP is denoted by the white dotted lines. For clarity, autofluorescence of the perfusion pencil was removed. Note that Ca2+ elevations are limited to ROI 0. (C) Representative original recordings of changes in GCaMP6f intensity (ΔF/F) over time from tubule segments of the three different stage groups (I–III). Traces exemplify Ca2+ signals (or the lack thereof) in ROIs 0, –1, and 1, respectively. Independent of the epithelial cycle stage investigated, ATP-induced [Ca2+]c elevations are restricted to directly exposed tissue segments. (D) Quantification of ATP sensitivity among tubule segments of different cycle stage. Bar charts illustrate that purinergic stimulation causes Ca2+ signals irrespective of stage and, thus, luminal sperm count. Numbers of experiments as indicated in bars.
Figure 7 with 2 supplements

ATP induces tubular contractions in vivo.
(A) Multiphoton in vivo fluorescence microscopy in SMMHC-CreERT2 x Ai95D mice enables time-lapse imaging of TPC activity. Maximum gray scale projection outlines segments from four seminiferous tubules (red dotted lines (AI)). Pseudocolor images of GCaMP6f intensity indicate [Ca2+]c changes in TPCs of tubule three during phases of low (AII) vs. high (AIII) spontaneous activity (rainbow color map; white arrows in (AIII)). (B) Original traces depict simultaneous TPC Ca2+ signals (black; ΔF/F) and tubular contractions (red; calculated as flow change relative to each previous image (methods) over time in tubules 1–3) (A). Red triangles mark passive movements, which occur upon contractions of adjacent tubules. Note the lack of a corresponding Ca2+ signal. (C) Analysis of spontaneous tubular motion in vivo. Low magnification incident light image of the mouse testis (CI) shows several superficial seminiferous tubule segments, testicular blood vessels (white asterisk; note that unobstructed blood supply (i.e. visualizing erythrocyte flow) is checked routinely), and a specific segment outlined by red dotted lines. After time-lapse imaging, this segment is digitally straightened (CII) and subjected to motion analysis. For different time points (i–v), pixel movement and its propagation are reflected by merged pseudocolor images. Directionality is indicated by the black arrow in (CI). From a kymograph (CIII), the time–space relationship of tubular motion becomes apparent (time points i–v as indicated by dashed vertical lines). (D) Violin plot depicting the velocity of contractile movement in individual tubule segments (blue dots). (E–G) ATP-induced Ca2+ signals and contractions in vivo. (E) Low magnification epi-fluorescence image of several superficial seminiferous tubule segments and blood vessels (white asterisks). The boxed area includes three tubule segments (dotted black lines), which are targeted by a low resistance pipette filled with fluorescently labeled ATP solution. (F) Enlarged view of the area outlined in (E). Merged (red/green) multiphoton fluorescence images taken before and during/after brief stimulation with ATP. The middle and right frames correspond to the point of maximum Ca2+ signal (green) and contraction (double arrows) of tubule 1, respectively. (G) Bar chart quantification of contractions induced by nanoliter puffs of saline with or without ATP (1 mM). Asterisk denotes statistical significance (p=0.036; Fisher’s Exact test).
Figure 7—figure supplement 1
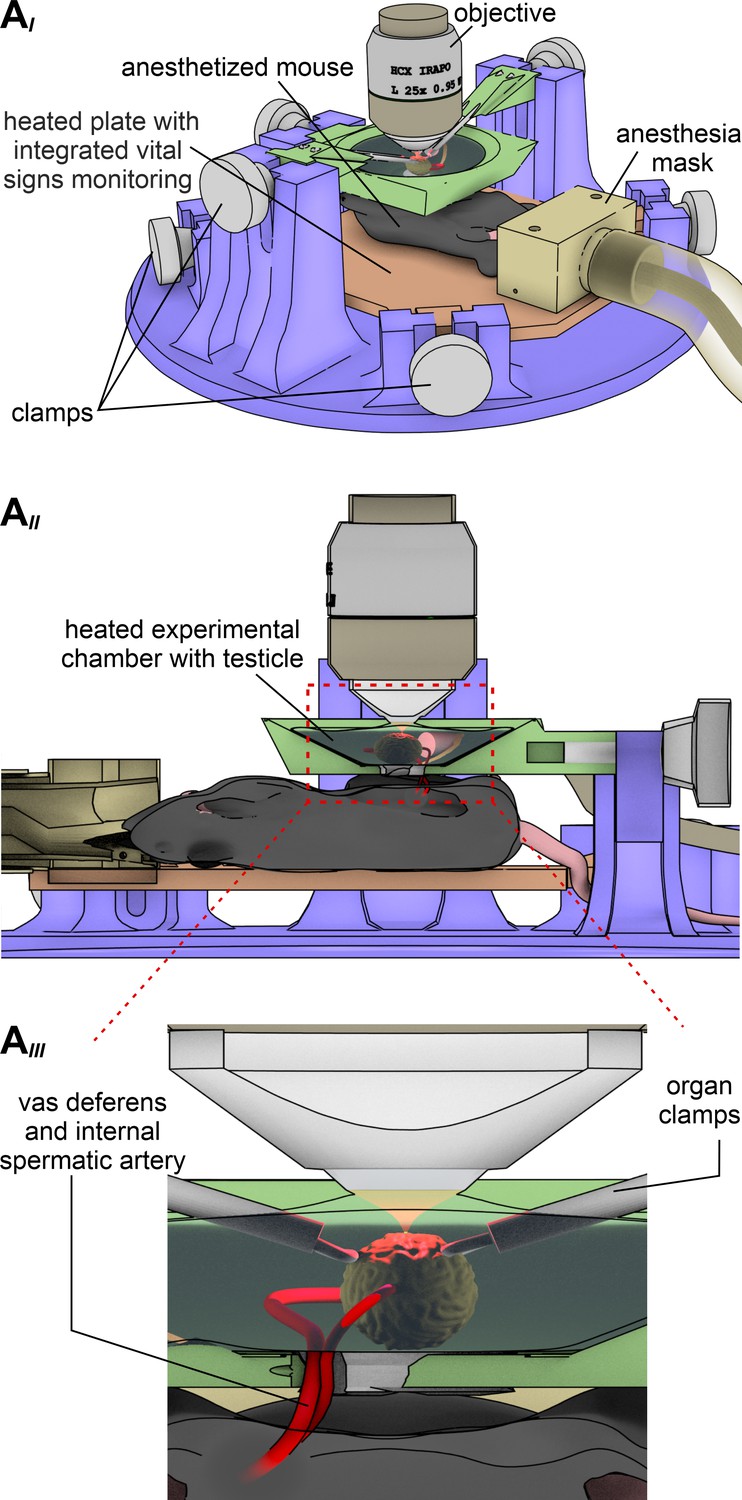
A custom-built 3D printed microscope stage enables simultaneous in vivo multiphoton imaging of Ca2+ signals and contractions in mouse seminiferous tubules.
(A) Schematic drawing that illustrates the custom-built intravital imaging stage designed for in vivo recordings testicular activity. Three different views depict design details from different perspectives. A top view of the apparatus (AI) shows that several adjustable clamps allow exact positioning of the anesthetized animal on a heated plate equipped for online vital sign monitoring. After centering one testicle in a heated (35°C) and saline-filled recording chamber (AII) within the microscope’s optical axis, a large working distance (~3 mm) infrared-optimized water-immersion objective (25x; 0.95 NA) enables multiphoton deep tissue imaging. A close-up cartoon of the recording chamber (AIII) illustrates that two micromanipulator-based moveable organ clamps enable precise (re)positioning of the testis as well as effective movement cancellation. Note that the vas deferens and internal spermatic arteries are kept intact to assure blood supply and fluid transport.
Figure 7—figure supplement 2
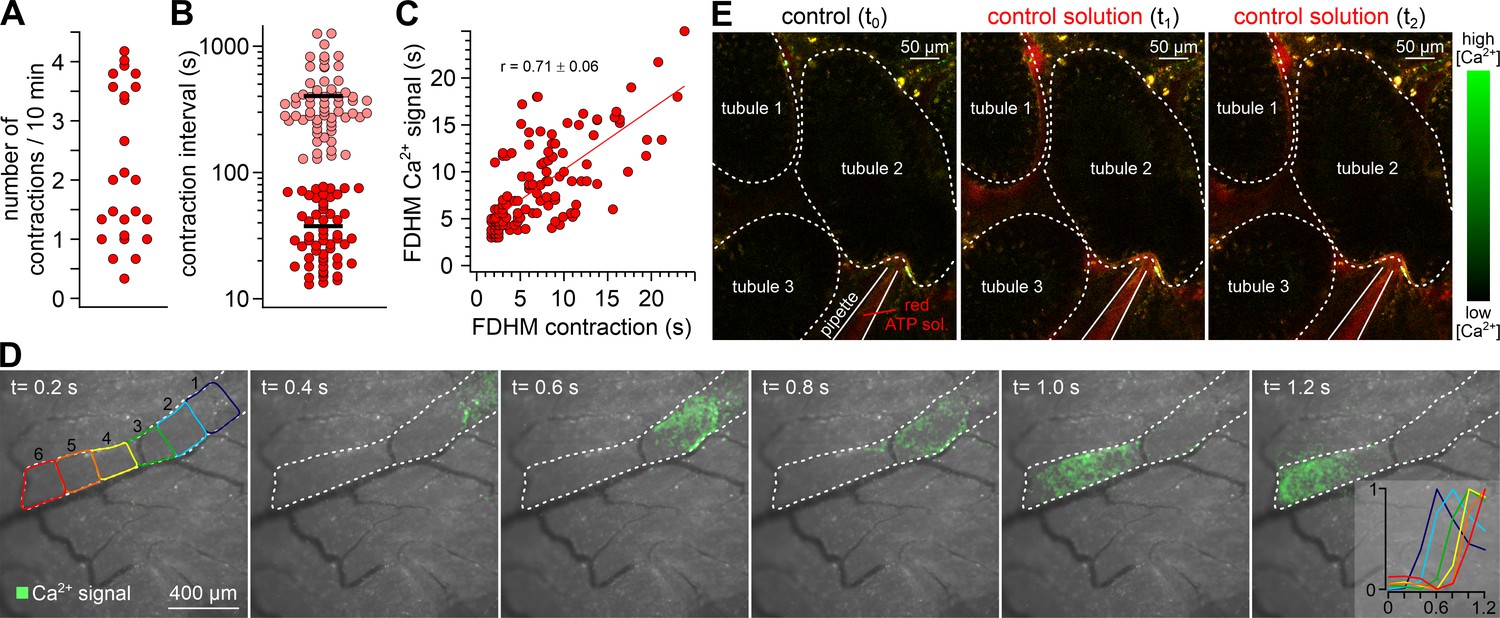
In vivo imaging of tubular activity in SMMHC-CreERT2 x Ai95D mice.
(A–C) Quantitative analysis of spontaneous seminiferous tubule contractions in vivo. Dot plots depict (A) the number of contractions observed in a given tubule segment per 10 min during variable windows of observation (13–30 min; mean = 25 min; n = 28; four mice), and (B) the intervals between two consecutive contractions. Note that two distinct types of either relatively short (<80 s; red; 38 ± 21 s; mean ± SD) and long (>2 min; magenta; 403 ± 250 s; mean ± SD) intervals become apparent. Moreover, we never observed tubules that lacked contractions. (C) 2D dot plot shows positive correlation (Pearson correlation coefficient r = 0.71) between TPC Ca2+ signal durations (full duration at half-maximum; FDHM) and corresponding tubule contractions. (D) Representative epifluorescence in vivo recording of a Ca2+ wave propagating along the longitudinal axis of a seminiferous tubule in a SMMHC-CreERT2 x Ai95D mouse (n = 3 animals). Individual consecutive frames indicate fluorescence intensity in pseudocolor (green; time as indicated; frames merged with corresponding brightfield image). Dashed white line denotes tubule dimensions. Inset (right) shows the color-coded Ca2+ signal onset (min/max normalization) in six adjacent tubule regions of comparable size (left). (E) Example experiment that controls for pressure-dependent signal artifacts when seminiferous tubules are exposed to ‘puffs’ of solution. Three fluorescence images show outlines of three seminiferous tubule segments (white dotted lines) at different time points (t0 – t2). Aside the addition of a red fluorescent dye to the solution in the pipette, compositions of bath and pipette solution match. Note that puffs of stained solution (t1 and t2) cause neither contractions, nor Ca2+ signals.
Videos
Video 1
SMMHC-CreERT2 mice allow inducible TPC-specific expression of genetically encoded fluorescent reporter proteins.
After tamoxifen injections, SMMHC-CreERT2 x Ai14D male offspring express tdTomato (red) in both TPCs and vascular smooth muscle cells. Video shows the 3D reconstruction of an intact and cleared (CLARITY, Chung and Deisseroth, 2013) 6 × 3 × 1.5 mm testis sample with nuclei labeled by DRAQ5 (blue).
Video 2
Quasi-simultaneous recording of peritubular Ca2+ signals and seminiferous tubule movement.
A representative seminiferous tubule section (250 μm) is stimulated with ATP (100 µM, 10 s). After fura-2 bulk loading, ratiometric fluorescence imaging (f340/f380) reveals relative changes in Ca2+ concentration (rainbow color map; blue, low Ca2+; red, high Ca2+) in a peripheral band of putative TPCs at the tubule’s edge. Since each image acquisition cycle (1 Hz) captures two fluorescence (Exλ340; Exλ380) and one reflective light image (brightfield), time-lapse recordings allow parallel physiological phenotyping of both seminiferous tubule Ca2+ responses and movement (shown sequentially for clarity).
Video 3
Both ATP-induced seminiferous tubule Ca2+ responses and contractions are dose-dependent.
A representative seminiferous tubule section (250 μm; fura-2 bulk loading) is stimulated with increasing ATP concentrations (1–1000 µM, 10 s). Ratiometric fluorescence imaging (f340/f380) reveals relative changes in Ca2+ concentration (rainbow color map; blue, low Ca2+; red, high Ca2+) in putative TPCs. Quasi-simultaneous time-lapse recording of fluorescence (Exλ340; Exλ380) and brightfield (reflective light) images illustrates that both seminiferous tubule Ca2+ signals and contractions (shown sequentially for clarity) are dose-dependent and share an ATP threshold concentration of approximately 1 µM.
Video 4
ATP stimulation triggers movement of luminal content in intact seminiferous tubules.
Brightfield time-lapse recording of an intact isolated seminiferous tubule (field of view shows cycle stages II and III) challenged by brief focal ATP perfusion (100 µM, 10 s). The spatial extent of the stimulation zone had been defined by prior perfusion with a dye solution (fast green).
Video 5
ATP stimulation triggers transient Ca2+ signals in TPCs of intact seminiferous tubules.
Fluorescence time-lapse recording of an intact seminiferous tubule (field of view shows cycle stage II) isolated from a mouse selectively expressing GCaMP6f in TPCs (SMMHC-CreERT2 x Ai95D male offspring). Fluorescence imaging (∆F/F) during brief focal ATP perfusion (100 µM, 10 s) – the spatial extent of the stimulation zone had been defined by prior perfusion with a dye solution (food color) – reveals relative changes in TPC Ca2+ concentration (rainbow color map; blue, low Ca2+; red, high Ca2+).
Video 6
In vivo multiphoton microscopy demonstrates spontaneous Ca2+ signals in mouse TPCs.
Spontaneous seminiferous tubule in vivo activity monitored in SMMHC-CreERT2 x Ai95D mice. Intravital multiphoton fluorescence time-lapse imaging (∆F/F, 2 Hz) reveals coordinated changes in TPC Ca2+ concentration (rainbow color map; blue, low Ca2+; red, high Ca2+) among one of three seminiferous tubules in the field of view (591 µm x 591 µm).
Video 7
Coordinated contractile movements ensure luminal sperm transport in vivo.
Intravital en-face brightfield imaging illustrates spontaneous contractions and luminal movement in seminiferous tubules of adult mice. Low (1.5 x 1.4 mm field of view) and high-magnification time-lapse recordings reveal that contractions and luminal content propulsion are routinely observed in vivo. Note the unobstructed blood flow within testicular vessels.
Video 8
Focal ATP stimulation triggers peritubular Ca2+ signals and seminiferous tubule contractions in vivo.
Intravital multiphoton fluorescence time-lapse imaging in SMMHC-CreERT2 x Ai95D mice. Overlay of two detection channels (∆F/F, GCaMP6f, green; Alexa Fluor 555, red). Stimulus solution (containing Alexa Fluor 555 (4 µM) and ATP (1 mM)) is puffed from a glass micropipette, which penetrated the tunica albuginea to target the interstitial space. Changes in TPC Ca2+ concentration are color-coded (black, low Ca2+; green, high Ca2+). Note that typically such contractions / Ca2+ signals do not occur when ATP is omitted from the ‘puff’ solution (data not shown).
Tables
Key resources table
| Reagent type (species) or resource | Designation | Source or reference | Identifiers | Additional information | |
|---|---|---|---|---|---|
| Strain, strain background (M. musculus) | C57BL/6J | Charles River Laboratories | Jax # 000664, RRID:IMSR_JAX:000664 | ||
| Strain, strain background (M. musculus) | SMMHC-CreERT2 | Jackson Laboratories | Jax # 019079, RRID:IMSR_JAX:019079 | ||
| Strain, strain background (M. musculus) | 129S.FVB-Tg(Amh-cre)8815Reb/J | Jackson Laboratories | Jax # 007915, RRID:IMSR_JAX:007915 | ||
| Strain, strain background (M. musculus) | Ai95D | Jackson Laboratories | Jax # 028865, RRID:IMSR_JAX:028865 | Cre-dependent GCaMP6f expression | |
| Strain, strain background (M. musculus) | Ai14D | Jackson Laboratories | Jax # 007914, RRID:IMSR_JAX:007914 | Cre-dependent tdTomato expression | |
| primary cells (M. musculus) | testicular peritubular cells (TPC) | this paper | early passage number, Spehr laboratory (see: TPC culture) | ||
| primary cells (Homo sapiens) | testicular peritubular cells (TPC) | this paper | early passage number Albrecht et al., 2006, Mayerhofer laboratory | ||
| Biological sample (M. musculus) | seminiferous tubules | this paper | freshly isolated from Mus musculus, Spehr laboratory (see: Slice preparation) | ||
| Antibody | anti-actin, α-smooth muscle - FITC antibody (α-SMA-FITC); mouse, monoclonal | Millipore Sigma | cat # F3777, RRID:AB_476977 | (1:500) | |
| Sequence-based reagent | P2 receptors | this paper | PCR primers | table in methods section (see: Gene expression analysis), Spehr laboratory | |
| Commercial assay, kit | RevertAid H Minus kit | Thermo Fisher | cat # K1632 | ||
| Chemical compound, drug | soybean trypsin inhibitor (SBTI) | Sigma Aldrich | cat # T6522 | (100 µg/ml) | |
| Chemical compound, drug | fura-2/AM | Thermo Fisher Scientific | cat # F-1201 | (cell culture: 5 µM, tissue slices: 30 µM) | |
| Chemical compound, drug | ivermectin | Sigma Aldrich | cat # I8898 | (3 µM) | |
| Chemical compound, drug | suramin | Sigma Aldrich | cat # S2671 | (100 µM) | |
| Chemical compound, drug | cyclopiazonic-acid (CPA) | Tocris Bioscience | cat # 1235 | (90 µM) | |
| Software, algorithm | Imaris 8 | Bitplane | RRID:SCR_007370 | microscopy image analysis software | |
| Software, algorithm | custom-written MATLAB code | this paper | https://github.com/rwth-lfb/Fleck_Kenzler_et_al; Fleck, 2021; copy archived at swh:1:rev:88c8792860ddf09fd7da969fef6bf86c40441135 | contraction and Ca2+signal analysis, Merhof laboratory (see: Data analysis) | |
| Other | DAPI stain | Thermo Fisher Scientific | cat # D1306, RRID:AB_2629482 | (5 µg/ml) | |
| Other | DRAQ5 stain | Thermo Fisher Scientific | cat # 65-0880-96, RRID:AB_2869620 | (IH: 1:500 CLARITY: 1:1000) | |
Additional files
Download links
A two-part list of links to download the article, or parts of the article, in various formats.
Downloads (link to download the article as PDF)
Open citations (links to open the citations from this article in various online reference manager services)
Cite this article (links to download the citations from this article in formats compatible with various reference manager tools)
ATP activation of peritubular cells drives testicular sperm transport
eLife 10:e62885.
https://doi.org/10.7554/eLife.62885


