Bundle-specific associations between white matter microstructure and Aβ and tau pathology in preclinical Alzheimer’s disease
- Department of Psychiatry, Faculty of Medicine, McGill University, Canada
- Douglas Mental Health University Institute, Canada
- Sherbrooke Connectivity Imaging Laboratory (SCIL), Université de Sherbrooke, Canada
- Electrical Engineering, Vanderbilt University, United States
- McConnell Brain Imaging Centre, Montreal Neurological Institute, Canada
- Department of Neurology, Ludwig-Maximilians-Universität München, Germany
- German Center for Neurodegenerative Diseases (DZNE), Germany
- Department of Clinical Neuroscience, Osaka City University Medical School, Japan
- Department of Neurology, Asan Medical Center, University of Ulsan College of Medicine, Republic of Korea
- Department of Neurology, Indiana University, United States
- Neuroscience Research Australia, Australia
- School of Medical Sciences, UNSW Sydney, Australia
- Harvard Medical School, Massachusetts General Hospital, United States
- The Florey Institute of Neuroscience and Mental Health, University of Melbourne, Australia
- Knight Alzheimer Disease Research Center, Washington University School of Medicine, United States
- Department of Neurology, Washington University School of Medicine, United States
- Normandie Univ, UNICAEN, INSERM, U1237, Institut Blood and Brain @ Caen-Normandie, Cyceron, France
Figures
Figure 1
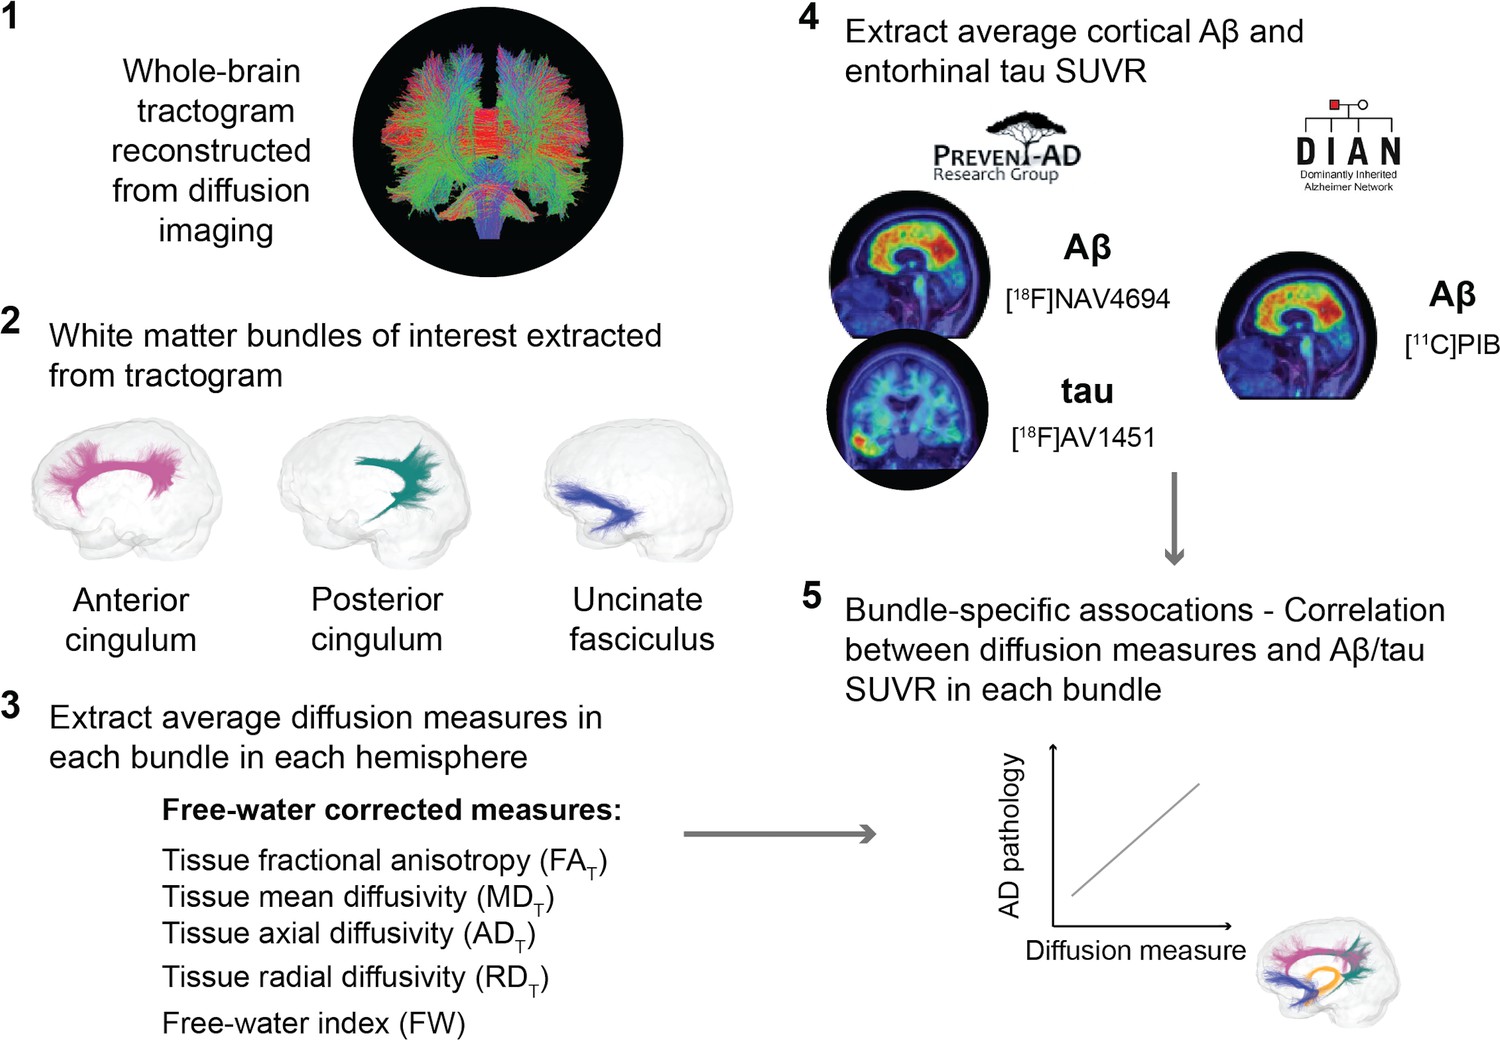
Overview of the processing steps.
PREVENT-AD and DIAN participants were processed following the same pipeline. Whole-brain tractogram was reconstructed using the TractoFlow Atlas-Based Segmentation pipeline, and automated bundle extraction tools were used to extract the bundles of interest in each hemisphere. Free-water-corrected tensor measures were calculated for each bundle. Associations between white matter microstructure and global Aβ and entorhinal tau PET were then investigated. Aβ: beta-amyloid; PET: positron emission tomography; SUVR: standardized uptake value ratio.
Figure 2
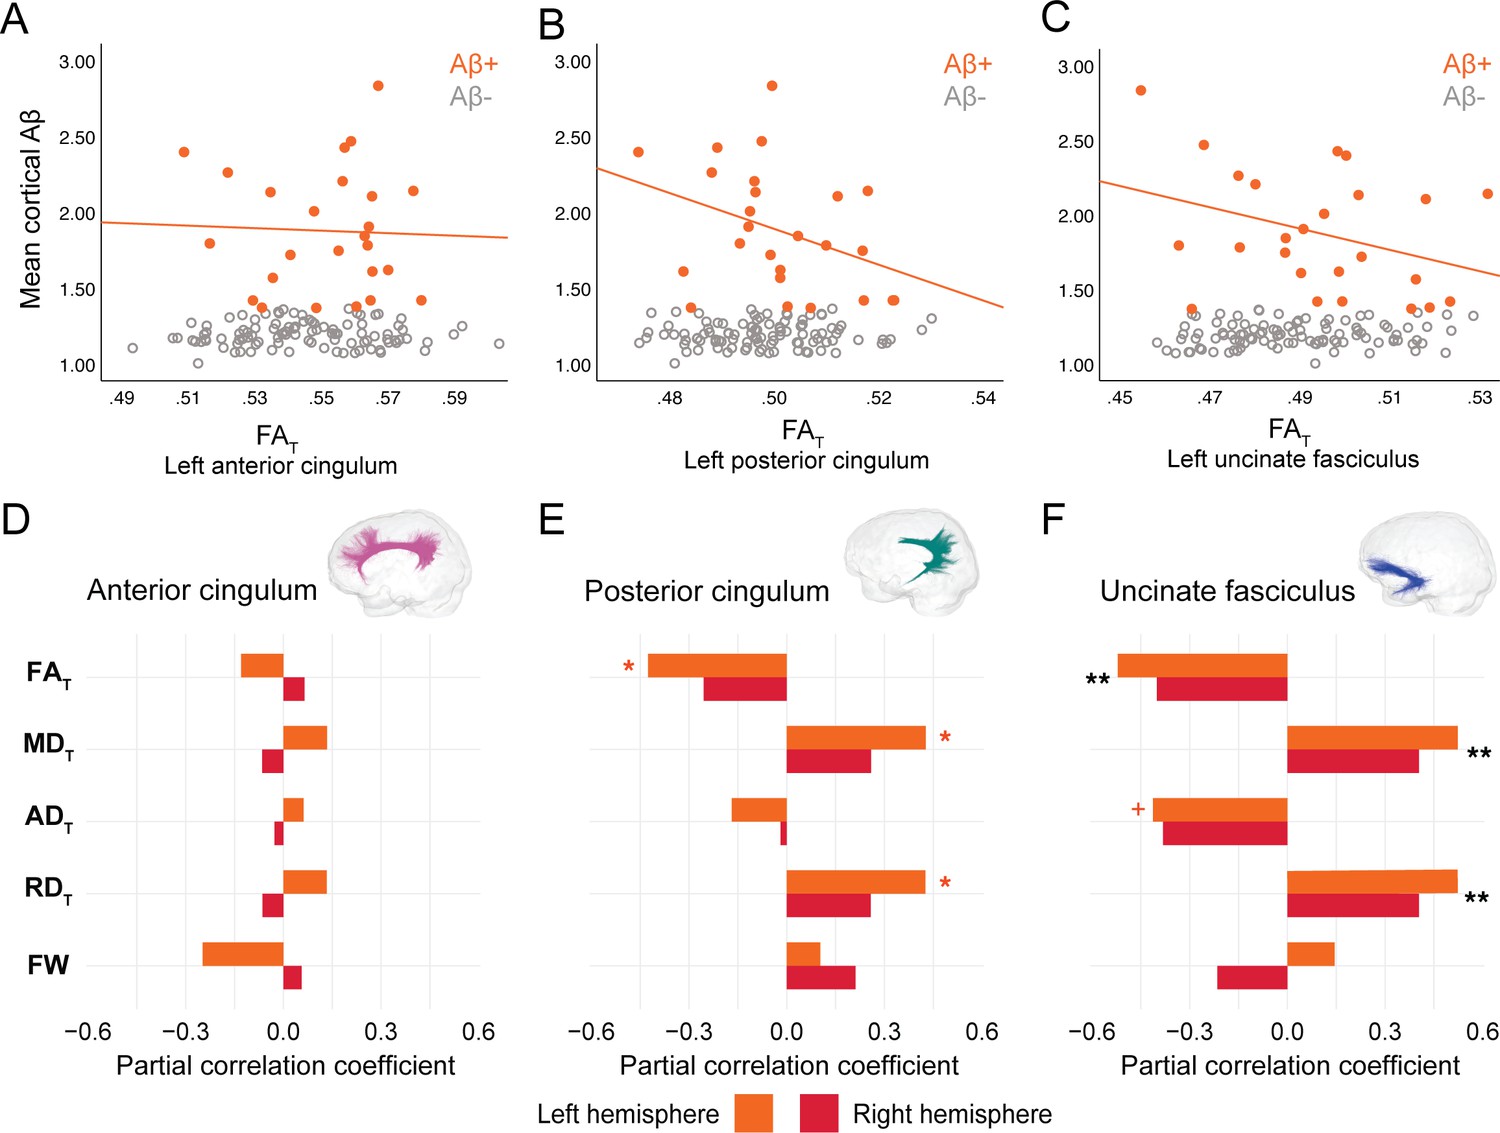
Associations between diffusion measures and Aβ burden in Aβ-positive PREVENT-AD participants.
(A–C) Bivariate associations between FAT and global cortical Aβ in each bundle in the left hemisphere to show examples of raw values in PREVENT-AD. Data are represented for the full sample, with Aβ-positive in orange (our group of interest) and Aβ-negative in gray. (D–F) Partial correlations between diffusion measures (average diffusion measure in the bundle) and global cortical Aβ-PET controlling for age, sex, and bundle volume (divided by total intracranial volume) were performed in PREVENT Aβ-positive participants. Partial correlation coefficient for each diffusion measure in the right and left bundles is reported as bar graphs. Black asterisks highlight that associations are significant in both hemispheres, otherwise the color of the symbol matches the hemisphere where the association is significant. *p=0.05; ** 0.05 > p > 0.001; +p=0.06. See also Figure 2—source data 1. Aβ: beta-amyloid; FAT: tissue fractional anisotropy; MDT: tissue mean diffusivity; ADT: tissue axial diffusivity; RDT: tissue radial diffusivity; FW: free-water index; PET: positron emission tomography.
-
Figure 2—source data 1
Associations between microstructure and beta-amyloid–positron emission tomography (Aβ-PET) in PREVENT-AD.
- https://cdn.elifesciences.org/articles/62929/elife-62929-fig2-data1-v2.docx
Figure 3
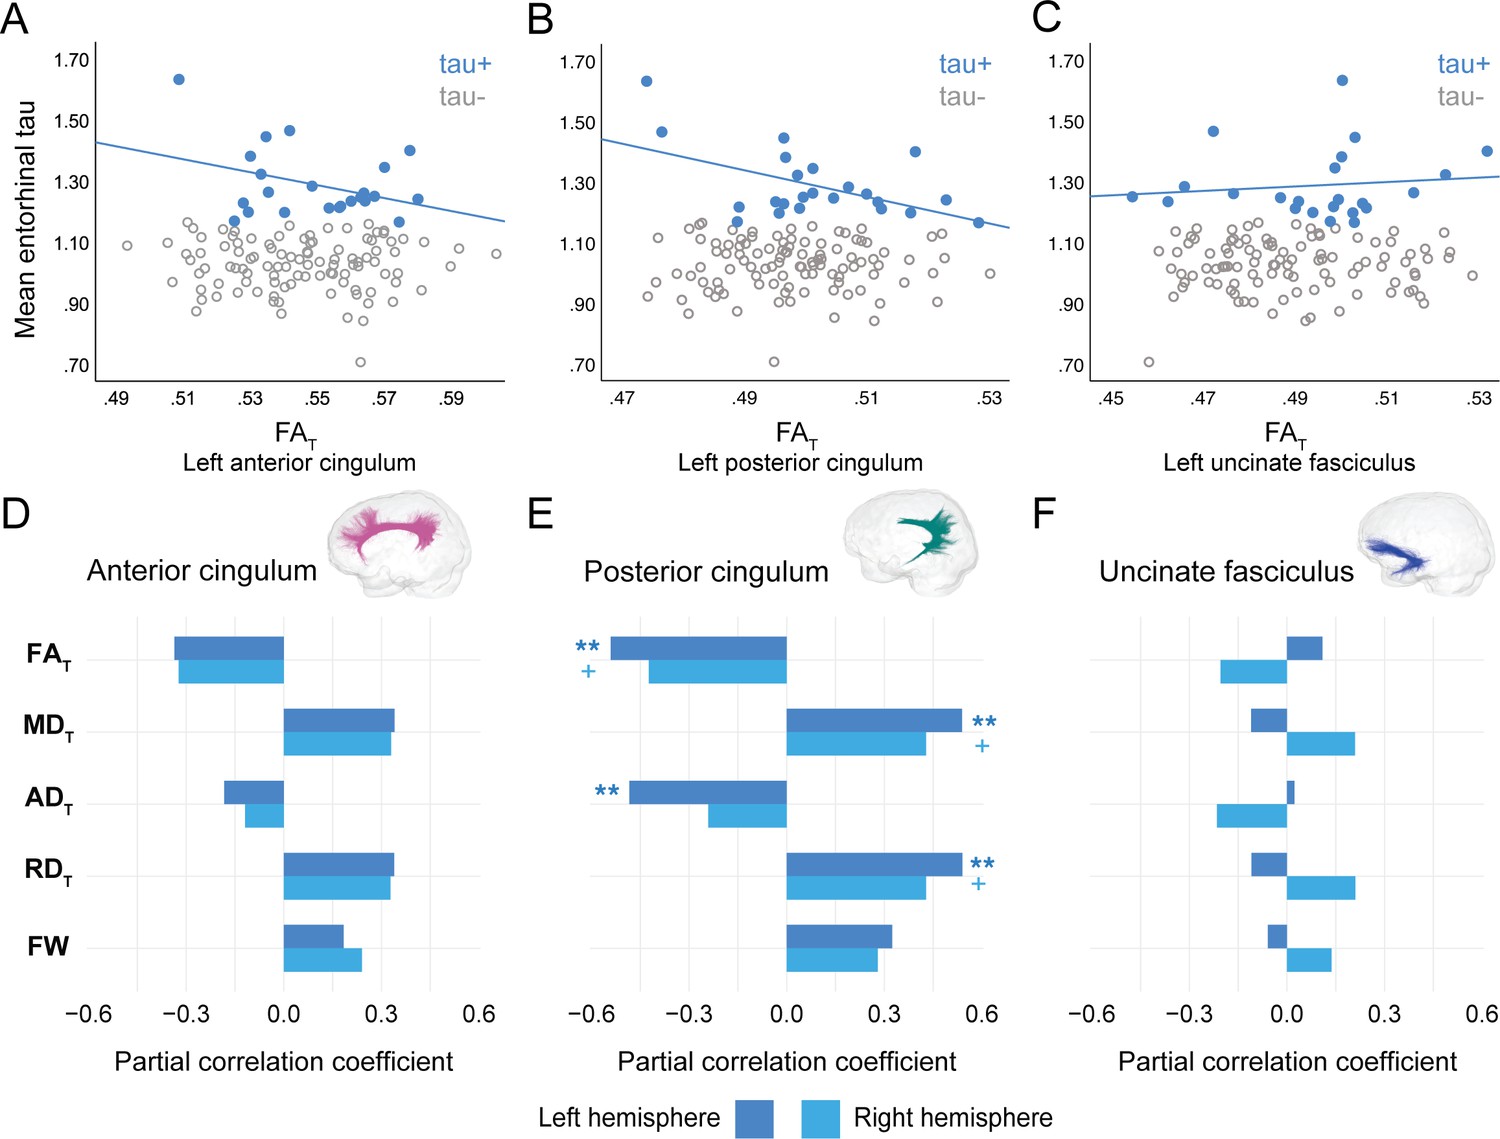
Associations between diffusion measures and entorhinal tau burden in tau-positive PREVENT-AD participants.
(A–C) Bivariate associations between FAT and entorhinal tau in each bundle in the left hemisphere to show examples of raw values in PREVENT-AD. Data are represented for the full sample, with tau-positive in blue (our group of interest) and tau-negative in gray. (D–F) Partial correlations between diffusion measures (average diffusion measure in the bundle) and entorhinal tau-PET controlling for age, sex, and bundle volume (divided by total intracranial volume) were performed in PREVENT tau-positive participants. Partial correlation coefficient for each diffusion measure in the right and left bundles is reported as bar graphs. The color of the symbol on the bar graphs matches the hemisphere where the association is significant. *p=0.05; ** 0.05 > p > 0.001; +p=0.06. See also Figure 3—source data 1. FAT: tissue fractional anisotropy; MDT: tissue mean diffusivity; ADT: tissue axial diffusivity; RDT: tissue radial diffusivity; FW: free-water index; PET: positron emission tomography.
-
Figure 3—source data 1
Associations between microstructure and tau-positron emission tomography (tau-PET) in PREVENT-AD.
- https://cdn.elifesciences.org/articles/62929/elife-62929-fig3-data1-v2.docx
Figure 4
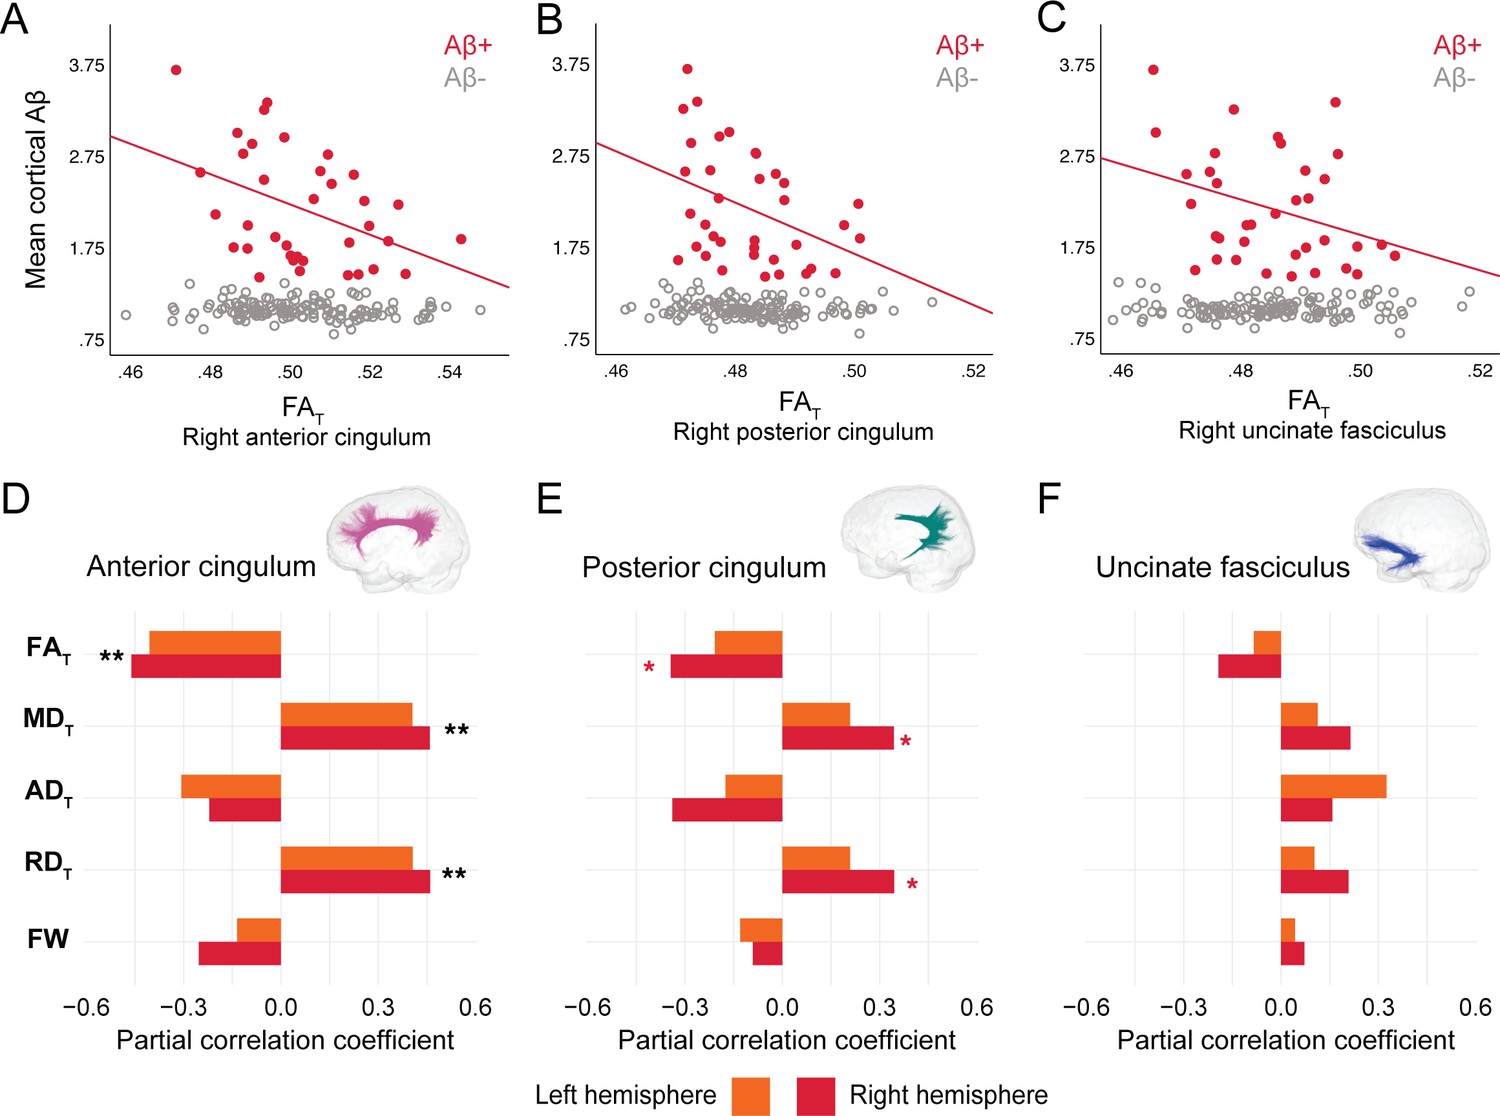
Associations between diffusion measures and Aβ burden in Aβ-positive DIAN mutation carriers.
(A–C) Bivariate associations between FAT and global cortical Aβ in each bundle in the left hemisphere to show examples of raw values in DIAN. Data are represented for the full sample, with Aβ-positive in red (our group of interest) and Aβ-negative in gray. (D–F) Partial correlations between diffusion measures (average diffusion measure in the bundle) and global cortical Aβ-PET controlling for age, sex, and bundle volume (divided by total intracranial volume) were performed in DIAN Aβ-positive participants. Partial correlation coefficient for each diffusion measure in the right and left bundles is reported as bar graphs. Black asterisks highlight that associations are significant in both hemispheres, otherwise the color of the symbol matches the hemisphere where the association is significant *p=0.05; ** 0.05 > p > 0.001. See also Figure 4—source data 1. Aβ: beta-amyloid; FAT: tissue fractional anisotropy; MDT: tissue mean diffusivity; ADT: tissue axial diffusivity; RDT: tissue radial diffusivity; FW: free-water index; PET: positron emission tomography.
-
Figure 4—source data 1
Associations between microstructure and beta-amyloid–positron emission tomography (Aβ-PET) in DIAN.
- https://cdn.elifesciences.org/articles/62929/elife-62929-fig4-data1-v2.docx
Tables
Table 1
Demographics.
| PREVENT-AD (n = 126) | DIAN mutation carriers (n = 81) | DIAN mutation non-carriers (n = 96) | |
|---|---|---|---|
| Age (years) | 67.3 ± 4.8 (68–83) | 34.5 ± 9.9 (18–61) | 39.3 ± 11.7 (19–69) |
| Sex F:M (%F) | 94:32 (75%) | 42:39 (52%) | 56:40 (58%) |
| APOE4 carriers (%) | 50 (40%) | 24 (30%) | 26 (27%) |
| Education (years) | 15.2 ± 3.3 (7–24) | 15.2 ± 3.0 (10–24) | 15.1 ± 2.7 (10–26) |
| Handedness (n, % right-handed) | 114 (90%) | 69 (85%) | 82 (85%) |
| Systolic blood pressure | 129.0 ± 13.8 (100–164) | 122.5 ± 10.2 (95–155) | 123.5 ± 17.1 (90–190) |
| Diastolic blood pressure | 74.0 ± 8.1 (60–96) | 75.2 ± 8.8 (55–104) | 77.1 ± 10.1 (60–110) |
| Global Aβ SUVR* | 1.3 ± 0.3 (1.0–2.8) | 1.6 ± 0.7 (0.8–3.7) | 1.0 ± 0.1 (0.9–1.3) |
| Aβ-positive (%) | 24 (19%) | 35 (43%) | 0 (0%) |
| Entorhinal tau SUVR | 1.1 ± 0.1 (0.7–1.6) | NA | NA |
| Mini-Mental State Examination | 28.8 ± 1.2 (24–30) | 29.0 ± 1.3 (24–30) | 29.2 ± 1.2 (25–30) |
| Estimated years to symptom onset† | −5.7 ± 7.6 (−20.8 to 16.8) | −13.6 ± 8.3 (−31.5 to 11.8) | −7.4 ± 12.5 (−28.8 to 21.4) |
-
Values represent Mean ± SD (range). Participants with at least one ε4 allele were considered APOE4 positive. The Mini-Mental State Evaluation was administered at the same time as PET.
* Note that NAV4694 was used in PREVENT-AD and PIB was used in DIAN.
-
† Estimated years to symptom onset was calculated as the parent’s age at dementia onset minus the age of the participant; four missing values in PREVENT-AD.
Aβ: beta-amyloid; APOE: apolipoprotein E; SUVR: standardized uptake value ratio; PET: positron emission tomography.
Table 2
Associations between gray matter volume and Aβ- and tau-PET in PREVENT-AD and DIAN.
| PREVENT-AD Aβ-positive | PREVENT-AD Tau-positive | DIAN Aβ-positive | ||||
|---|---|---|---|---|---|---|
| Rpartial | p-value | Rpartial | p-value | Rpartial | p-value | |
| Left hemisphere | ||||||
| Anterior cingulate | −0.239 | 0.271 | 0.032 | 0.891 | −0.207 | 0.248 |
| Posterior cingulate | −0.116 | 0.598 | −0.156 | 0.5 | −0.252 | 0.156 |
| Precuneus | −0.265 | 0.221 | −0.439 | 0.047 | −0.307 | 0.082 |
| Parahippocampal gyrus | 0.114 | 0.605 | −0.073 | 0.753 | 0.079 | 0.661 |
| Medial orbitofrontal cortex | −0.468 | 0.024 | −0.197 | 0.392 | −0.174 | 0.334 |
| Right hemisphere | ||||||
| Anterior cingulate | −0.335 | 0.118 | −0.085 | 0.713 | −0.133 | 0.461 |
| Posterior cingulate | −0.342 | 0.111 | −0.546 | 0.01 | −0.352 | 0.045 |
| Precuneus | −0.468 | 0.024 | −0.491 | 0.024 | −0.287 | 0.105 |
| Parahippocampal gyrus | 0.014 | 0.948 | −0.213 | 0.355 | 0.16 | 0.373 |
| Medial orbitofrontal cortex | −0.358 | 0.093 | −0.237 | 0.301 | 0.014 | 0.94 |
-
Rpartial and p-values from regression models investigating associations between gray matter volume (divided by total intracranial volume; independent variable) and pathology (dependent variable) in Aβ-positive or tau-positive participants in PREVENT-AD and DIAN. Models included age and sex as covariates.
Aβ: beta-amyloid; PET: positron emission tomography.
Table 3
Associations between typical tensor measures and Aβ- and tau-PET in PREVENT-AD and DIAN.
| PREVENT-AD | ||||||
|---|---|---|---|---|---|---|
| Aβ-positive | ||||||
| Anterior cingulum | Posterior cingulum | Uncinate fasciculus | ||||
| Rpartial | p-value | Rpartial | p-value | Rpartial | p-value | |
| Left hemisphere | ||||||
| FA | −0.128 | 0.571 | −0.429 | 0.046 | −0.526 | 0.012 |
| MD | 0.022 | 0.923 | 0.18 | 0.424 | 0.32 | 0.147 |
| AD | −0.106 | 0.637 | −0.315 | 0.153 | −0.305 | 0.168 |
| RD | 0.081 | 0.721 | 0.305 | 0.168 | 0.448 | 0.037 |
| Right hemisphere | ||||||
| FA | −0.021 | 0.927 | −0.3 | 0.175 | −0.566 | 0.006 |
| MD | −0.048 | 0.831 | 0.131 | 0.56 | 0.078 | 0.729 |
| AD | −0.067 | 0.766 | −0.102 | 0.651 | −0.381 | 0.08 |
| RD | −0.019 | 0.931 | 0.221 | 0.322 | 0.344 | 0.116 |
| Tau-positive | ||||||
| Anterior cingulum | Posterior cingulum | Uncinate fasciculus | ||||
| Rpartial | p-value | Rpartial | p-value | Rpartial | p-value | |
| Left hemisphere | ||||||
| FA | −0.465 | 0.039 | −0.523 | 0.018 | 0.108 | 0.65 |
| MD | 0.511 | 0.021 | 0.396 | 0.084 | 0.054 | 0.821 |
| AD | 0.112 | 0.639 | 0.082 | 0.731 | 0.206 | 0.384 |
| RD | 0.546 | 0.013 | 0.465 | 0.039 | −0.014 | 0.953 |
| Right hemisphere | ||||||
| FA | −0.461 | 0.041 | −0.487 | 0.029 | −0.399 | 0.081 |
| MD | 0.416 | 0.068 | 0.372 | 0.106 | 0.211 | 0.372 |
| AD | 0.012 | 0.959 | 0.157 | 0.508 | −0.011 | 0.965 |
| RD | 0.495 | 0.027 | 0.444 | 0.05 | 0.311 | 0.182 |
| DIAN | ||||||
| Aβ-positive | ||||||
| Anterior cingulum | Posterior cingulum | Uncinate fasciculus | ||||
| Rpartial | p-value | Rpartial | p-value | Rpartial | p-value | |
| Left hemisphere | ||||||
| FA | −0.373 | 0.035 | −0.192 | 0.293 | −0.031 | 0.868 |
| MD | 0.15 | 0.413 | −0.051 | 0.783 | −0.015 | 0.935 |
| AD | −0.196 | 0.283 | −0.226 | 0.213 | −0.067 | 0.716 |
| RD | 0.318 | 0.076 | 0.049 | 0.79 | 0.021 | 0.91 |
| Right hemisphere | ||||||
| FA | −0.452 | 0.009 | −0.4 | 0.023 | −0.35 | 0.049 |
| MD | 0.122 | 0.505 | −0.002 | 0.991 | 0.108 | 0.558 |
| AD | −0.239 | 0.188 | −0.219 | 0.229 | −0.098 | 0.595 |
| RD | 0.335 | 0.061 | 0.146 | 0.426 | 0.209 | 0.251 |
-
Rpartial and p-values from regression models investigating associations between each tensor measure (average diffusion measure in the bundle; independent variable) and pathology (dependent variable) in PREVENT-AD Aβ-positive or tau-positive participants and DIAN Aβ-positive participants. Models included age, sex, bundle volume (divided by total intracranial volume) as covariates.
Aβ: beta-amyloid; FA: fractional anisotropy; MD: mean diffusivity; AD: axial diffusivity; RD: radial diffusivity; PET: positron emission tomography.
Additional files
Download links
A two-part list of links to download the article, or parts of the article, in various formats.
Downloads (link to download the article as PDF)
Open citations (links to open the citations from this article in various online reference manager services)
Cite this article (links to download the citations from this article in formats compatible with various reference manager tools)
Bundle-specific associations between white matter microstructure and Aβ and tau pathology in preclinical Alzheimer’s disease
eLife 10:e62929.
https://doi.org/10.7554/eLife.62929


