Social groups buffer maternal loss in mountain gorillas
- Dian Fossey Gorilla Fund, Rwanda
- Centre for Research in Animal Behaviour, University of Exeter, United Kingdom
- Department of Mathematics and Computer Science, University of Southern Denmark, Denmark
- Interdisciplinary Center on Population Dynamics, University of Southern Denmark, Denmark
Figures
Figure 1 with 1 supplement

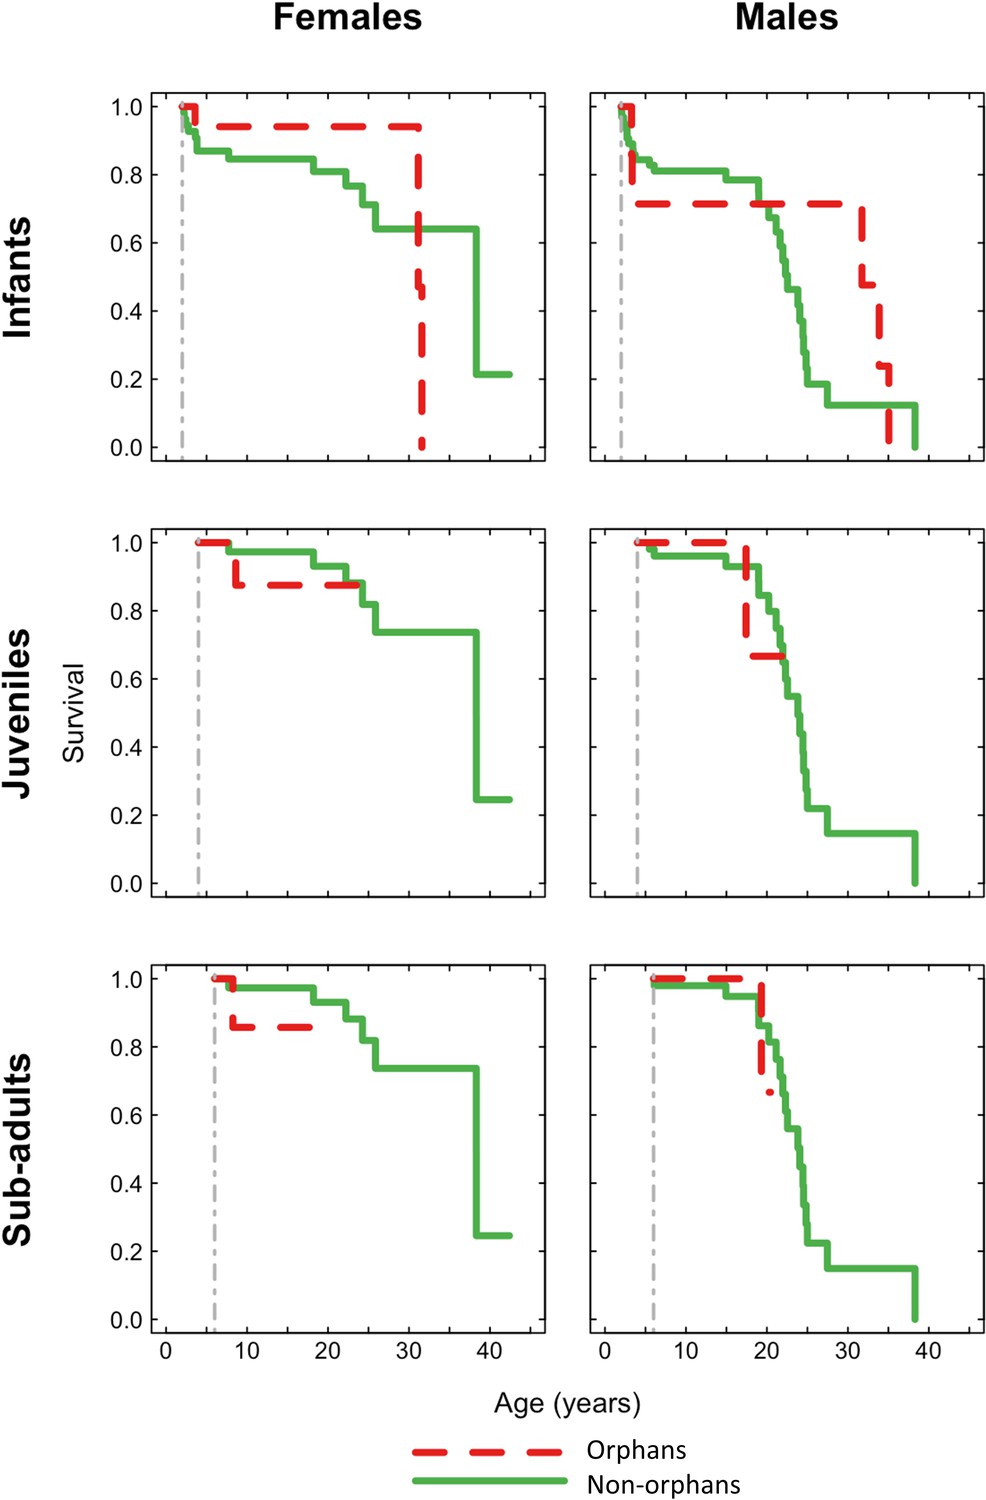
Survivorship curves for each of the four maternal loss categories for each sex.
Plots show the proportion of surviving (a) females (n = 98) and (b) males (n = 102) that suffered maternal loss as infants, juveniles, and subadults compared to non-orphans that did not suffer maternal loss under the age of 8 years. Figure 1—figure supplement 1 shows survivorship curves of each orphan age and sex class plotted separately against non-orphans for further clarity. Grey dashed line indicates the age from which orphan and non-orphan survival are modelled separately.
Figure 1—figure supplement 1
Orphan survivorship curves separated by age and sex class.
Figure 2 with 1 supplement
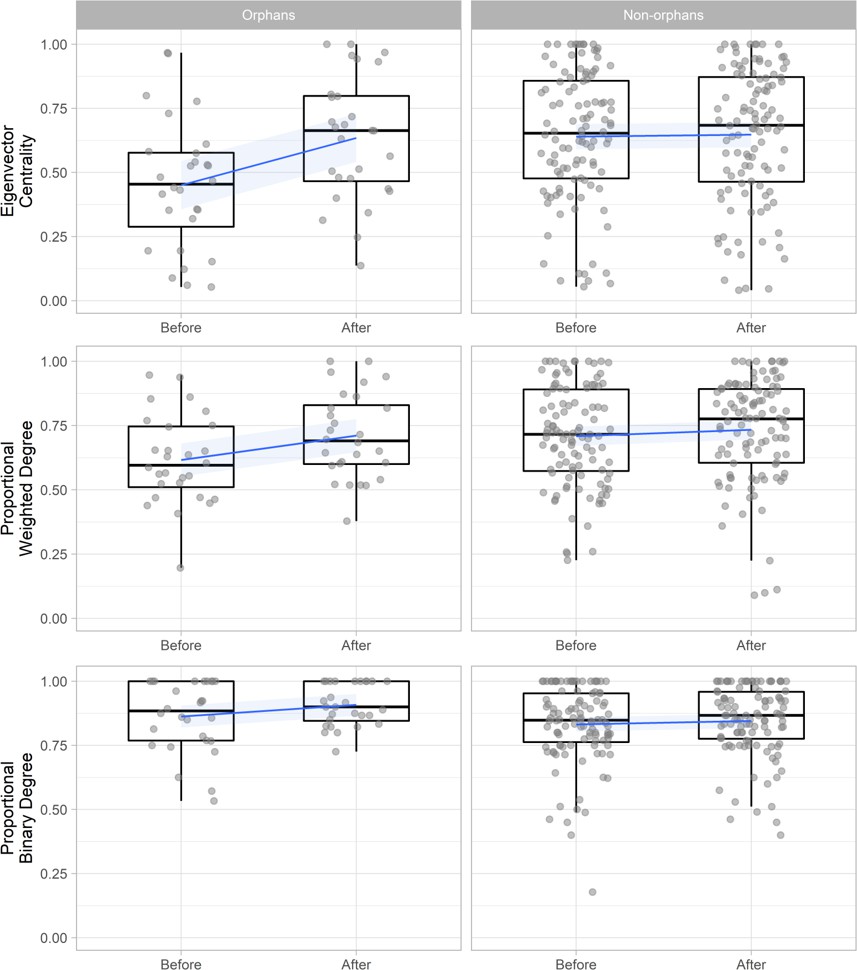
The change in proximity-based social network position (eigenvector centrality, weighted degree, and binary degree) for orphaned (n = 28) and non-orphaned immature gorillas (n = 108) within the same group in the 6 months before an incident of maternal loss and the 6 months after.
Weighted degree and binary degree values are calculated as proportions of the greatest value observed within their specific network to enable comparison across multiple networks (multiple incidents of maternal loss). Networks include only individuals that were present both before and after maternal loss and therefore exclude the mothers of orphans. Blue lines and shading indicate mean and 95% confidence interval. Figure 2—figure supplement 1 shows the change in affiliative contact-based social network position. Source data available in file: ‘Figure 2—source data 1’.
-
Figure 2—source data 1
Changes in the network position of orphaned and non-orphaned immature gorillas following an incident of maternal loss.
- https://cdn.elifesciences.org/articles/62939/elife-62939-fig2-data1-v1.xlsx
Figure 2—figure supplement 1
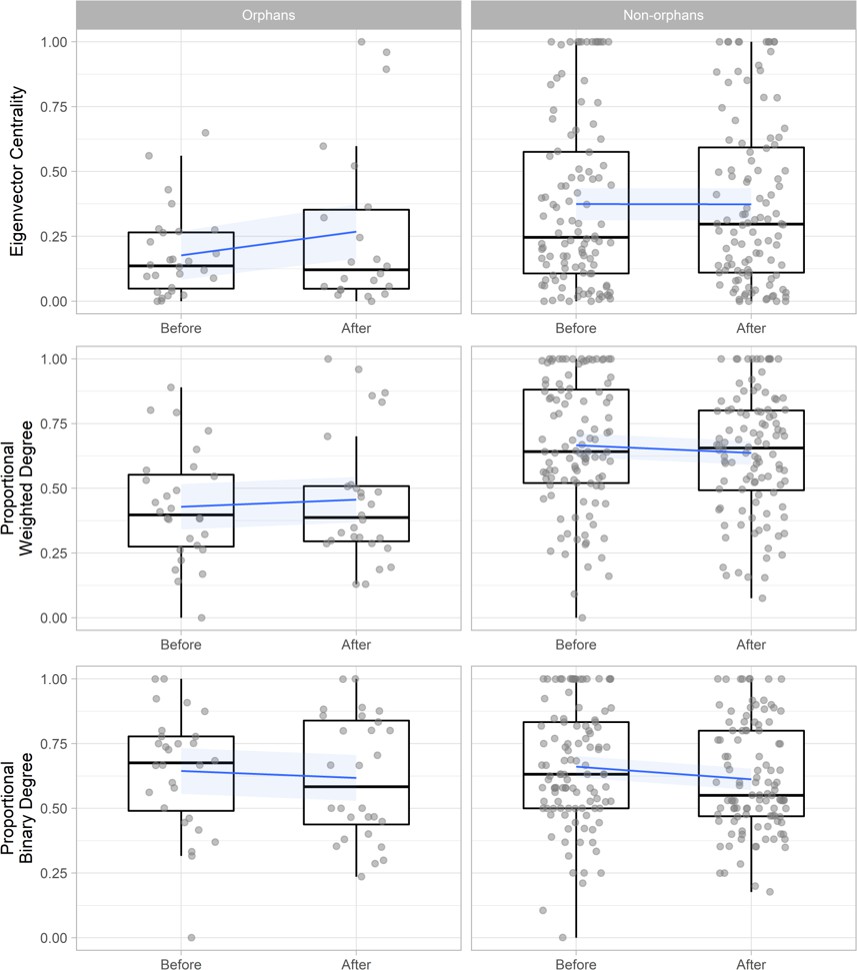
The change in affiliative contact-based social network position (eigenvector centrality, proportional weighted degree, and proportional binary degree) for orphaned and non-orphaned immature gorillas within the same group in the 6 months before an incident of maternal loss and the 6 months after. Blue lines and shading indicate mean and 95% confidence interval.
Figure 3 with 2 supplements
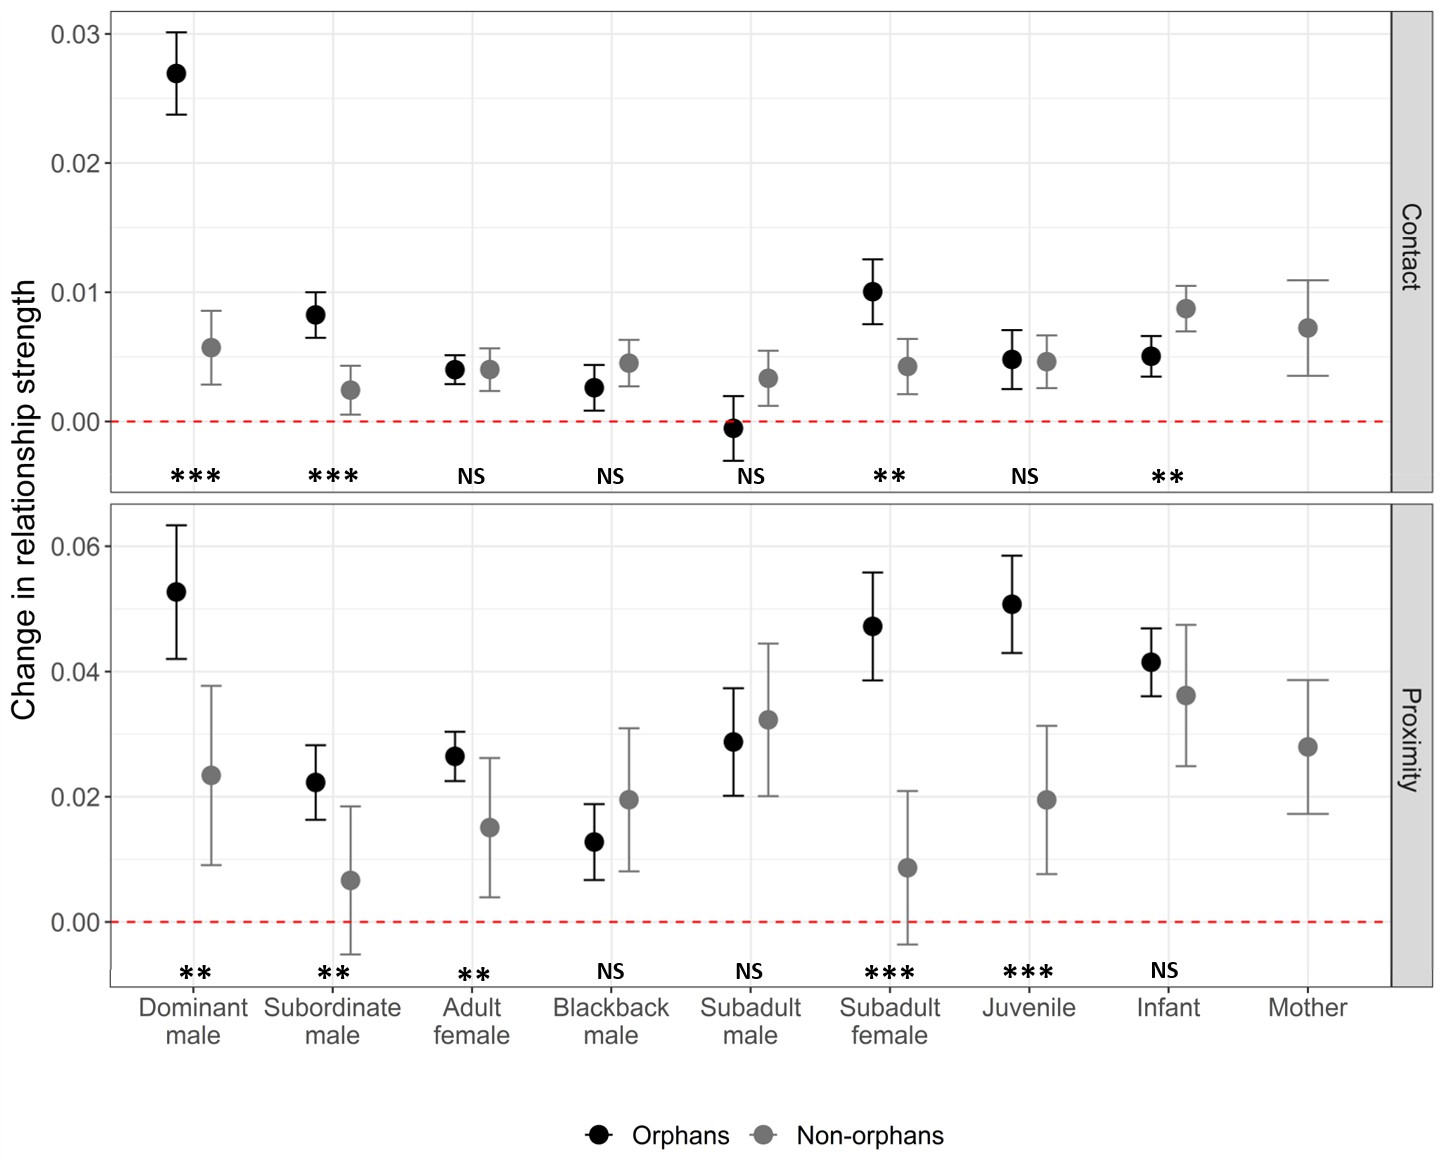
The change in relationship strength (SRI) between immature gorillas and other group members in both affiliative contact and proximity, between the 6 months prior to an incident of maternal loss and the 6 months post-maternal loss (n relationships = 3592, orphaned immature gorillas = 31, non-orphaned immature gorillas = 51).
Black points show values for orphans, and grey points show values for immature gorillas within the same group that did not suffer maternal loss. Error bars indicate the standard error. Dashed red line indicates no change in relationship strength. NS indicates no significant difference between orphan and non-orphan changes in relationship strength, * indicates significance at <0.05, ** indicates significance at <0.01, and *** indicates significance at <0.001. Exact p-values (L to R), contact: <0.001, 0.001, 0.997, 0.280, 0.122, 0.021, 0.941, 0.019; proximity: 0.006, 0.009, 0.004, 0.265, 0.680, <0.001, <0.001, 0.328. Source data available in file: ‘Figure 3—source data 1’. Figure 3—figure supplement 1 shows the change in relationship strength between orphans and group members that were their maternal siblings (dark blue) and those that were not (light blue) after maternal loss based on (A) affiliative contact and (B) proximity. Figure 3—figure supplement 2 shows the change in relationship strength between orphans and dominant and subordinate adult male group members by kinship after maternal loss based on (A) affiliative contact and (B) proximity.
-
Figure 3—source data 1
Changes in dyadic relationship strengths following an incident of maternal loss within a gorilla group.
- https://cdn.elifesciences.org/articles/62939/elife-62939-fig3-data1-v1.xlsx
Figure 3—figure supplement 1
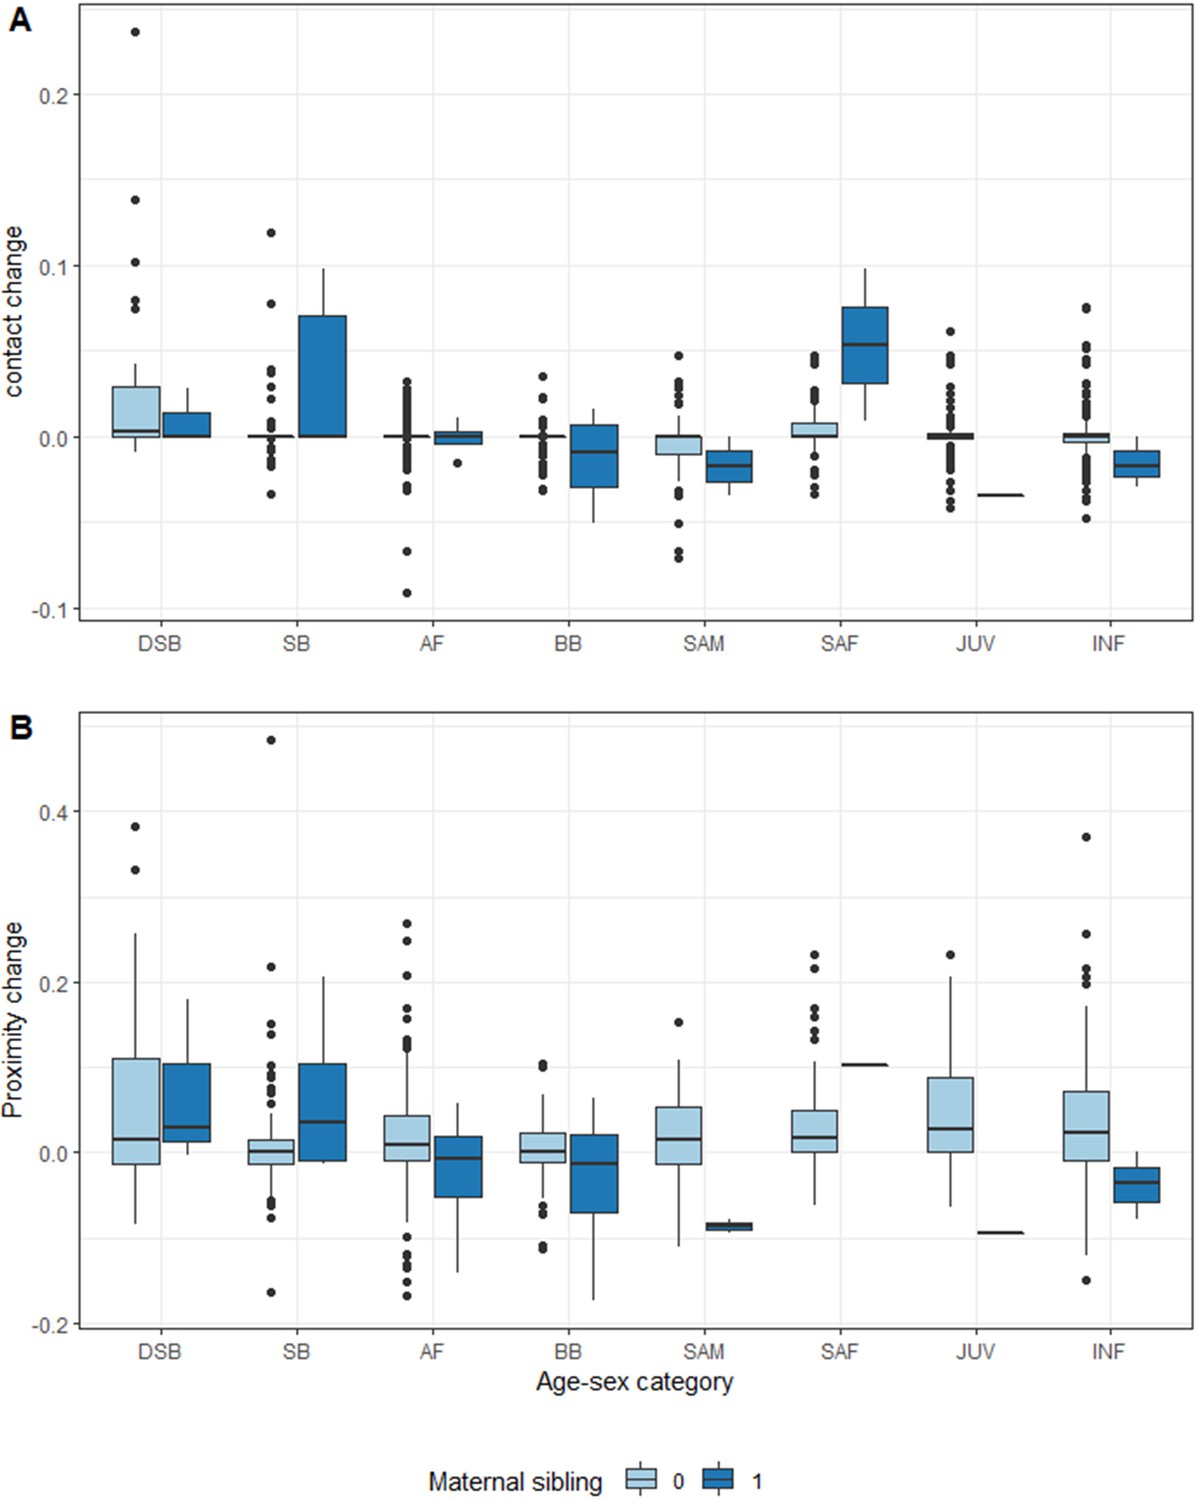
The change in relationship strength between orphans and group members that were their maternal siblings (dark blue) and those that were not (light blue) after maternal loss based on (A) affiliative contact and (B) proximity.
DSB: dominant silverback male, SB: subordinate silverback male, AF: adult female, BB: blackback male, SAM: subadult male, SAF: subadult female, JUV: juvenile, INF: infant.
Figure 3—figure supplement 2

Change in relationship strength between orphans and dominant and subordinate adult male group members by kinship after maternal loss based on (A) affiliative contact and (B) proximity.
Tables
Table 1
Cox-proportional hazards models showing the effects of the four maternal loss categories: infants, juveniles, subadults, and non-orphans, for each sex (98 females and 102 males), on survival.
All results are relative to the non-orphan class.
| Females | Males | ||||
|---|---|---|---|---|---|
| Age-class | Est ± SE | p | Est ± SE | p | |
| Infants | 0.73 ± 0.592 | 0.218 | −0.34 ± 0.551 | 0.540 | |
| Juveniles | 1.22 ± 1.170 | 0.298 | 0.05 ± 1.060 | 0.959 | |
| Subadults | 1.77 ± 1.240 | 0.152 | 0.59 ± 1.110 | 0.591 | |
Table 2
Deviance information criterion (DIC) for the three models tested.
(a) No covariates (i.e. null model where all individuals have the same hazard rate); (b) proportional hazards (where mortality differs proportionally between orphan classes); (c) covariates modifying all Siler mortality parameters (where each orphan class has a different age-specific mortality), for each sex (98 females and 102 males). The delta DIC shows the difference in DIC from the model with lowest DIC.
| Females | Males | |||
|---|---|---|---|---|
| Model | DIC | Δ DIC | DIC | Δ DIC |
| No covariates | 371.46 | 0 | 486.08 | 0 |
| Prop. hazards | 374.16 | 2.71 | 486.44 | 0.36 |
| All mortality parameters | 377.04 | 5.59 | 499.46 | 13.38 |
Table 3
The influence of age at maternal loss (infant or juvenile/subadult (J/SA)) relative to non-orphans on a female’s decision to disperse from their natal group prior to their first birth and a male’s decision to disperse prior to the age of 16, modelled using binomial generalized linear models.
| Females (n = 51) | Males (n = 53) | |||||
|---|---|---|---|---|---|---|
| Est ± SE | T | P | Est ± SE | T | p | |
| Intercept | −0.511 ± 0.365 | −1.399 | 0.162 | −0.511 ± 0.327 | −1.564 | 0.118 |
| Infant | 0.693 ± 0.707 | 0.980 | 0.327 | - | - | - |
| J/SA | 1.609 ± 0.894 | 1.799 | 0.072 | 2.216 ± 0.835 | 2.653 | 0.008 |
Table 4
The percentage of gorilla orphans for which their mother was their closest social partner prior to maternal loss based on affiliative contact and proximity within 2 m.
| Contact | Proximity | |
|---|---|---|
| Infants (n = 9) | 89% | 78% |
| Juveniles (n = 14) | 86% | 79% |
| Subadults (n = 8) | 25% | 75% |
Table 5
GAMMs predicting the change in dyadic relationship strength (SRI values for affiliative contact and proximity) between orphans (O) and other group members (GM) following maternal loss (n = 755).
| Affiliative contact | Proximity | |||||
|---|---|---|---|---|---|---|
| Est ± SE | Z | p | Est ± SE | Z | p | |
| Intercept | 0.028 ± 0.005 | 5.508 | <0.001 | 0.058 ± 0.018 | 3.180 | 0.002 |
| Orphan | ||||||
| Age (years) | −0.001 ± 0.000 | −1.640 | 0.101 | −0.004 ± 0.002 | −2.033 | 0.042 |
| Sex (male) | 0.000 ± 0.002 | −0.034 | 0.973 | −0.003 ± 0.006 | −0.503 | 0.615 |
| Group member | ||||||
| Age-mate (within 2 years) | −0.001 ± 0.002 | −0.623 | 0.534 | 0.020 ± 0.007 | 2.885 | 0.004 |
| Maternal sibling | −0.014 ± 0.011 | −1.305 | 0.192 | 0.010 ± 0.037 | 0.284 | 0.777 |
| Group member age/sex class (relative to a dominant male) | ||||||
| Adult male (subordinate) | −0.023 ± 0.005 | −4.911 | <0.001 | −0.033 ± 0.017 | −1.973 | 0.049 |
| Adult female | −0.024 ± 0.005 | −5.083 | <0.001 | −0.016 ± 0.017 | −0.959 | 0.338 |
| Blackback male | −0.023 ± 0.005 | −4.731 | <0.001 | −0.032 ± 0.018 | −1.782 | 0.075 |
| Subadult male | −0.026 ± 0.005 | −4.801 | <0.001 | −0.021 ± 0.020 | −1.038 | 0.299 |
| Subadult female | −0.018 ± 0.005 | −3.205 | 0.001 | −0.003 ± 0.020 | −0.151 | 0.880 |
| Juvenile | −0.021 ± 0.005 | −3.930 | <0.001 | −0.002 ± 0.019 | −0.124 | 0.902 |
| Infant | −0.021 ± 0.005 | −4.224 | <0.001 | −0.006 ± 0.018 | −0.334 | 0.738 |
| Age/sex class–sibling interaction (relative to a non-sibling dominant male) | ||||||
| Adult male (sub.) sibling | 0.041 ± 0.013 | 3.210 | 0.001 | 0.052 ± 0.043 | 1.231 | 0.219 |
| Adult female sibling | 0.015 ± 0.014 | 1.016 | 0.310 | −0.048 ± 0.048 | −0.986 | 0.324 |
| Blackback male sibling | 0.004 ± 0.015 | 0.243 | 0.808 | −0.044 ± 0.049 | −0.896 | 0.371 |
| Subadult male sibling | 0.001 ± 0.017 | 0.042 | 0.966 | −0.107 ± 0.057 | −1.876 | 0.061 |
| Subadult female sibling | 0.058 ± 0.017 | 3.387 | 0.001 | 0.011 ± 0.058 | 0.197 | 0.844 |
| Juvenile sibling | −0.020 ± 0.021 | −0.955 | 0.340 | −0.118 ± 0.072 | −1.643 | 0.101 |
| Infant sibling | −0.004 ± 0.015 | −0.282 | 0.778 | −0.096 ± 0.052 | −1.850 | 0.065 |
-
Smooth term: s(mean focal scans) Contact: F = 6.955, p=0.008; Proximity: F = 7.288, p<0.001.
-
Table 5—source data 1
Model: relationship change ~ age_O + sex_O + age mate + age sex class_GM * sibling + s(MeanDen), random = ~(Group|ID_O) + (1|ID_GM).
- https://cdn.elifesciences.org/articles/62939/elife-62939-table5-data1-v1.xlsx
Additional files
-
Supplementary file 1
Supplementary Tables 1–7 including analyses with merged juvenile and subadult orphan classes, information on group composition, and sampling at each incident of maternal loss and GAMMs predicting the change in both orphan and non-orphan network position and social relationships.
- https://cdn.elifesciences.org/articles/62939/elife-62939-supp1-v1.docx
-
Transparent reporting form
- https://cdn.elifesciences.org/articles/62939/elife-62939-transrepform-v1.docx
Download links
A two-part list of links to download the article, or parts of the article, in various formats.
Downloads (link to download the article as PDF)
Open citations (links to open the citations from this article in various online reference manager services)
Cite this article (links to download the citations from this article in formats compatible with various reference manager tools)
Social groups buffer maternal loss in mountain gorillas
eLife 10:e62939.
https://doi.org/10.7554/eLife.62939


