The actin-modulating protein synaptopodin mediates long-term survival of dendritic spines
- Institute of Clinical Neuroanatomy, Dr. Senckenberg Anatomy, Neuroscience Center, Goethe University Frankfurt, Germany
- Croatian Institute for Brain Research, School of Medicine, University of Zagreb, Croatia
Figures
Figure 1

SP is associated with large granule cell spines in adult mouse dentate gyrus.
(A) Granule cell located in the suprapyramidal blade of the dentate gyrus of a SP-knock-out (SP-KO) mouse intracellularly filled with the fluorescent dye Alexa568 (magenta; fixed tissue). Dendritic segments in the outer molecular layer (OML) were used for analysis. MML, middle molecular layer; IML, inner molecular layer; GCL, granule cell layer; HF, hippocampal fissure. Scale bar = 20 µm; Maximum intensity projection of a deconvolved z-stack. (B) Dendritic segment of a SP-KO granule cell shown at higher magnification. Scale bar = 1 µm; Maximum intensity projection of a deconvolved z-stack. (C) Spine head sizes of wildtype (WT) and SP-KO mice. n.s., not significant; p = 0.291, Mann–Whitney U-test. WT mice and SP-KO mice, n = 8 per group (three dendritic segments per animal; 1885 WT spines, 2158 SP-KO spines). (D) Cumulative frequency plots of spine head sizes of wildtype (grey) and SP-KO (green) mice. (E) Dendritic segment of a granule cell located in the suprapyramidal blade of the dentate gyrus of a Thy1-eGFP-SP-transgenic mouse bred on a SP-KO background (eGFP-SP-tg mouse) intracellularly filled with Alexa568 (magenta; fixed tissue; OML). Arrowheads point to eGFP-SP clusters (green) in SP-positive (SP+) dendritic spines. Arrows mark SP-negative (SP-) spines. Scale bar = 1 µm; Maximum intensity projection of a deconvolved z-stack. (F) Fractions of SP− (~86.5%) and SP+ (~13.5%) spines. **p<0.0022, Mann–Whitney U-test. eGFP-SP-tg mice, n = 6. (G) Mean spine head size of SP− (~0.133 µm2) and SP+ (~0.328 µm2) spines. ***p<0.0001, Mann–Whitney U-test. SP+ spines n = 200; SP− spines n = 1497. (H) Cumulative frequency plots of spine head sizes of SP− (blue) and SP+ (red) spines. SP+ spines n = 200; SP− spines n = 1497. (I) Correlation analysis of spine head size and SP cluster size: Spearman coefficient of correlation = 0.536, 95% C.I.: 0.426–0.630. ***p<0.0001. Linear regression analysis: R2 = 0.451. n = 200 spines.
Figure 2 with 3 supplements

SP in dendritic spines of granule cells in organotypic tissue cultures of hippocampus.
(A) Granule cells in organotypic entorhino-hippocampal tissue cultures (OTCs) of eGFP-SP-tg (green) mice were virally transduced (AAV2) with tdTomato (magenta) at day in vitro (DIV) 2–3. Dendritic segments located in the middle molecular layer (MML) or in the outer molecular layer (OML) were imaged. GCL, granule cell layer; IML, inner molecular layer. Scale bar = 20 µm; Maximum intensity projection of a deconvolved z-stack. (B) Single plane 2-photon image of a granule cell dendrite in the OML. Arrowheads point to SP+ spines; arrows indicate SP− spines. Scale bar = 1 µm. (C) Electron micrograph of a SP+ spine (arrowhead) containing an immunolabeled spine apparatus in an OTC from an eGFP-SP-tg mouse. Scale bar = 0.2 µm. (D) SP-mRNA levels in micro-dissected granule cell layers (GCL; upper panel) from OTCs of eGFP-SP-tg and C57BL/6J (BL6) wildtype mice were not significantly different (lower panel). p=0.353, Mann–Whitney U-test. Number of BL6 tissue cultures n = 6; number of eGFP-SP-tg tissue cultures n = 10. DG, dentate gyrus. Scale bar = 100 μm. (E) Mean spine head sizes of eGFP-SP-tg (black) and SP-KO (green) granule cells. n.s., not significant. p=0.211, Mann–Whitney U-test. Number of spines: eGFP-SP-tg n = 1107; SP-KO n = 1113, obtained from 24 segments, one segment per culture. (F) Cumulative frequency plots showing the distribution of spine head sizes of these spines. (G) SP+ spines comprised 7.6% of the total spine population. ***p<0.0001, Mann–Whitney U-test. Percentage per eGFP-SP-tg dendritic segment; n = 24 segments. (H) SP+ spines were significantly larger than SP− spines. ***p<0.0001, Mann–Whitney U-test. Number of SP+ spines n = 87, SP− spines n = 1021. (I) Cumulative frequency plots showing the distribution of spine head sizes of SP+ and SP− spines. (J) SP cluster size and spine head size of SP+ spines are tightly correlated: Spearman coefficient of correlation = 0.565, 95% C.I.: 0.396–0.697. ***p<0.0001. Linear regression analysis: R2 = 0.434. n = 87 spines.
Figure 2—figure supplement 1
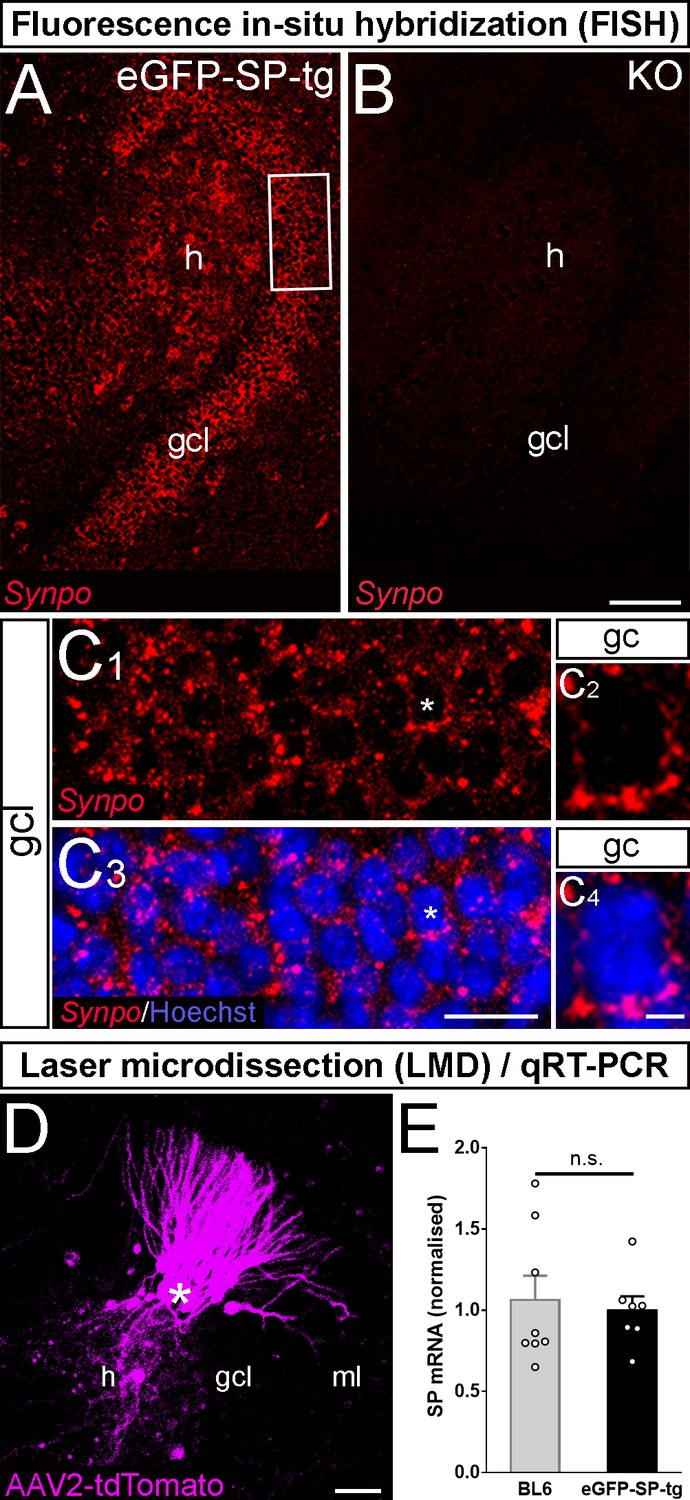
Fluorescence in-situ hybridization and laser microdissection/quantitative PCR for SP-mRNA.
(A, B) Fluorescence in-situ hybridization for Synaptopodin mRNA (Synpo; red) in the dentate gyrus of an eGFP-SP-tg organotypic tissue culture (OTC; A) and in the dentate gyrus of a Synaptopodin knock-out (KO) culture (B) at 26 days in vitro (DIV). In the transgenic culture Synaptopodin mRNA was present in granule cells (gc) of the granule cell layer (gcl) and in mossy cells of the hilus (h). The Synaptopodin KO culture did not show any labeling (B). Scale bar = 50 µm. (C) Higher magnification of boxed area in (A) shows Synpo mRNA (red, C1) and counterstained nuclei with Hoechst (blue, C3). All granule cells in the gcl express Synpo mRNA. A single Synpo mRNA expressing gc with a counterstained nucleus is shown at higher magnification (asterisk, C2 and C4). Scale bars = 25 µm in C3; 4 µm in C4. (D) Portions of the gcl of wildtype (n = 8) and eGFP-SP-tg cultures (n = 7) injected with AAV2-tdTomato were micro-dissected. ml, molecular layer. Scale bar = 50 µm. (E) Quantitative RT-PCR of the material harvested in (D) revealed similar levels of SP-mRNA in both groups. n.s., non-significant.
Figure 2—figure supplement 2
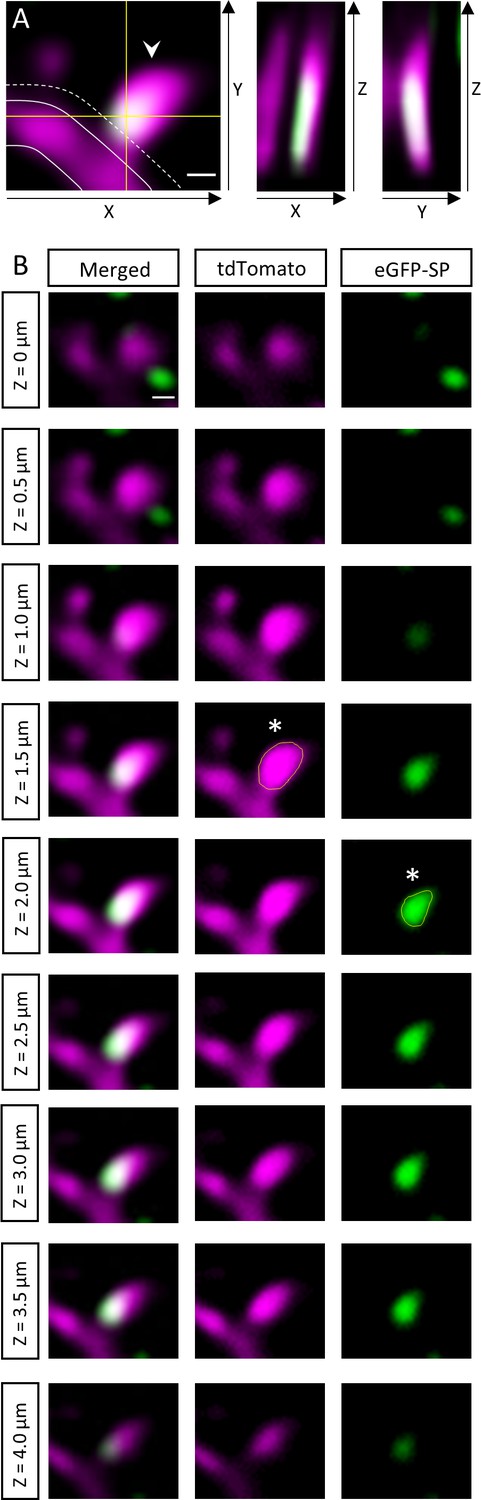
Measurement of dendritic spine head size and SP cluster size.
(A) Only protrusions exceeding the dendritic shaft (outlined) laterally in the x-y directions for at least 0.35 µm (dotted line) were included in the analysis. Spines were considered SP+ (arrowhead) if the SP cluster overlapped with the spine head and/or neck in both the x-z and y-z directions when scrolling through the z-stack. Scale bar = 0.5 µm; Single plane 2-photon images. (B) A series of x-y planes taken at consecutive z-levels is illustrated. Spine head size and SP cluster size are measured by choosing the planes with the maximal cross-sectional area of the spine head and SP cluster when going through the z-stack. x-y planes with the largest cross-sectional area of spine head (middle column, yellow outline of spine head, asterisk) and SP cluster (right column, yellow outline of SP-cluster, asterisk) are highlighted. Scale bar = 0.5 µm.
Figure 2—figure supplement 3

Spine head size and spine apparatus size tightly correlate.
(A) Electron micrographs of spines (outlined in dotted red) containing a spine apparatus (arrowhead) in the outer molecular layer of tissue cultures generated from eGFP-SP-tg mice. Scale bar = 0.25 µm. (B) Correlation analysis of spine head size and spine apparatus size. Specific data points (circled in red) are illustrated (red arrows) in A. Spearman coefficient of correlation = 0.536, 95% C.I.: 0.282–0.778. ***p=0.0005. Linear regression analysis: R2 = 0.457. n = 32 spines containing spine apparatus (from three cultures).
Figure 3
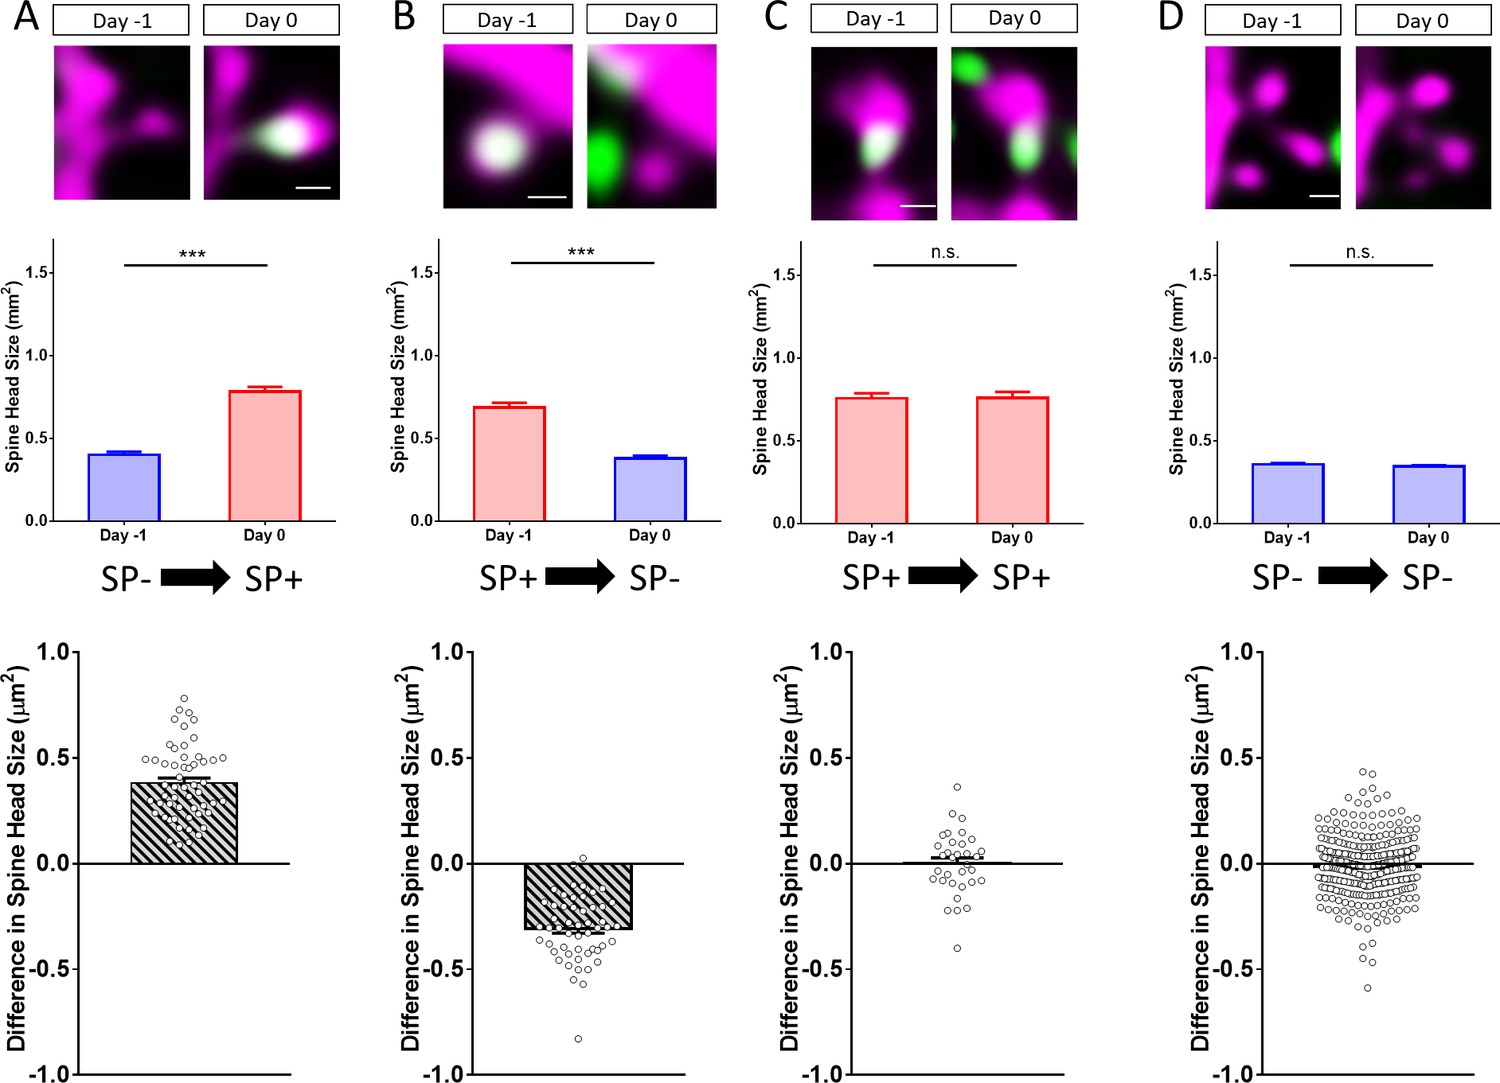
Changes in spine SP content are associated with bidirectional changes in spine head size.
Sample spines (upper panels), mean spine head size changes (middle panels) and differences in spine head size of individual spines (lower panels) are illustrated. (A) Example of a spine that became SP+ (green or white co-localized with magenta spine) between day −1 and 0. The mean maximum cross-sectional spine head area of spines of this group increased significantly. ***p<0.0001, Wilcoxon matched-pairs signed rank test. Number of spines n = 54. Scale bar = 0.5 µm. (B) Example of a spine that was SP+ and became SP- between day −1 and 0. The mean maximum cross-sectional spine head area of spines of this group decreased significantly. ***p<0.0001, Wilcoxon matched-pairs signed rank test. Number of spines n = 52. Scale bar = 0.5 µm. (C) Example of a spine that remained SP+. The mean cross-sectional spine head area of spines of this group did not change significantly. p=0.850, Wilcoxon matched-pairs signed rank test. Number of spines n = 33. Scale bar = 0.5 µm. (D) Example of a spine that remained SP-. The mean cross-sectional spine head area of spines of this group did not change significantly. p=0.060, Wilcoxon matched-pairs signed rank test. Number of spines n = 340. Scale bar = 0.5 µm; Single plane deconvolved 2-photon images.
Figure 4 with 1 supplement
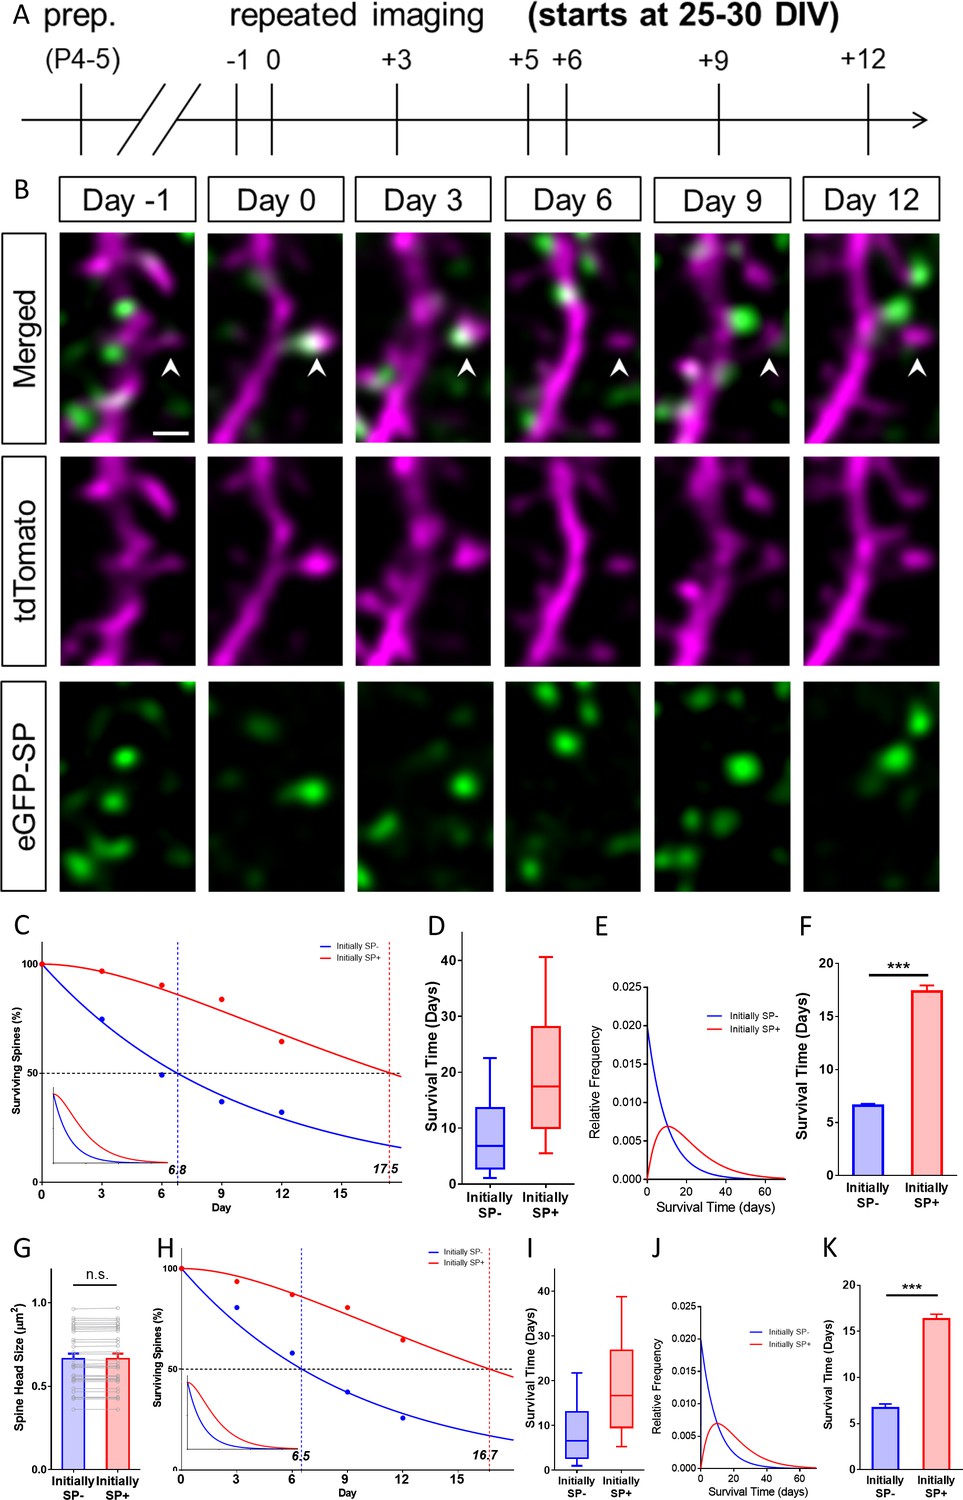
SP+ spines are highly stable spines.
(A) Schematic of the experimental design. OTCs were prepared at postnatal day 4–5 from eGFP-SP-tg mice and allowed to mature for 25–30 DIV. Time-lapse 2-photon imaging of identified dendritic segments was performed at time points as indicated. (B) Time-lapse imaging of a granule cell dendrite over 14 days illustrates the dynamics of SP clusters within individual spines. Arrowhead points to a spine that became SP+ on day 0, stayed positive on day 3, lost SP between days 3 and 6 and then remained SP- until day 12. Scale bar = 1 µm; Single plane deconvolved 2-photon images. (C) The survival of SP+ (red curve) and SP- spines (blue curve) was studied from day 0 until day 12. Dots: observed fractions; curves: fitted to observation points. The median survival of initially SP- spines was ≈ 6.8 days whereas the median survival of initially SP+ spines was ≈ 17.5 days. Number of spines at day 0: SP+ = 31, SP- = 392. Inset: Calculated decay curves until day 70. SP- spines followed a single-phase decay function whereas SP+ spines followed a conditional two-stage decay function. (D) Survival times of the total populations of SP+ and SP- spines derived from the fitted survival curves. Boxes indicate median, lower and upper quartiles. Whiskers indicate 10th and 90th percentiles, respectively. (E) Relative frequency distributions of these survival times. (F) The survival time of SP+ spines was significantly longer than of SP- spines; computational model; ***p<0.0001, Mann–Whitney U-test; based on 10 samples of 31 SP+ and 392 SP- spines. (G) To control for differences in spine head size, SP+ and SP- spines of equal head size were matched. The spine head size of these pairs was not significantly different. p=0.310, Wilcoxon matched-pairs signed rank test. Number of size-matched pairs n = 31. (H) The decay curve of these size-matched spines was very similar to the decay curve of all SP+ and SP- spines. The median survival of SP- spines of this population was ≈ 6.5 days, whereas size-matched SP+ spines showed a median survival of ≈ 16.7 days. Inset: Calculated decay curves until day 70. (I) Survival times of the total populations of SP+ and SP- spines derived from the fitted survival curves. (J) Relative frequency distributions of these survival times. (K) The survival time of size-matched SP+ spines was significantly higher than that of SP- spines; computational model; ***p<0.0001, Mann–Whitney U-test. based on 10 samples of 31 SP+ and 31 SP- spines.
Figure 4—figure supplement 1
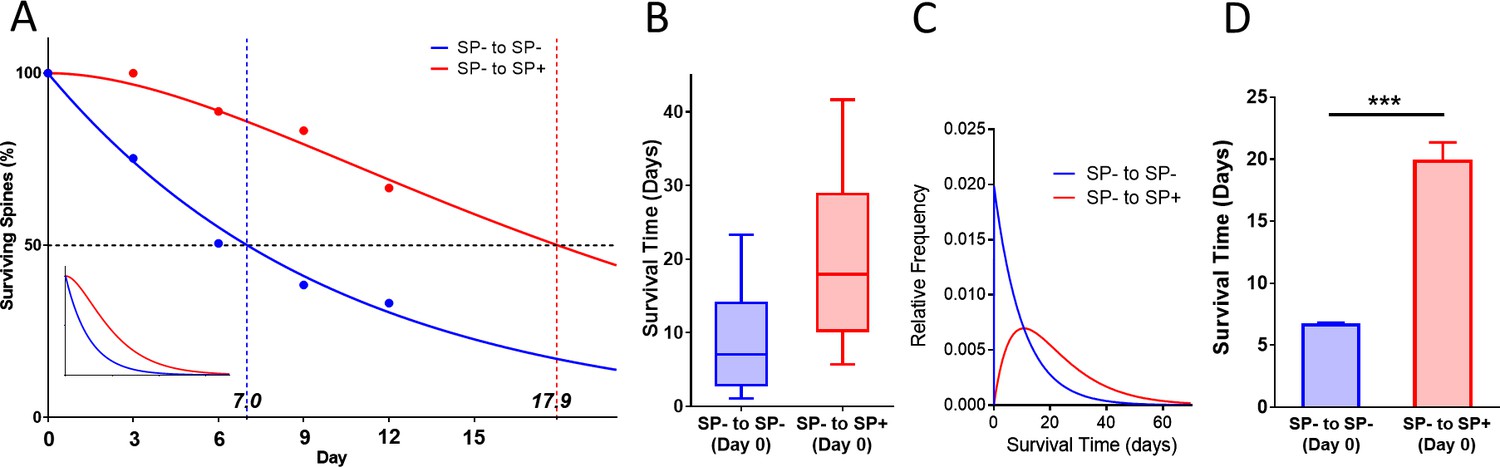
Survival curve of spines gaining SP at the beginning of the observation time.
(A) Survival curve of ‘timed’ SP+ spines, which gained SP between day −1 and 0 compared to SP- spines, which remained SP- between day −1 and 0 are shown. SP- spines (blue line; median survival ≈ 7.0 days) followed a single exponential decay curve, SP+ spines (red line; median survival ≈ 17.9 days) followed a conditional two-stage decay curve. Inset: Projected decay curves fitted to the observed survival fractions. Number of SP- spines = 340; SP+ spines = 18. (B) Calculated median survival time of timed SP+ spines (≈ 17.9 days) and SP- spines (≈ 7.0 days). (C) Calculated relative frequency distributions of median survival times of timed SP+ and SP- spines derived from the fitted survival curves. (D) The mean survival time of timed SP+ spines was significantly higher than SP- spines. Computational model; ***p<0.0001, Mann–Whitney U-test. 10 samples of size 18 SP+ and 340 SP- spines.
Figure 5
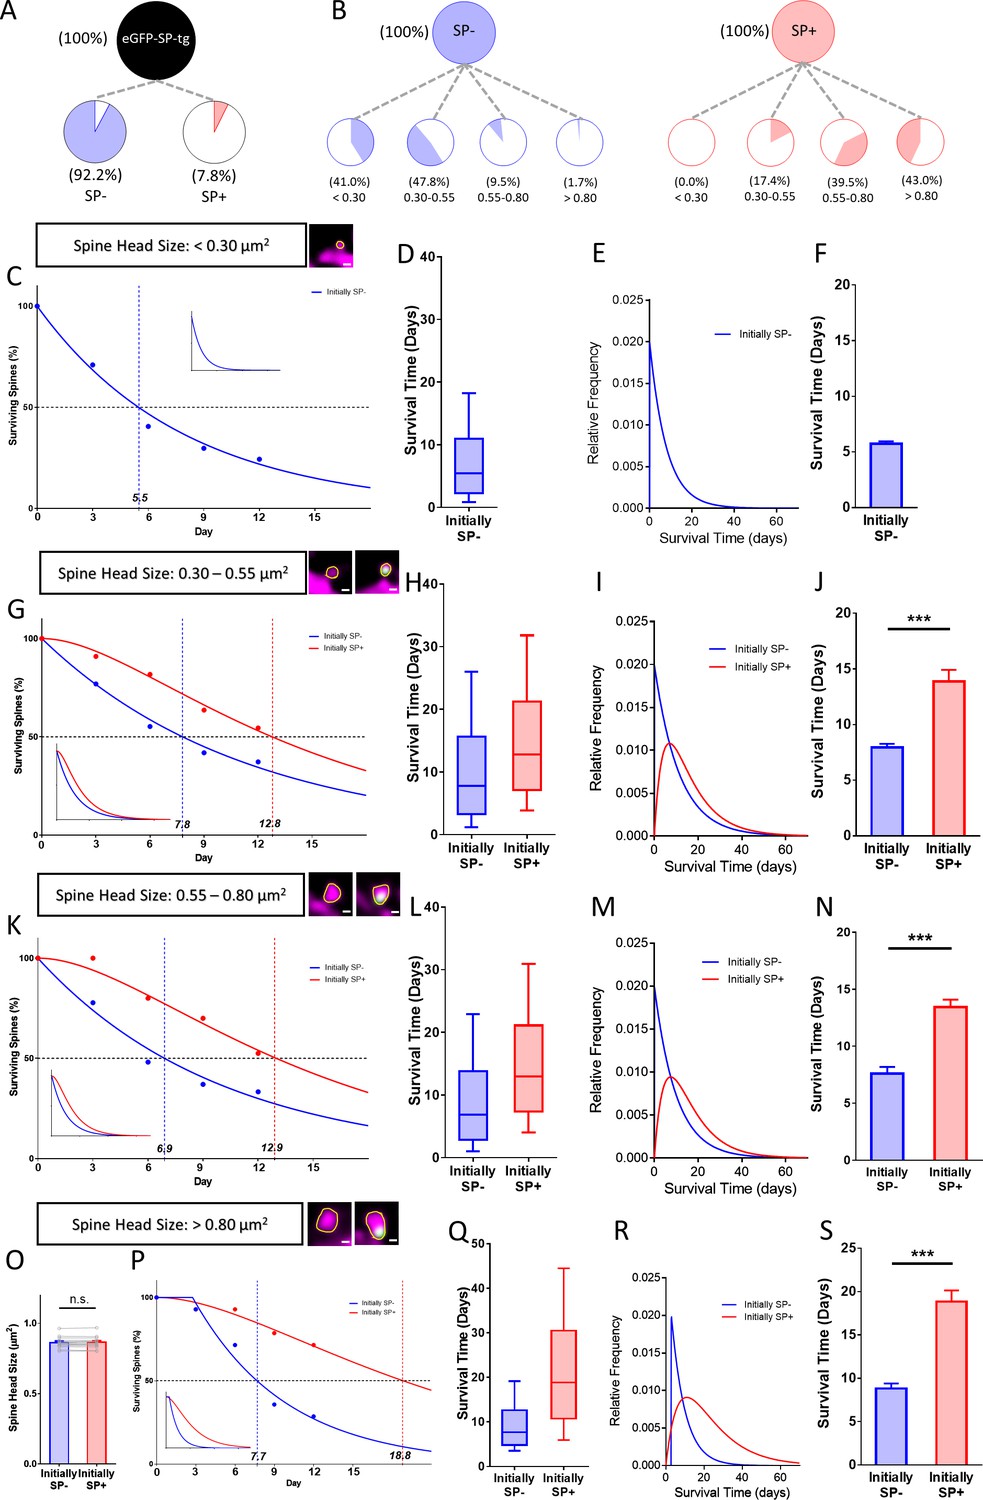
Presence of SP in spines correlates with their long-term survival.
(A) Fraction of SP- (≈ 92.2%) and SP+ spines (≈ 7.8%) in eGFP-SP-tg granule cells on day 0. Number of SP+ spines = 87, SP- spines = 1021, obtained from entire imaged segments; number of cultures: eGFP-SP-tg=24. (B) SP- (blue) and SP+ spines (red) were divided into four size classes: very small (<0.3 µm2), small (0.3–0.55 µm2), medium (0.55–0.8 µm2) and large (>0.8 µm2) spines. Whereas most SP- spines were found in the very small (41.0%) and small (47.8%) spine groups, the majority of SP+ spines were in the medium (39.5%) and large (43.0%) size groups. (C) Survival curve of very small spines (example shown) from day 0 until day 12. Dots: observed fractions; curves: fitted to observation points. SP- spines (blue line) followed a single exponential decay curve (median survival ≈ 5.5 days). Inset: extrapolated decay curve until day 70. Number of very small SP- spines = 148. (D) Survival time of the total population of SP- spines derived from the fitted survival curve. Box indicates median, lower and upper quartiles. Whiskers indicate 10th and 90th percentiles, respectively. (E) Relative frequency distribution of very small SP- spines. (F) Mean survival time of very small SP- spines; computational model; 10 samples, 148 SP- spines. (G) Survival curves of small SP- and SP+ spines (examples shown). SP- spines (blue line; median survival ≈ 7.8 days) followed a single exponential decay curve, SP+ spines (red line; median survival ≈ 12.8 days) followed a conditional two-stage decay curve. Inset: extrapolated decay curves until day 70. Number of SP- spines = 217; SP+ spines = 11. (H) Survival times and (I) relative frequency distributions of small SP- and SP+ spines. (J) Mean survival time of SP+ spines compared to SP- spines; computational model. ***p=0.0003, Mann–Whitney U-test. 10 samples; 11 SP+ and 217 SP- spines. (K) Survival curves of medium-sized SP- and SP+ spines (examples shown). SP- spines (blue line; median survival ≈ 6.9 days) followed a single exponential decay curve, SP+ spines (red line; median survival ≈ 12.9 days) followed a conditional two-stage decay curve. Inset: extrapolated decay curves until day 70. Number of SP- spines = 27; SP+ spines = 40. (L) Survival times and (M) relative frequency distributions of medium SP- and SP+ spines. (N) Mean survival time of SP+ spines compared to SP- spines; computational model. ***p<0.0001, Mann–Whitney U-test. 10 samples; 40 SP+ and 27 SP- spines. (O) SP+ and SP- spines were size-matched in the largest spine group (mean spine head sizes; not significant; p=0.475, Wilcoxon matched-pairs signed rank test). Number of size-matched pairs n = 14. (P) Survival curves of size-matched large SP- and SP+ spines (examples shown). SP- spines (blue line; median survival ≈ 7.7 days) followed a single exponential decay curve, SP+ spines (red line; median survival ≈ 18.8 days) followed a conditional two-stage decay curve. Inset: calculated decay curves until day 70. (Q) Survival times and (R) relative frequency distributions of large SP- and SP+ spines. (S) Mean survival time of SP+ spines compared to SP- spines; computational model. ***p<0.0001, Mann–Whitney U-test. 10 samples; 14 SP+ and 14 SP- spines.
Figure 6 with 1 supplement
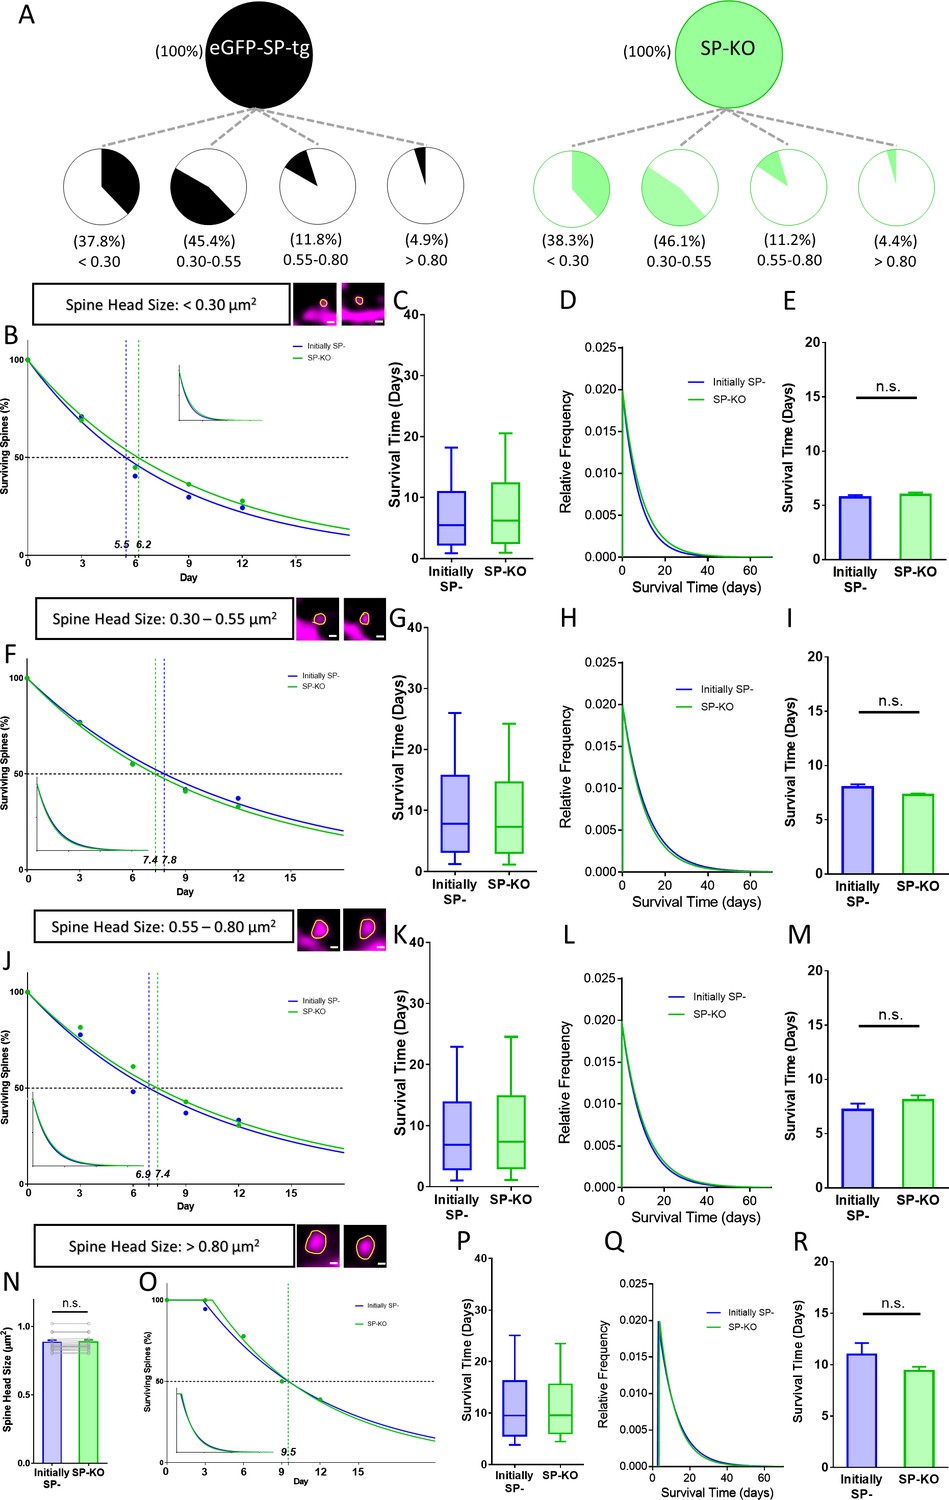
Spines of SP-deficient mice decay like SP- spines.
(A) Spine head size distributions of granule cell dendrites of eGFP-SP-tg and SP-KO mice were similar. Number of spines: eGFP-SP-tg=1107; SP-KO = 1113, obtained from entire imaged segments; number of cultures: eGFP-SP-tg=24; SP-KO = 21. (B) Survival curve of very small spines (examples shown) from day 0 until day 12. Dots: observed fractions; curves: fitted to observation points. SP- spines (blue line; median survival ≈ 5.5 days) and spines of SP-KO-mice (green line; median survival ≈ 6.2 days) followed single exponential decay curves. Inset: calculated decay curves until day 70. Number of SP- spines = 148; SP-KO spines = 187. (C) Calculated survival times and (D) relative frequency distributions of very small SP- and SP-KO spines. (E) Mean survival time of very small SP- and SP-KO spines; computational model. p=0.529, Mann–Whitney U-test. 10 samples; 148 SP-, 187 SP-KO spines. (F) Survival curves, (G) calculated survival times, and (H) relative frequency distributions of small SP- and SP-KO spines. SP- spines (blue; median survival ≈ 7.8 days) and SP-KO spines (green, median survival ≈ 7.4 days) followed single exponential decay curves. Number of SP- spines = 217; SP-KO spines = 200. (I) Mean survival times; computational model. p=0.089, Mann–Whitney U-test. 10 samples; 217 SP-, 200 SP-KO spines. (J) Survival curves, (K) calculated survival times, and (L) relative frequency distributions of medium-sized SP- and SP-KO spines. SP- spines (blue; median survival ≈ 6.9 days) and SP-KO spines (green, median survival ≈ 7.4 days) followed single exponential decay curves. Number of SP- spines = 27; SP-KO spines = 49. (M) Mean survival times; computational model. p=0.280, Mann–Whitney U-test. 10 samples; 27 SP-, 49 SP-KO spines. (N) SP-KO and SP- spines were size-matched in the largest spine group mean spine head sizes; not significant, p=0.109, Wilcoxon matched-pairs signed rank test. Number of size-matched pairs n = 18. (O) Survival curves, (P) calculated survival times, and (Q) relative frequency distributions of large SP- and SP-KO spines. SP- spines (blue; median survival ≈ 9.5 days) and SP-KO spines (green, median survival ≈ 9.5 days) followed single exponential decay curves. Number of size-matched pairs = 18. (R) Mean survival times; computational model. p=0.393, Mann–Whitney U-test. 10 samples; 18 SP- and 18 SP-KO spines.
Figure 6—figure supplement 1
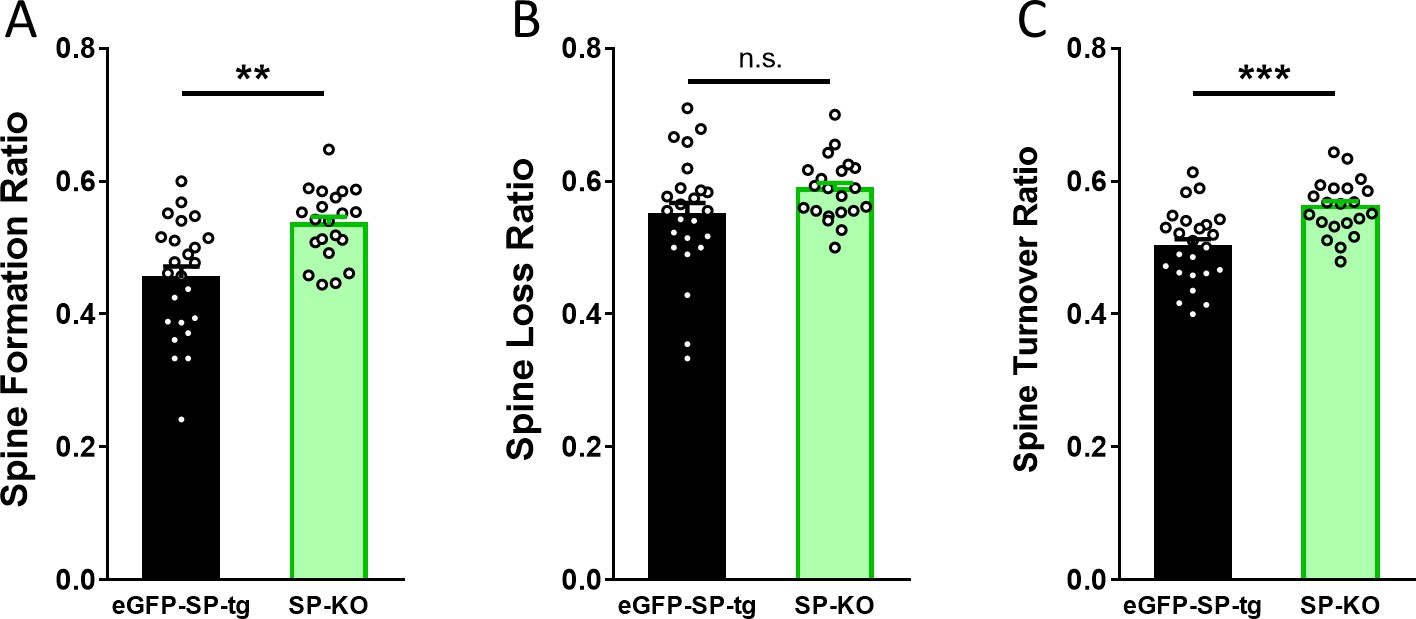
SP-KO mice compensate for the loss of SP with an increased spine formation and an increased turnover ratio.
(A) Spine formation was significantly higher in SP-KO dendrites as compared to eGFP-SP-tg dendrites. **p=0.0011, Mann–Whitney U-test. Number of dendritic segments: eGFP-SP-tg, n = 24; SP-KO, n = 21. (B) Spine loss was not significantly different between SP-KO and eGFP-SP-tg dendrites. p=0.0868, Mann–Whitney U-test. Number of dendritic segments: eGFP-SP-tg, n = 24; SP-KO, n = 21. (C) Spine turnover ratio was significantly higher in SP-KO dendrites as compared to eGFP-SP-tg dendrites over the two-week observation period. ***p=0.0003, Mann–Whitney U-test. Number of dendritic segments: eGFP-SP-tg, n = 24; SP-KO, n = 21.
Figure 7 with 3 supplements
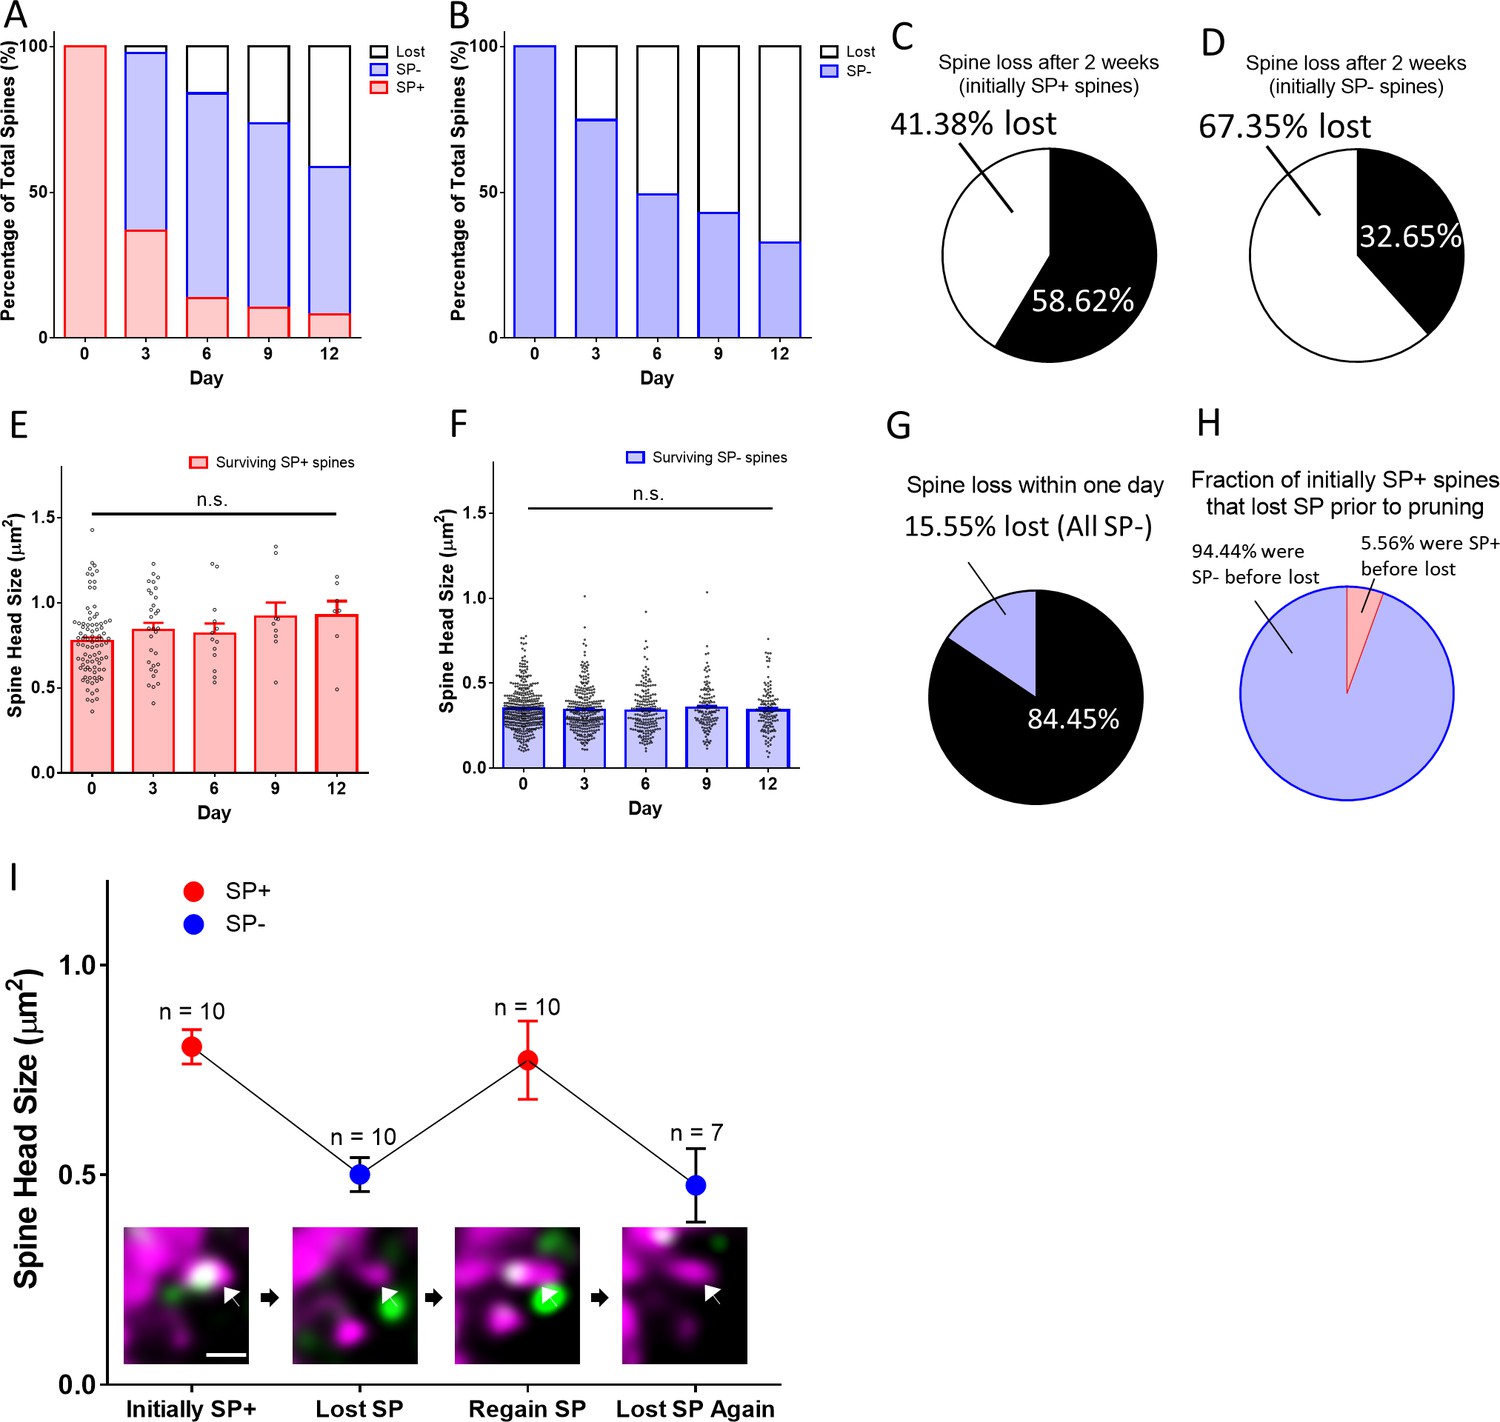
Spines pass through a SP-negative state before pruning.
(A, B) The fates of (A) a group of SP+ spines (n = 87) and (B) a group of SP- spines (n = 392) are illustrated. SP+ spines gradually become SP- or disappear. SP- spines disappear with time. (C, D) Fractions of (C) SP+ and (D) SP- spines surviving for two weeks. (E, F) Mean spine head sizes of surviving (E) SP+ and (F) SP- spines. Spine head sizes were not significantly different (SP+ spines, p=0.115; SP- spines, p=0.627, Kruskal-Wallis test). (G) Analysis of SP content of all spines lost within one day (days −1 to 0; n = 72; 15.55% of 463 spines). All pruned spines were SP-. (H) Analysis of all SP+ spines that were pruned during the observation period. Most spines (n = 34) went through a SP- state before disappearing, a minority (n = 2) was lost directly between imaging days 0 and 3. (I) A subpopulation of SP+ spines undulated between SP+ and SP- states (n = 10). The gain or loss of SP was accompanied by an increase or decrease of spine head size, respectively. An example for such a case is illustrated (arrow in insets). Scale bar = 1 µm; Single plane deconvolved 2-photon images.
Figure 7—figure supplement 1

2-photon time-lapse imaging data of individual SP+ spines.
SP+ spines (SP+ on day 0) were subdivided into three categories: (A) spines that survive until the end of the observation period, (B) spines that are pruned and go through a SP- state, (C) spines that are pruned without going through a SP- state before pruning. The fractions, percentages and SP-content (SP+, red; SP-, blue) of spines in the different categories are indicated. Upper panels (A1 through C1) show individual spines, lower panels (A2 through C2) show summary diagrams (mean ± SEM) of data illustrated in A1 through C1. Spines undulating between SP- and SP+ states were excluded and analyzed separately (Figure 8). (A1, A2) Initially SP+ spines surviving until the end of the observation period (n = 51). Spines are sub-grouped based on the day SP is lost from the spine. Note the reduction of spine head size after loss of SP. (B1, B2) Initially SP+ spines that are pruned and go through a SP- state prior to pruning (n = 34). X = lost. Spines are sub-grouped based on the day the spine is pruned. (C1, 2) Initially SP+ spines that are lost directly (n = 2; 5.56% of SP+ spines), that is without going through a SP- state. These rare spines disappear sometime between imaging days 0 and 3.
Figure 7—figure supplement 2
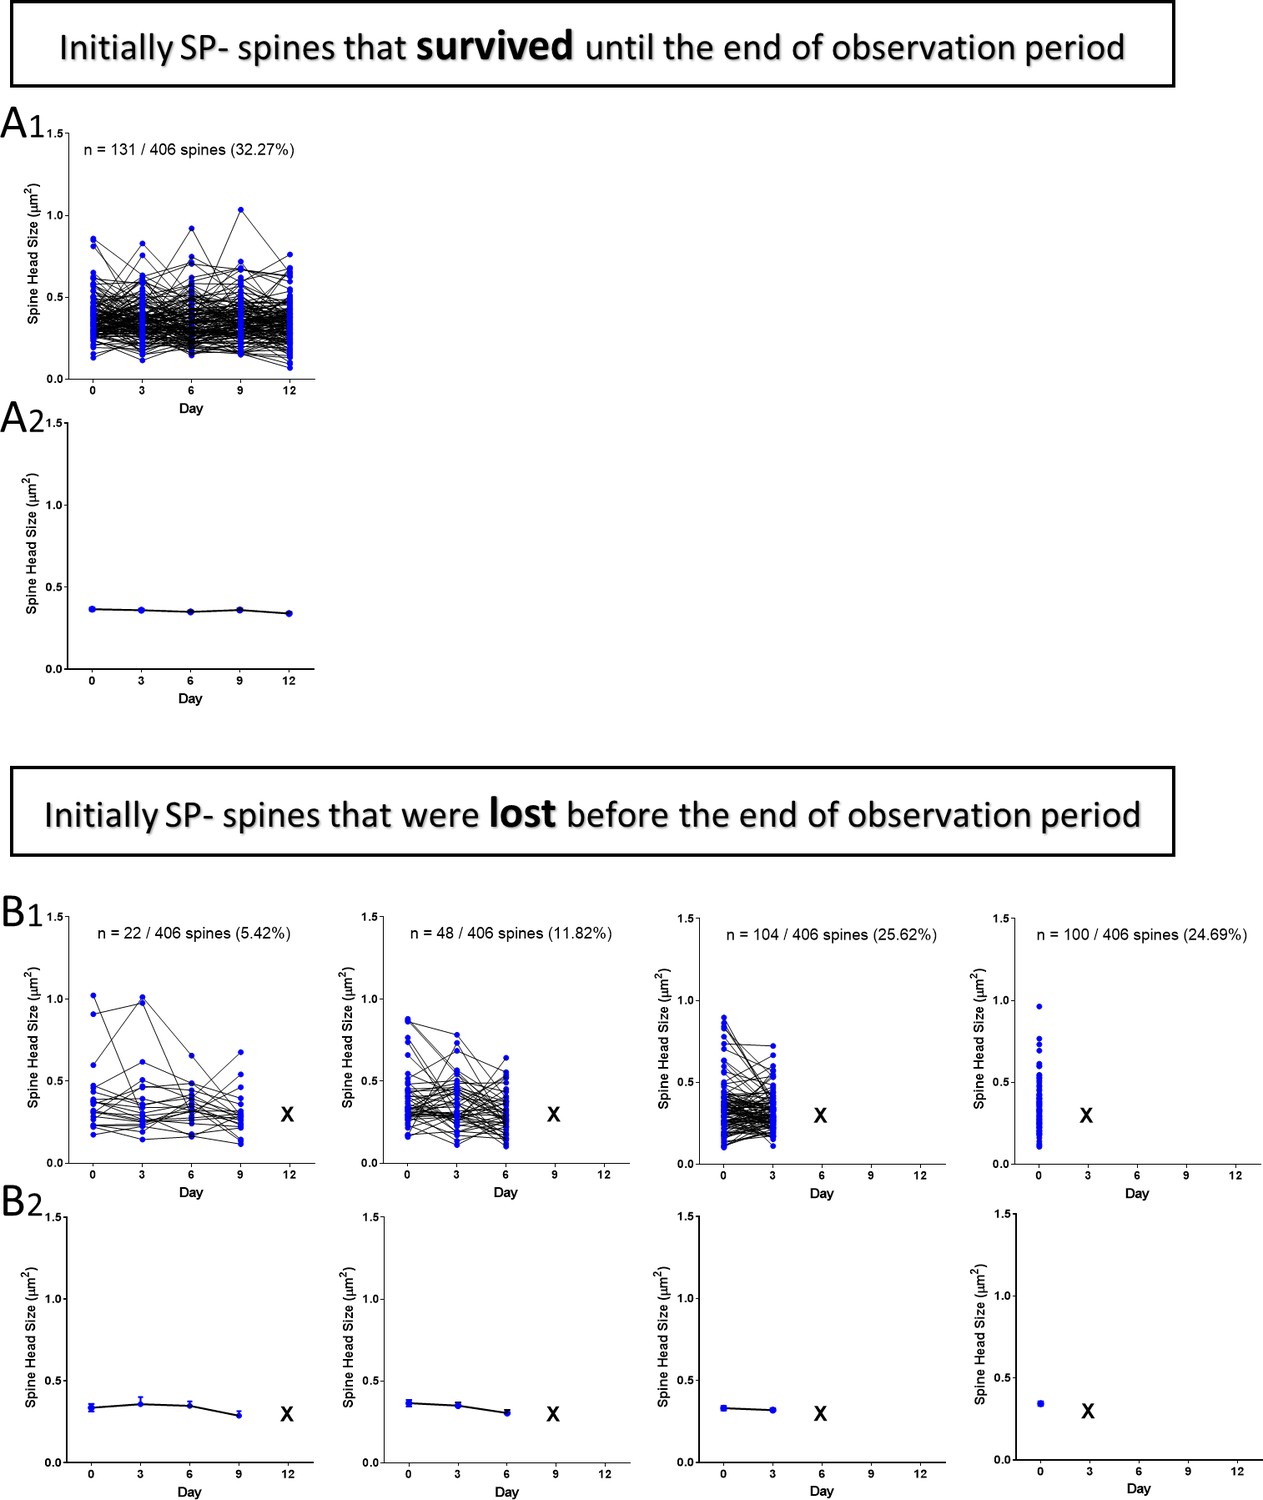
2-photon time-lapse imaging data of individual SP- spines.
SP- spines (SP- on day 0) are subdivided into two categories: (A) spines that survive until the end of the observation period (n = 131), (B) spines that are lost (n = 275). The fractions, percentages and SP-content (SP-, blue) of spines in the different sub-categories are shown. Upper panels (A1 and B1) show individual spines, lower panels (A2 and B2) show summary diagrams (mean ± SEM) of data shown in A1 and B1. Spines undulating between SP+ and SP- states are excluded and analyzed separately (Figure 8).
Figure 7—figure supplement 3
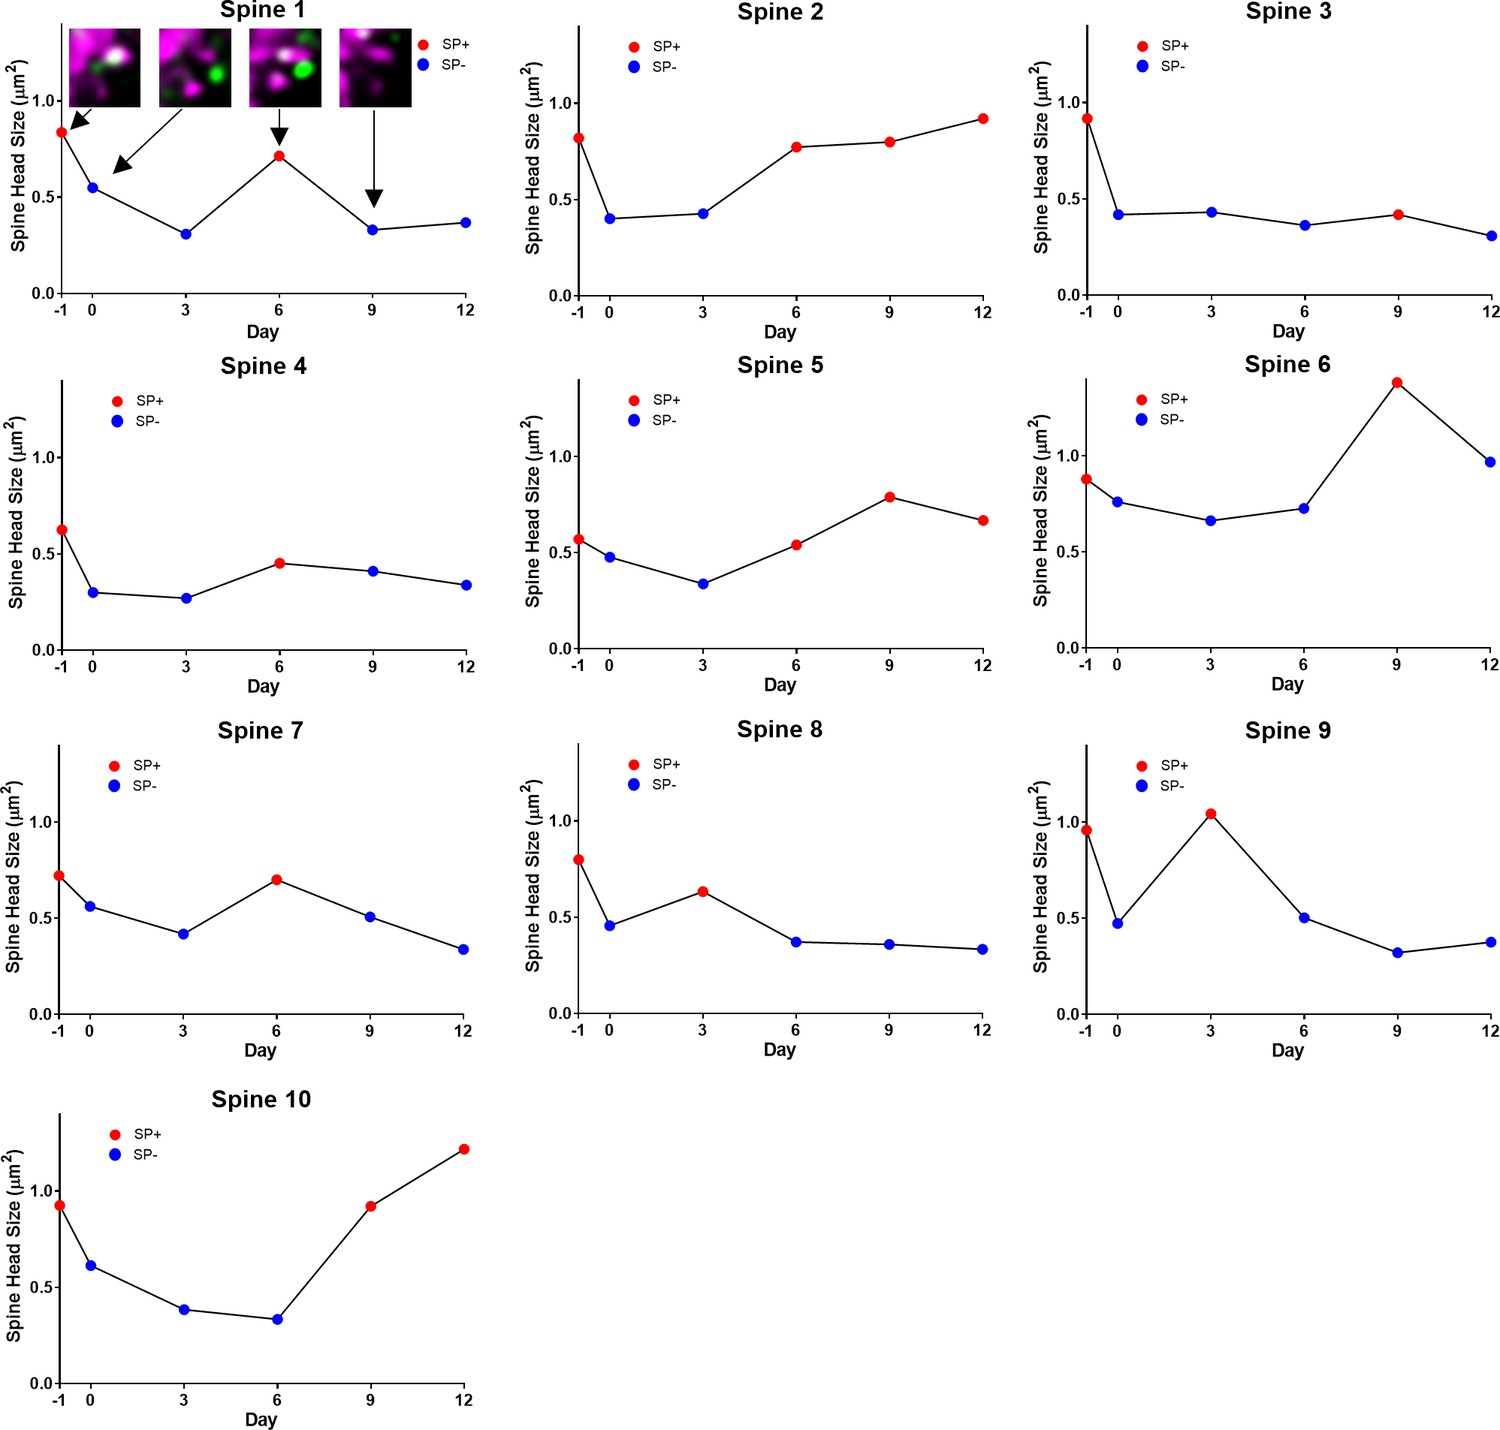
2-photon time-lapse imaging data of individual spines undulating between SP+ and SP- states.
Some SP+ spines loose SP and subsequently regain SP. This demonstrates that loss of SP from spines is not sufficient for spine pruning. Note corresponding changes in SP-content and in spine head size. The example of an undulating spine illustrated in Figure 7I (lower part) is shown in this figure with all imaging time points (Spine 1).
Figure 8
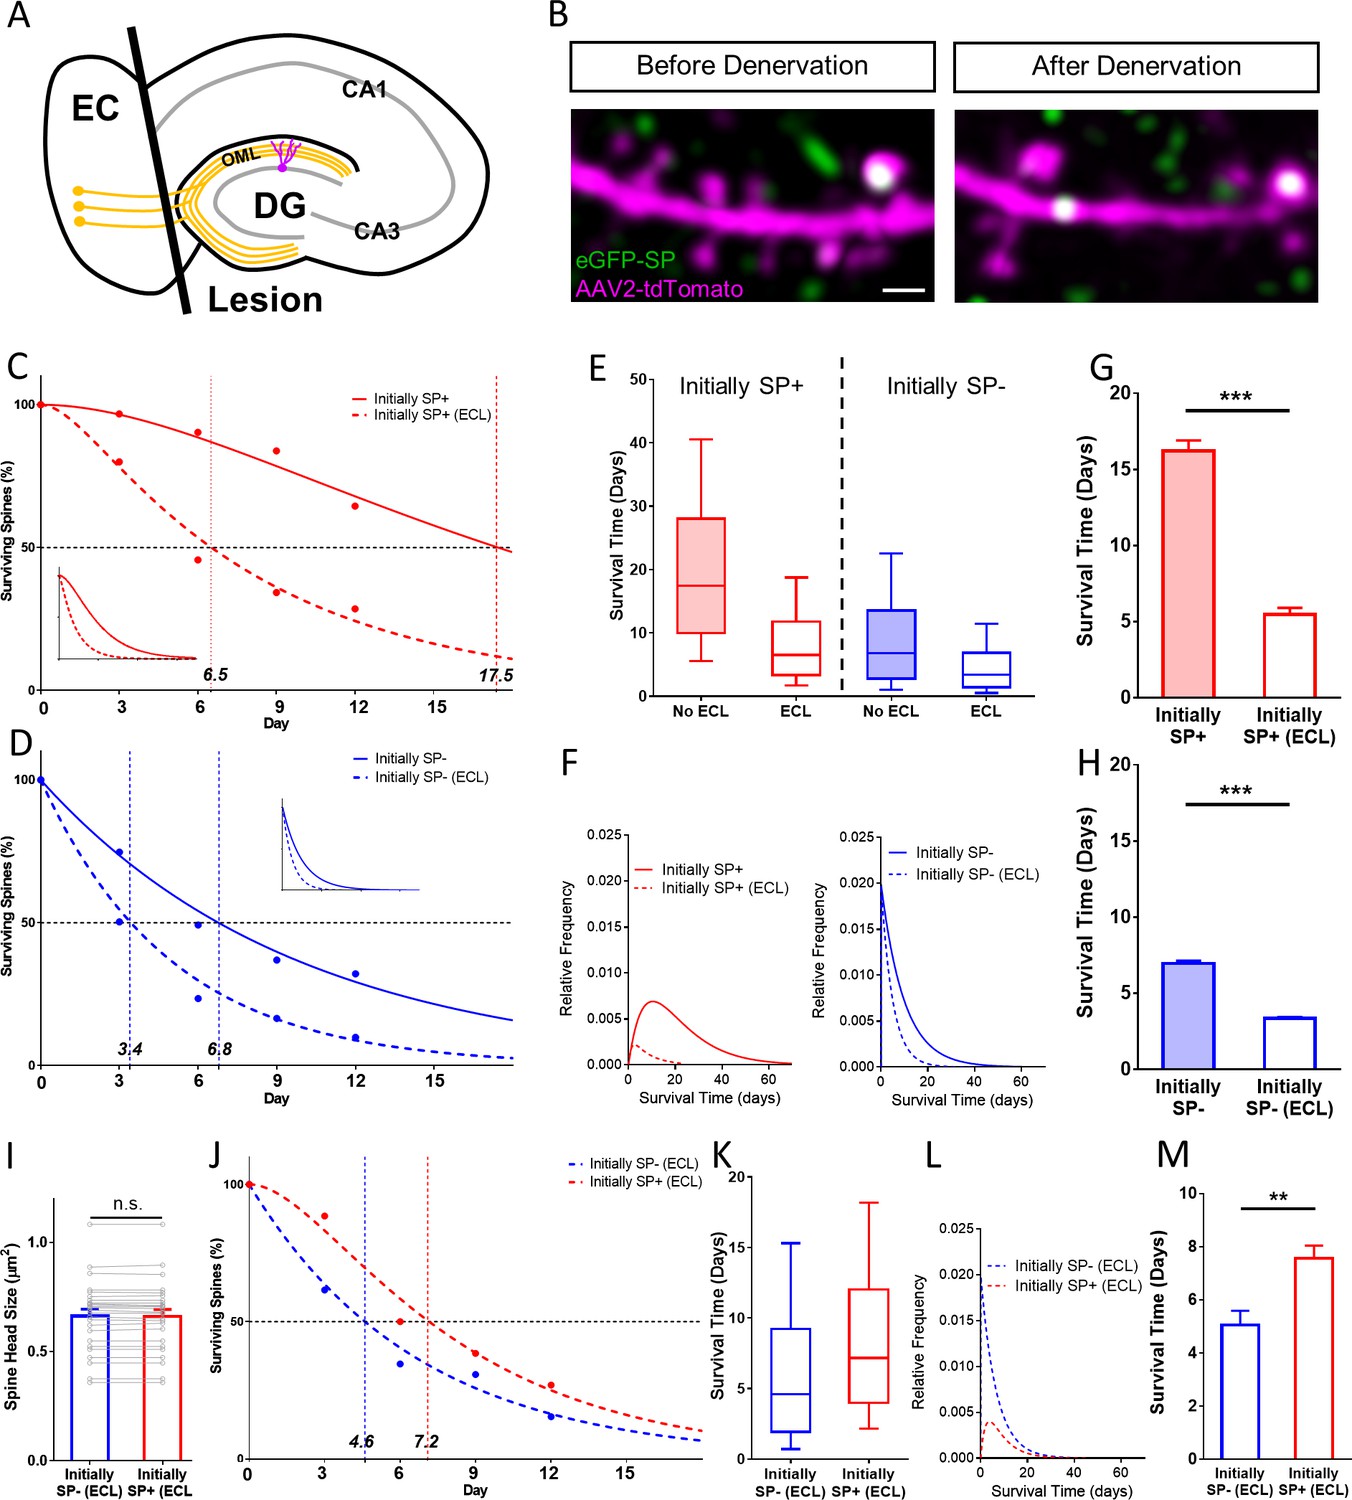
SP+ spines are more stable than SP- spines after denervation.
(A) Schematic of the entorhinal denervation in vitro model. The entorhinal projection (perforant path; orange) is transected under visual control and granule cell dendrites extending into the outer molecular layer (OML) of the dentate gyrus (DG) are denervated. CA3, CA1, hippocampal subfields; EC, entorhinal cortex. (B) 2-photon images of a granule cell dendrite in the OML before and 4 days after denervation. Note the denervation-induced spine loss. Scale bar = 1 µm. (C, D) Survival curve of SP+ (C) and SP- (D) spines in denervated cultures compared to SP+ and SP- spines in cultures without lesion (control groups also shown in Figure 4). The median survival time of both spine populations is reduced after denervation. SP+ spines still followed a sequential two-stage decay function after denervation, SP- spines still followed a single-phase exponential decay kinetic. Inset: Projected decay curves fitted to the observed survival fractions. Number of SP+ spines at day 0: denervated = 35, non-denervated = 31; Number of SP- spines at day 0: denervated = 302, non-denervated = 392. (E) Both SP+ (≈ 6.5 days) and SP- (≈ 3.4 days) spines had a reduced median survival time following denervation. (F) Relative frequency distributions of median survival times of SP+ and SP- spines derived from the fitted survival curves. (G, H) The mean survival time of SP+ (G) and SP- (H) spines was significantly reduced after denervation; computational model. ***p<0.0001, Mann–Whitney U-test. 10 samples of size; 35 SP+ spines with denervation and 31 SP+ spines without denervation; 302 SP- spines with denervation and 392 SP- spines without denervation. (I) To control for differences in spine head size, SP+ and SP- spines of equal head size were matched. The mean spine head size of these pairs was not significantly different. p=0.670, Wilcoxon matched-pairs signed rank test. Number of size-matched pairs = 26. (J) The decay curves of size-matched spines were similar to the decay curves of all SP+ and SP- spines after denervation. The half-life of SP- spines was ≈ 4.6 days while SP+ spines had a half-life of ≈ 7.2 days. (K, L) Calculated median survival times (K) and relative frequency distributions (L) of size-matched SP+ and SP- spines. (M) The mean survival time of size-matched SP+ spines was significantly higher than SP- spines. Computational model. **p=0.0021, Mann–Whitney U-test. 10 samples of size 26 SP+ and 26 SP- spines.
Figure 9
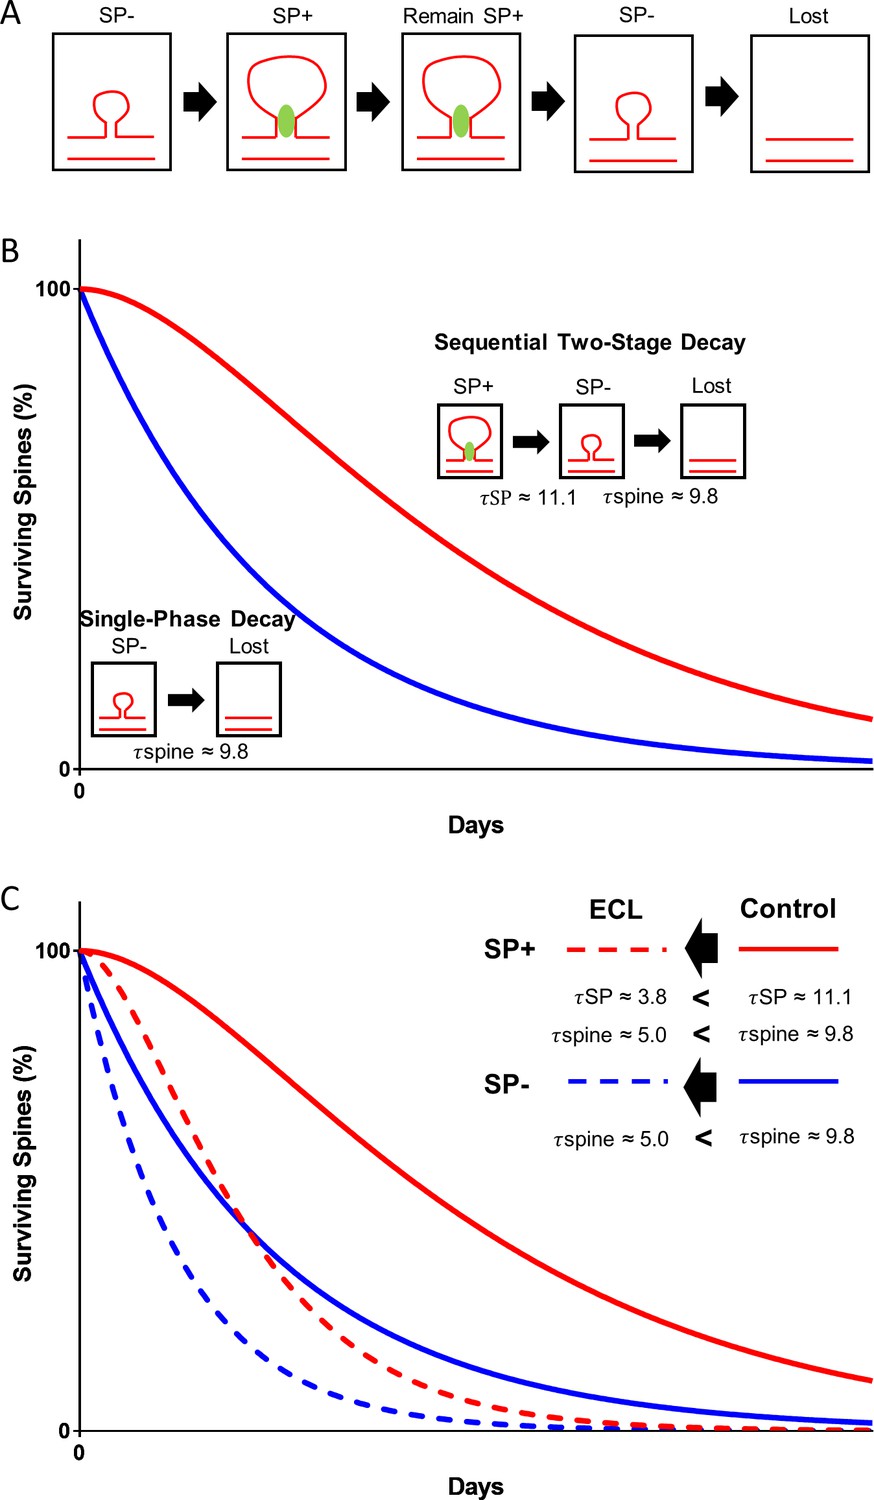
Model illustrating the role of SP in spine head size and spine stability.
(A) SP- spines gaining SP show a concomitant increase in spine head size. SP in spines stabilizes spines. Prior to spine loss, SP is removed from spines. Loss of SP from spines is associated with a reduction in spine head size. (B) The data of the present study suggest a conditional two-stage exponential decay model for SP+ spines. The first stage involves SP+ spines losing SP (τSP) and the second stage involves the gradual disappearance of these SP- spines (τspine). For SP- spines, our data suggest they undergo a classical single-phase exponential decay model where spines are lost exponentially with time. (C) Following denervation, the two survival curves are shifted to the left. However, even under these conditions, SP+ spines are more stable than SP- spines and follow a conditional two-stage exponential decay kinetic. Entorhinal cortex lesion, ECL.
Tables
Key resources table
| Reagent type (species) or resource | Designation | Source or reference | Identifiers | Additional information |
|---|---|---|---|---|
| Strain, strain background (Mus musculus) | eGFP-SP-tg | Vlachos et al., 2013b | C57BL/6J background | |
| Strain, strain background (Mus musculus) | SP-KO | Deller et al., 2003 | RRID:IMSR_JAX:028822 | C57BL/6J background |
| Strain, strain background (Mus musculus) | WT | Janvier Labs | C57BL/6J background | |
| Transfected construct (Homo sapiens) | phSyn-tdTomato | Radic et al., 2017 | ||
| Antibody | Rabbit Polyclonal Anti-Synaptopodin | Synaptic Systems | RRID:AB_887825 | (1:1000) |
| Antibody | Goat Anti-Rabbit IgG Antibody (H+L), Biotinylated | Vector Laboratories | RRID:AB_2313606 | (1:200) |
| Recombinant DNA reagent | in situ mRNA probe: Synaptopodin | Mundel et al., 1997 | (1:500) | |
| Commercial assay or kit | RNeasy Plus Micro Kit | Qiagen | Cat #74034 | |
| Commercial assay or kit | High Capacity cDNA Reverse Transcription Reagents Kit | Applied Biosystems | Cat #4368814 | |
| Commercial assay or kit | TaqMan PreAmp Master Mix | Applied Biosystems | Cat #4391128 | |
| Commercial assay or kit | TaqMan 178 Gene Expression Assays | Applied Biosystems | Synpo_B-ANY: Custom Gene Expression Assay, FAM, ID: AIWR2E7 Mouse (Assay by Design, designed by Domenico Del Turco) GAPD (GAPDH) Endogenous Control (FAM/MGB probe, primer limited) Cat #4352932E | |
| Commercial assay or kit | TaqMan Gene Expression Master Mix | Applied Biosystems | Cat #4369016 | |
| Chemical compound, drug | Alexa Fluor 568 Hydrazide | Invitrogen | Cat #A10437 | 0.75 mM |
| Software, algorithm | FV10-ASW | Olympus | Image acquisition | |
| Software, algorithm | Eclipse C1 plus | Nikon | Image acquisition | |
| Software, algorithm | Scanimage 5.1 | Vidrio Technologies | Image acquisition | |
| Software, algorithm | Huygens Professional Version 17.10 | Scientific Volume Imaging | Image processing | |
| Software, algorithm | Fiji/ImageJ 1.52 hr | National Institutes of Health | Image processing and data analysis | |
| Software, algorithm | ImageSP Viewer | SysProg | Image processing and data analysis | |
| Software, algorithm | GraphPad Prism 6 | GraphPad Software | Statistical analysis | |
| Software, algorithm | LabView 2019 | National Instruments | Data analysis |
Additional files
Download links
A two-part list of links to download the article, or parts of the article, in various formats.
Downloads (link to download the article as PDF)
Open citations (links to open the citations from this article in various online reference manager services)
Cite this article (links to download the citations from this article in formats compatible with various reference manager tools)
The actin-modulating protein synaptopodin mediates long-term survival of dendritic spines
eLife 9:e62944.
https://doi.org/10.7554/eLife.62944


