Time-to-event modeling of hypertension reveals the nonexistence of true controls
- Center for Research on Genomics and Global Health, National Human Genome Research Institute, United States
Figures
Figure 1
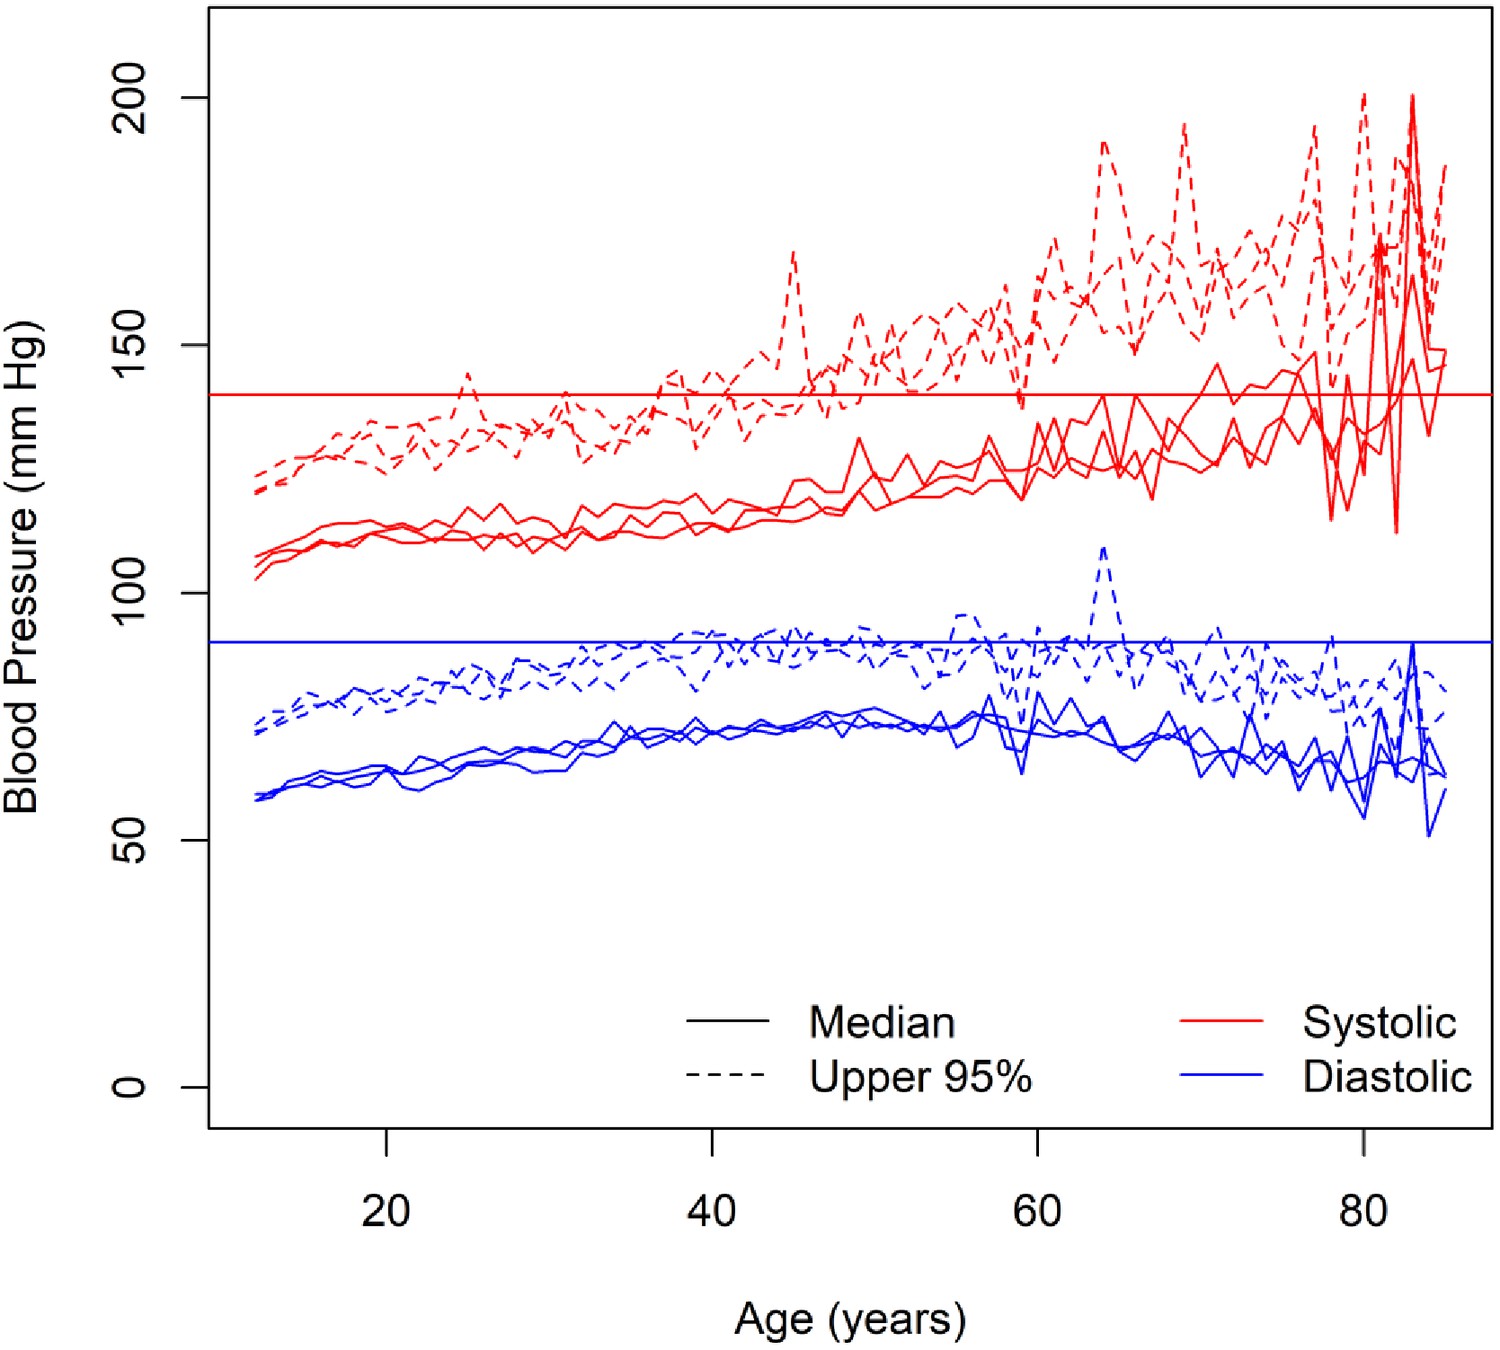
Blood pressure among normotensive and untreated individuals.
The solid red horizontal line represents the diagnostic threshold of 140 mm Hg and the solid blue horizontal line represents the diagnostic threshold of 90 mm Hg.
Figure 2
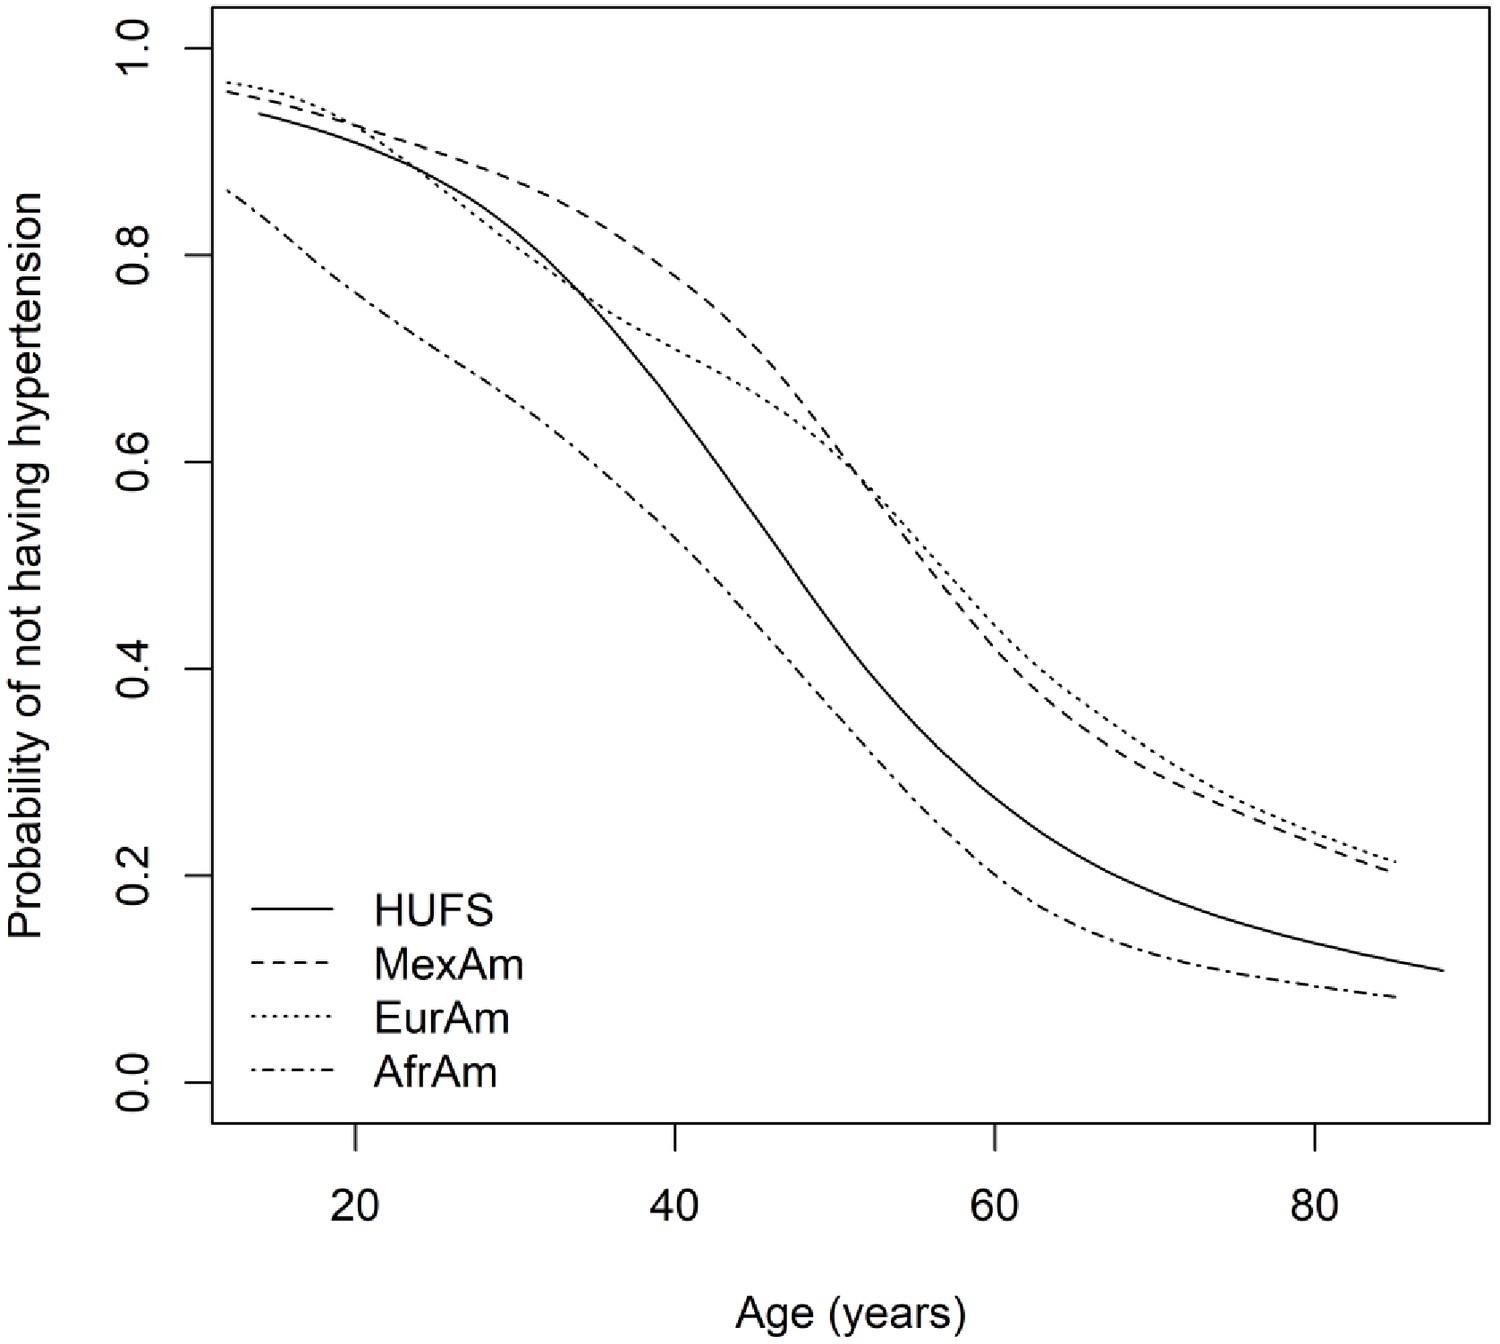
Time-to-event curves.
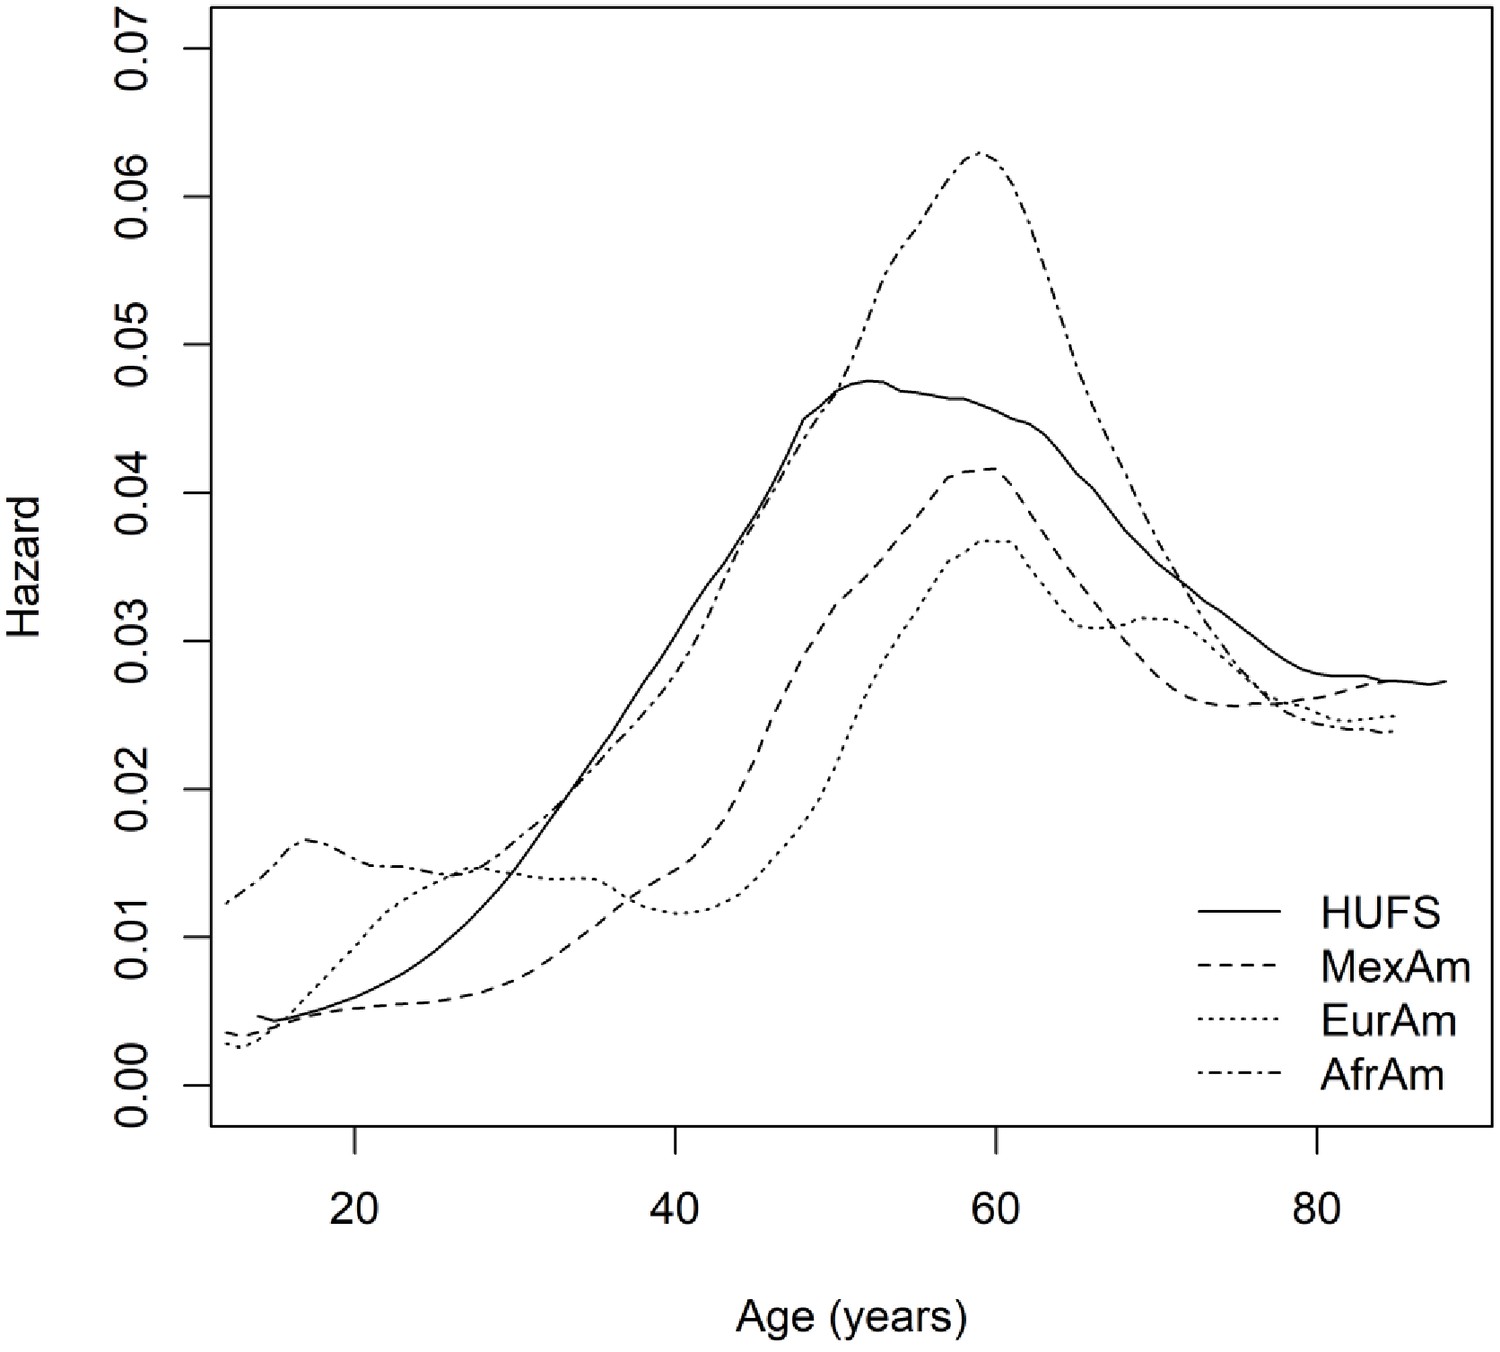
Figure 3

Parametric hazard functions.
Figure 4
Nonparametric baseline hazard functions.
Tables
Table 1
Likelihoods for several parametric and nonparametric baseline hazard functions.
| Distribution | -ln(Likelihood) |
|---|---|
| Nonparametric | 553.690 |
| Log-normal | 580.417 |
| Gamma | 580.589 |
| Weibull | 582.688 |
| Exponential | 624.069 |
| Loglogistic | 625.762 |
| Generalgamma | 638.588 |
Table 2
Effective dimensionality of logistic and proportional hazards models.
| Model | Parameters | DIC | pD |
|---|---|---|---|
| Logistic | intercept | 1406.6 | 1.0 |
| Logistic | intercept, age | 1171.2 | 2.0 |
| Logistic | intercept, age, age2 | 1165.3 | 3.0 |
| Proportional hazards | α, β, λ0(t) | 1166.5 | 3.3 |
| Proportional hazards | α, β, λ0(t), π | 1167.3 | 4.0 |
Table 3
Replication of covariates from model selection in African Americans.
| HUFS ( = 1,014) | NHANES ( = 5,135) | |||||
|---|---|---|---|---|---|---|
| Variable | Estimate | SE | p-Value | Estimate | SE | p-Value |
| Chloride (mmol/L) | −0.0253 | 0.0122 | 3.81E-02 | −0.0241 | 0.0110 | 2.81E-02 |
| Insulin (mIU/L) | 0.0112 | 0.0054 | 3.61E-02 | 0.0115 | 0.0044 | 9.04E-03 |
| LDL cholesterol (mg/dL) | −0.0031 | 0.0013 | 1.75E-02 | −0.0018 | 0.0008 | 3.04E-02 |
| Potassium (mmol/L) | −0.2553 | 0.1016 | 1.20E-02 | −0.5695 | 0.0930 | 9.30E-10 |
| Uric acid (mg/dL) | 0.1713 | 0.0351 | 1.04E-06 | 0.1283 | 0.0227 | 1.66E-08 |
| Weight (lbs.) | 0.0033 | 0.0011 | 2.36E-03 | 0.0106 | 0.0015 | 1.83E-12 |
Table 4
Covariates from model selection in European Americans and Mexican Americans.
| European Americans ( = 10,023) | Mexican Americans ( = 5,040) | |||||
|---|---|---|---|---|---|---|
| Variable | Estimate | SE | p-Value | Estimate | SE | p-Value |
| Chloride (mmol/L) | −0.0656 | 0.0077 | 1.99E-17 | −0.0534 | 0.0153 | 4.85E-04 |
| Insulin (mIU/L) | 0.0022 | 0.0051 | 6.76E-01 | 0.0111 | 0.0039 | 5.05E-03 |
| LDL cholesterol (mg/dL) | −0.0023 | 0.0006 | 1.38E-04 | −0.0049 | 0.0013 | 1.88E-04 |
| Potassium (mmol/L) | −0.3524 | 0.0683 | 2.49E-07 | −0.2331 | 0.1298 | 7.25E-02 |
| Uric acid (mg/dL) | 0.1391 | 0.0165 | 3.16E-17 | 0.0833 | 0.0315 | 8.28E-03 |
| Weight (lbs.) | 0.0150 | 0.0016 | 5.61E-21 | 0.0164 | 0.0027 | 2.72E-09 |
Table 5
Sexual dimorphism among covariates in HUFS.
| Variable | Male ( = 414) | Female ( = 600) | p-Value |
|---|---|---|---|
| Chloride (mmol/L) | 101.4 (4.4) | 101.1 (5.3) | 0.482 |
| Insulin (mIU/L) | 10.9 (15.3) | 12.0 (11.9) | 0.228 |
| LDL cholesterol (mg/dL) | 111.3 (38.0) | 117.9 (38.7) | 7.28E-03 |
| Potassium (mmol/L) | 4.5 (0.7) | 4.4 (1.3) | 0.052 |
| Uric acid (mg/dL) | 6.3 (1.5) | 5.0 (1.5) | 6.36E-35 |
| Weight (lbs.) | 194.4 (52.2) | 186.1 (52.5) | 0.014 |
Table 6
Time-dependence for selected covariates in HUFS.
| Interaction term | AIC |
|---|---|
| None | 1096.053 |
| Age × chloride | 1096.695 |
| Age × insulin | 1097.190 |
| Age × low-density lipoprotein cholesterol | 1097.748 |
| Age × potassium | 1097.956 |
| Age × uric acid | 1097.919 |
| Age × weight | 1097.013 |
Key resources table
| Reagent type (species) or resource | Designation | Source or reference | Identifiers | Additional information |
|---|---|---|---|---|
| Software, algorithm | R Project for Statistical Computing | R Project for Statistical Computing | RRID:SCR_001905 |
Additional files
-
Supplementary file 1
Source data for the Howard University Family Study.
- https://cdn.elifesciences.org/articles/62998/elife-62998-supp1-v1.xlsx
-
Supplementary file 2
Source data for the National Health and Nutrition Examination Survey.
- https://cdn.elifesciences.org/articles/62998/elife-62998-supp2-v1.xlsx
-
Transparent reporting form
- https://cdn.elifesciences.org/articles/62998/elife-62998-transrepform-v1.docx
Download links
A two-part list of links to download the article, or parts of the article, in various formats.
Downloads (link to download the article as PDF)
Open citations (links to open the citations from this article in various online reference manager services)
Cite this article (links to download the citations from this article in formats compatible with various reference manager tools)
Time-to-event modeling of hypertension reveals the nonexistence of true controls
eLife 9:e62998.
https://doi.org/10.7554/eLife.62998


