Short-term exposure to intermittent hypoxia leads to changes in gene expression seen in chronic pulmonary disease
- Divisions of Human Genetics and Immunobiology, Center for Circadian Medicine, Department of Pediatrics, Cincinnati Children’s Hospital Medical Center, United States
- Department of Pharmacology and Systems Physiology, University of Cincinnati College of Medicine, United States
- Division of Pediatric Otolaryngology - Head and Neck Surgery, Cincinnati Children’s Hospital Medical Center, United States
- Division of Developmental Biology, Cincinnati Children’s Hospital Medical Center, United States
- Division of Pulmonary Biology, Cincinnati Children’s Hospital Medical Center, United States
- Division of Biomedical Informatics, Cincinnati Children’s Hospital Medical Center, United States
- Division of Pulmonary Medicine and the Sleep Center, Cincinnati Children’s Hospital Medical Center, United States
- The Center for Circadian Medicine, Cincinnati Children’s Hospital Medical Center, United States
- Department of Otolaryngology-Head and Neck Surgery, University of Cincinnati College of Medicine, United States
Figures
Figure 1 with 2 supplements
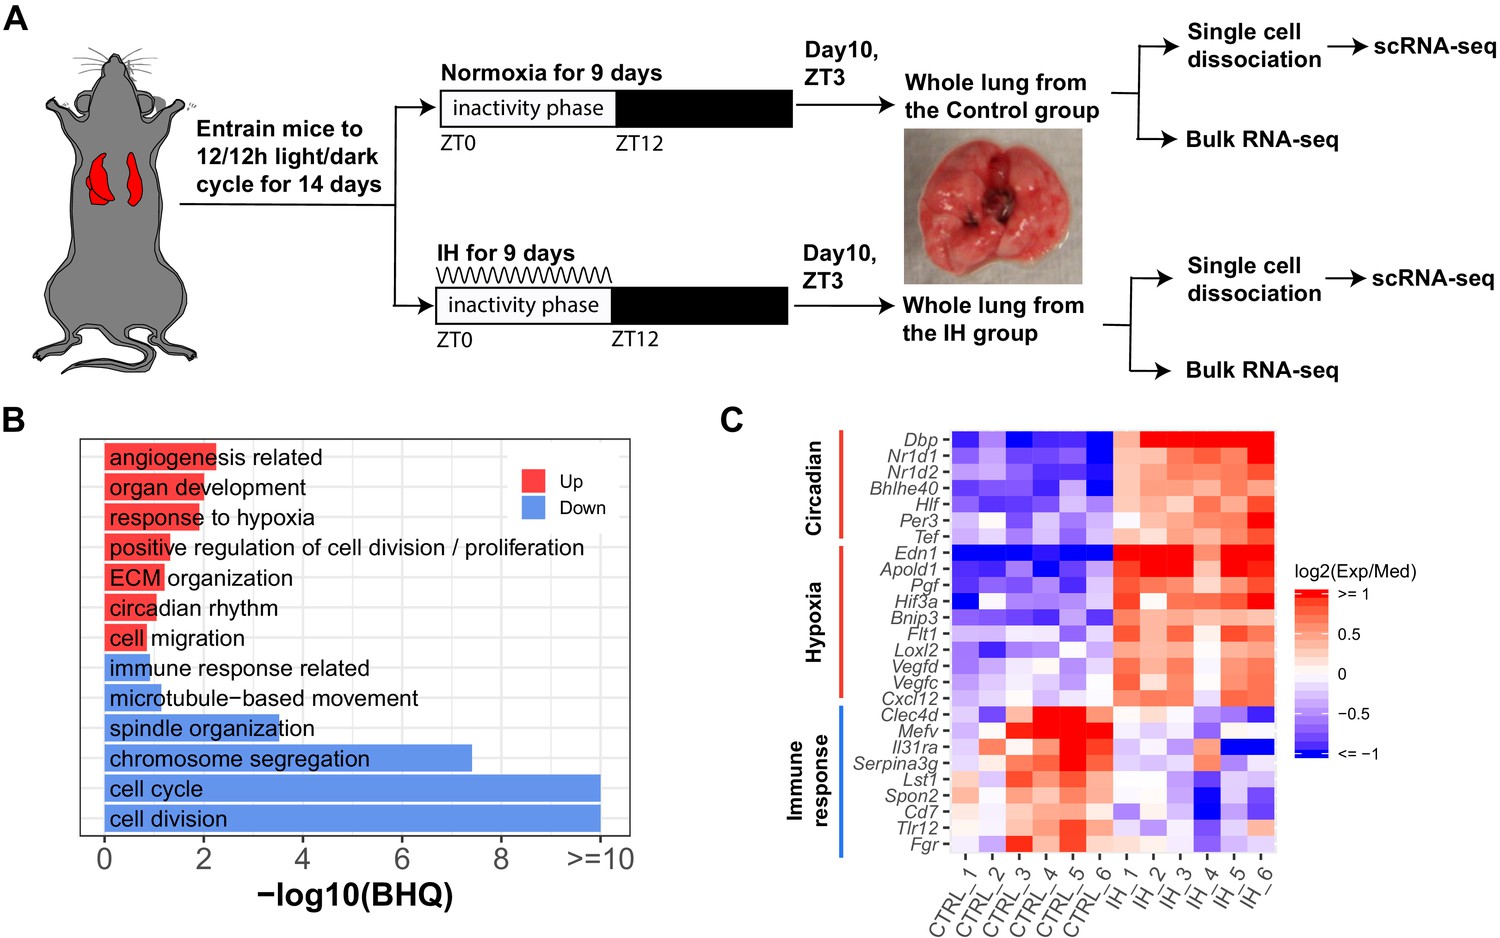
Short-term exposure to intermittent hypoxia reshapes circadian and immune pathways in the lung.
(A) Schematic of IH protocol. Mice are entrained to the same 12 hr:12 hr light:dark cycle for 14 days prior to IH exposure. Mice are exposed to normoxia (controls) or intermittent episodes of hypoxia (21–6% oxygen saturation) followed by recovery to 21% oxygen over the entire 12 hr inactivity phase for 9 days. Mice are then sacrificed at ZT 3 (3 h after lights-on) on the 10th day for tissue harvest. Bulk RNA-seq and scRNA-seq were performed for each group. (B) Biological processes enriched in lung from mice exposed to IH vs controls. Enrichment analysis was performed in the DAVID database, using the top 200 up- and downregulated genes identified from differential expression analyses. Redundant biological processes are merged into one category. Biological processes enriched in up- and downregulated genes are indicated in red and blue bars, respectively. (C) The heatmap shows the fold change of associated genes in circadian rhythm, response to hypoxia, and immune response. The red and blue indicate up- and downregulated genes in the experimental group. There are six biological replicates for each group.
-
Figure 1—source data 1
Numerical data for Figure 1B,C, Figure 1—figure supplement 2.
- https://cdn.elifesciences.org/articles/63003/elife-63003-fig1-data1-v3.zip
Figure 1—figure supplement 1
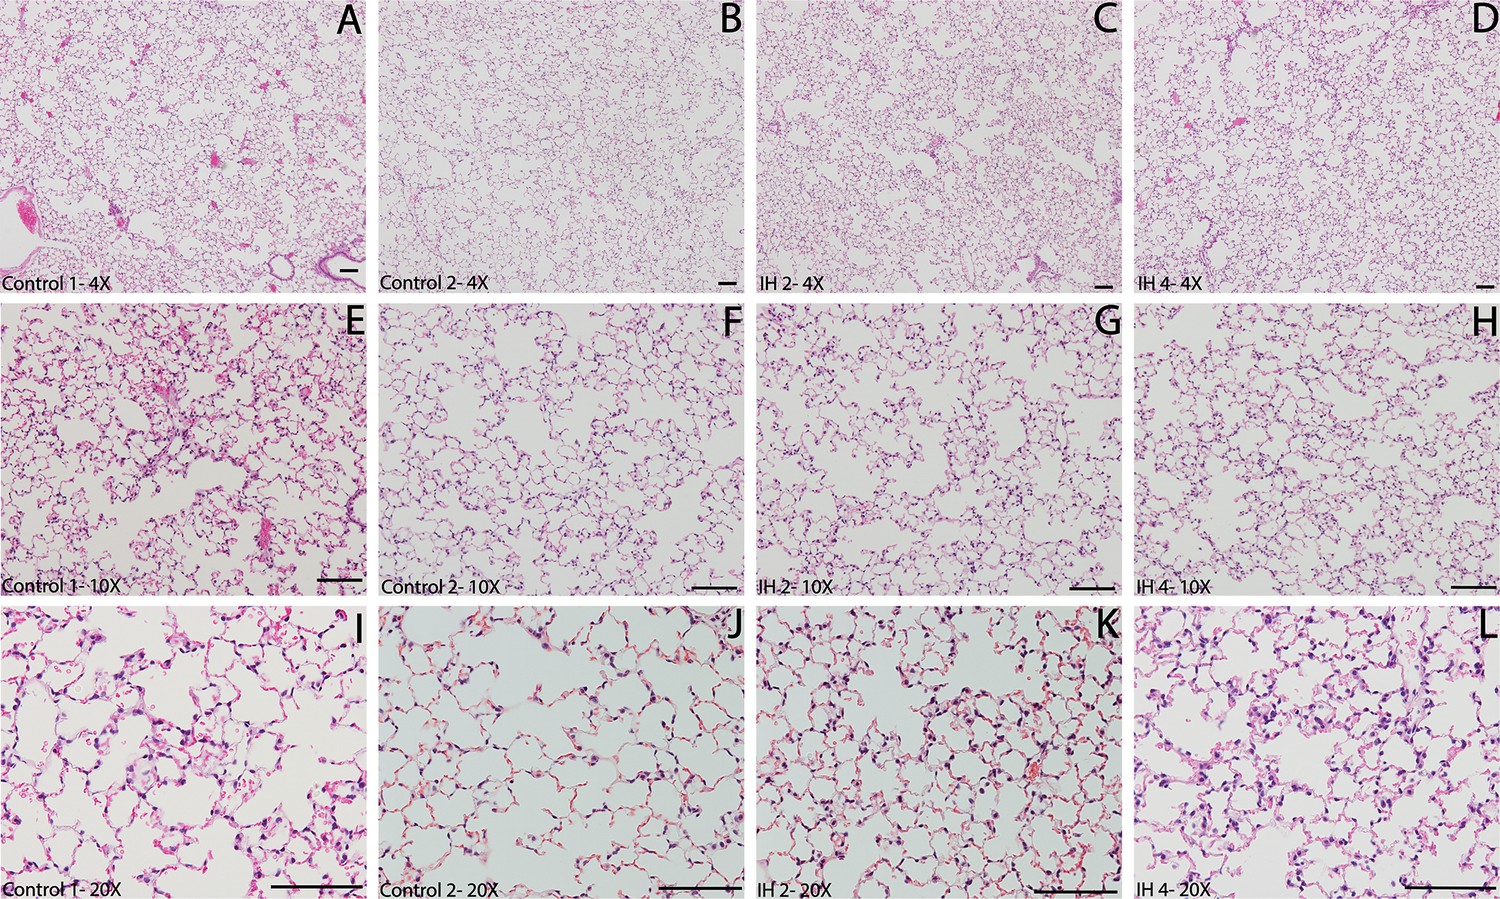
Hematoxylin and eosin (HE)-stained sections of whole lung from mice exposed to IH vs controls do not reveal comprehensive histologic changes.
Two representative IH and two control mice with HE-stained sections were shown at 4× (A–D), 10× (E–H), and 20× (I–L) magnification. The scale bars all correlate to 100 µm width.
Figure 1—figure supplement 2
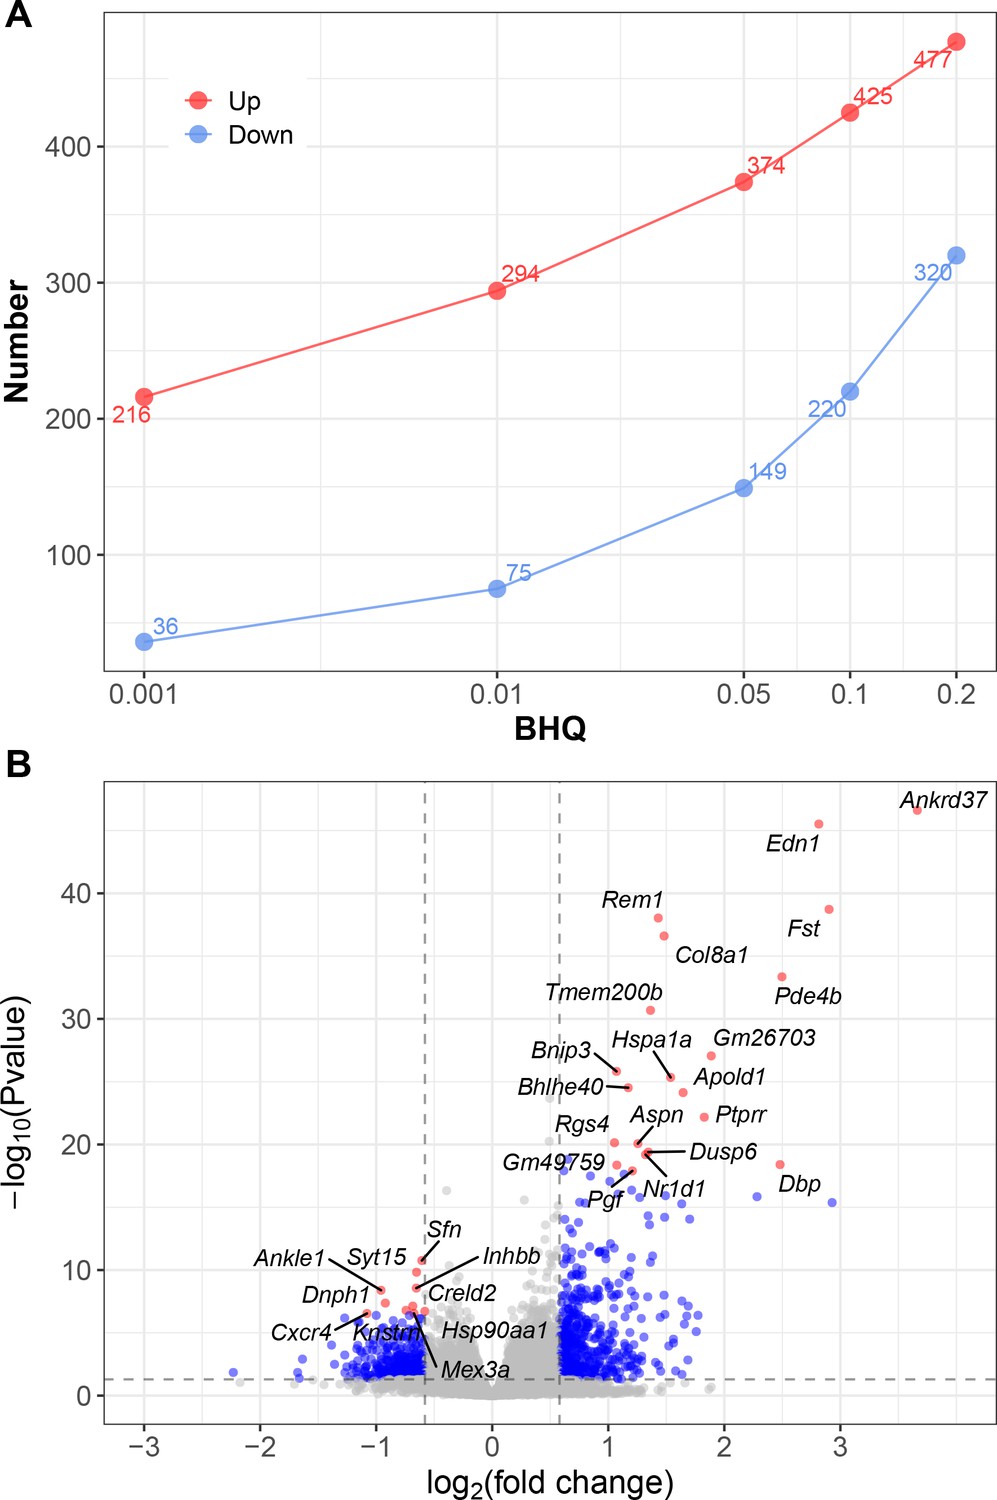
Differentially expressed genes from bulk RNA-seq analysis of whole lung from mice exposed to IH vs controls.
(A) At series BHQ cutoffs, the number of up- and downregulated genes in response to IH are shown with red and blue lines, respectively. (B) A volcano plot shows the differentially expressed genes from lung of mice exposed to IH. Ranked by p-value, top 20 upregulated genes and top 10 downregulated genes were labeled.
Figure 2 with 1 supplement
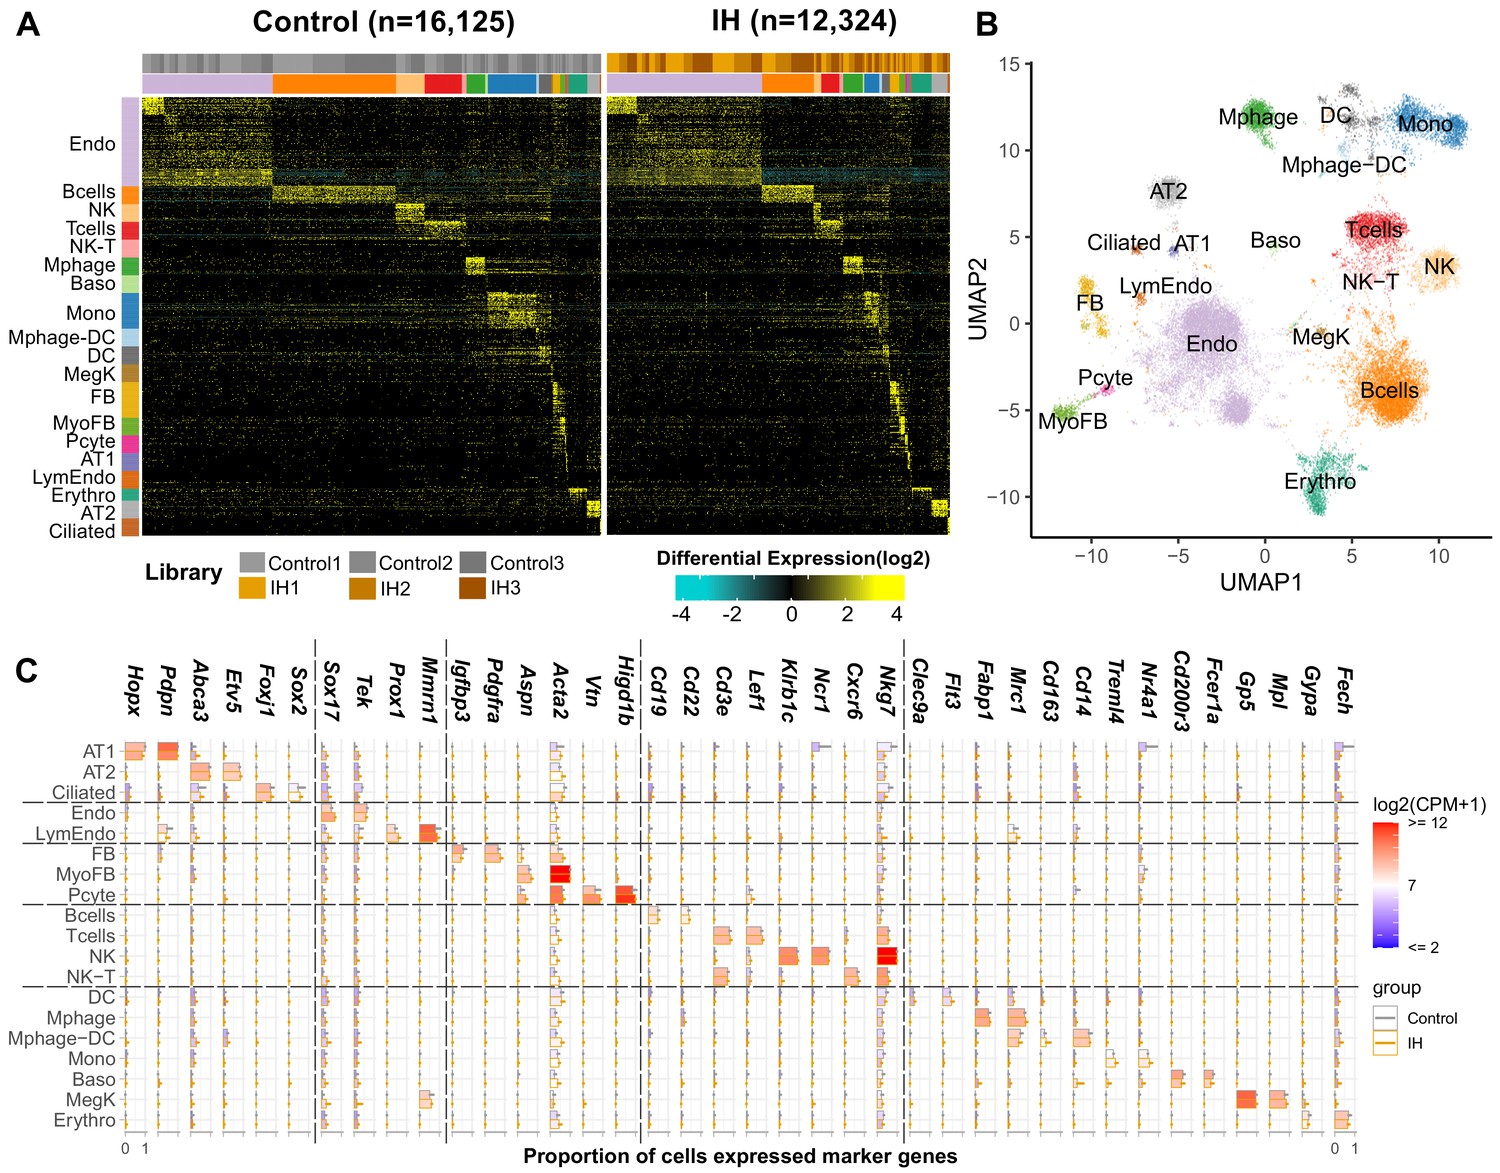
Single-cell sequencing identifies 19 distinct cell types in the lungs of intermittent hypoxia and control mice.
(A) Heat map of AltAnalyze selected marker genes for each cell population. Columns and rows represent individual cells and marker genes, respectively. Biological replicates and cell types are indicated by the color bars on the top. cellHarmony was used to align cells from control to IH groups. (B) UMAP projection of whole lung cell populations from IH and control mice in the heatmap. (C) Expression of marker genes for each cell type from experimental and control mice. Error bars indicate standard deviation of cell proportion from the three replicates. The list of cell types include endothelial cells (Endo), B cells (Bcells), natural killer cells (NK), T cells (Tcells), natural killer T cells (NK-T), macrophages (Mphage), basophils (Baso), monocytes (Mono), macrophages-dendritic CD163+ cells (Mphage-DC), dendritic cells (DC), megakaryocytes (MegK), fibroblasts (FB), myofibroblasts (MyoFB), pericytes (Pcyte), alveolar epithelial type I cells (AT1), lymphatic endothelial cells (LymEndo), erythroblasts (Erythro), alveolar epithelial type II cells (AT2), and ciliated cells (Ciliated). CPM indicates UMI count per million.
-
Figure 2—source data 1
Numerical data for Figure 2, Figure 2—figure supplement 1.
- https://cdn.elifesciences.org/articles/63003/elife-63003-fig2-data1-v3.zip
Figure 2—figure supplement 1
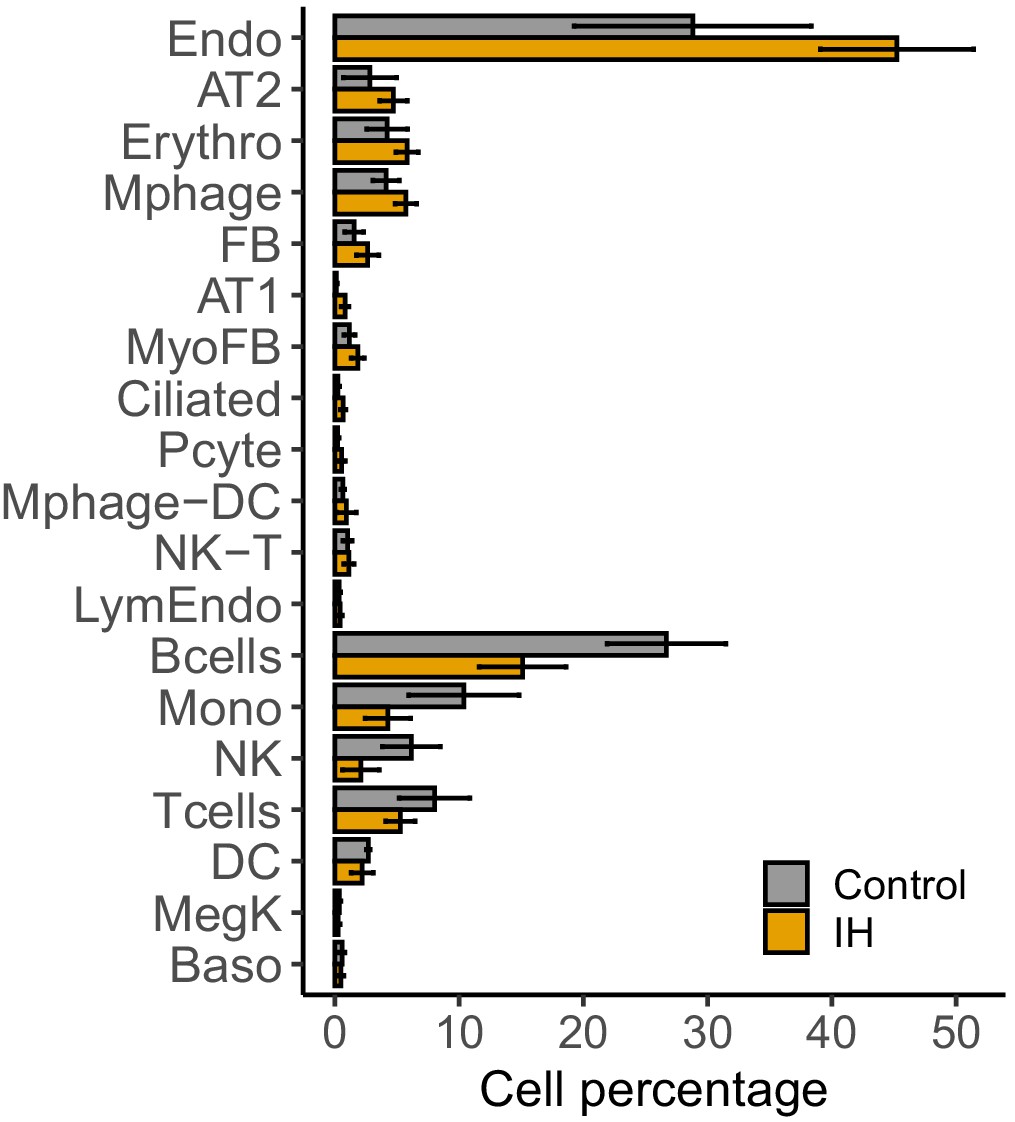
Percentage of detected lung cell types from mice exposed to IH vs controls.
(A) Percentage of each cell type from experimental and control mice. Error bars indicate standard deviation of cell proportion from the three biological replicates. The list of cell types include: endothelial cells (Endo), B cells (Bcells), natural killer cells (NK), T cells (Tcells), natural killer T cells (NK-T), macrophages (Mphage), basophils (Baso), monocytes (Mono), macrophages-dendritic CD163+ cells (Mphage-DC), dendritic cells (DC), megakaryocytes (MegK), fibroblasts (FB), myofibroblasts (MyoFB), pericytes (Pcyte), alveolar epithelial type I cells (AT1), lymphatic endothelial cells (LymEndo), erythroblasts (Erythro), alveolar epithelial type II cells (AT2), and ciliated cells (Ciliated).
Figure 3 with 2 supplements
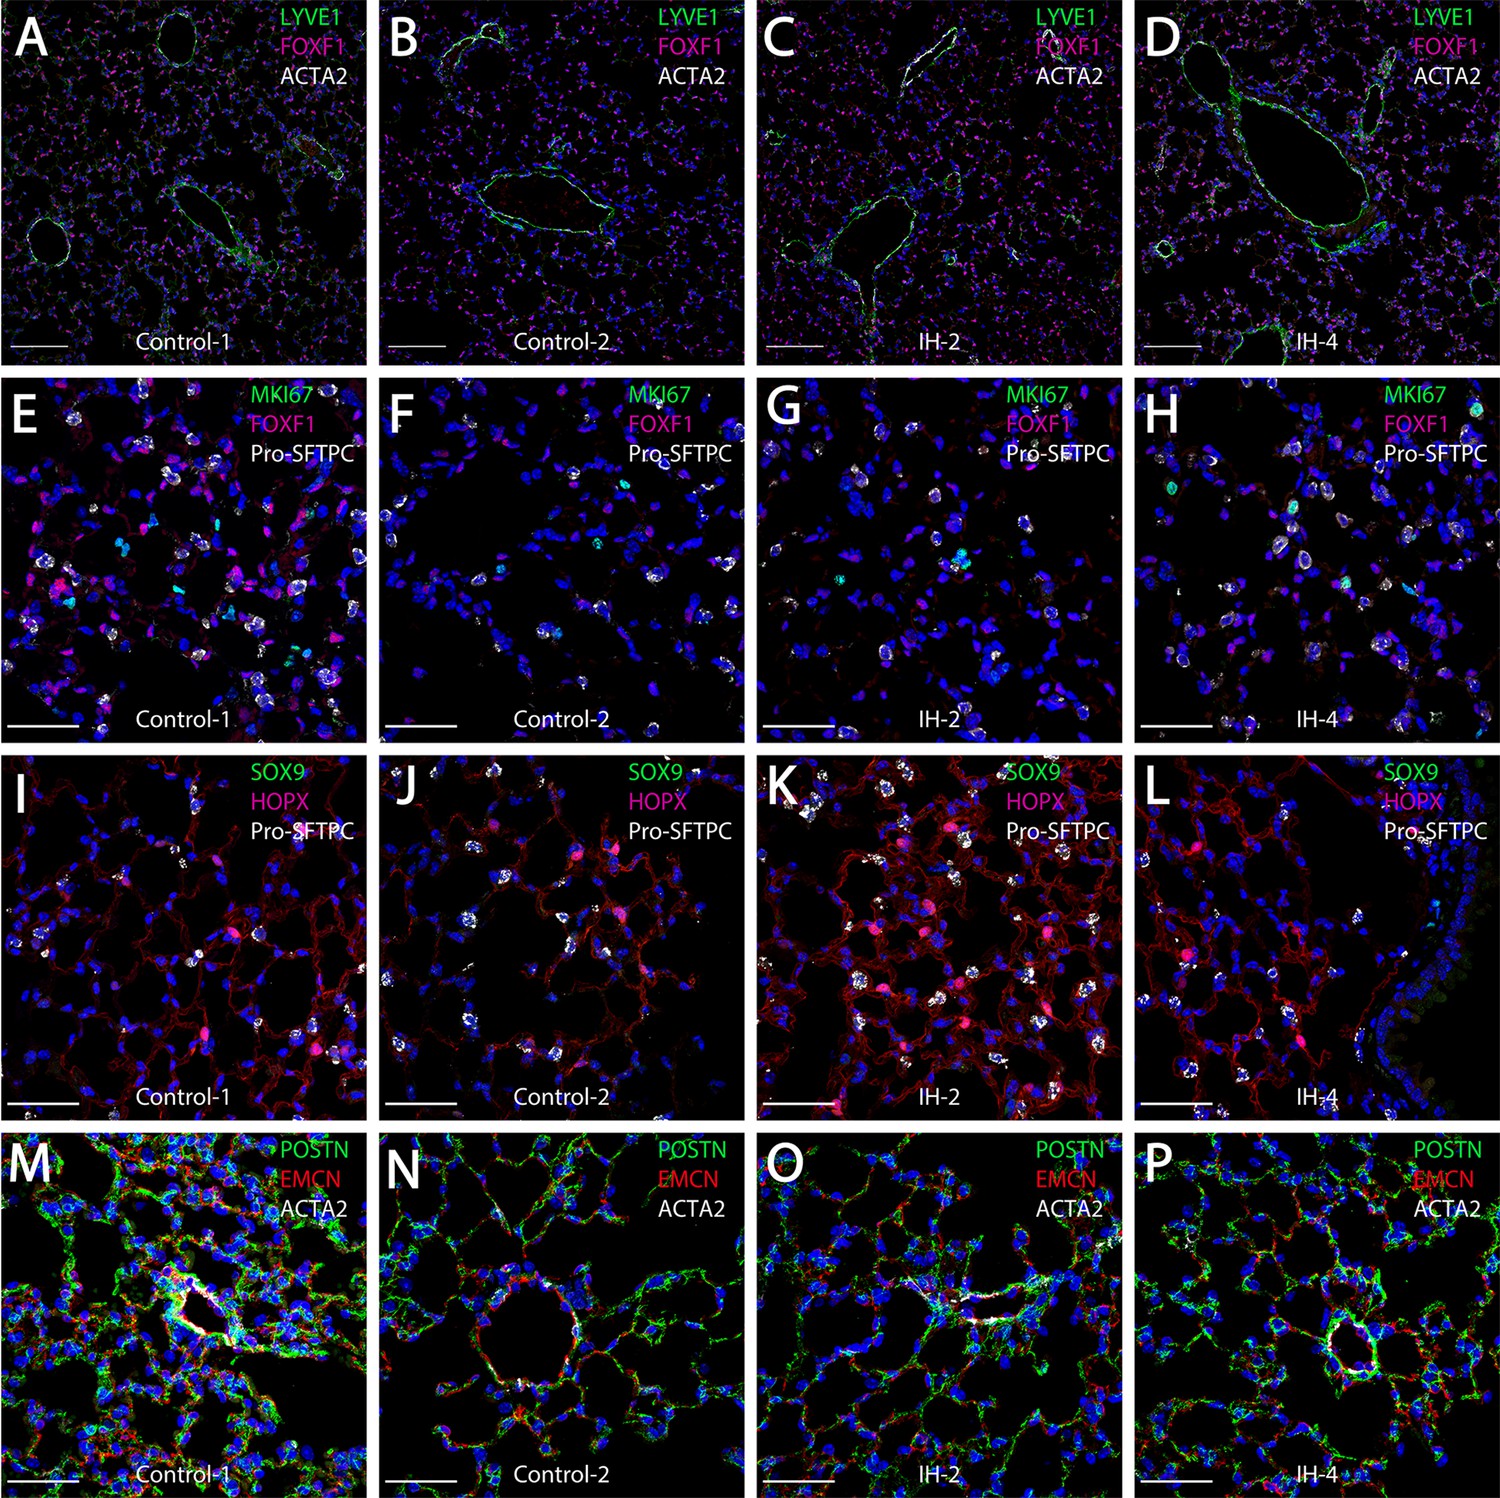
Short-term exposure to intermittent hypoxia did not lead to comprehensive histologic changes in the lung.
(A–D) Immunostaining for LYVE1, FOXF1, and ACTA2: LYVE1 is expressed at high levels in lymphatic and vascular endothelial cells. FOXF1 and ACTA2 are expressed at high levels in vascular endothelial and smooth muscle cells, respectively. (E–H) Immunostaining for MKI67, FOXF1, and Pro-SFTPC: MKI67 is a marker for cell proliferation. Pro-SFTPC shows high expression levels in alveolar epithelial type II cells. (I–L) Expression levels of SOX9, HOPX, and Pro-SFTPC: SOX9 is a marker for progenitor cells. HOPX shows high expression levels in the alveolar epithelial type I cells. (M–P) Immunostaining for POSTN, EMCN, and ACTA2: POSTN is used to stain extracellular matrix. EMCN is a marker for capillaries and veins/venules. The scale bars for (A–D) represent 100 µm. The scale bars for (E–P) represent 40 µm.
-
Figure 3—source data 1
Numerical data for Figure 3—figure supplements 1 and 2.
- https://cdn.elifesciences.org/articles/63003/elife-63003-fig3-data1-v3.zip
Figure 3—figure supplement 1
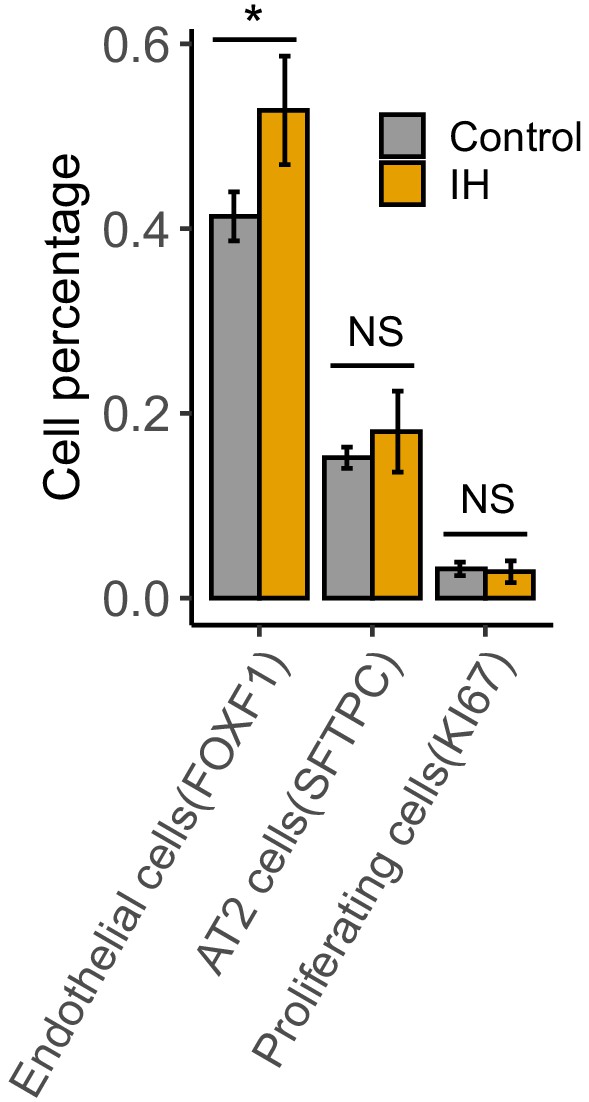
The cell percentages for endothelial, AT2, and proliferating cells in mice lung exposed to IH vs controls.
The cell counts are quantified from confocal images. Error bars indicate standard deviation of cell proportion from four biological replicates per group. *BHQ < 0.05; NS, not significant.
Figure 3—figure supplement 2
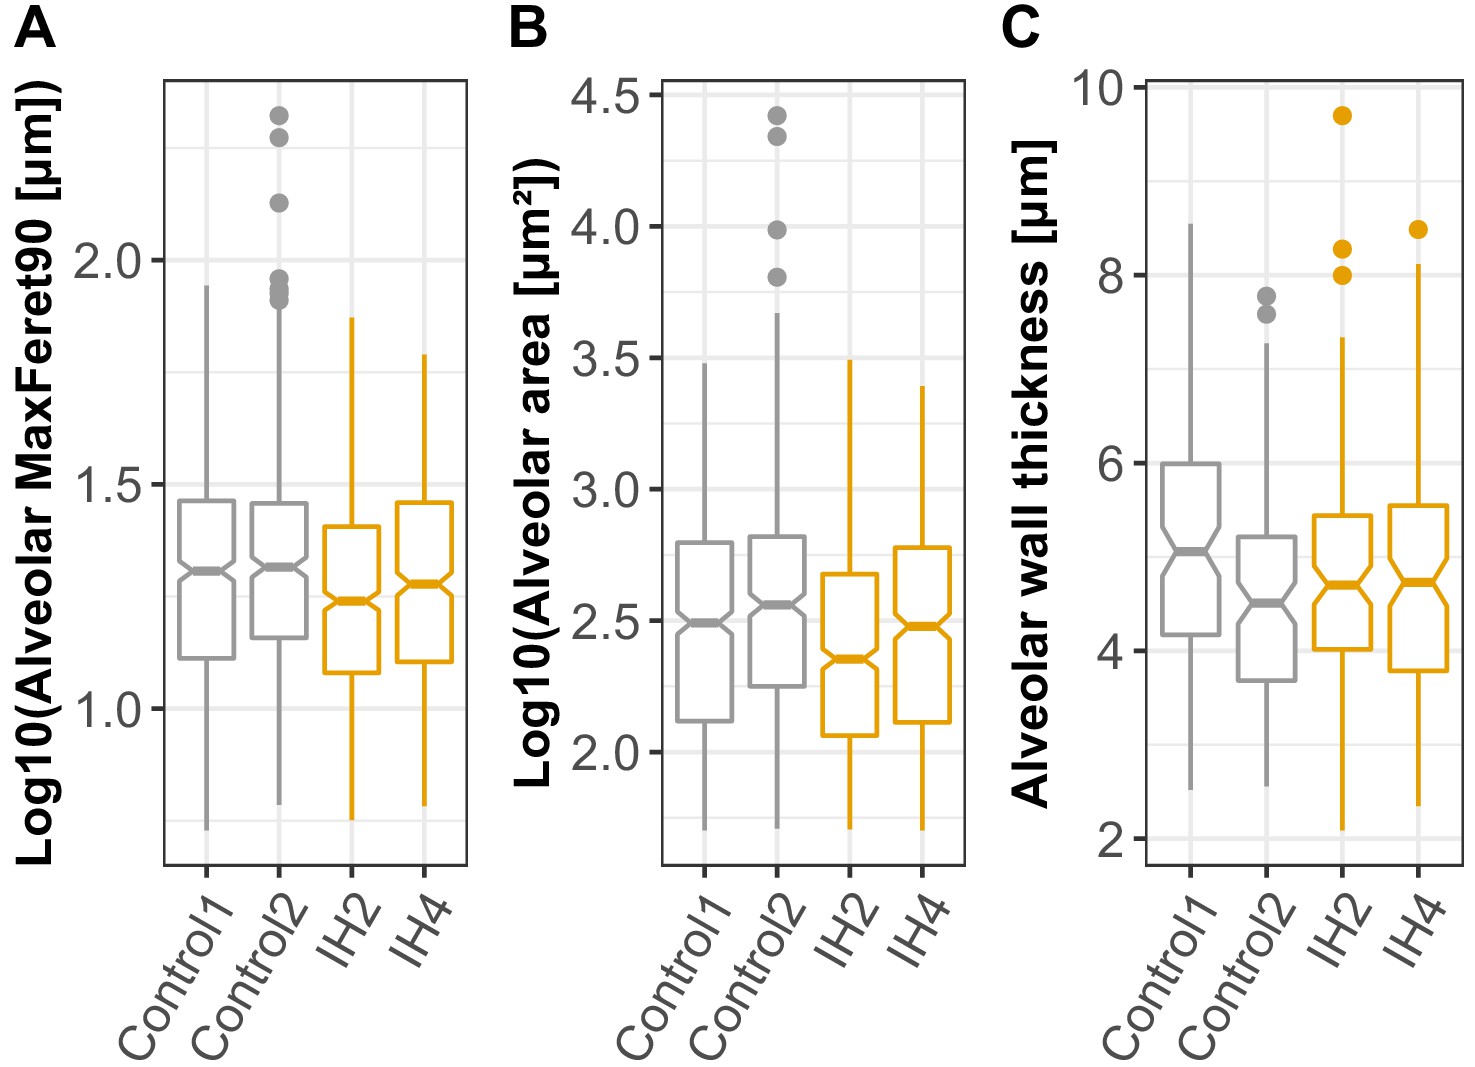
Alveolar area and alveolar wall thickness are quantified from confocal images for mice exposed to IH compared to controls.
MaxFeret90 (A) and alveolar areas (B) are quantified in Nikon Elements. Maxferet90 is the distance measured orthogonally to the maximum feret chord. The higher Maxferet90 value indicates larger space in the alveolus. N = 2 mice for controls and IH-exposed mice, with three images per mouse. Autofluorescence with the TRITC channel was used to define alveolar areas. (C) Alveolar wall thickness was quantified in Imaris, using the measurement tool for autofluorescence to define the alveolar walls. A total of 20 alveolar wall thickness measurements were taken for each 60× magnification confocal image (n = 2 mice per treatment, six images per mouse).
Figure 4 with 2 supplements
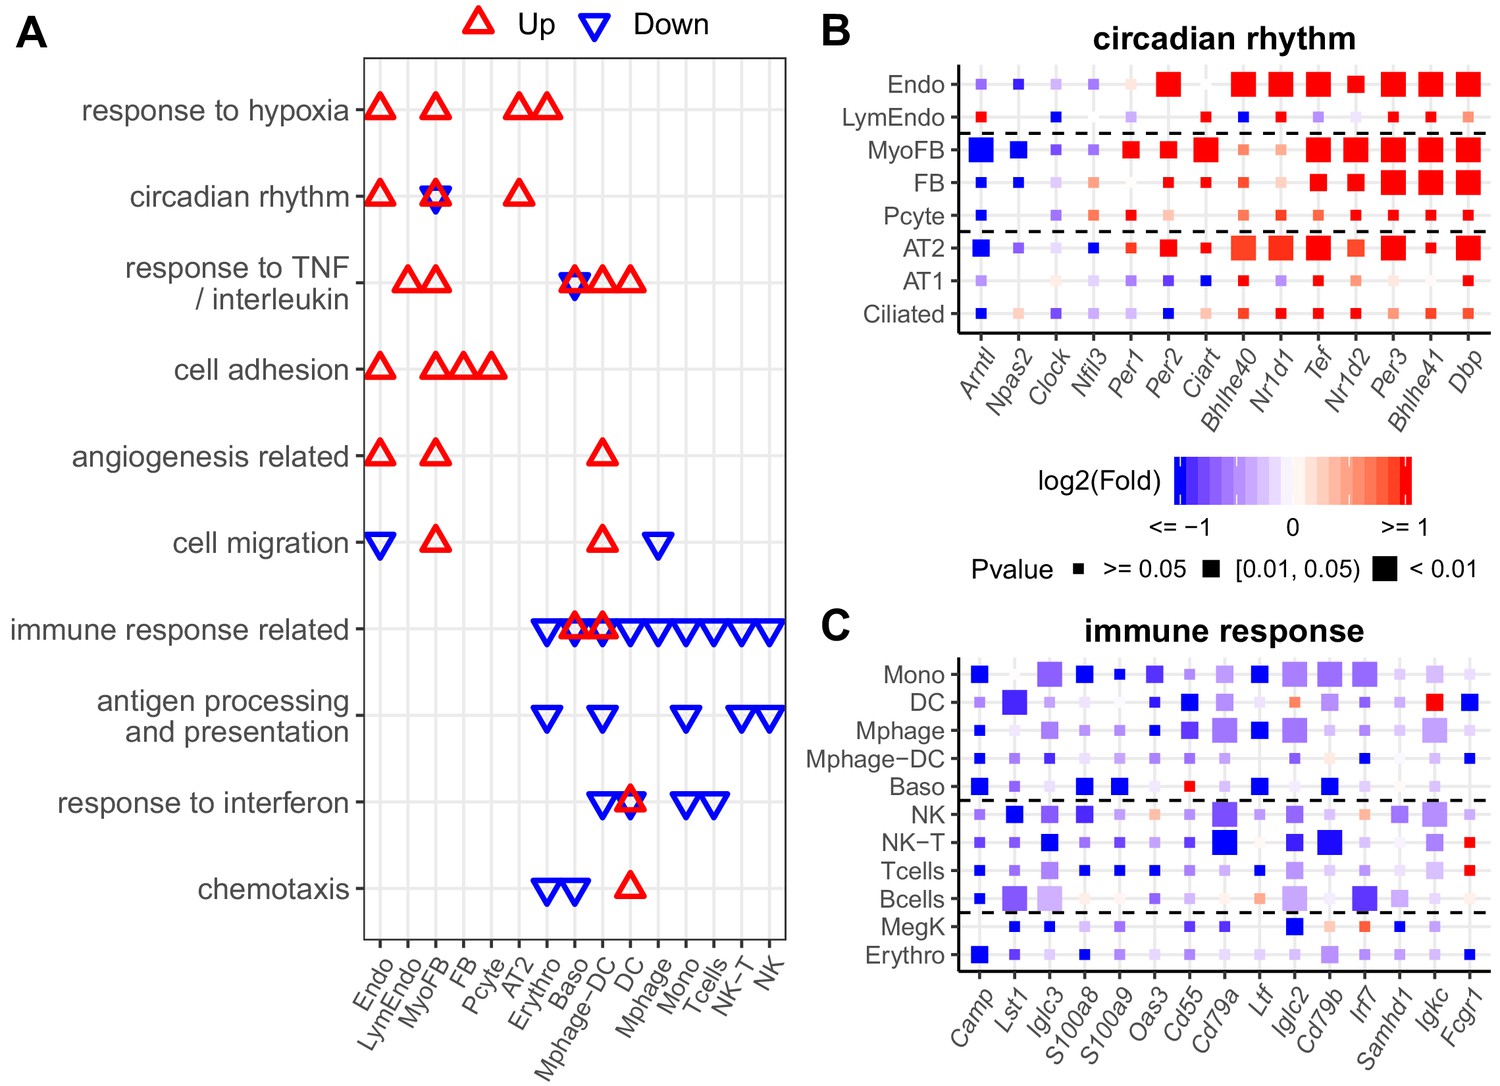
Diverse expression pathways were up- and downregulated in the presence of intermittent hypoxia.
(A) Biological processes enriched in different cell types from lungs of mice exposed to IH vs controls. Enrichment analysis was performed in the DAVID database, using the top 200 up- and downregulated genes identified from each cell type. Redundant biological processes are merged into one category. Biological processes enriched in up- and downregulated genes are indicated in red and blue triangles, respectively. (B) Expression variation of well-established genes involved in circadian rhythm for endothelial, epithelial, and mesenchymal cells. (C) Expression variation of well-established genes involved in immune response for immune-associated cells. For (B) and (C), the fold change is indicated by the color, and the p-value for differential expression is indicated by the point size. The list of cell types include: endothelial cells (Endo), B cells (Bcells), natural killer cells (NK), T cells (Tcells), natural killer T cells (NK-T), macrophages (Mphage), basophils (Baso), monocytes (Mono), macrophages-dendritic CD163+ cells (Mphage-DC), dendritic cells (DC), megakaryocytes (MegK), fibroblasts (FB), myofibroblasts (MyoFB), pericytes (Pcyte), alveolar epithelial type I cells (AT1), lymphatic endothelial cells (LymEndo), erythroblasts (Erythro), alveolar epithelial type II cells (AT2), and ciliated cells (Ciliated).
-
Figure 4—source data 1
Numerical data for Figure 4, Figure 4—figure supplements 1 and 2.
- https://cdn.elifesciences.org/articles/63003/elife-63003-fig4-data1-v3.zip
Figure 4—figure supplement 1
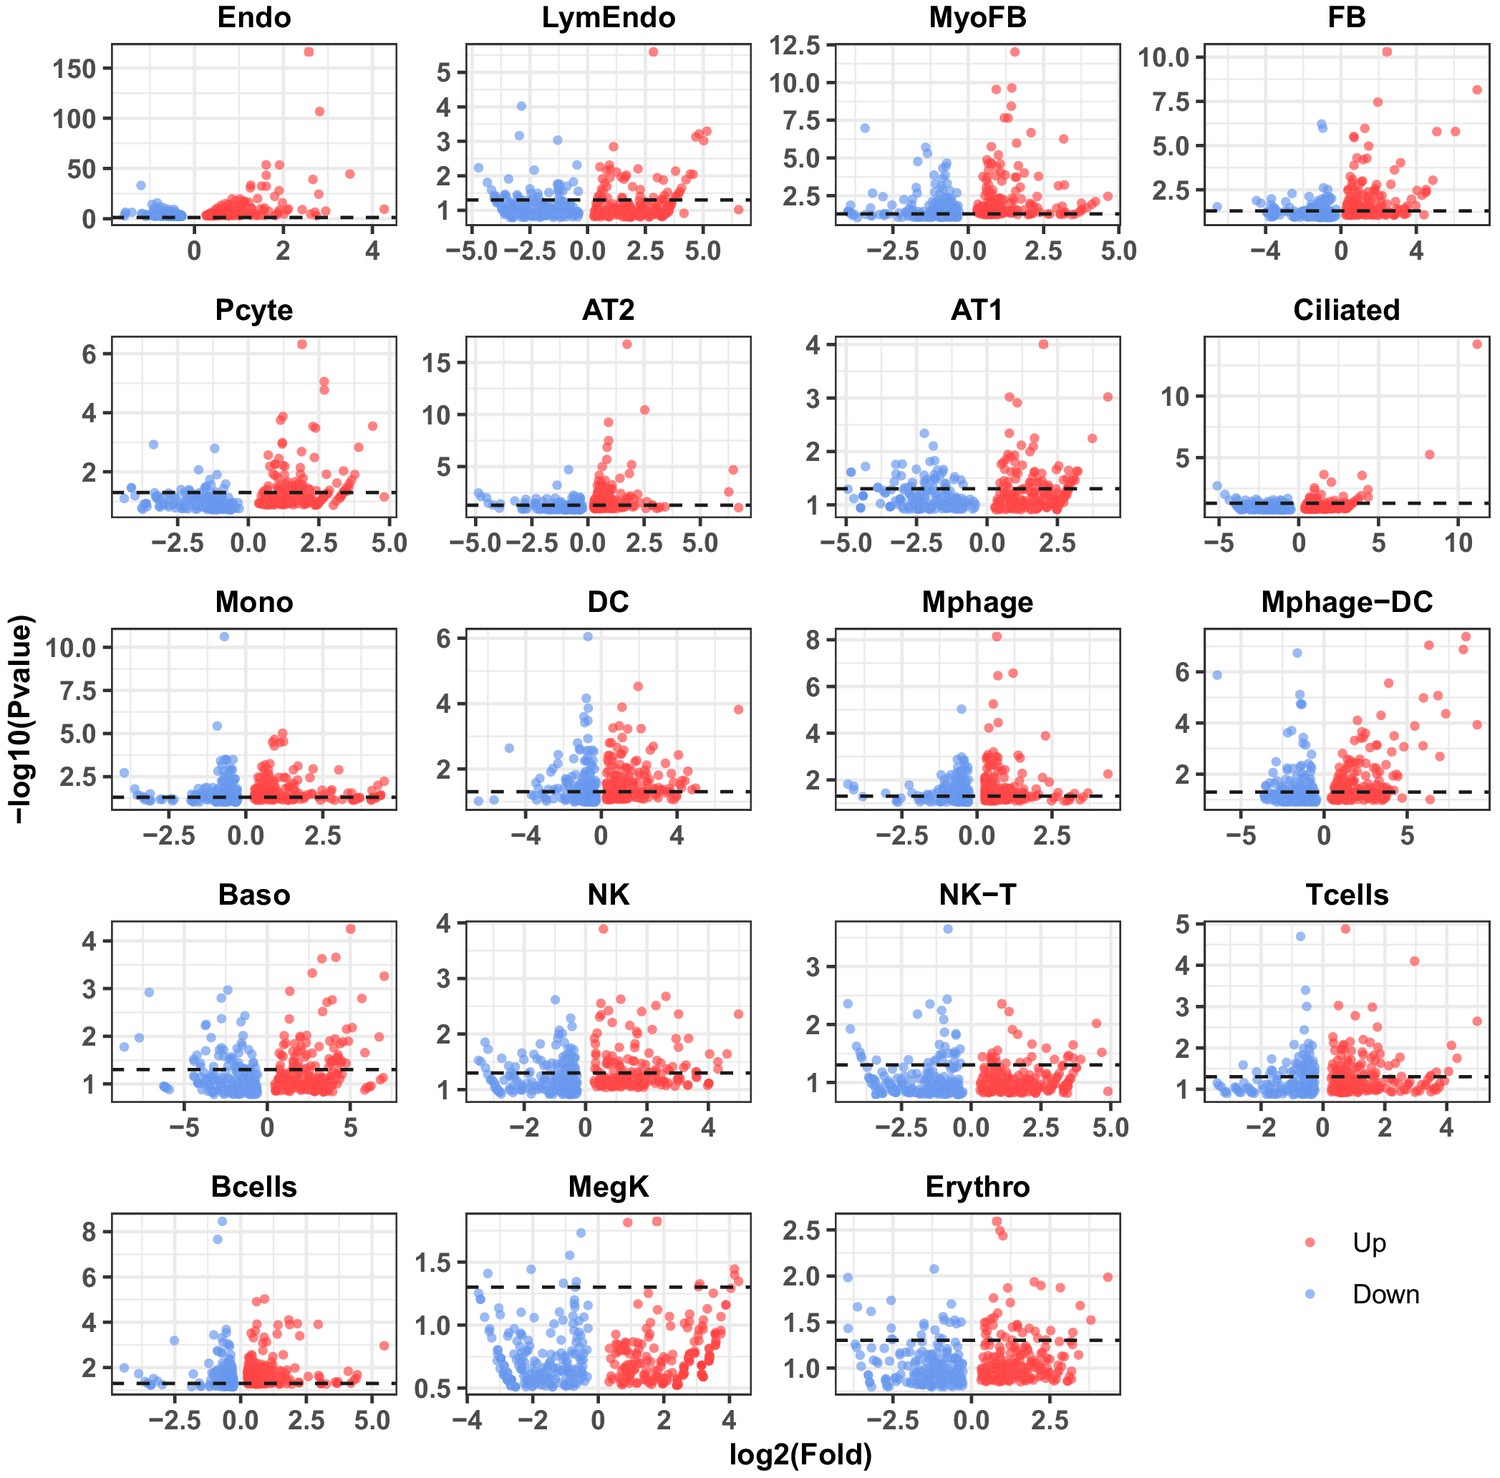
p-value distribution of the top 200 up- and downregulated IH-responsive genes in 19 lung cell types.
Each red or blue point indicates one up- or downregulated gene. The black dashed line indicates a p-value of 0.05.
Figure 4—figure supplement 2

Enriched biological processes from differentially expressed genes from whole mouse lungs exposed to IH vs controls.
This figure shows enriched biological processes that were not listed in Figure 4. Those biological processes enriched in one specific cell type were shown in (B) while others were shown in (A). Enrichment analysis was performed in the DAVID database using the top 200 up- and downregulated genes identified from each cell type. Redundant biological processes are merged into one category. Biological processes enriched in up- and downregulated genes are indicated by red and blue triangles, respectively.
Figure 5 with 3 supplements
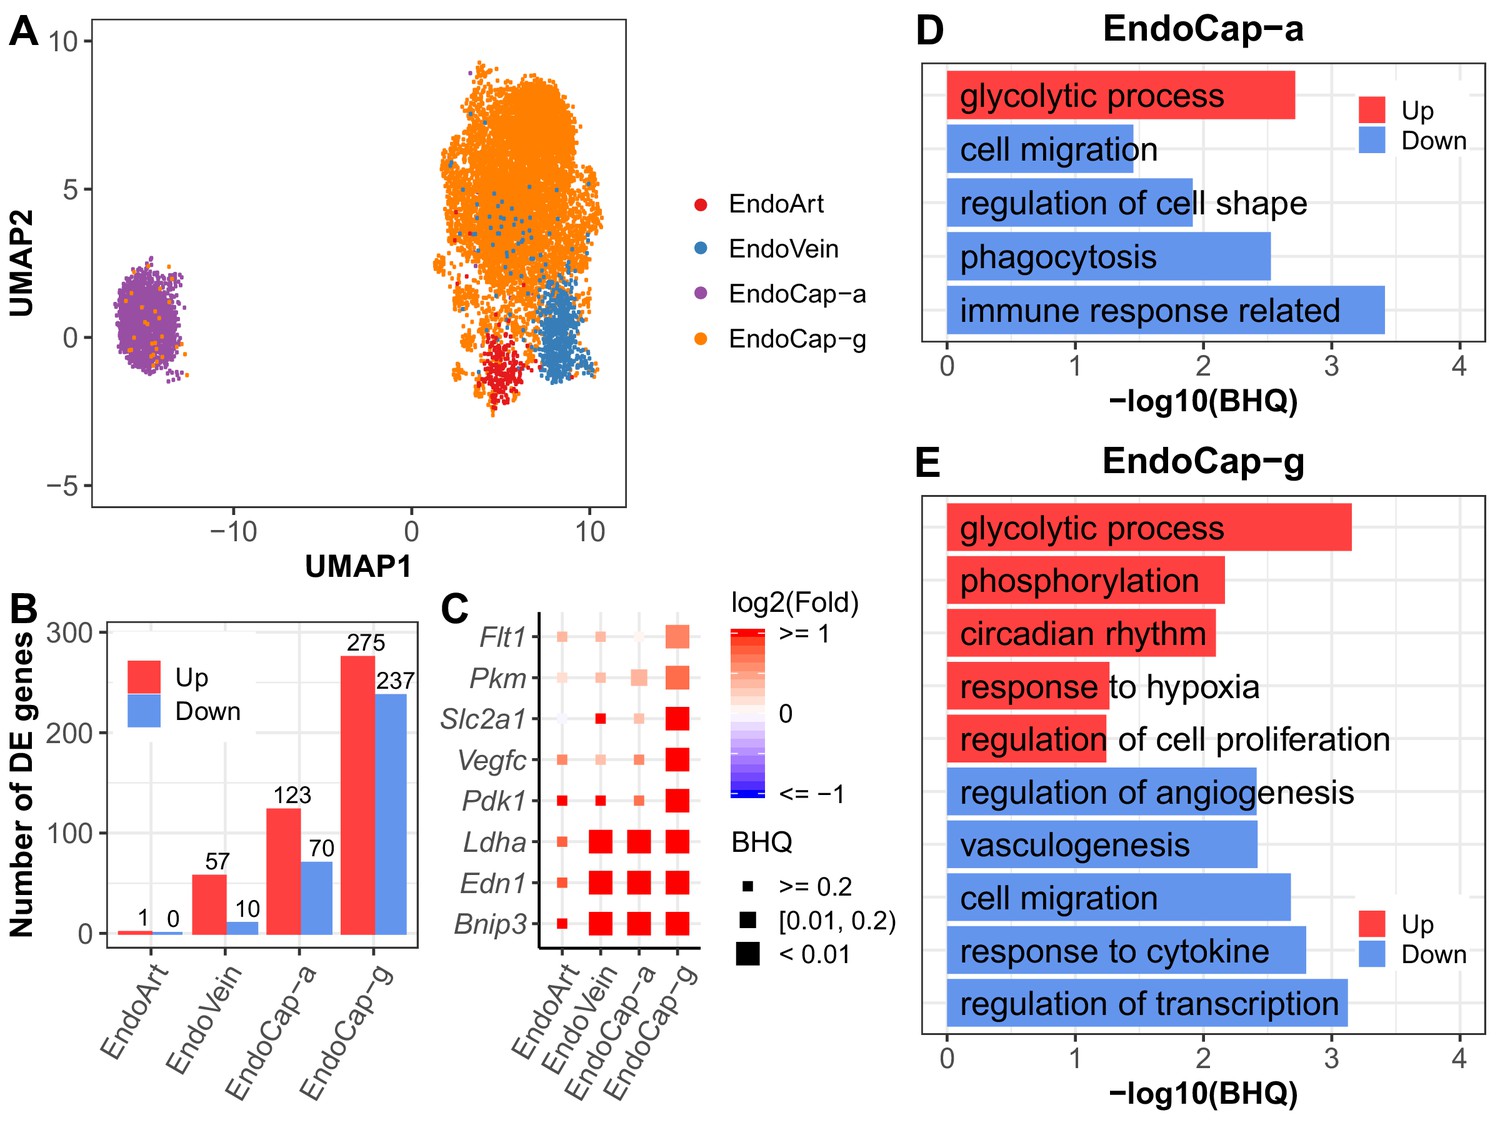
Pulmonary vascular endothelial subpopulations show distinctive responses to intermittent hypoxia.
(A) UMAP projection of cells from four lung endothelial subpopulations. There are 22 cells outside the range of this figure. (B) The number of differentially expressed (BHQ < 0.2) genes in each endothelial subpopulation from IH vs controls. (C) Expression variation of related genes in response to IH is shown for each endothelial subpopulation. Biological processes enriched in aerocytes (D) and general capillary cells (E) from IH vs control mice. Enrichment analysis was performed in the DAVID database, using up- and downregulated genes (BHQ < 0.2). Redundant biological processes are merged into one category. Top five biological processes enriched in up and downregulated genes are indicated in red and blue bars, respectively. The list of endothelial subpopulations include endothelial artery (EndoArt), vein (EndoVein), general capillary (EndoCap-g) cells, and aerocytes (EndoCap-a).
-
Figure 5—source data 1
Numerical data for Figure 5, Figure 5—figure supplements 1–3.
- https://cdn.elifesciences.org/articles/63003/elife-63003-fig5-data1-v3.zip
Figure 5—figure supplement 1
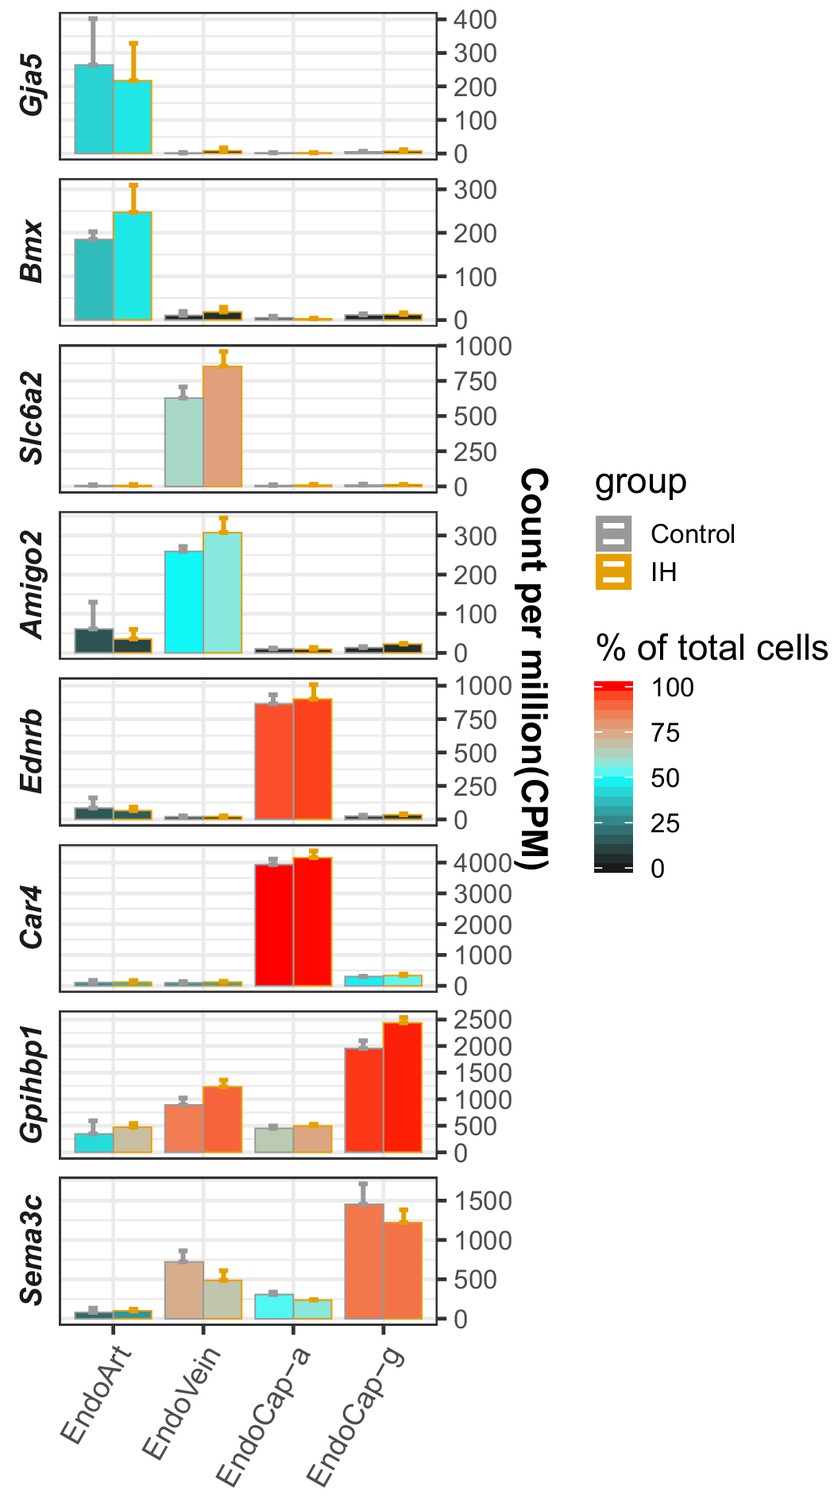
Validation of endothelial subpopulation assignments with known markers.
The marker genes collected from the literature and assigned endothelial subpopulations are listed on the y-axis and x-axis, respectively. The average CPM (count per million reads) of three replicates from control (gray) and IH (orange)-exposed mice are indicated by the height of the bar. The error bars indicate standard deviation based on the three biological replicates. The average percentage of cells with detected expression of each marker gene among the endothelial subpopulations is indicated by the heatmap color. The four endothelial subpopulations include endothelial artery (EndoArt), vein (EndoVein), general capillary (EndoCap-g) cells, and capillary aerocytes (EndoCap-a).
Figure 5—figure supplement 2
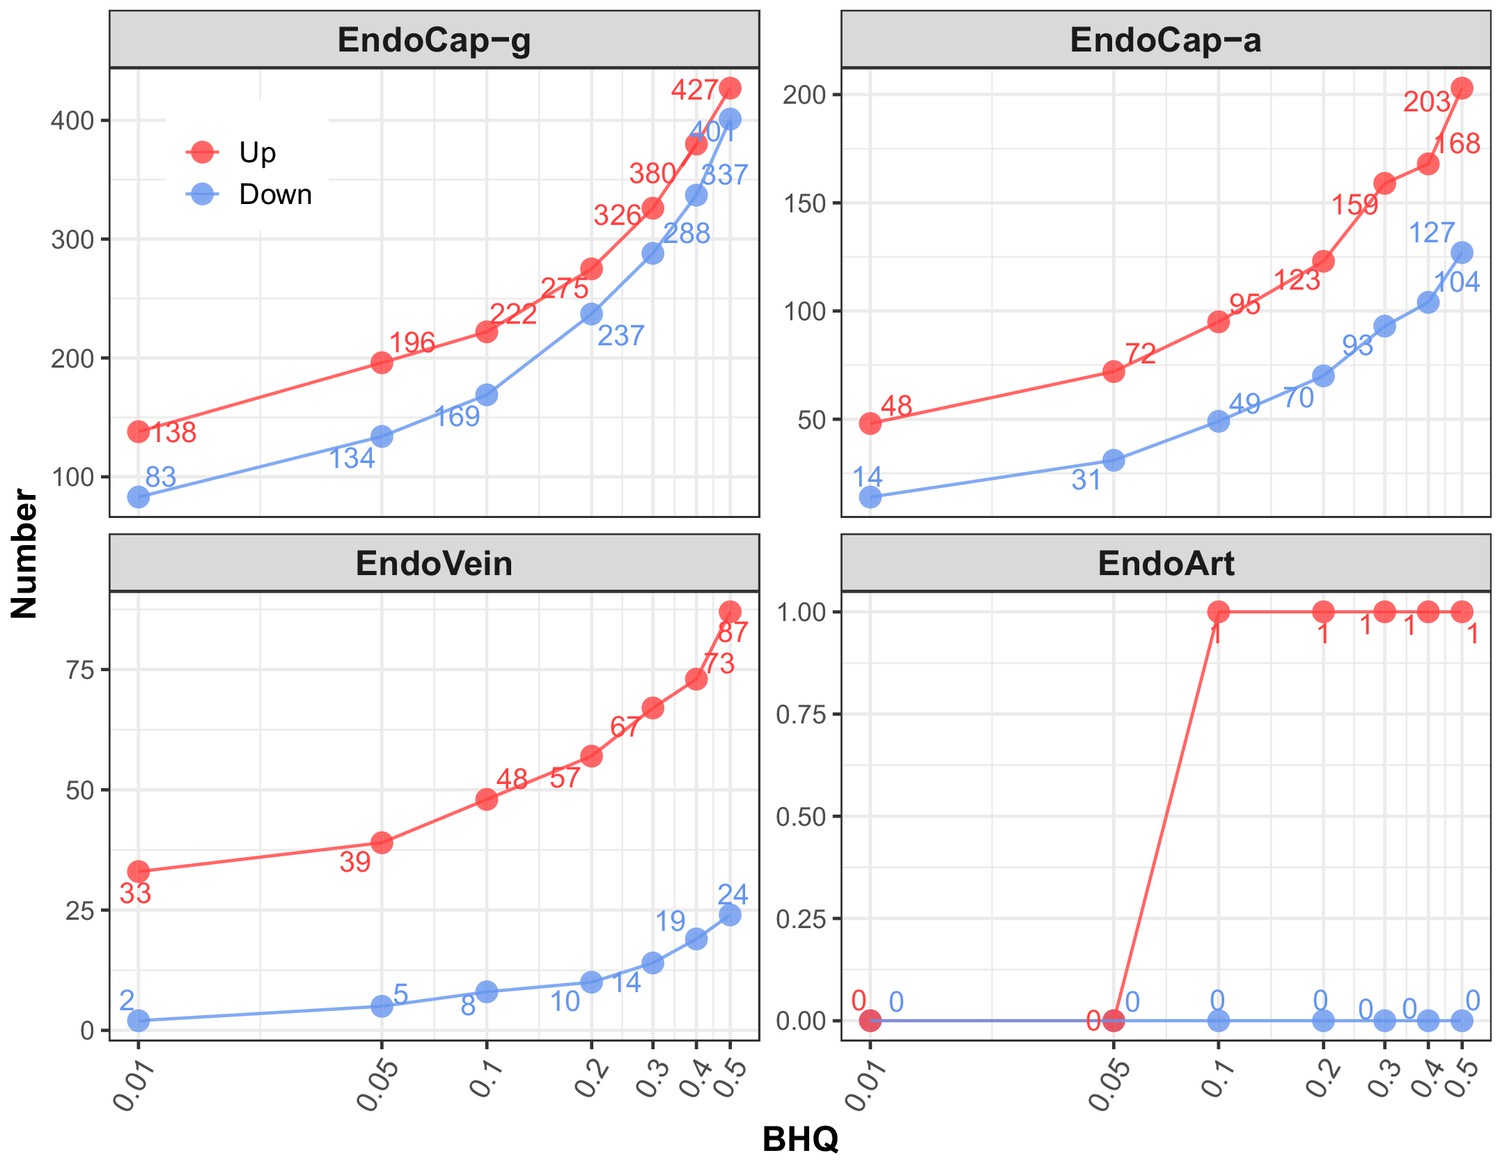
Number of differentially expressed IH-responsive genes in four lung endothelial subpopulations using BHQ cutoffs.
At series BHQ cutoffs, the number of up- and downregulated genes in lung endothelial subpopulations as a response to IH are shown with red and blue lines, respectively. The four endothelial subpopulations include endothelial artery (EndoArt), vein (EndoVein), general capillary (EndoCap-g) cells, and capillary aerocytes (EndoCap-a).
Figure 5—figure supplement 3
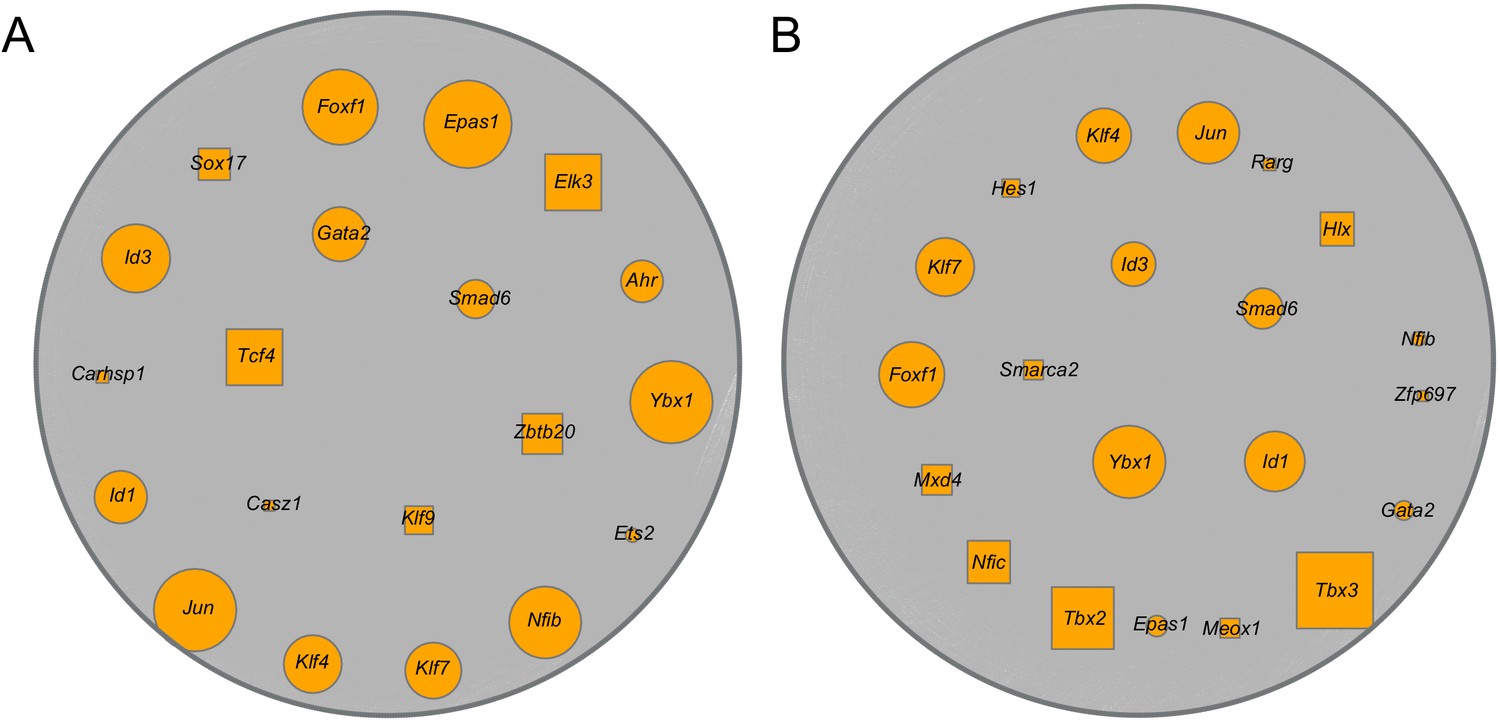
Predicted key transcription factors (TFs) for the endothelial capillary subtypes.
The predicted transcriptional regulatory network (TRN) for general capillary cells (A) and aerocytes (B) by SINCERA. Top 25 predicted TFs, from control and IH-exposed mice, are selected, and the overlapped TFs are shown in the figure. Orange nodes represent TFs, gray nodes represent target genes, and edges represent the predicted regulatory interactions between TFs and target genes. The shared TFs between general capillary cells and aerocytes are indicated with circle nodes, and the remaining TFs are indicated with square nodes. The size is in concordance with the average ranking; the higher the ranking, the larger the size.
Figure 6 with 5 supplements

Pulmonary disease-regulated genes provide clinical implications for OSA at the cell-specific level.
(A) Pulmonary disease-associated genes are enriched in upregulated genes in different cell types from whole lungs of mice exposed to IH vs controls. Enrichment analysis was performed in the DisGenet human database, using the top 200 upregulated genes identified from each cell type. The enrichment ratio is indicated by color. The point size indicates the enrichment BHQ from a Fisher’s exact test. The pulmonary diseases include asthma, allergic asthma, chronic obstructive airway disease (COPD), interstitial lung fibrosis (ILF), pulmonary fibrosis (PF), idiopathic pulmonary fibrosis (IPF), pulmonary hypertension (PH), idiopathic pulmonary hypertension (IPH), and idiopathic pulmonary arterial hypertension (IPAH). (B) The disease-associated genes vary in expression level and percentage of cells that express those genes. The fold change is indicated by the color, and the percentage of cells that express those genes is indicated by the height of the bar. Control and experimental groups are indicated by gray and orange box borders, respectively. (C) Dozens of pulmonary drug targets show differential expression in multiple cell types in lungs from mice exposed to IH. Drug classes used to treat different pulmonary diseases are indicated by text color. Drug effect is indicated by the line type. Fold change is indicated by the point color, and the p-value of differential expression is indicated by the point size. (D) The hive plot shows ligand–receptor interaction changes between pairs of cell types in response to IH. Nodes indicate cell-expressed ligands (horizontal axis) or receptors (vertical axis). Size of nodes are in proportion to the number of interactions changed for the cell type. Width of lines show numbers of interactions gained (right) or lost (left) between the pairs of cell types. The list of cell types include endothelial cells (Endo), B cells (Bcells), natural killer cells (NK), T cells (Tcells), natural killer T cells (NK-T), macrophages (Mphage), basophils (Baso), monocytes (Mono), macrophages-dendritic CD163+ cells (Mphage-DC), dendritic cells (DC), megakaryocytes (MegK), fibroblasts (FB), myofibroblasts (MyoFB), pericytes (Pcyte), alveolar epithelial type I cells (AT1), lymphatic endothelial cells (LymEndo), erythroblasts (Erythro), alveolar epithelial type II cells (AT2), and ciliated cells (Ciliated).
-
Figure 6—source data 1
Numerical data for Figure 6, Figure 6—figure supplements 1–5.
- https://cdn.elifesciences.org/articles/63003/elife-63003-fig6-data1-v3.zip
Figure 6—figure supplement 1
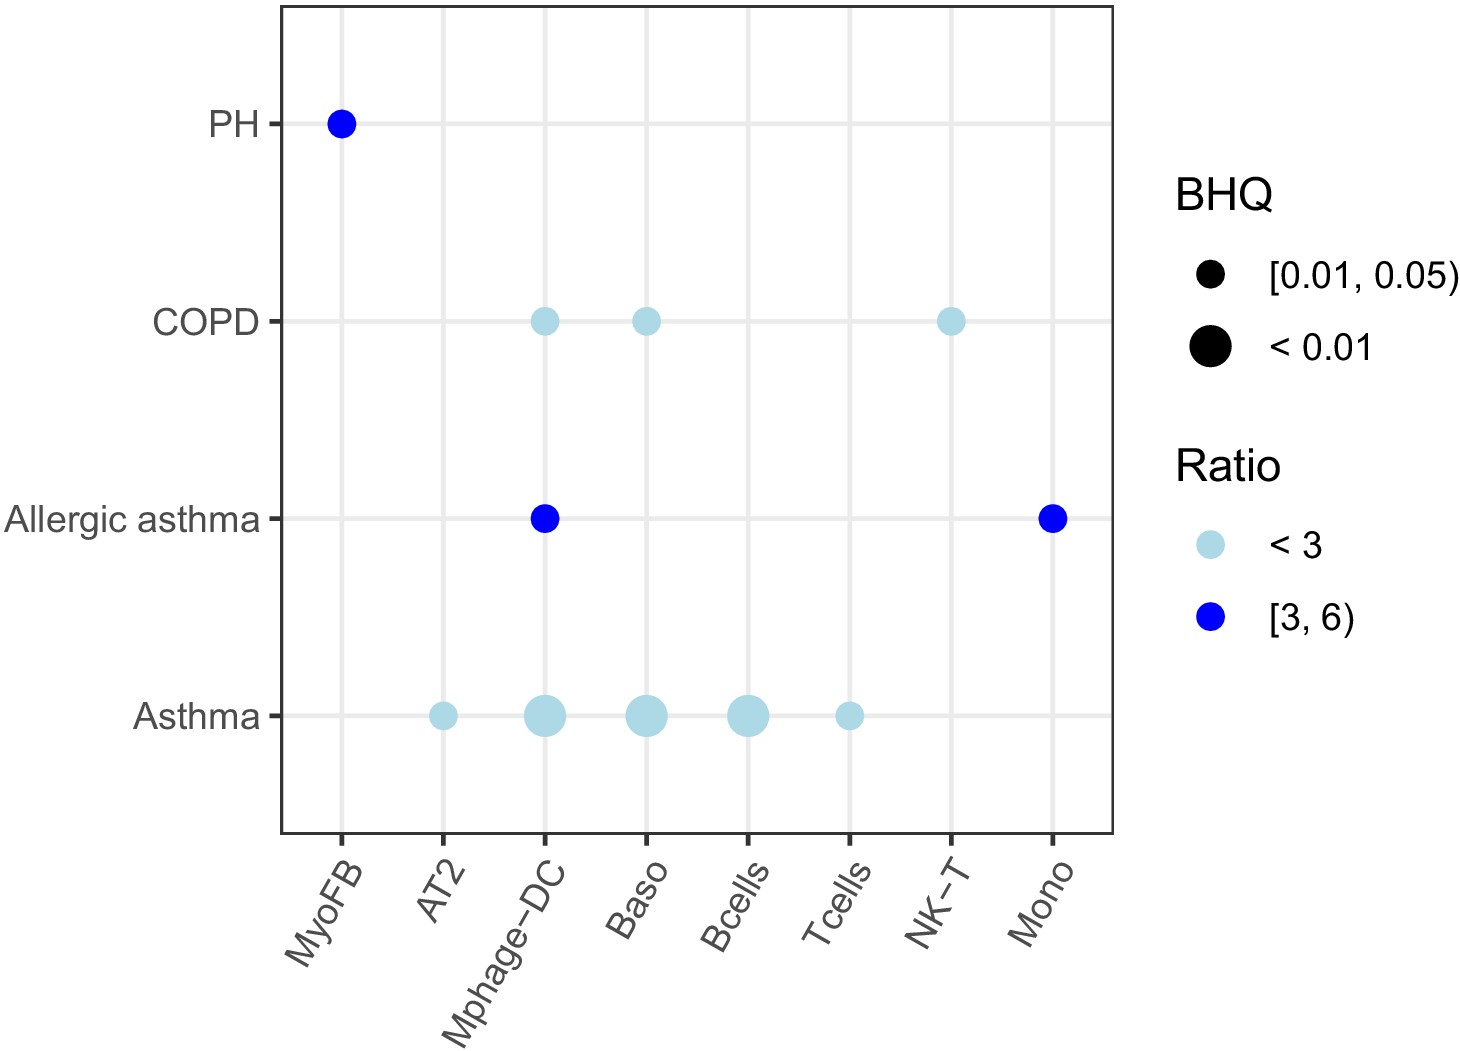
Pulmonary disease-associated genes are enriched in downregulated genes in different cell types in the lung from mice exposed to IH.
Enrichment analysis was performed in the DisGenet database, using the top 200 downregulated genes identified from each cell type. The average fold change of downregulated genes in each cell type for the same disease is indicated by color scale. The point size indicates the enrichment BHQ value from the Fisher’s exact test. The point color indicates the enrichment ratio. The pulmonary diseases include asthma, allergic asthma, chronic obstructive airway disease (COPD), and pulmonary hypertension (PH).
Figure 6—figure supplement 2
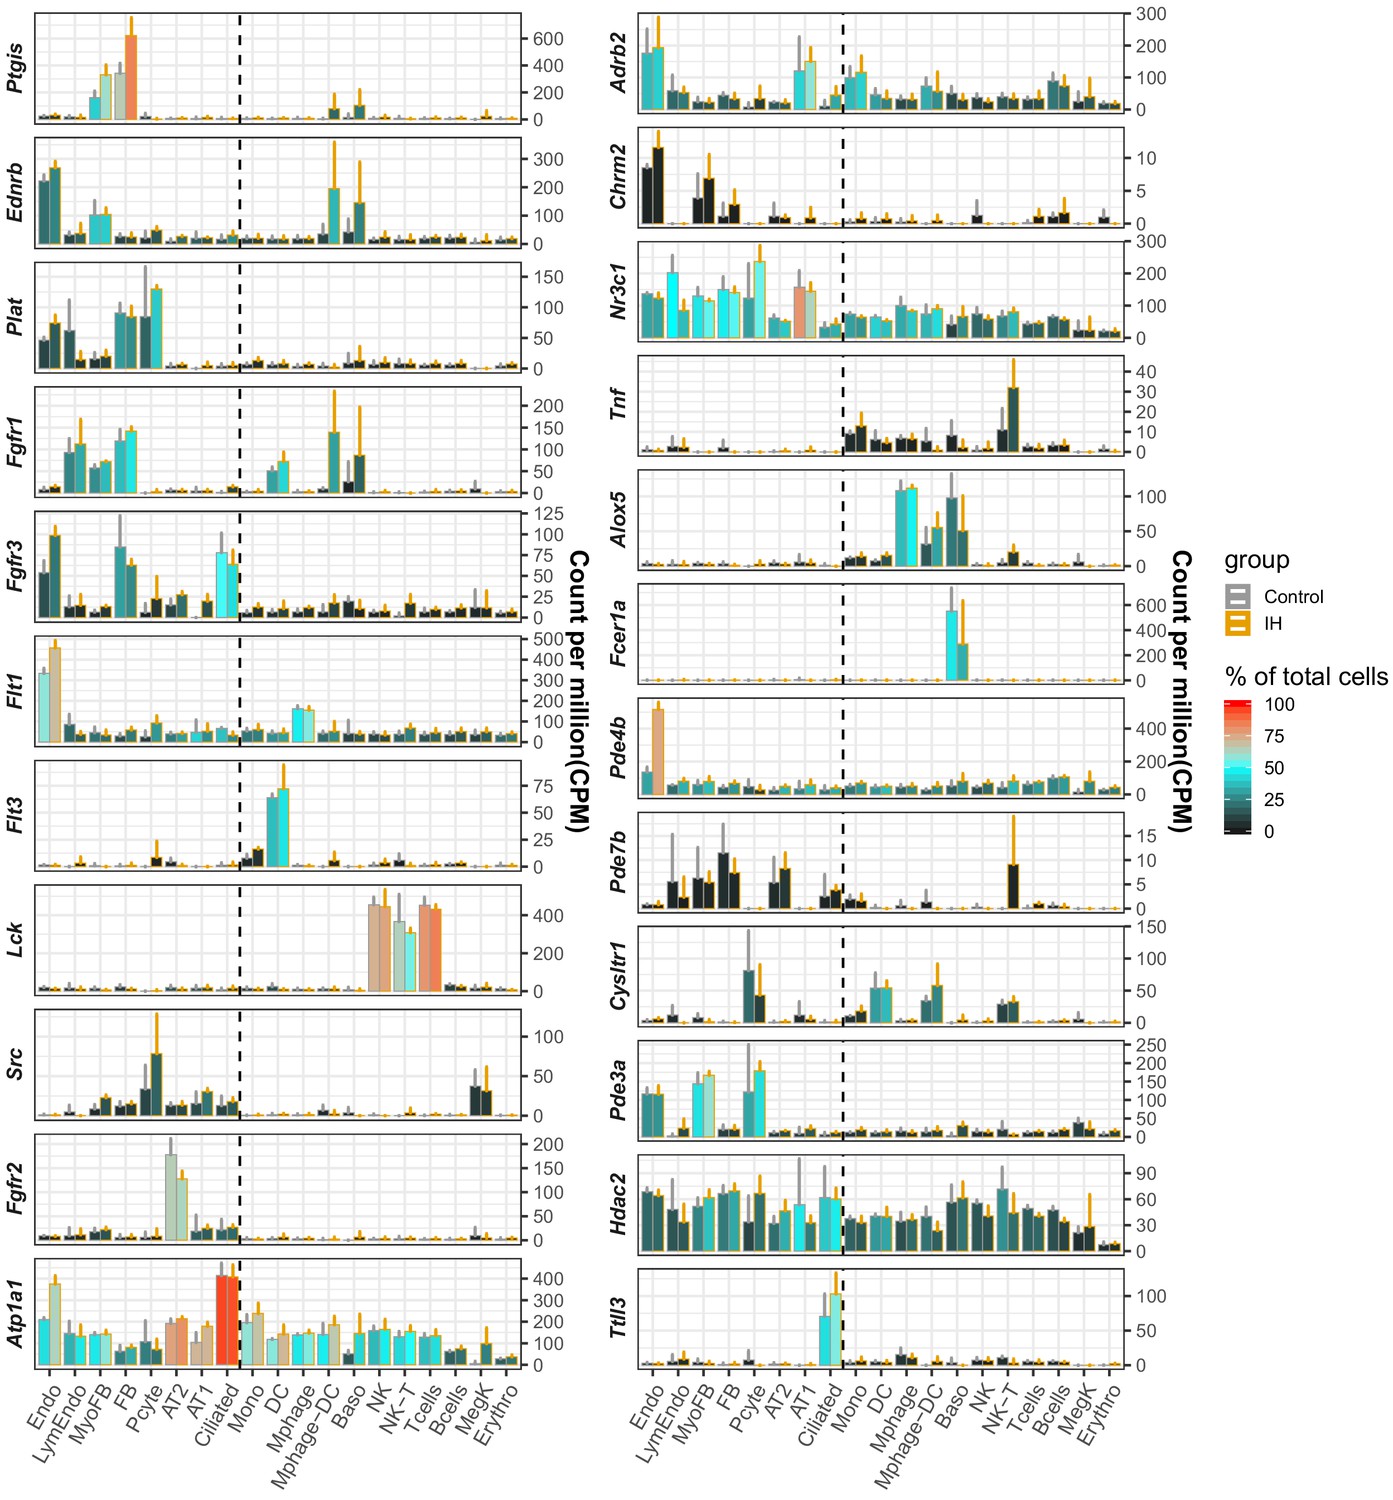
Pulmonary drug targets with cell type-specific expression profiles in mouse lung.
The average CPM (count per million reads) of three controls (gray) and IH-exposed (orange) replicates are indicated by the height of the bar. The error bar indicates standard deviation from the three biological replicates. The average percentage of cells with detected expression of each marker gene among specific cell types is indicated by the color scale. The list of cell types include endothelial cells (Endo), B cells (Bcells), natural killer cells (NK), T cells (Tcells), natural killer T cells (NK-T), macrophages (Mphage), basophils (Baso), monocytes (Mono), macrophages-dendritic CD163+ cells (Mphage-DC), dendritic cells (DC), megakaryocytes (MegK), fibroblasts (FB), myofibroblasts (MyoFB), pericytes (Pcyte), alveolar epithelial type I cells (AT1), lymphatic endothelial cells (LymEndo), erythroblasts (Erythro), alveolar epithelial type II cells (AT2), and ciliated cells (Ciliated).
Figure 6—figure supplement 3
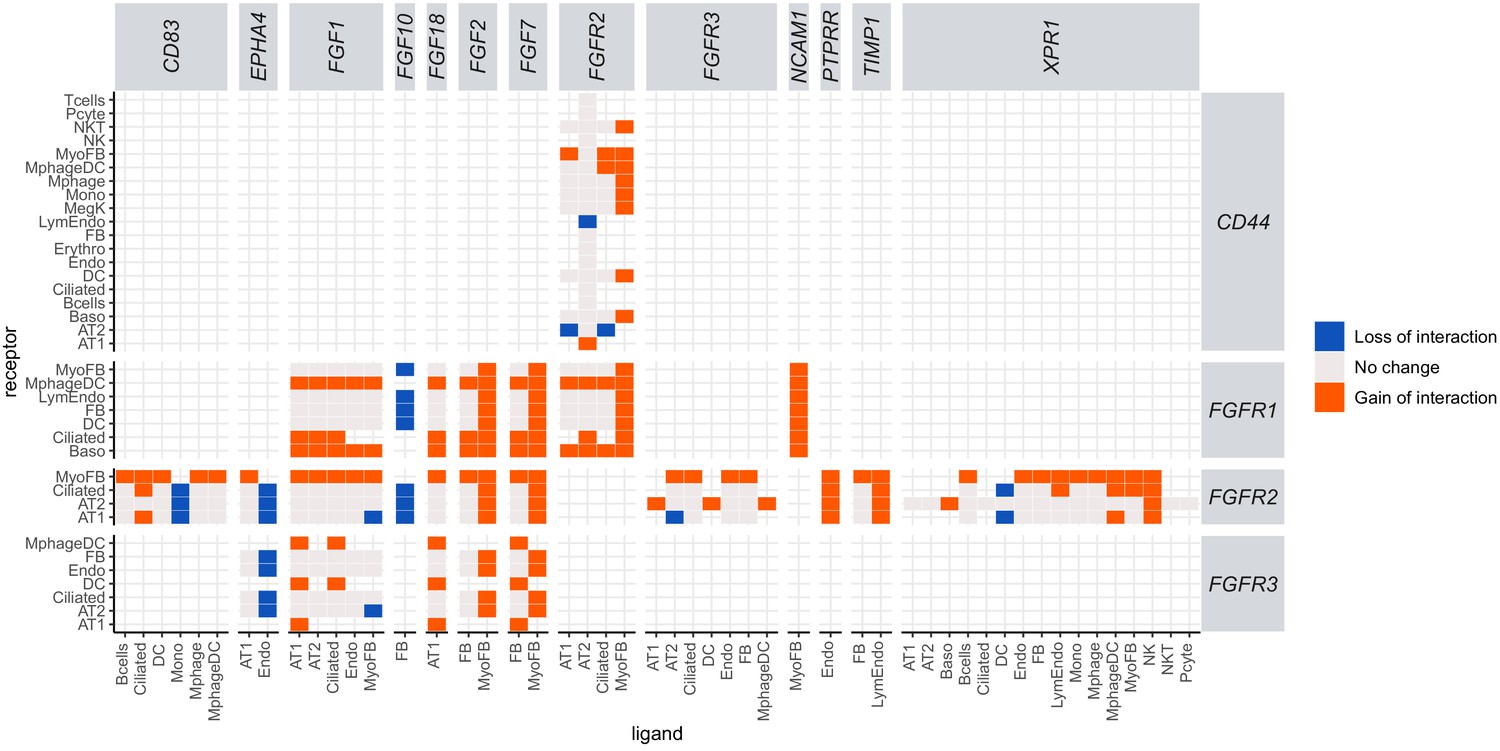
Ligand–receptor interaction analysis reveals a major role for myofibroblasts in activating the FGF signaling pathway as a response to IH.
Heatmap shows ligand–receptor pair interaction changes in different cell pairs. Gene symbols of human homolog genes were used in this figure. Orange indicates a new interaction found in response to IH but not in control samples (gain of interaction), and blue indicates an interaction found in controls, but not in response to IH (loss of interaction). Myofibroblasts show a gain of interaction between Fgf2(FGF2), Fgf7(FGF7), and Ncam1(NCAM1) to the FGF receptor in multiple cell types, indicating its role in activating the FGF signaling pathway in response to IH.
Figure 6—figure supplement 4

Enriched REACTOME gene sets for lung myofibroblast cells in mice exposed to IH vs controls.
The GSEA was run on expressed genes in myofibroblast ranked by the fold change between IH and control samples. The significantly enriched gene sets were selected by padj<0.15 and absolute NES value above 1.7.
Figure 6—figure supplement 5
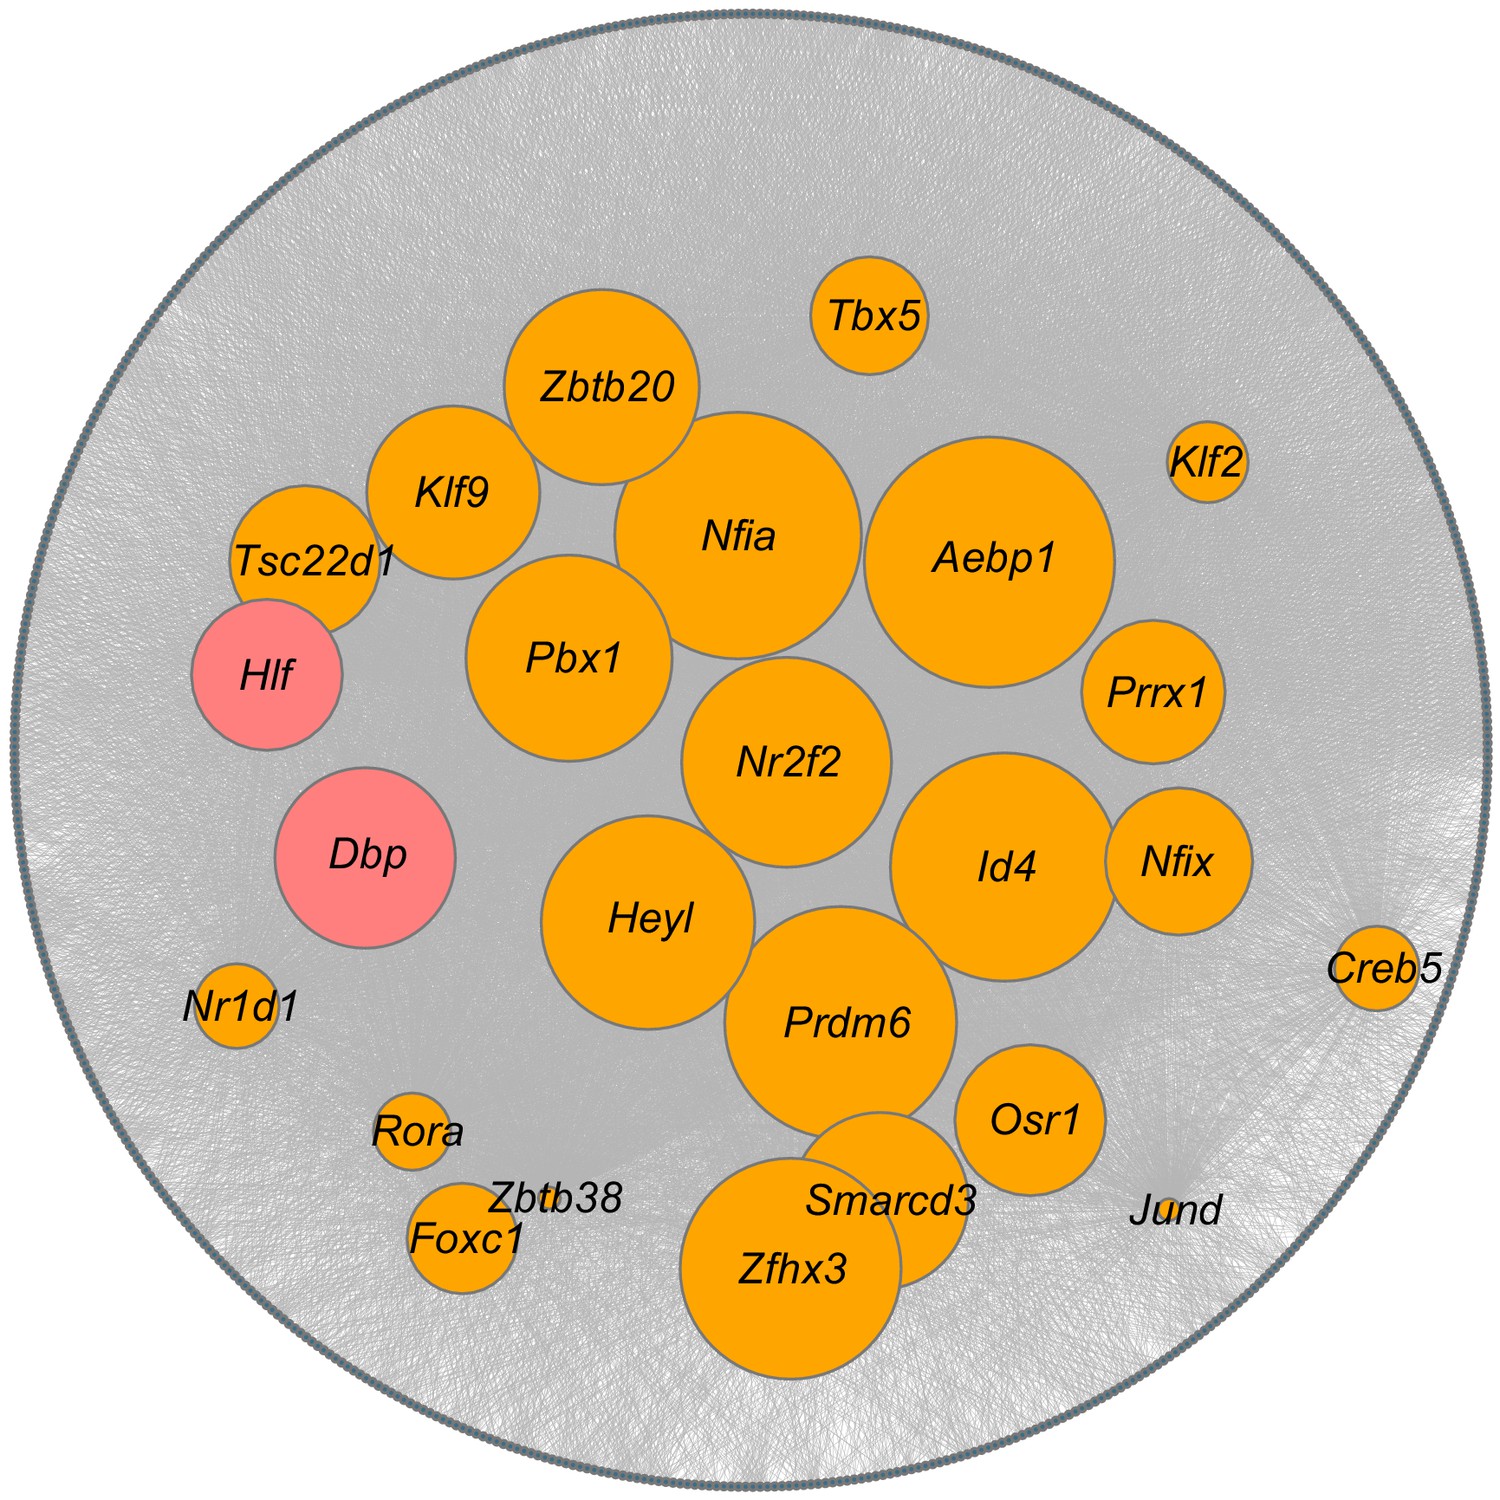
Prediction of key transcription factors (TFs) for the myofibroblast.
Top 25 SINCERA predicted TFs from myofibroblast cells in the IH group are selected. The selected TFs are compared to all the predicted TFs from myofibroblast cells in the control group. Orange nodes represent TFs shared between myofibroblast cells in control and IH groups, and red nodes represent specific TFs in myofibroblast cells in the IH group. Gray nodes represent target genes, while edges represent the predicted regulatory interactions between TFs and target genes. The size is in concordance with the average ranking; the higher the ranking, the larger the size.
Author response image 1
Tables
Key resources table
| Reagent type (species) or resource | Designation | Source or reference | Identifiers | Additional information |
|---|---|---|---|---|
| Strain, strain background (Mus musculus, C57BL/6J) | Wild-type C57BL/6 (WT) | Jackson Laboratories | RRID: IMSR_JAX:026133 | See Materials and methods |
| Antibody | Anti-FOXF1 (Goat Polyclonal) | R and D Systems | Cat# AF4798, RRID:AB_2105588 | IF (1:100) |
| Antibody | Anti-Lyve1 (Rabbit Polyclonal) | Abcam | Cat# AB14917, RRID:AB_301509 | IF (1:100) |
| Antibody | Anti-actin, smooth muscle (Mouse Monoclonal IgG2A) | Sigma–Aldrich | Cat# A5228, RRID:AB_262054 | IF (1:2000) |
| Antibody | Anti-Ki-67 (Monoclonal Mouse IgG1) | BD Biosciences | Cat# 556003, RRID:AB_396287 | IF (1:100) |
| Antibody | Anti-SFTPC (Rabbit Polyclonal) | Seven Hills Bioreagents | Cat# WRAB-9337, RRID:AB_2335890 | IF (1:1000) |
| Antibody | Anti-Periostin (Rabbit Polyclonal) | Abcam | Cat# ab215199 | IF (1:100) |
| Antibody | Anti-Endomucin (Goat Polyclonal) | R and D Systems | Cat# AF4666, RRID:AB_2100035 | IF (1:200) |
| Antibody | Anti-SOX9 (Rabbit Polyclonal) | Millipore Sigma | Cat# AB5535, RRID:AB_2239761 | IF (1:100) |
| Antibody | Anti-Hop (E1), (Monoclonal Mouse IgG1) | Santa Cruz Biotechnology | Cat# SC_398703, RRID:AB_2687966 | IF (1:100) |
| Commercial assay or kit | Collagenase, elastase, dispase digestion buffer | Sigma-Aldrich; Worthington Biochemical | ||
| Commercial assay or kit | Bacillus licheniformis mix | Sigma-Aldrich | ||
| Software, algorithm | Imaris (Bitplane) | https://imaris.oxinst.com/ | RRID:SCR_007370 | Version 9.6 |
| Software, algorithm | Nikon NIS-Elements software | https://www.microscope.healthcare.nikon.com/en_EU/products/software/nis-elements | RRID:SCR_014329 | |
| Software, algorithm | STAR | Dobin et al., 2013 | RRID:SCR_015899 | Version 2.5 |
| Software, algorithm | HTSeq | Anders et al., 2015 | RRID:SCR_005514 | Version 0.6.0 |
| Software, algorithm | Cell Ranger | https://support.10xgenomics.com/single-cell-gene-expression/software/downloads/latest | RRID:SCR_017344 | Version 2.1.1 |
| Software, algorithm | AltAnalyze | http://www.altanalyze.org/ | RRID:SCR_002951 | Version 2.1.2 |
| Software, algorithm | DESeq2 | Love et al., 2014 | RRID:SCR_015687 | Version 1.24.0 |
| Software, algorithm | cellHarmony | DePasquale et al., 2019 | ||
| Software, algorithm | drugBankR | https://github.com/yduan004/drugbankR; Duan, 2019 | ||
| Software, algorithm | GOSemSim | Yu et al., 2010 | Version 2.10.0 | |
| Software, algorithm | SINCERA | Guo et al., 2015 | RRID:SCR_016563 | Version 0.99.0 |
| Software, algorithm | CellPhoneDB | Vento-Tormo et al., 2018 | RRID:SCR_017054 | |
| Other | DisGeNET | http://www.disgenet.org | RRID:SCR_006178 | Version 6.0 |
| Other | DrugBank | http://www.drugbank.ca/ | RRID:SCR_002700 | Version 5.1.4 |
Additional files
-
Supplementary file 1
This file contains tables a–c (referenced in Materials and methods).
(a) The alignment statistics of bulk RNA-seq data for IH exposure and control mice. (b) Top 200 up- and downregulated genes in mice lung under IH exposure from the bulk RNA-seq data. (c) DAVID-enriched biological processes and merged categories using top 200 differential expression genes from the bulk RNA-seq data.
- https://cdn.elifesciences.org/articles/63003/elife-63003-supp1-v3.xlsx
-
Supplementary file 2
This file contains tables a–e (referenced in Materials and methods).
(a) The alignment statistics of scRNA-seq data for IH exposure and control mice. (b) The marker genes list for 25 clusters from AltAnalyze analysis of scRNA-seq data from IH exposure mice. (c) The annotated cell types for 25 cellHarmony aligned clusters of scRNA-seq data from IH exposure and control mice. (d) Top 200 up- and downregulated genes in 19 detected lung cell types under IH exposure from the scRNA-seq data. (e) DAVID-enriched biological processes and merged categories using top 200 differential expression genes in each lung cell type under IH exposure.
- https://cdn.elifesciences.org/articles/63003/elife-63003-supp2-v3.xlsx
-
Supplementary file 3
This file contains tables a–f (referenced in Materials and methods).
(a) The marker genes list for six clusters from AltAnalyze analysis of scRNA-seq data from annotated vascular endothelial cells of IH exposure mice. (b) The annotated endothelial subpopulations for six cellHarmony aligned clusters of scRNA-seq data from annotated vascular endothelial cells of IH exposure and control mice. (c) Differential expression genes of four annotated endothelial subpopulations under IH exposure from the scRNA-seq data. (d) DAVID-enriched biological processes and merged categories using differential expression genes of lung capillary cells under IH exposure. (e) Ranking of predicted transcription factors in capillary aerocytes using SINCERA. (f) Ranking of predicted transcription factors in general capillary cells using SINCERA.
- https://cdn.elifesciences.org/articles/63003/elife-63003-supp3-v3.xlsx
-
Supplementary file 4
This file contains tables a–d (referenced in Materials and methods).
(a) The pulmonary disease-associated genes from top 200 up- or downregulated genes in each detected lung cell type exposed to IH. (b) The drug table linking drugs mainly indicated to treat pulmonary diseases and top 200 up- or downregulated genes in each cell type exposed to IH. (c) Gene set enrichment analysis of expressed genes in myofibroblasts in mice lung exposed to IH compared to controls. (d) Ranking of predicted transcription factors in myofibroblasts using SINCERA.
- https://cdn.elifesciences.org/articles/63003/elife-63003-supp4-v3.xlsx
-
Transparent reporting form
- https://cdn.elifesciences.org/articles/63003/elife-63003-transrepform-v3.docx
Download links
A two-part list of links to download the article, or parts of the article, in various formats.
Downloads (link to download the article as PDF)
Open citations (links to open the citations from this article in various online reference manager services)
Cite this article (links to download the citations from this article in formats compatible with various reference manager tools)
Short-term exposure to intermittent hypoxia leads to changes in gene expression seen in chronic pulmonary disease
eLife 10:e63003.
https://doi.org/10.7554/eLife.63003


