Neuronal complexity is attenuated in preclinical models of migraine and restored by HDAC6 inhibition
- Department of Psychiatry, University of Illinois at Chicago, United States
- Department of Physiology and Biophysics, University of Illinois at Chicago, United States
- Department of Medicinal Chemistry and Pharmacognosy, University of Illinois at Chicago, United States
- Department of Pharmaceutical Sciences, University of Colorado Anschutz Medical Campus, United States
- Department of Neurology, University of Colorado Anschutz Medical Campus, United States
- Jesse Brown VAMC, United States
Figures
Figure 1 with 1 supplement
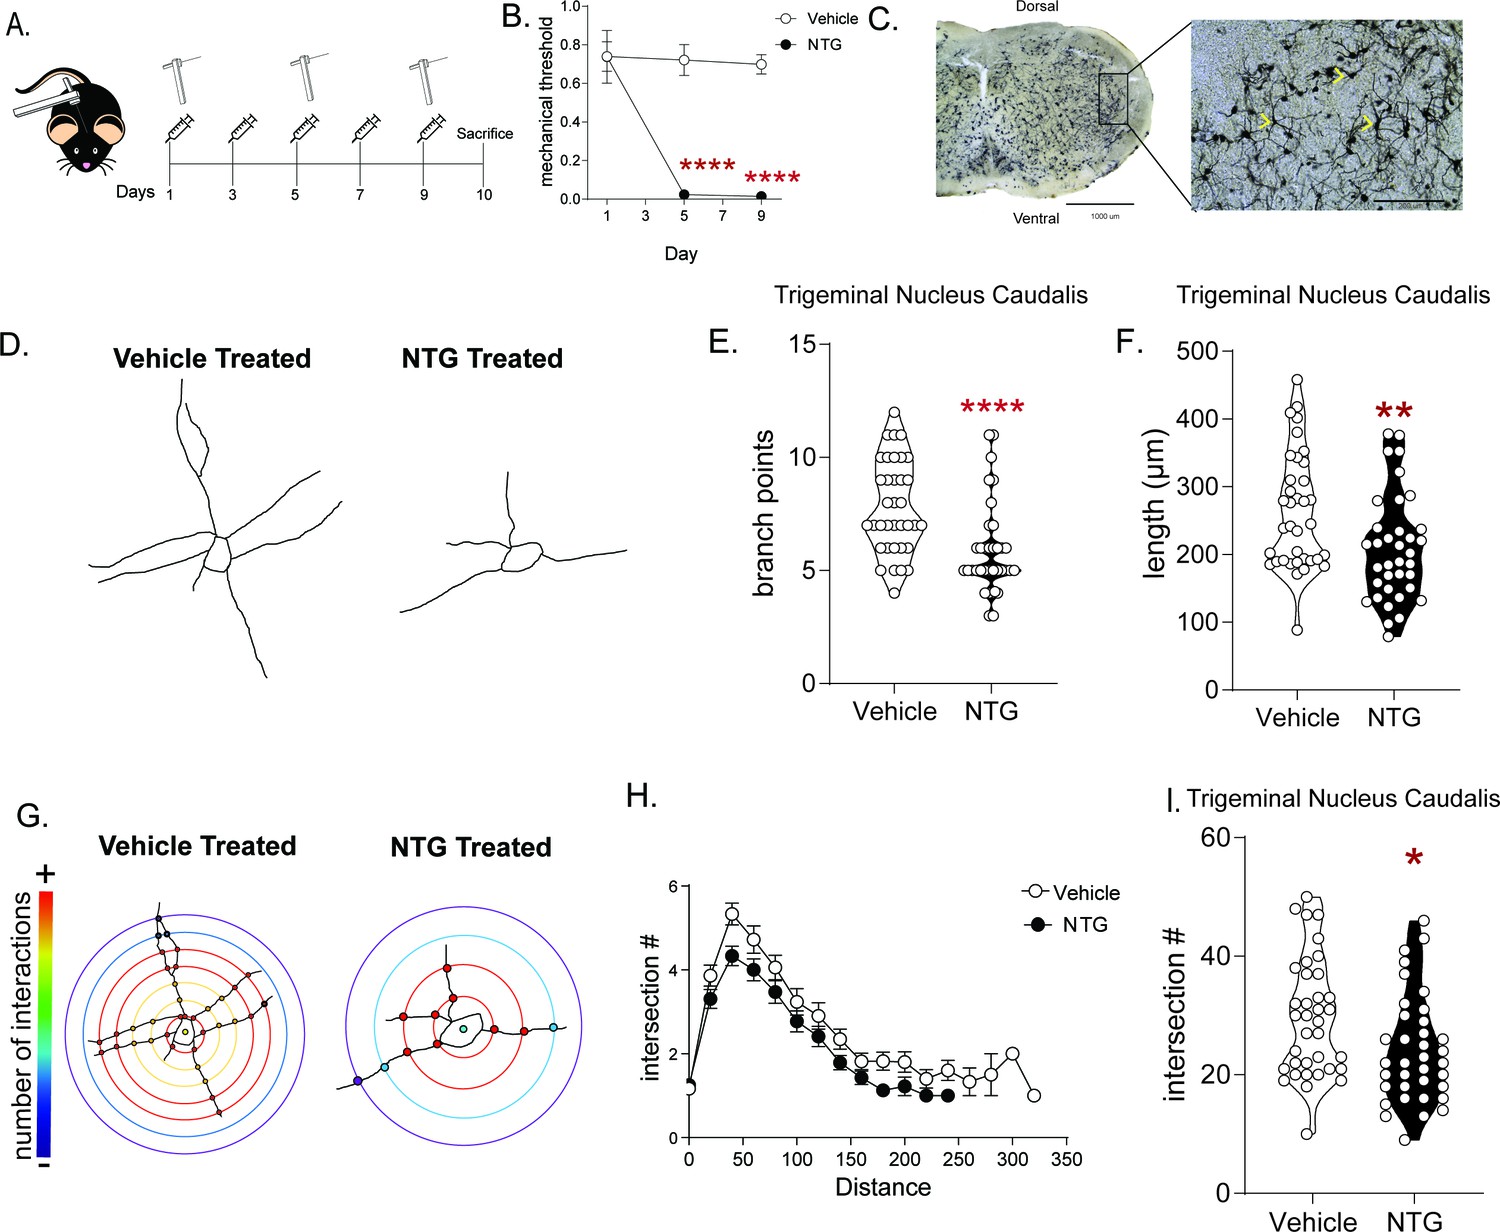
The NTG model of chronic migraine produces cytoarchitectural changes in a cephalic pain processing region.
(A) Schematic of testing schedule, M and F C57Bl/6J mice were treated with vehicle or nitroglycerin (10 mg/kg, IP; NTG) every other day for 9 days. (B) Periorbital mechanical thresholds were accessed prior to Vehicle/NTG administration on days 1, 5, and 9. NTG produced severe cephalic allodynia p<0.0001 effect of drug F = 44.62, time F = 19.16, and interaction F = 16.28, two-way RM ANOVA and Holm-Sidak post hoc analysis. ****p<0.0001, relative to vehicle on day 1; n = 8/group. (C) Representative image taken of Golgi stained TNC at 4x (left) and 20x (right). Chevrons indicate neurons traced from the selected image and demonstrate type of neurons selected from this region. (D) Representative tracing of neurons from mice treated with chronic vehicle (left) or NTG (right) demonstrating reduced neural processes after chronic NTG treatment. (E) The number of branch points/neuron was decreased following chronic NTG. Unpaired t-test. ****p<0.0001, t = 4.029, df = 70, 95% CI (−2.866,–0.9678). (F) Total neuron length was also compromised after NTG treatment. Unpaired t-test. **p=0.0066, t = 2.798, df = 70, 95% CI (−93.04,–15.60). (G) Representative Sholl plots of vehicle (left) and NTG (right) treated mice. (H) Sholl analysis broken up by 0.377 µm/20 pixel distances from the center of the cell showing differences between groups. (I) Sholl analysis revealed a significant decrease in total intersections after chronic NTG treatment. Unpaired t-test. *p=0.0193, t = 2.396, df = 70, 95% CI (−9.825,–0.8977) n = 6 mice/group, six neurons per mouse.
-
Figure 1—source data 1
Data Figure 1B.
- https://cdn.elifesciences.org/articles/63076/elife-63076-fig1-data1-v2.xlsx
-
Figure 1—source data 2
Data Figure 1E.
- https://cdn.elifesciences.org/articles/63076/elife-63076-fig1-data2-v2.xlsx
-
Figure 1—source data 3
Data Figure 1F.
- https://cdn.elifesciences.org/articles/63076/elife-63076-fig1-data3-v2.xlsx
-
Figure 1—source data 4
Data Figure 1H.
- https://cdn.elifesciences.org/articles/63076/elife-63076-fig1-data4-v2.xlsx
-
Figure 1—source data 5
Data Figure 1I.
- https://cdn.elifesciences.org/articles/63076/elife-63076-fig1-data5-v2.xlsx
Figure 1—figure supplement 1
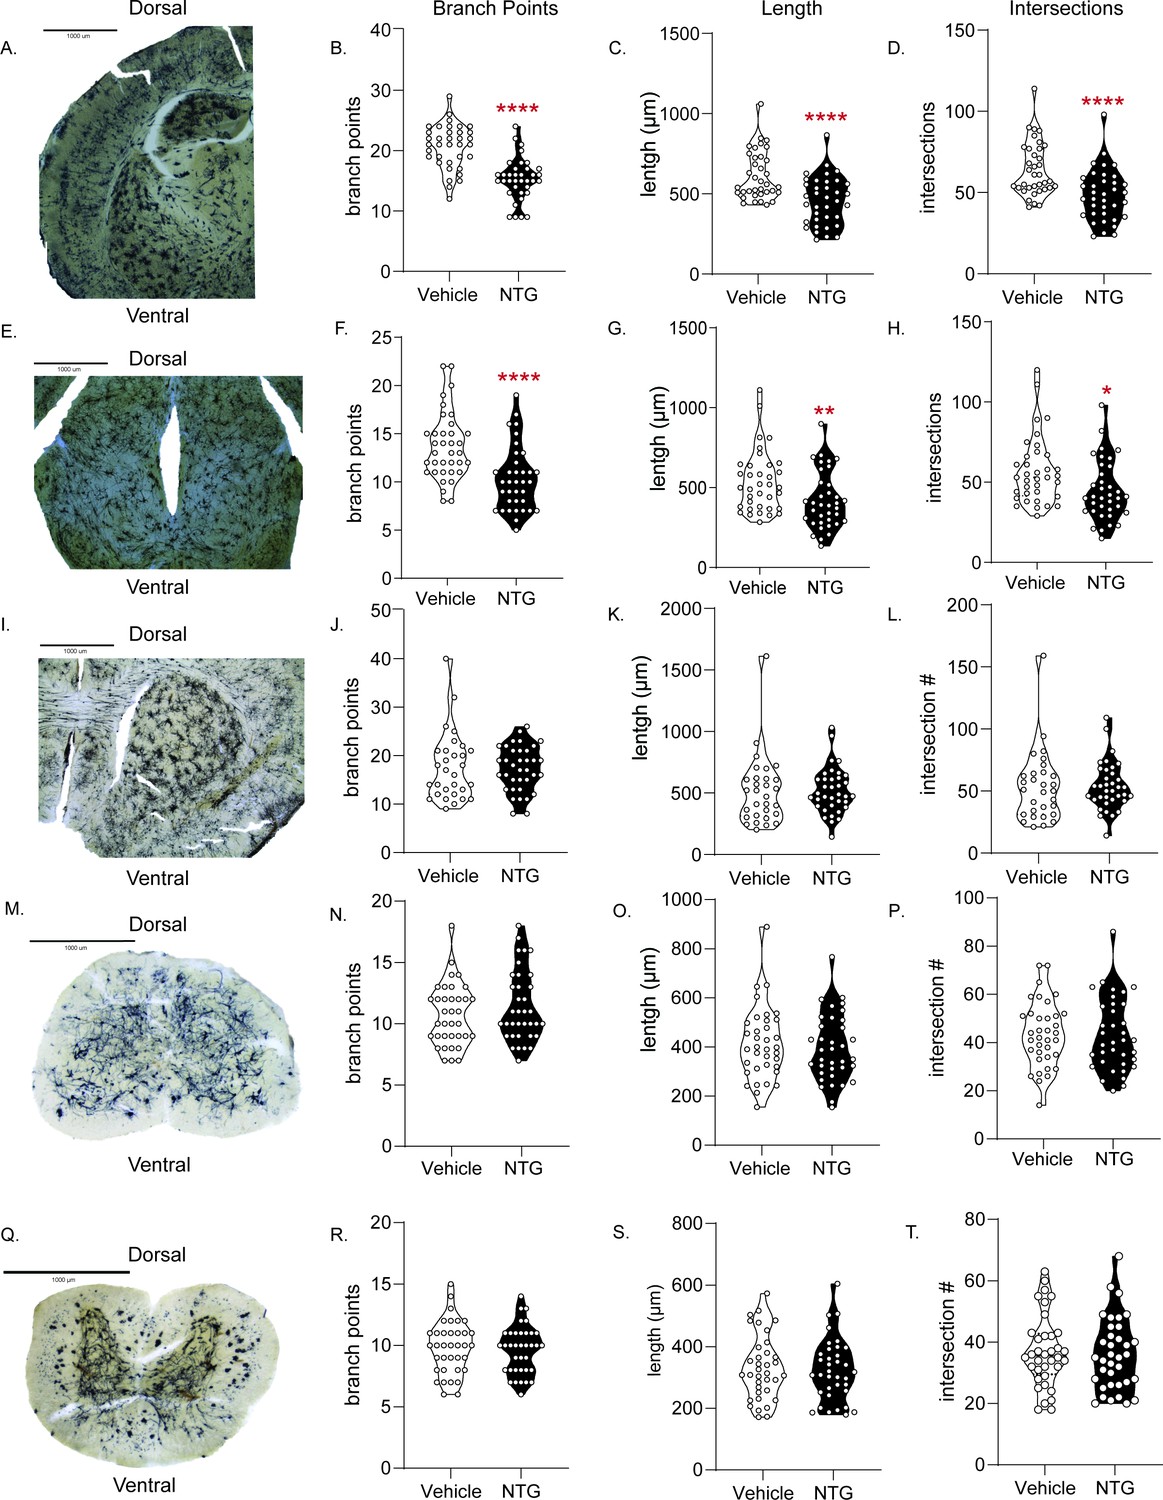
Chronic NTG treatment causes cytoarchitectural changes in the Somatosensory Cortex (SCx) and Periaqueductal Gray (PAG) but not the Nucleus Accumbens (Nac) Lumbar Spinal Cord (LSC), or Cervical Spinal Cord (CSC).
Mice were treated chronic intermittently with either NTG or Vehicle for 9 days and on day 10 tissue was collected for Golgi staining. (A,E,I,M,Q) Representative image showing Golgi staining in the SCx, PAG, Nac, LSC, and CSC. (B,F,J,N,R) Neurons were analyzed for number of branch points, (C,G,K,O,S) combined neuronal length and (D,H,L,P,T) total number of intersections using Sholl analysis. In the SCx (B–D) significant decreases were seen in branches: ****p<0.0001, t = 6.486, df = 70, length: ****p<0.0001, t = 4.428, df = 70, and intersections: ****p<0.0001, t = 4.127, df = 70 unpaired t-test n = 6/group six neurons/mouse. Similar findings were seen in the PAG (E–H) in branches: ****p<0.0001, t = 4.208, df = 70, length: **p=0.0089, t = 2.693, df = 70, and intersections: *p=0.0101, t = 2.645, df = 70 unpaired t-test n = 6/group six neurons/mouse. In the Nac (I–L) chronic NTG treatment did not produce significant changes in the number of branchs: p=0.8531, t = 0.1860, df = 64, length: p=0.9467, t = 0.06712, df = 64, or interactions: p=0.9106, t = 0.1128, df = 64 unpaired t-test n = 5–6 mice/group, six neurons/mouse. LSC (M–P) also showed no significant changes in branches: p=0.2788, t = 1.092, df = 70, length: p=0.5715, t = 0.5685, df = 70, or intersections: p=0.9016, t = 0.1241, df = 70 unpaired t-test n = 6/group six neurons/mouse. Finally, CSC (Q–T) was examined and similar to lumbar spinal cord showed no changes in branches: p=0.6882, t = 0.4030, df = 70, length: p=0.7402, t = 0.3329, df = 70, or intersections: p=0.7103, t = 0.3730, df = 30, unpaired t-test n = 6/group six neurons/mouse.
-
Figure 1—figure supplement 1—source data 1
- https://cdn.elifesciences.org/articles/63076/elife-63076-fig1-figsupp1-data1-v2.xlsx
-
Figure 1—figure supplement 1—source data 2
- https://cdn.elifesciences.org/articles/63076/elife-63076-fig1-figsupp1-data2-v2.xlsx
-
Figure 1—figure supplement 1—source data 3
- https://cdn.elifesciences.org/articles/63076/elife-63076-fig1-figsupp1-data3-v2.xlsx
-
Figure 1—figure supplement 1—source data 4
- https://cdn.elifesciences.org/articles/63076/elife-63076-fig1-figsupp1-data4-v2.xlsx
-
Figure 1—figure supplement 1—source data 5
- https://cdn.elifesciences.org/articles/63076/elife-63076-fig1-figsupp1-data5-v2.xlsx
-
Figure 1—figure supplement 1—source data 6
- https://cdn.elifesciences.org/articles/63076/elife-63076-fig1-figsupp1-data6-v2.xlsx
-
Figure 1—figure supplement 1—source data 7
- https://cdn.elifesciences.org/articles/63076/elife-63076-fig1-figsupp1-data7-v2.xlsx
-
Figure 1—figure supplement 1—source data 8
- https://cdn.elifesciences.org/articles/63076/elife-63076-fig1-figsupp1-data8-v2.xlsx
-
Figure 1—figure supplement 1—source data 9
- https://cdn.elifesciences.org/articles/63076/elife-63076-fig1-figsupp1-data9-v2.xlsx
-
Figure 1—figure supplement 1—source data 10
- https://cdn.elifesciences.org/articles/63076/elife-63076-fig1-figsupp1-data10-v2.xlsx
-
Figure 1—figure supplement 1—source data 11
- https://cdn.elifesciences.org/articles/63076/elife-63076-fig1-figsupp1-data11-v2.xlsx
-
Figure 1—figure supplement 1—source data 12
- https://cdn.elifesciences.org/articles/63076/elife-63076-fig1-figsupp1-data12-v2.xlsx
-
Figure 1—figure supplement 1—source data 13
- https://cdn.elifesciences.org/articles/63076/elife-63076-fig1-figsupp1-data13-v2.xlsx
-
Figure 1—figure supplement 1—source data 14
- https://cdn.elifesciences.org/articles/63076/elife-63076-fig1-figsupp1-data14-v2.xlsx
-
Figure 1—figure supplement 1—source data 15
- https://cdn.elifesciences.org/articles/63076/elife-63076-fig1-figsupp1-data15-v2.xlsx
Figure 2 with 1 supplement
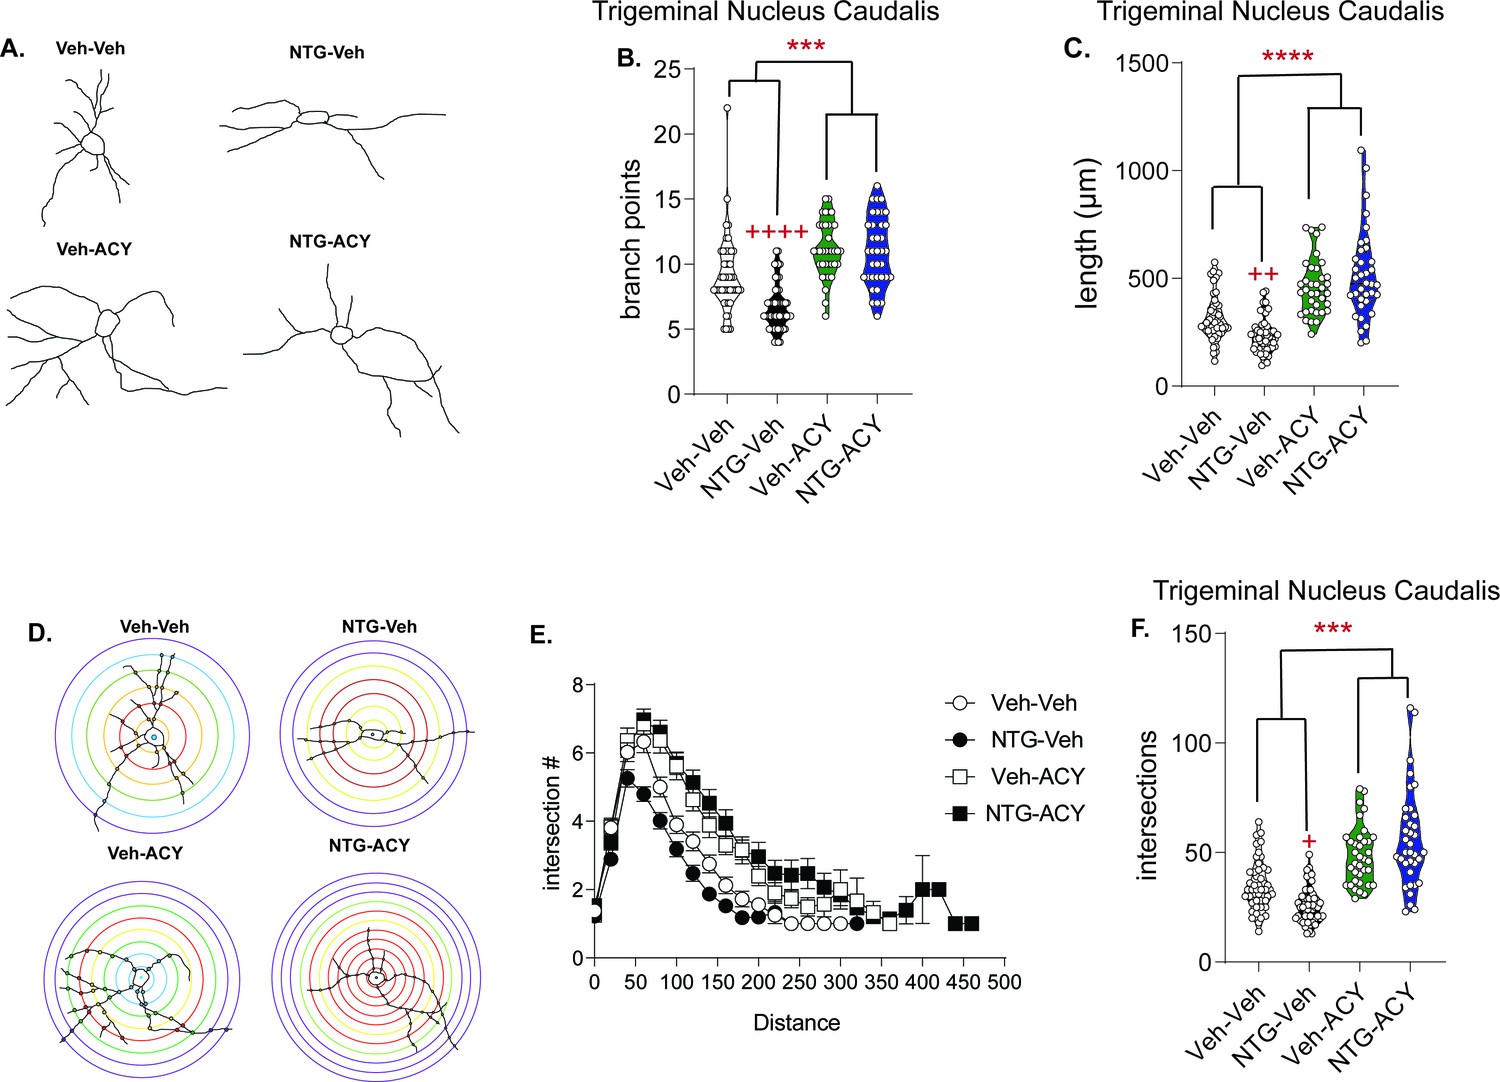
Treatment with HDAC6 inhibitor restores blunted neuronal complexity.
(A) Representative neuron tracing of mice that were chronically treated with vehicle or NTG (10 mg/kg, IP) every other day for 9 days and on day 10 were injected with ACY-738 (50 mg/kg, IP) or vehicle (5% DMSO in 0.9% NaCl, IP) and sacrificed 4 hr later for Golgi staining. (B) The number of branch points/neuron were significantly decreased following NTG treatment (NTG-Vehicle); while ACY-738 treated mice showed increased branching regardless of pretreatment. p=0.0061, F = 7.891, 95% CI (0.4864, 2.841) effect of chronic treatment, p=0.0002, F = 14.61, 95% CI (−3.441,–1.086) drug treatment, p=0.0044, F = 8.537, 95% CI (−5.815,–1.106) and interaction, two-way ANOVA and Holm-Sidak post hoc analysis. ***p=0.0002, t = 4.851 effect of ACY-738; ++++p<0.0001, t = 4.947 effect of NTG. (C) NTG also decreased total length/neuron, while ACY-738 treatment increased it. p<0.0001, F = 109.8, 95% CI (−667.8,–456.1) effect drug treatment, p=0.0004, F = 12.82, 95% CI (−595.8,–172.3) and interaction, two-way ANOVA and Holm-Sidak post hoc analysis. ****p<0.0001, t = 10.06 effect of ACY-738; ++p=0.0019, t = 3.358 effect of NTG. (D) Representative Sholl analysis image of neuronal complexity in the four groups. (E) Sholl analysis broken up by 0.377 µm/20 pixel distances reveal differences between NTG and ACY-738 treatment. (F) Chronic NTG results in significantly fewer total interactions relative to vehicle treatment. ACY-738 increases total interactions in both vehicle and NTG groups. p<0.0001, F = 59.38, 95% CI (−27.60,–15.96) effect drug treatment, and p=0.0073, F = 8.537, 95% CI (−28.16,–4.874) interaction, two-way ANOVA and Holm-Sidak post hoc analysis. ****p<0.001, t = 3.342 effect of ACY-738; +p=0.0403, t = 2.477 effect of NTG. For all analysis n = 6 mice/group, 6–8 neurons per mouse.
-
Figure 2—source data 1
Data Figure 2B.
- https://cdn.elifesciences.org/articles/63076/elife-63076-fig2-data1-v2.xlsx
-
Figure 2—source data 2
Data Figure 2C.
- https://cdn.elifesciences.org/articles/63076/elife-63076-fig2-data2-v2.xlsx
-
Figure 2—source data 3
Data Figure 2E.
- https://cdn.elifesciences.org/articles/63076/elife-63076-fig2-data3-v2.xlsx
-
Figure 2—source data 4
Data Figure 2F.
- https://cdn.elifesciences.org/articles/63076/elife-63076-fig2-data4-v2.xlsx
Figure 2—figure supplement 1
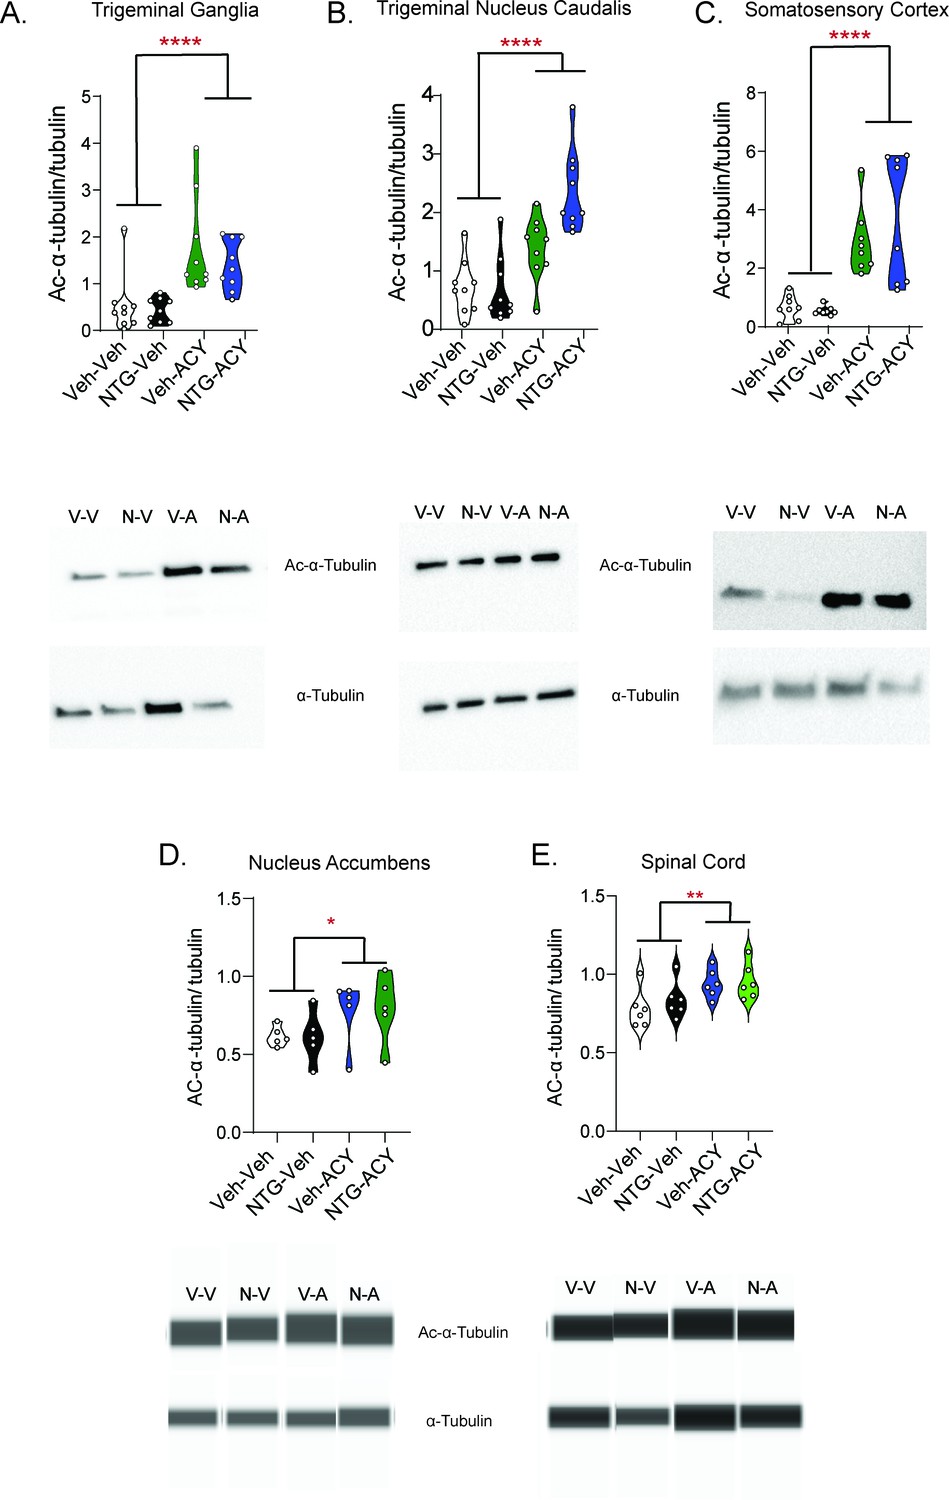
ACY-738 increased levels of acetylated α-tubulin.
Mice were chronically treated with NTG or vehicle for 9 days. On day 10 mice were injected with ACY-738 (50 mg/kg IP) or vehicle (5% DMSO, 0.9% NaCl, IP) and tissue was collected 4 hr later. Mice treated with ACY-738 showed a significant increase in the ratio of acetylated α-tubulin/total α-tubulin compared to the vehicle-treated mice (A) Trigeminal ganglia, ****p<0.0001, F = 23.09, 95% CI (−1.560,–0.6312) effect of ACY-738 treatment n = 8–9/group two-way ANOVA (B) trigeminal nucleus caudalis, ****p<0.0001, F = 38.63, 95% CI (−1.569,–0.7943) effect of ACY-738 treatment, p=0.0211, F = 5.882, 95% CI (−0.8484,–0.07385) effect of NTG/Veh, interaction p=0.0126, F = 6.986, 95% CI (−1.780,–0.2305) n = 8–9/group two-way ANOVA (C) somatosensory cortex ****p<0.0001, F = 37.92, 95% CI (−3.608,–1.807) effect of ACY n = 8–9/group two-way ANOVA. (D) nucleus accumbens, *p=0.0466, F = 4.649, 95% CI (−0.3415,–0.002903) effect of ACY-738, n = 5/group two-way ANOVA, (E) spinal cord, **p=0.0062, F = 9.357, 95% CI (−0.2339,–0.04423) effect of ACY-738, n = 6/group two-way ANOVA.
-
Figure 2—figure supplement 1—source data 1
- https://cdn.elifesciences.org/articles/63076/elife-63076-fig2-figsupp1-data1-v2.xlsx
-
Figure 2—figure supplement 1—source data 2
- https://cdn.elifesciences.org/articles/63076/elife-63076-fig2-figsupp1-data2-v2.xlsx
-
Figure 2—figure supplement 1—source data 3
- https://cdn.elifesciences.org/articles/63076/elife-63076-fig2-figsupp1-data3-v2.xlsx
-
Figure 2—figure supplement 1—source data 4
- https://cdn.elifesciences.org/articles/63076/elife-63076-fig2-figsupp1-data4-v2.xlsx
-
Figure 2—figure supplement 1—source data 5
- https://cdn.elifesciences.org/articles/63076/elife-63076-fig2-figsupp1-data5-v2.xlsx
Figure 3
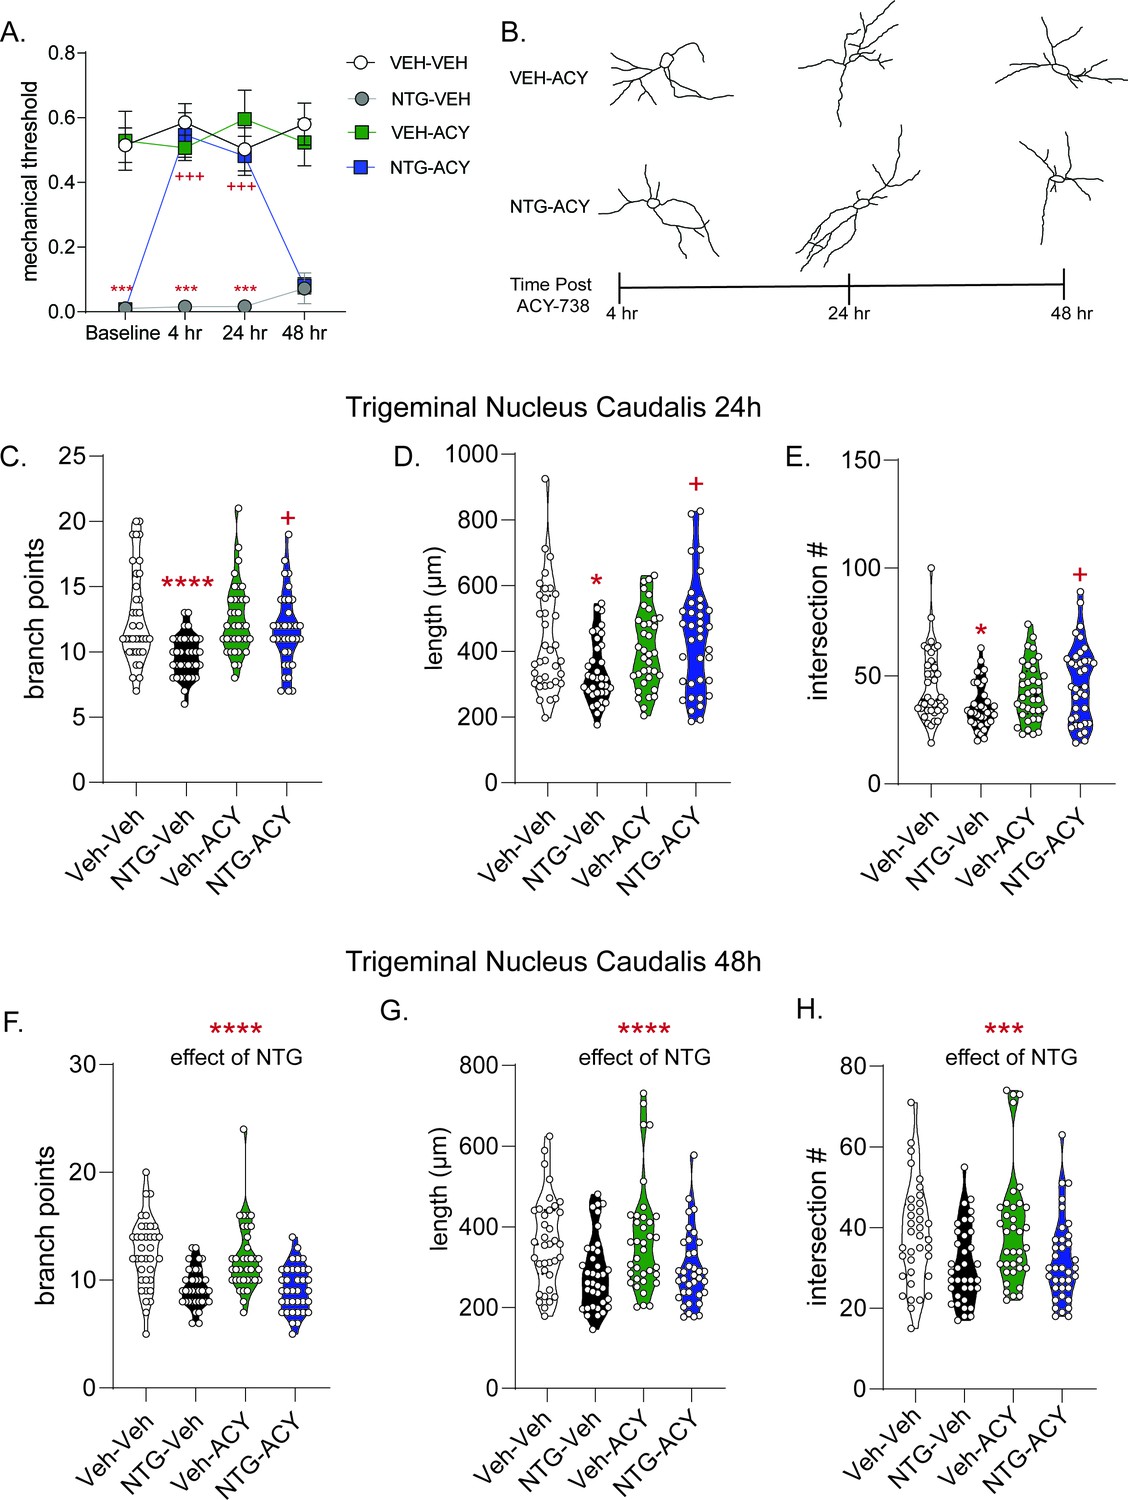
ACY-738 reverses established allodynia in a time-dependent manner with neuronal alterations.
(A) C57Bl/6J mice underwent chronic intermittent NTG/Veh treatment for 9 days, on day 10 basal mechanical thresholds were assessed, and mice were subsequently injected with ACY-738 (50 mg/kg IP) or Vehicle and tested 4, 24, and 48 hr later. Chronic NTG treatment caused severe cephalic allodynia (Baselines); which was significantly inhibited by ACY-738 at 4 hr and 24 hr post-injection. p<0.0001, F = 209.8 chronic treatment, p=0.0002, F = 16.85 drug, p=0.0046, F = 5.174 time, and interaction p<0.0001 F = 11.19, three-way RM ANOVA, Holm- Sidak post hoc analysis, ***p<0.001, t = 7.006 NTG-Veh as compared to Veh-Veh at baseline, ***p<0.001 t = 9.126 NTG-Veh as compared to Veh-Veh at 4 hr time point, ***p<0.001 t = 6.736 NTG-Veh as compared to Veh-Veh at 24 hr timepoint; +++p<0.001, t = 7.993 NTG-ACY compared to the NTG-Veh treated mice at 4 hr timepoint, +++p<0.001, t = 6.069; n = 12 mice/group. (B) Representative trigeminal nucleus caudalis neurons from mice treated with VEH-ACY (top) or NTG-ACY (bottom) depicting alterations in cytoarchitecture over the 48 hr time course. In the trigeminal nucleus caudalis, the (C) number of branch points/neuron were significantly decreased following NTG treatment (NTG-Vehicle) an effect not observed following treatment with ACY (NTG-ACY); p<0.0001, F = 17.46, 95% CI (1.024, 2.864) effect of chronic treatment, p=0.0664, F = 3.424, 95% CI (−1.781, 0.05890) drug treatment, p=0.0183, F = 5.701, 95% CI (−4.062,–0.3822) and interaction, two-way ANOVA and Holm-Sidak post hoc analysis. ****p<0.0001, t = 4.643 NTG-Veh compared to Veh-Veh; +p=0.0128, t = 2.997 NTG-Veh compared to NTG-ACY. (D) NTG also decreased total length/neuron, while ACY-738 treatment restored length in chronic NTG-treated animals. p=0.0955, F = 2.817, 95% CI (−226.4, 18.49) effect drug treatment, and p=0.0062, F = 7.717, 95% CI (−588.9,–99.19) interaction, two-way ANOVA and Holm-Sidak post hoc analysis. *p=0.0217, t = 2.897 NTG-Veh compared to Veh-Veh; +p=0.0119, t = 3.151 NTG-Veh compared to NTG-ACY. (E) Chronic NTG resulted in significantly fewer total interactions relative to vehicle treatment, an effect not observed in ACY-738-treated groups. p=0.1278, F = 2.347, 95% CI (−8.780, 1.113) effect drug treatment, p=0.2641, F = 1.257, 95% CI (−2.141, 7.752) chronic treatment, and p=0.0084, F = 7.158, 95% CI (−23.28,–3.495) interaction, two-way ANOVA and Holm-Sidak post hoc analysis. *p=0.040, t = 2.685 Veh-Veh compared to NTG-Veh; +p=0.0205, t = 2.975 NTG-Veh compared to NTG-ACY. For all analyses n = 6 mice/group, six neurons per mouse. At 48 hr, the restorative effects of ACY-738 were no longer present. Chronic NTG treated groups now showed decreased (F) branching. ****p<0.001, F = 46.33, 95% CI (2.138, 3.889) effect of chronic NTG two-way ANOVA. (G) Combined neurite length was also lower in NTG treated groups. ****p<0.0001, F = 17.41, 95% CI (39.94, 111.9) effect of chronic NTG. (H) Chronic NTG groups also showed decreased interactions following Sholl analysis at the 48 hr timepoint. ***p=0.0002, F = 14.99, 95% CI (3.725, 11.50) effect of chronic NTG two-way ANOVA.
-
Figure 3—source data 1
Data Figure 3A.
- https://cdn.elifesciences.org/articles/63076/elife-63076-fig3-data1-v2.xlsx
-
Figure 3—source data 2
Data Figure 3C.
- https://cdn.elifesciences.org/articles/63076/elife-63076-fig3-data2-v2.xlsx
-
Figure 3—source data 3
Data Figure 3D.
- https://cdn.elifesciences.org/articles/63076/elife-63076-fig3-data3-v2.xlsx
-
Figure 3—source data 4
Data Figure 3E.
- https://cdn.elifesciences.org/articles/63076/elife-63076-fig3-data4-v2.xlsx
-
Figure 3—source data 5
Data Figure 3F.
- https://cdn.elifesciences.org/articles/63076/elife-63076-fig3-data5-v2.xlsx
-
Figure 3—source data 6
Data Figure 3G.
- https://cdn.elifesciences.org/articles/63076/elife-63076-fig3-data6-v2.xlsx
-
Figure 3—source data 7
Data Figure 3H.
- https://cdn.elifesciences.org/articles/63076/elife-63076-fig3-data7-v2.xlsx
Figure 4 with 1 supplement
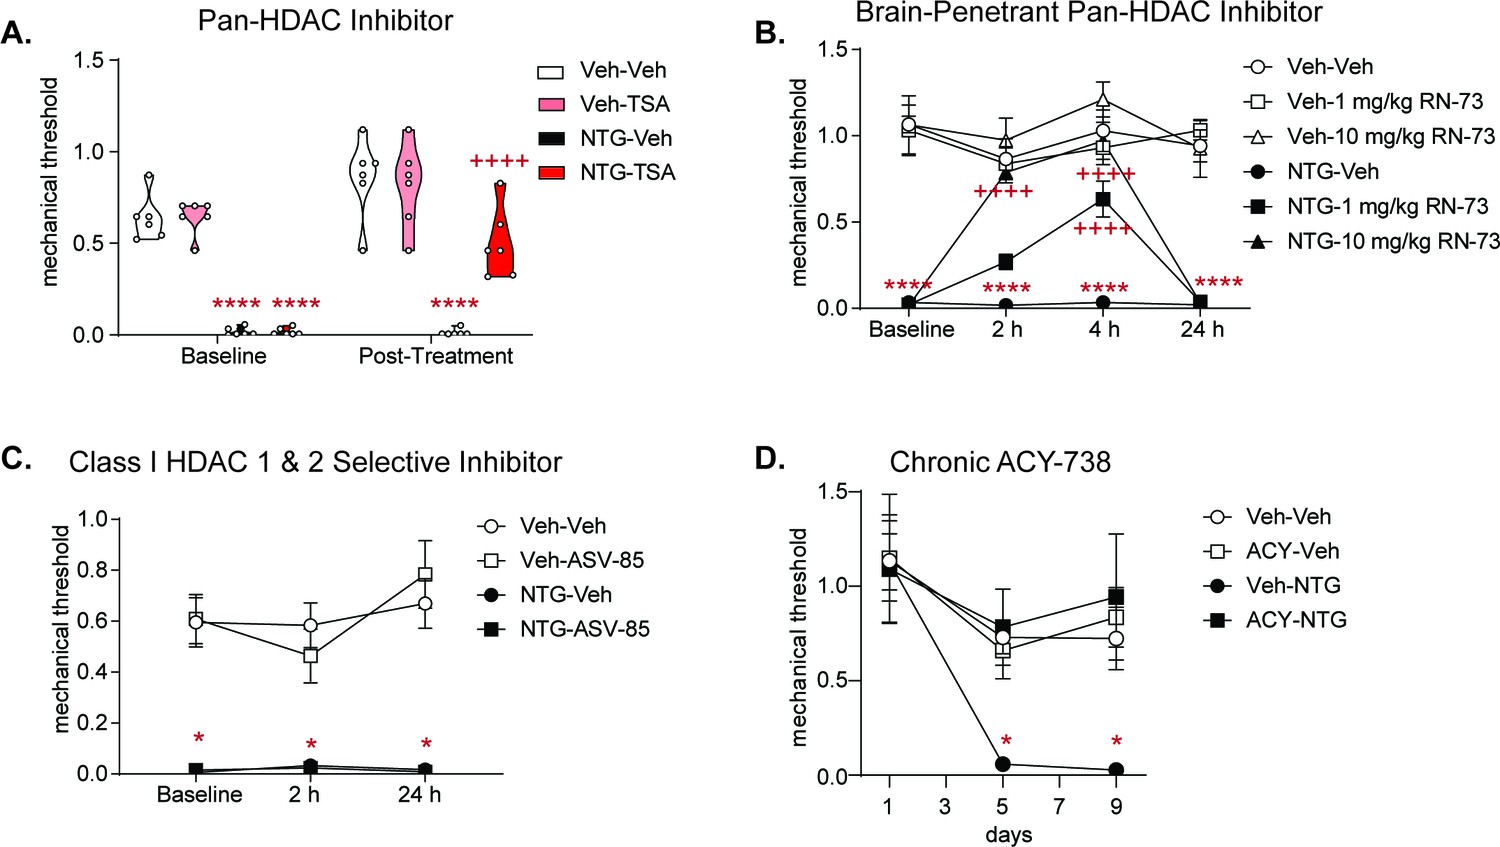
Pan-HDAC inhibitors, but not Class I-selective HDAC inhibitor block chronic migraine-associated pain; and repeated ACY-738 can prevent development of NTG induced allodynia.
Male and female C57BL/6J mice were treated with chronic intermittent NTG (10 mg/kg IP) or Vehicle for 9 days. On day 10, mice were subsequently tested for baseline responses (Baseline) and then injected with various HDAC inhibitors. Baselines were always lower for NTG-treated mice demonstrating chronic allodynia. Separate groups of mice were tested for each drug. (A) Mice were treated with the pan-HDAC6 inhibitor Trichostatin A (TSA, 2 mg/kg IP) or Vehicle (20% DMSO in 0.01 M PBS IP) and subsequently tested 2 hr post-drug. TSA significantly inhibited chronic cephalic allodynia. p<0.0001, F = 271.6 effect of chronic treatment, p=0.0066, F = 9.193 effect of drug, p=0.0001, F = 22.30 time, and p=0.0080, F = 8.688 interaction, Three-way ANOVA and Holm-Sidak post hoc analysis. ****p<0.0001, t = 7.507 NTG-Veh relative to Veh-Veh at baseline ****p<0.0001, t = 7.506 NTG-TSA relative to Veh-Veh at baseline, ****p<0.0001 t = 4.351 NTG-Veh compared to Veh-Veh 2 hr time point. ++++p<0.0001, t = 5.872 relative to NTG-Vehicle at 2 hr time point n = 6–10/group (B) Mice were treated with the novel brain-penetrant pan-HDAC inhibitor, RN-73 at 1 or 10 mg/kg (IP) or vehicle (10% DMSO, 10%Tween-80, and 0.9% NaCl). Mice were subsequently tested in the hind-paw region 2, 4, and 24 hr post-treatment. RN-73 at the 10 mg/kg dose had a significant effect at the 2 and 4 hr time point, and the 1 mg/kg dose had a significant effect only at the 4 hr time point compared to the NTG-Veh group. Neither dose of RN-73 produced any effect 24 hr after treatment compared to NTG-Veh. Three-way RM ANOVA and Holm-Sidak post hoc analysis, High Dose-p <0.0001, F = 135.3 effect of treatment, p=0.0009, F = 13.87 drug, p<0.0001, F = 15.01 time and p=0.0002, F = 7.396 interaction; Low Dose- p<0.0001, F = 240.9 effect of treatment, p=0.0780, F = 3.347 drug, p=0.0025, F = 5.183 time and p=0.0002, F = 7.214 interaction, ****p<0.0001, t = 7.858 NTG-Veh relative to Veh-Veh at baseline, ****p<0.0001, t = 6.458 NTG-Veh relative to Veh-Veh at 2 hr time point, ****p<0.0001, t = 7.528 NTG-Veh relative to Veh-Veh at 4 hr time point, ****p<0.0001, t = 7.023 NTG-Veh relative to Veh-Veh at 24 hr time point; ++++p<0.0001, t = 5.867 NTG- RN-73 high dose relative to NTG-Vehicle at 2 hr point, ++++p<0.0001, t = 7.138 NTG- RN-73 high dose relative to NTG-Vehicle at 4 hr time point, ++++p<0.0001, t = 5.480 NTG- RN-73 low dose relative to NTG-Vehicle at 4 hr time point n = 8/group. (C) Following chronic NTG/VEH treatment, mice were treated with the Class I specific HDAC inhibitor, ASV-85 (1 mg/kg IP) or Vehicle (6.25% DMSO, 5.625% Tween- 80, and 0.9% NaCl, IP) and had subsequent mechanical thresholds taken at 2 and 24 hr post-treatment. ASV-85 failed to inhibit NTG-induced pain. NTG-ASV-85 and NTG-Veh treated mice both were significantly different than the Vehicle control groups at both 2 and 24 hr time points, Three-way ANOVA and Holm-Sidak post hoc analysis p<0.0001, F = 118.1 effect of chronic treatment, *p=0.0264, q = 8.451 NTG-ASV compared to Veh-Veh at Baseline, *p=0.0196, q = 8.860 Veh-Veh compared to NTG-ASV at 2 hr time point, *p=0.0161 q = 9.568 Veh-Veh compared to NTG-ASV at 24 hr time point treated mice at same time point. n = 6/group (D) Mice were concurrently treated with ACY-738 which prevented development of basal allodynia. p=0.0309, F = 5.672 effect of NTG/Veh treatment, p=0.0663, F = 3.922 effect of ACY/Veh, p=0.0073, F = 6.947 effect of Time, p=0.0253, F = 6.617 effect of interaction of NTG/Veh and ACY/Veh, *p=0.0329, t = 3.727 NTG-Veh day 5 compared to Veh-Veh day 1, *p=0.0250, t = 3.834 NTG-Veh day 5 compared to Veh-Veh day 9 n = 6/group.
-
Figure 4—source data 1
Data Figure 4A.
- https://cdn.elifesciences.org/articles/63076/elife-63076-fig4-data1-v2.xlsx
-
Figure 4—source data 2
Data Figure 4B.
- https://cdn.elifesciences.org/articles/63076/elife-63076-fig4-data2-v2.xlsx
-
Figure 4—source data 3
Data Figure 4C.
- https://cdn.elifesciences.org/articles/63076/elife-63076-fig4-data3-v2.xlsx
-
Figure 4—source data 4
Data Figure 4D.
- https://cdn.elifesciences.org/articles/63076/elife-63076-fig4-data4-v2.xlsx
Figure 4—figure supplement 1
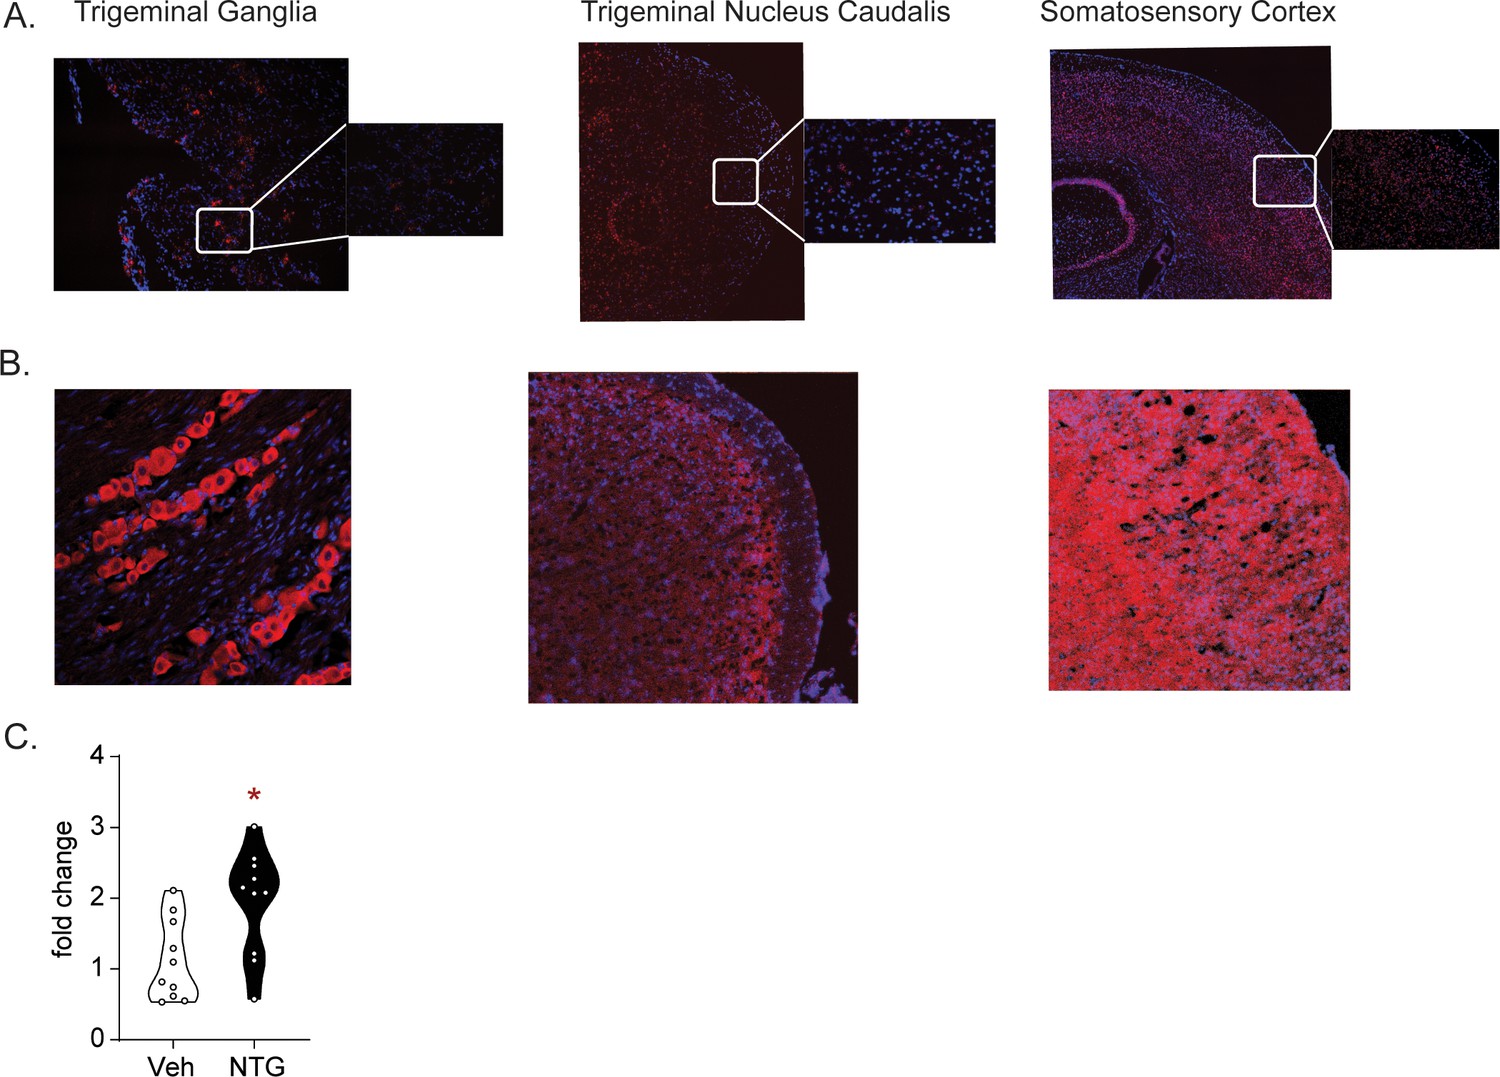
HDAC6 is expressed in migraine-processing regions and is dynamically regulated.
(A) In situ hybridization by RNAScope reveals abundant HDAC6 transcripts (red) in trigeminal ganglia, trigeminal nucleus caudalis, and somatosensory cortex (B) Immunohistochemical staining also reveals HDAC6 expression in these regions. (C) Mice were treated chronically with vehicle or NTG for 9 days and tissue was analyzed for HDAC6 gene expression on day 10. HDAC6 transcript levels were significantly increased following NTG treatment in the TG, unpaired t-test, *p=0.0128, t = 2.765, df = 18, 95% CI (0.1982, 1.452) n = 10 mice/group.
-
Figure 4—figure supplement 1—source data 1
- https://cdn.elifesciences.org/articles/63076/elife-63076-fig4-figsupp1-data1-v2.xlsx
Figure 5
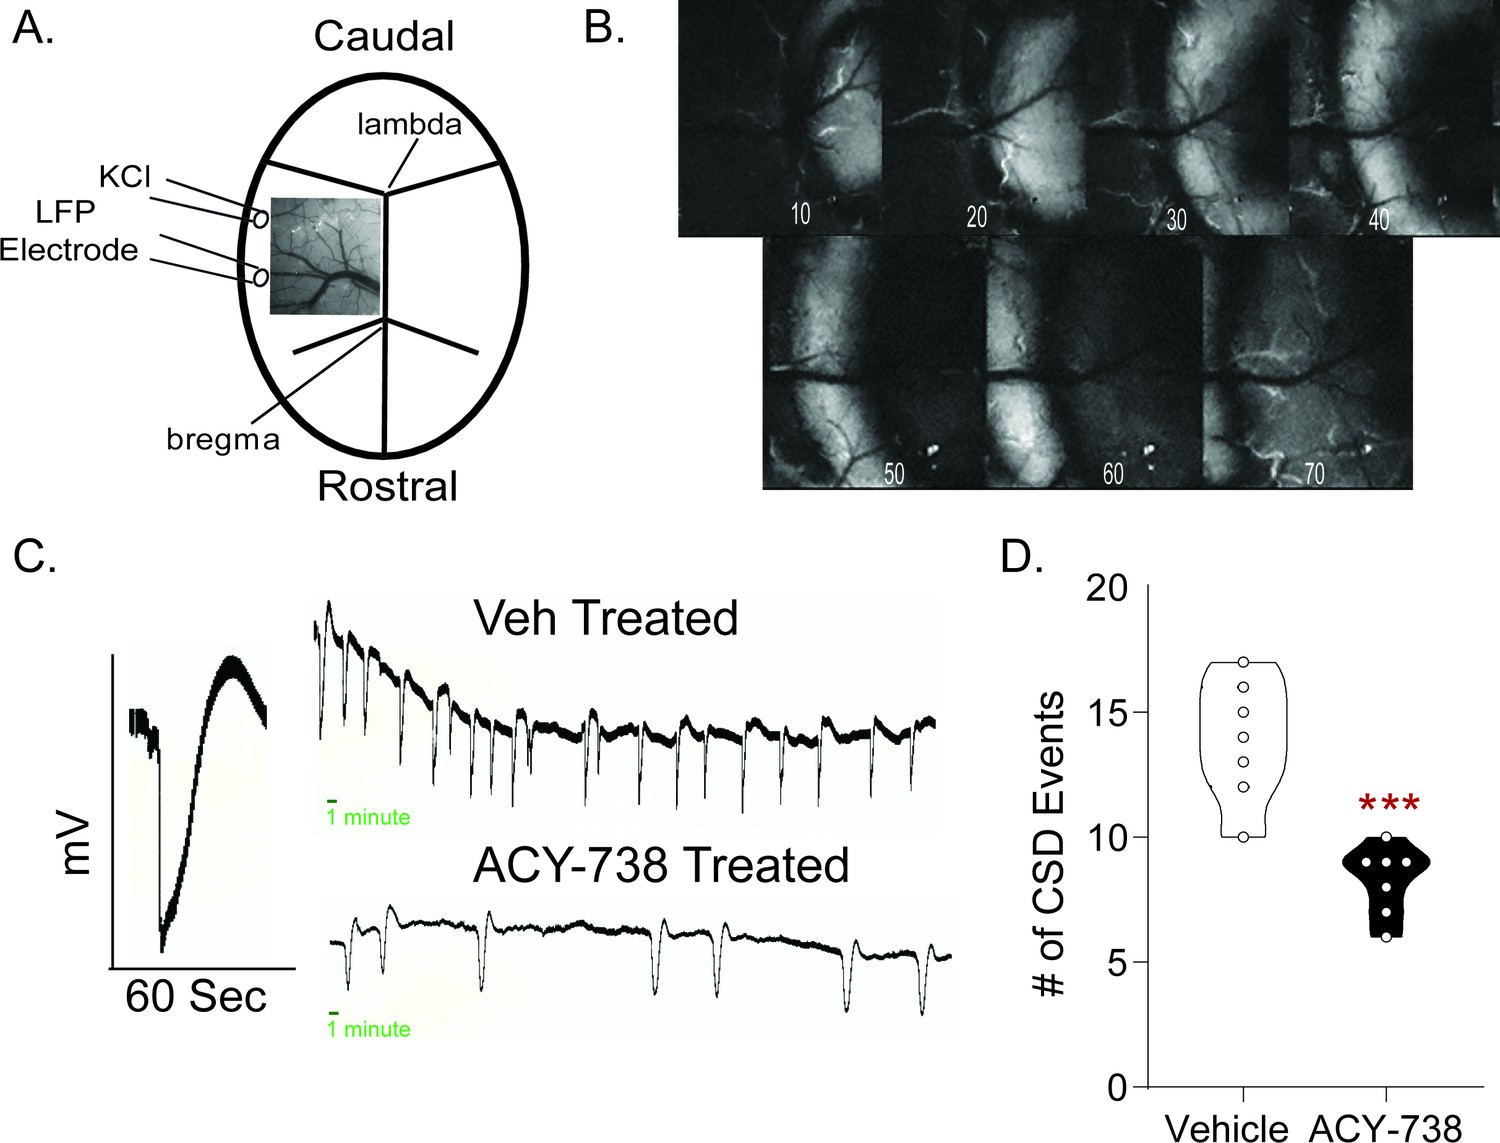
ACY-738 reduces cortical spreading depression events.
(A) Schematic of the thinned skull preparation used to visualize CSD and placement of KCl infusion and LFP recording. (B) Image sequence shows the wave of change in reflectance associated with a CSD event. (C) Representative tracing of a single CSD event of voltage change versus time. Representative line tracing of CSDs in a Vehicle (Top) vs. ACY-738 (Bottom) treated mouse over a 1 hr period. (D) Animals pretreated with ACY-738 (50 mg/kg IP) 3 hr before CSD recordings began showed a significant reduction in the average number of CSD events recorded over an hour. Unpaired t-test. ***p<0.001, t = 5.307, df = 12, 95% CI (−7.859,–3.284) n = 7/group.
-
Figure 5—source data 1
Data Figure 5D.
- https://cdn.elifesciences.org/articles/63076/elife-63076-fig5-data1-v2.xlsx
Figure 6 with 1 supplement

CSD induces decreased neuronal complexity that is prevented by treatment with ACY-738.
(A) Representative image of Golgi stained sensory/barrel cortex at 4x (left) and 20x (right). (B) Representative neuronal tracing for mice that underwent pretreatment with Vehicle or ACY-738 and underwent Sham or CSD procedures. (C) Analysis of number of branch points/neuron reveal a significant effect of CSD and of ACY-738. Two-way ANOVA analysis. ++++p<0.0001, F = 27.80, 95% CI (2.274, 4.989) effect of CSD; ****p<0.0001, F = 60.66, 95% CI (−6.722,–4.007) effect of ACY-738. (D) Neurons were further analyzed for length per neuron and CSD significantly decreased overall length, while ACY-738 significantly increased length. Two-way ANOVA. ++++ p<0.0001, F = 16.48, 95% CI (56.14, 162.1) effect of CSD, ****p<0.0001, F = 25.18, 95% CI (−187.9,–81.91) effect of ACY-738 (E) Representative Sholl analysis plot of a neuron demonstrating CSD reduces and ACY-738 increases neuronal complexity. (F) Sholl analysis broken up by 0.377 µm/20 voxel distances showing differences between groups. (G) Sholl analysis revealed a significant decrease in total intersections after CSD compared to Sham mice; and pretreatment with ACY-738 increased total intersections compared to vehicle-treated groups. Two-way ANOVA ++p=0.0011, F = 10.87. 95% CI (3.601, 14.30) effect of CSD, ****p<0.0001, F = 23.98, 95% CI (−18.64,–7.944) effect of ACY-738. n = 6 mice/group, nine neurons/mouse.
-
Figure 6—source data 1
Data Figure 6C.
- https://cdn.elifesciences.org/articles/63076/elife-63076-fig6-data1-v2.xlsx
-
Figure 6—source data 2
Data Figure 6D.
- https://cdn.elifesciences.org/articles/63076/elife-63076-fig6-data2-v2.xlsx
-
Figure 6—source data 3
Data Figure 6F.
- https://cdn.elifesciences.org/articles/63076/elife-63076-fig6-data3-v2.xlsx
-
Figure 6—source data 4
Data Figure 6G.
- https://cdn.elifesciences.org/articles/63076/elife-63076-fig6-data4-v2.xlsx
Figure 6—figure supplement 1
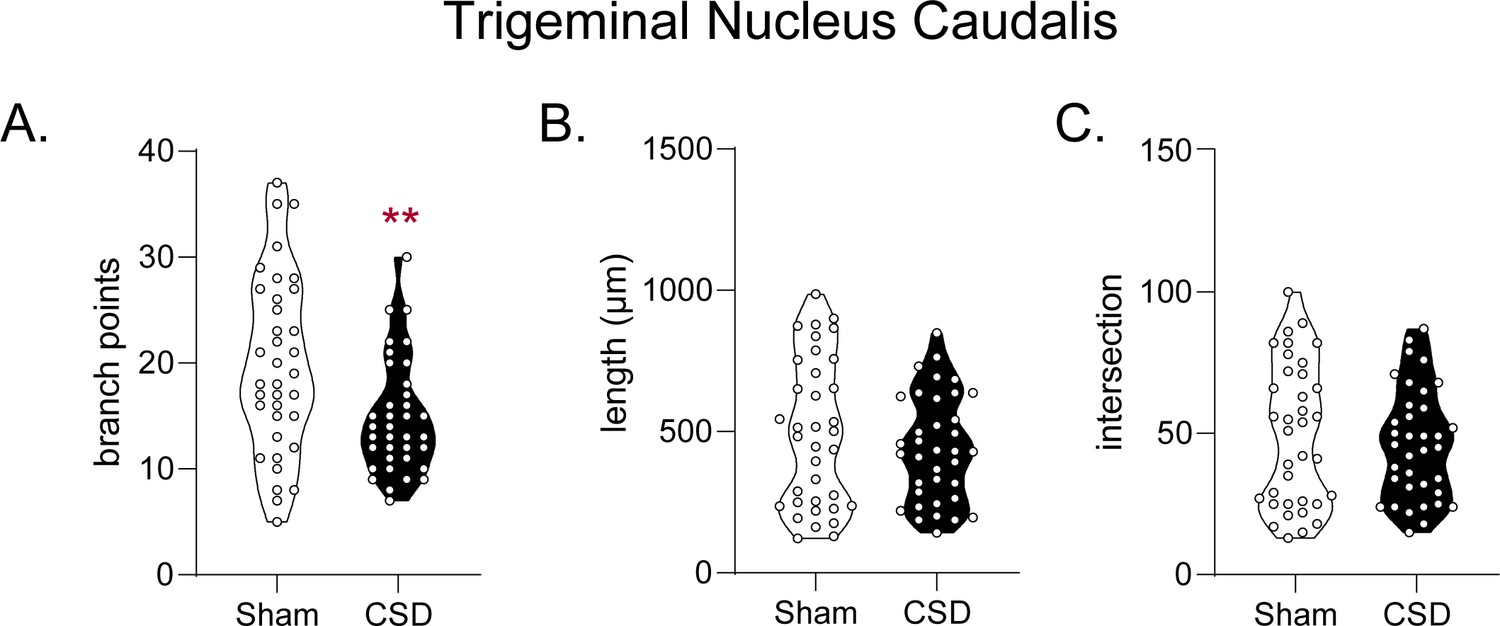
Cortical spreading depression (CSD) results in blunted neuronal complexity in the trigeminal nucleus caudalis (TNC).
Mice underwent the previously described CSD procedure or a sham surgery in which no KCl was dripped onto the dura. Mice were sacrificed immediately after an hour of recording. (A) Neurons were analyzed for number of branch points, and CSD resulted in significantly fewer branch points relative to sham controls **p=0.0040, t = 2.980, df = 70, 95% CI (−8.207,–1.626), unpaired t-test. (B) Neurons were further analyzed for combined neuronal length and no significant difference was observed p=0.3340, t = 0.9729, df = 70, 95% CI (−159.8, 55.01) unpaired t-test. (C) Total number of intersections were analyzed using Sholl analysis and there was no significant difference p=0.5069, t = 0.6671, df = 70, 95% CI (−14.18, 7.074) unpaired t-test n = 6/group, six neurons per mouse.
-
Figure 6—figure supplement 1—source data 1
- https://cdn.elifesciences.org/articles/63076/elife-63076-fig6-figsupp1-data1-v2.xlsx
-
Figure 6—figure supplement 1—source data 2
- https://cdn.elifesciences.org/articles/63076/elife-63076-fig6-figsupp1-data2-v2.xlsx
-
Figure 6—figure supplement 1—source data 3
- https://cdn.elifesciences.org/articles/63076/elife-63076-fig6-figsupp1-data3-v2.xlsx
Figure 7
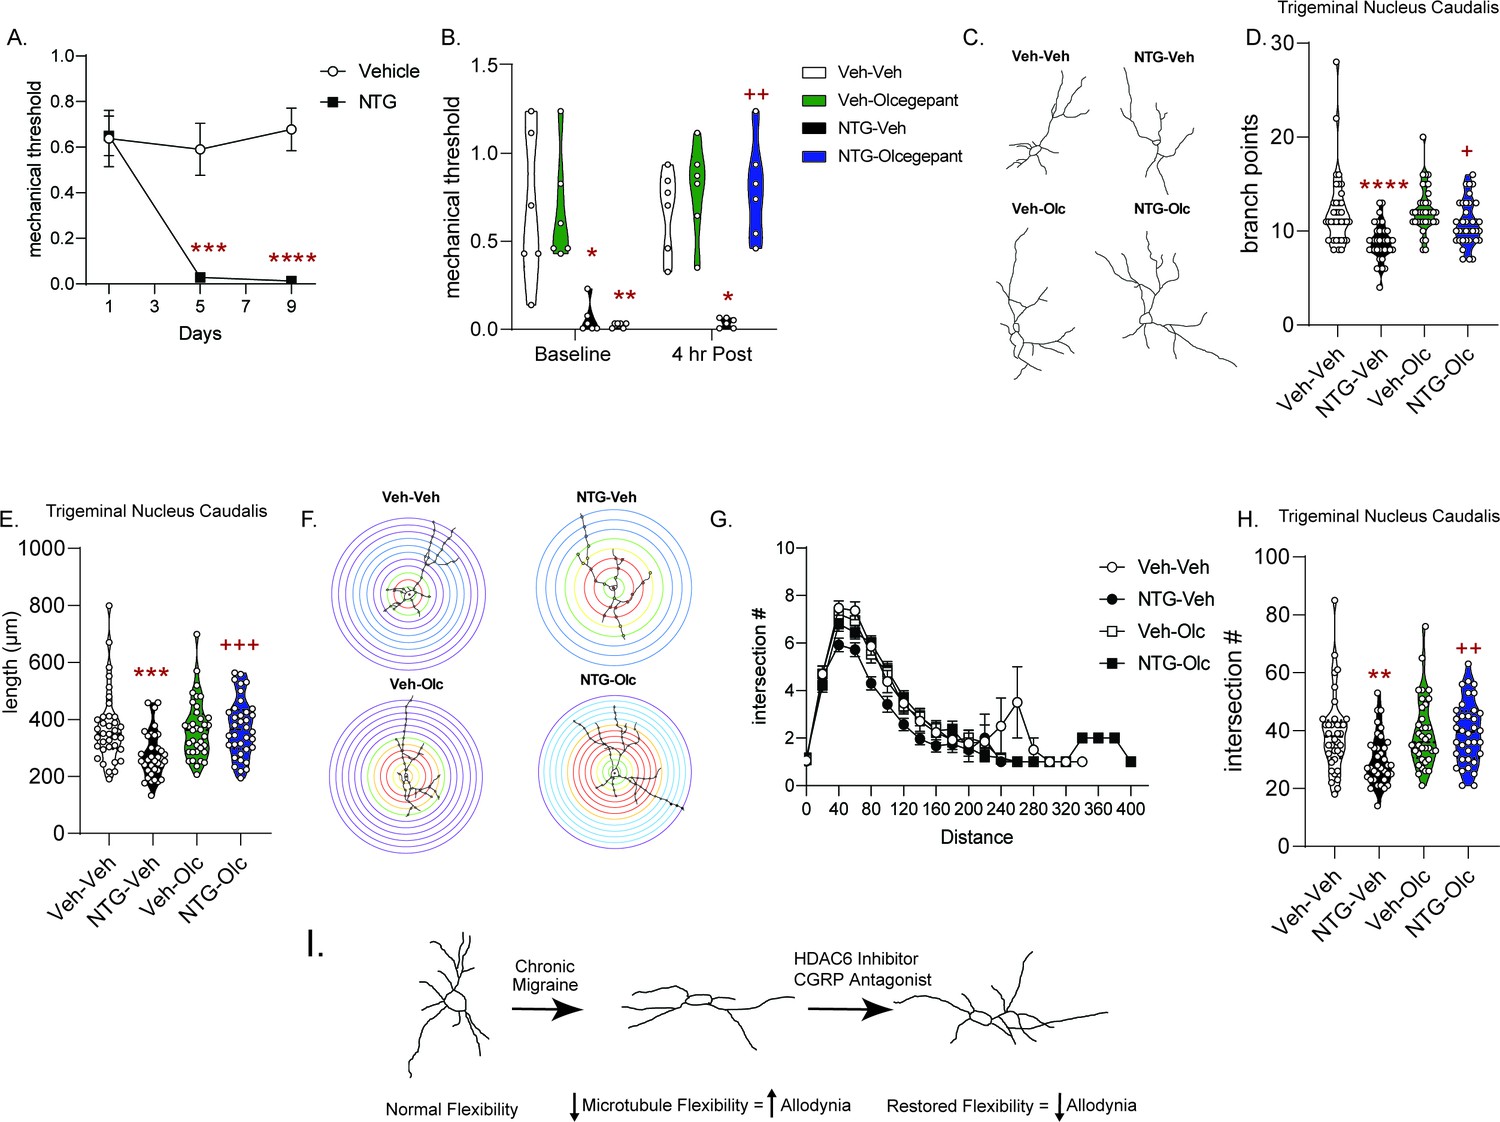
Treatment with the CGRP receptor antagonist, olcegepant, blocks NTG-induced chronic allodynia and reverses blunted cytoarchitecture.
(A) Periorbital mechanical thresholds were accessed prior to Vehicle/NTG administration on days 1, 5, and 9. NTG produced cephalic allodynia; p=0.0002, F = 19.16, 95% CI (0.2129, 0.5964) effect of chronic treatment, p<0.0001, F = 14.25 time, and p<0.0001, F = 14.05 interaction, two-way RM ANOVA and Holm-Sidak post hoc analysis. ***p=0.0009, t = 4.904 Veh compreared to NTG Day 5, ****p<0.0001, t = 7.110 Veh compared to NTG Day 9 n = 12/group. (B) Mice were treated with olcegepant (1 mg/kg, IP) or vehicle (0.9% NaCl) and tested 4 hr later. Olcegepant significantly reversed chronic cephalic allodynia. p=0.0002, F = 32.12 effect of chronic treatment, p=0.0014, F = 19.29 drug, p=0.0172, F = 8.126 time, and p=0.0007, F = 23.40 interaction of time and Veh/Olc. Three-way ANOVA and Holm-Sidak post hoc analysis. *p=0.0137, t = 3.857 NTG-Veh compared to Veh-Veh at Baseline, **p=0.0024, t = 4.798 NTG-Olc compared to Veh-Veh at baseline, *p=0.0110, t = 3.980 NTG-Veh compared to Veh-Veh at 4 hr time point, ++p=0.0026 NTG-Veh relative to NTG-Olc at the 4 hr time point n = 6/group. (C) Representative neuron tracing of mice that were chronically treated with vehicle/NTG every other day for 9 days and on day 10 were treated with olcegepant or vehicle and sacrificed 4 hr later for Golgi staining. (D) The number of branch points/neuron were significantly decreased following NTG treatment (NTG-Vehicle); while NTG-olcegepant treated mice showed increased branching compared to the NTG-Vehicle treatment alone. p<0.0001, F = 26.82, 95% CI (1.477, 3.301) effect of chronic treatment, p=0.0236, F = 5.237, 95% CI (−1.967,–0.1437) drug treatment, and p=0.0425, F = 4.193, 95% CI (−3.713,–0.06510) interaction, two-way ANOVA and Holm-Sidak post hoc analysis. ****p<0.0001, t = 5.110 NTG-Veh compared to Veh-Veh, +p=0.0104, t = 3.066 NTG-olcegepant compared to NTG-Veh. (E) NTG also decreased total length/neuron; while NTG-olcegepant-treated mice showed restored length compared to the NTG-Vehicle treatment alone p=0.0068, F = 7.541, 95% CI (13.40, 82.2) effect of NTG treatment, p=0.0098, F = 6.853, 95% CI (−80.08,–11.17) drug treatment, and p=0.0032, F = 9.009, 95% CI (−173.5,–35.71) interaction, two-way ANOVA and Holm-Sidak post hoc analysis. ***p=0.0005, t = 4.064 NTG-Veh compared to Veh-Veh, +++p=0.0009, t = 3.793 NTG-olcegepant compared to NTG-Veh. (F) Representative Sholl analysis image of neuronal complexity in the four groups. (G) Sholl analysis broken up by 0.377 µm/20 pixel distances reveal differences between NTG-Veh treatment relative to the other groups. (H) NTG-Veh results in significantly fewer total interactions relative to the Veh-Veh treatment and NTG-olcegepant mice had significantly more total interactions compared to NTG-Veh p=0.0210, F = 5.447, 95% CI (0.6772, 8.184) effect chronic treatment, p=0.0127, F = 6.371, 95% CI (−8.545,–1.038) drug treatment, and p=0.0143, F = 6.151, 95% CI (−16.92,–1.910) interaction, two-way ANOVA and Holm-Sidak post hoc analysis. **p=0.0039, t = 3.404 NTG-Veh compared to Veh-Veh; ++p=0.0039, t = 3.538 NTG-Veh compared to NTG-olcegepant. For all analysis n = 6 mice/group, six neurons per mouse. (I) Schematic summary of findings. Endogenously there is a balance of acetylated and deacetylated α-tubulin which regulates optimal neuronal complexity. In the case of chronic migraine, there is a disbalance resulting in decreased neuronal complexity. HDAC6 or CGRP receptor inhibition restores tubulin dynamics and neuronal complexity and correspondingly decreases chronic migraine-associated symptoms.
-
Figure 7—source data 1
Data Figure 7A.
- https://cdn.elifesciences.org/articles/63076/elife-63076-fig7-data1-v2.xlsx
-
Figure 7—source data 2
Data Figure 7B.
- https://cdn.elifesciences.org/articles/63076/elife-63076-fig7-data2-v2.xlsx
-
Figure 7—source data 3
Data Figure 7D.
- https://cdn.elifesciences.org/articles/63076/elife-63076-fig7-data3-v2.xlsx
-
Figure 7—source data 4
Data Figure 7E.
- https://cdn.elifesciences.org/articles/63076/elife-63076-fig7-data4-v2.xlsx
-
Figure 7—source data 5
Data Figure 7G.
- https://cdn.elifesciences.org/articles/63076/elife-63076-fig7-data5-v2.xlsx
-
Figure 7—source data 6
Data Figure 7H.
- https://cdn.elifesciences.org/articles/63076/elife-63076-fig7-data6-v2.xlsx
Videos
Animation 1
Representational gif file of trigeminal nucleus caudalis (TNC) image at 20X magnification used to trace neurons.
Images were taken through changes in z-stack focus and collapsed into a single image file. During tracing, different focal levels were used to better differentiate neurite components from one neuron to another.
Tables
Key resources table
| Reagent type (species) or resource | Designation | Source or reference | Identifiers | Additional information |
|---|---|---|---|---|
| Strain, strain background (Mouse Male and Female) | C57BL/6J | Jackson Laboratories | RRID:IMSR_JAX:000664 | |
| Antibody | Rabbit polyclonal anti-HDAC6 antibody | Tso-Pang Yao Duke University | (1:500) | |
| Antibody | Alexa Fluor 555 Donkey polyclonal anti-Rabbit antibody | Life Technologies | RRID:AB_162543 | (1:2000) |
| Antibody | Mouse monoclonal anti-acetyl-α-tubulin antibody | Sigma | RRID:AB_2819178 (Sigma Clone 6-11B1) | |
| Antibody | HRP-linked goat polyclonal anti-mouse antibody IgG | Jackson ImmunoResearch | RRID:AB_10015289 | |
| Commercial assay or kit | RNeasy Plus mini kit | Quiagen | ||
| Chemical compound, drug | Nitroglycerin | American Reagent | Purchased in 30% alcohol,30% propylene glycol, and water solution | |
| Chemical compound, drug | ACY-738 | Acetylon | 5% DMSO saline solution | |
| Chemical compound, drug | Trichostatin A | Sigma | T8552 | |
| Chemical compound, drug | Olcegepant | Tocris | BIBN 4096 | |
| Software, algorithm | Simple Neurite Tracer |
Additional files
-
Supplementary file 1
Summary of HDAC inhibition by ASV-85.
- https://cdn.elifesciences.org/articles/63076/elife-63076-supp1-v2.docx
-
Supplementary file 2
Statistical analysis.
- https://cdn.elifesciences.org/articles/63076/elife-63076-supp2-v2.docx
-
Transparent reporting form
- https://cdn.elifesciences.org/articles/63076/elife-63076-transrepform-v2.docx
Download links
A two-part list of links to download the article, or parts of the article, in various formats.
Downloads (link to download the article as PDF)
Open citations (links to open the citations from this article in various online reference manager services)
Cite this article (links to download the citations from this article in formats compatible with various reference manager tools)
Neuronal complexity is attenuated in preclinical models of migraine and restored by HDAC6 inhibition
eLife 10:e63076.
https://doi.org/10.7554/eLife.63076


