The RNA-binding protein SFPQ preserves long-intron splicing and regulates circRNA biogenesis in mammals
- Department of Molecular Biology and Genetics, Aarhus University, Denmark
Figures
Figure 1 with 1 supplement
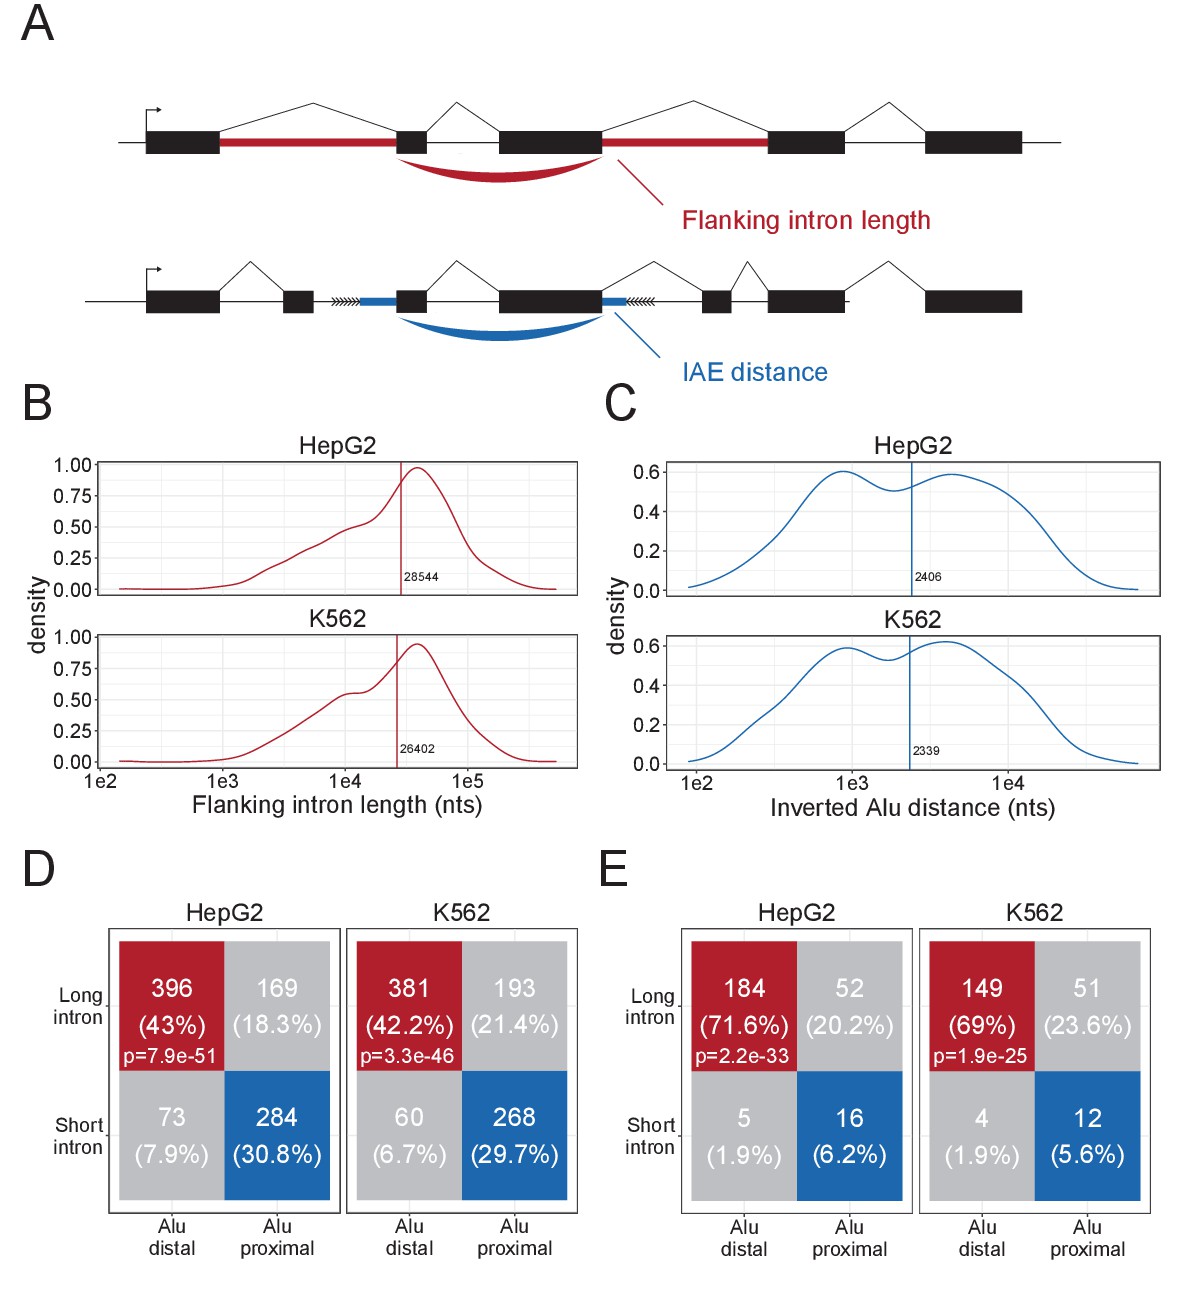
Characteristics of DALI-circRNA.
(A) Schematics showing the flanking intron length (red) defined by the sum of annotated flanking introns and inverted Alu element (IAE) distance (blue) defined by the sum of distance to the most proximal IAE. (B–C) Density plot for the distribution of flanking intron lengths (B) and IAE Distance (C) for the top1000 expressed circRNAs in HepG2 (upper facet) and K562 (lower facet). The vertical line represents the median. (D) Contingency table showing the 4-way distribution of circRNAs with long and short flanking introns (in respect to the median) and proximal and distal IAEs (also in respect to the median, see B and C) for HepG2 (left facet) and K562 (right facet). The contingency table is color-coded by circRNA subgroup; DALI (distal Alu, long flanking introns, in red), PASI (proximal Alu, short flanking introns, in blue) and ‘Other’ (unclassified, in gray) circRNAs. The p-values are Fisher's exact test of independence. (E) As in D, but for the subset of circRNAs with conserved expression in mouse.
Figure 1—figure supplement 1
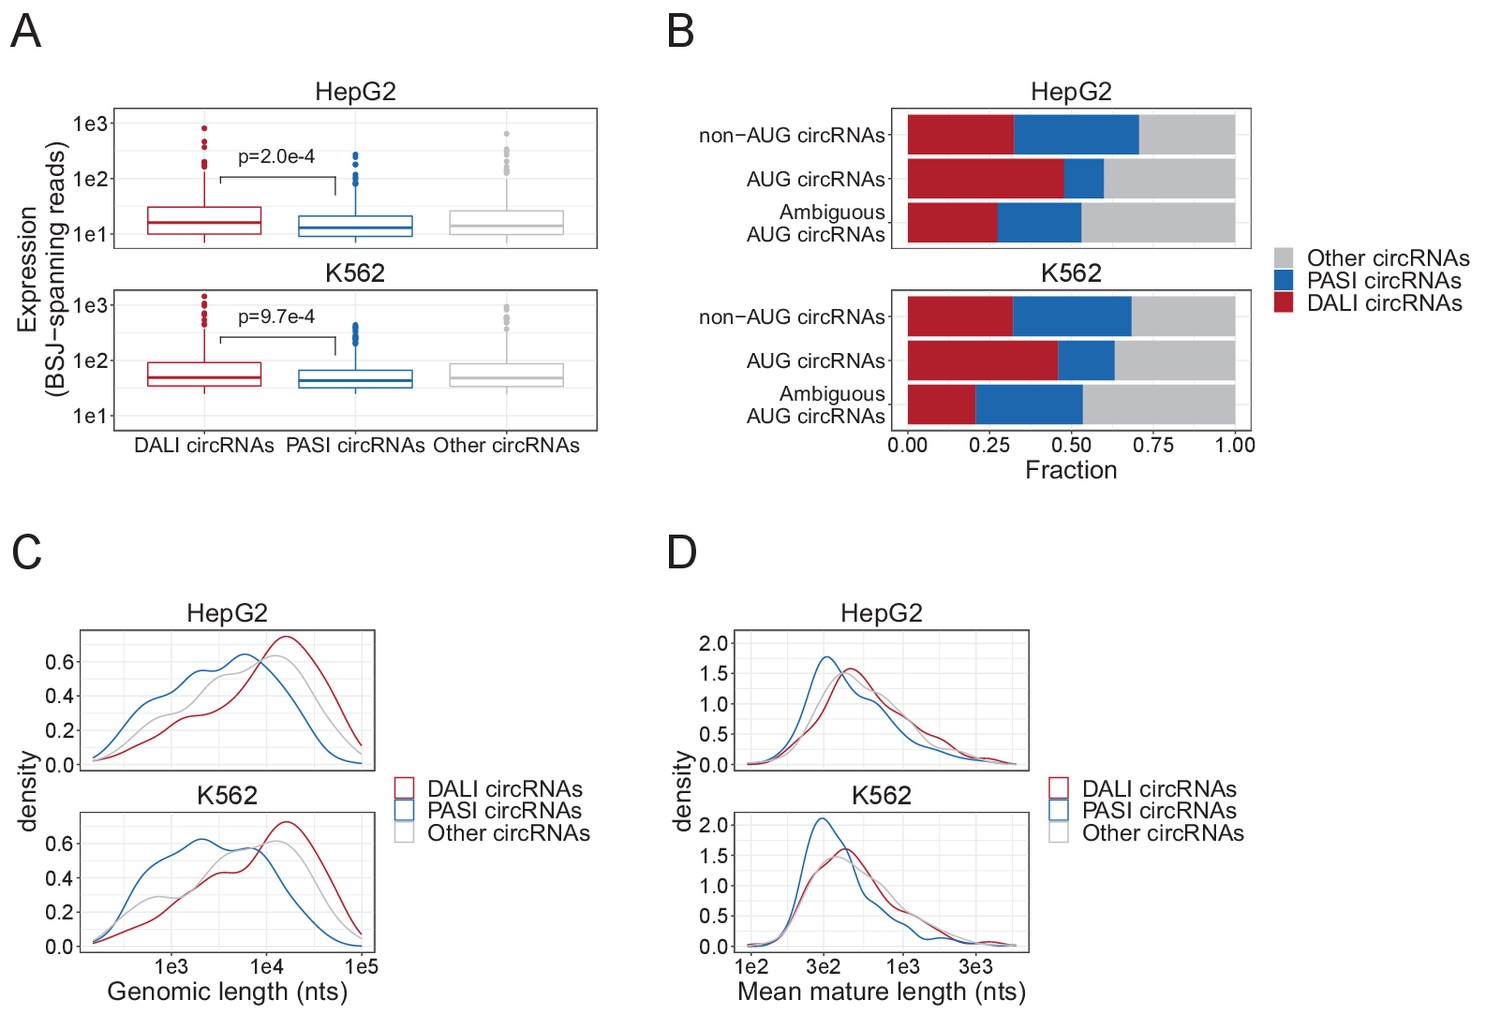
circRNAome in HepG2 and K562 from ENCODE.
(A) Boxplot showing expression distribution of top1000 expressed circRNA as measured by back-splice junction (BSJ) spanning reads for DALI, PASI and other circRNAs in HepG2 and K562 cells. (B) The fraction of DALI, PASI, and other circRNAs comprising the previously characterized subset of conserved circRNAs, the AUG circRNAs (Stagsted et al., 2019). (C–D) The distribution of genomic lengths, that is the genomic distance between the SD and SA involved in backsplicing (C) and the mature length, that is the predicted length of the fully spliced circRNAs (D) stratified by subgroup as denoted.
Figure 2 with 2 supplements
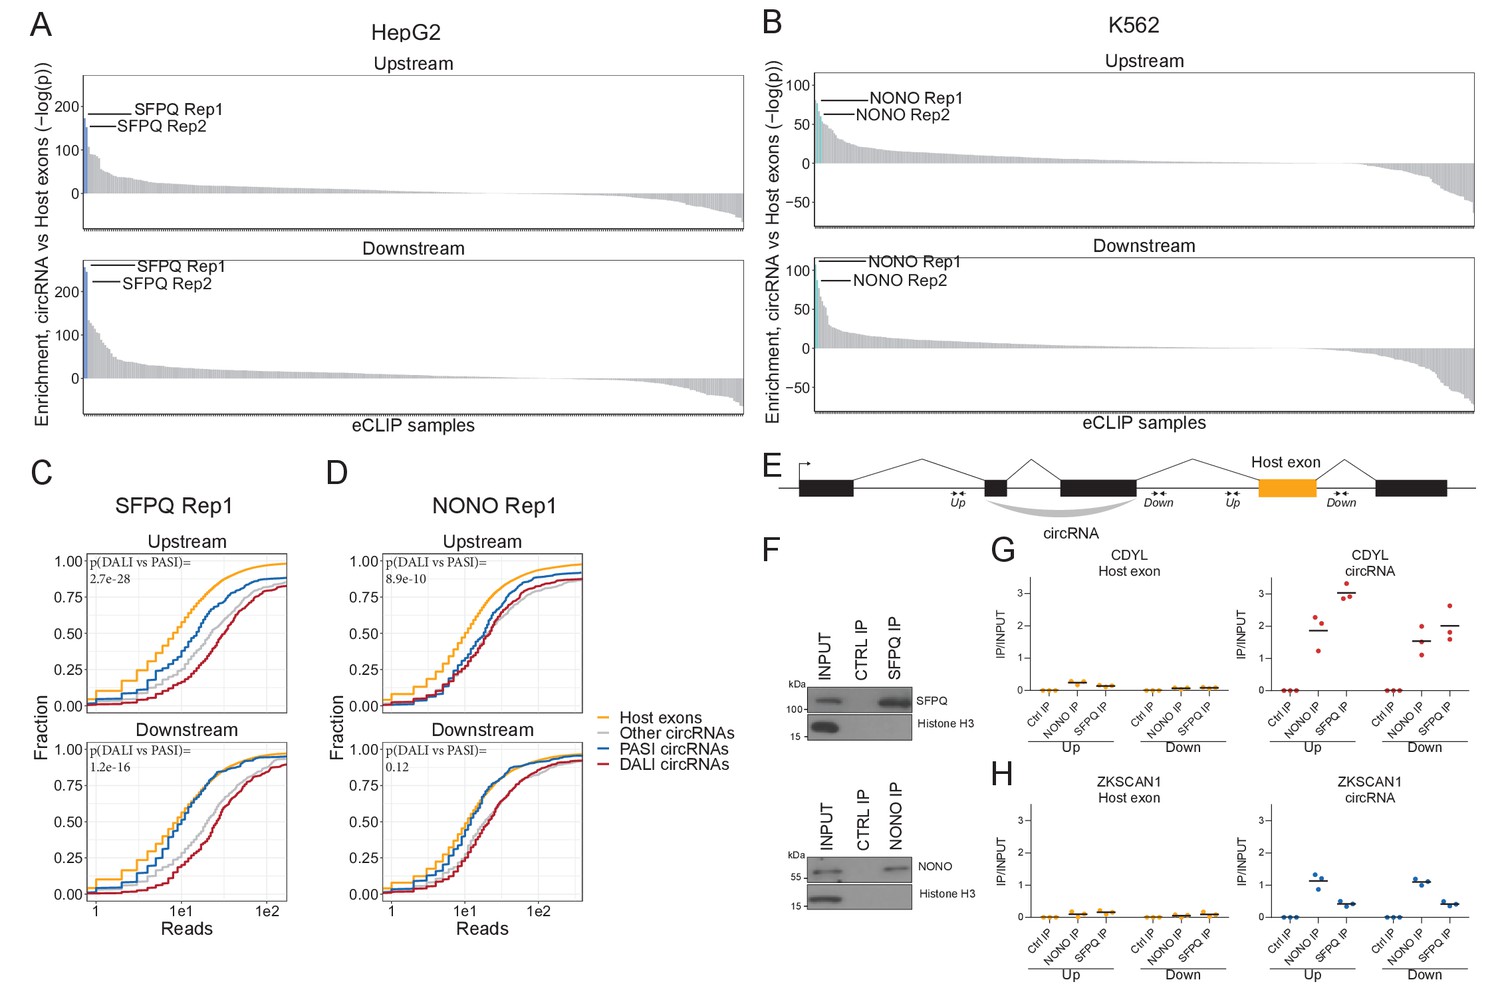
SFPQ and NONO show enriched binding in the flanking regions of DALI circRNAs.
(A–B) Barplot showing enrichment/depletion of eCLIP signal (see Supplementary file 2) in the vicinity of circRNAs (+/- 2000 nt) compared to host exons (+/- 2000 nt) as determined by Wilcoxon rank-sum tests for HepG2 (A) and K562 (B) eCLIP samples. (C–D) Cumulative plots of SFPQ (C) and NONO (D) eCLIP read distribution upstream and downstream of circRNA subgroups and host exons as denoted. (E) Schematic showing localization of primers (+/- 2000 nt) for targeting either upstream (up) or downstream (down) intronic regions of splice sites in respect to circRNA exons or host exon. (F) Western blotting of immunoprecipitated (IP), endogenous SFPQ or NONO from nuclear fractions of HepG2 cells with Histone H3 as a loading control. (G–H) RT-qPCR of intronic regions flanking a downstream host gene exon (left facet) or flanking the circRNA producing exon(s) (right facet) of CDYL (G) and ZKSCAN1 (H) upon RNA IP of endogenous SFPQ or NONO from nuclear fractions of HepG2 cells. The relative expression of immunoprecipitate (IP)/input is plotted. Data for three biological replicates are shown.
Figure 2—figure supplement 1
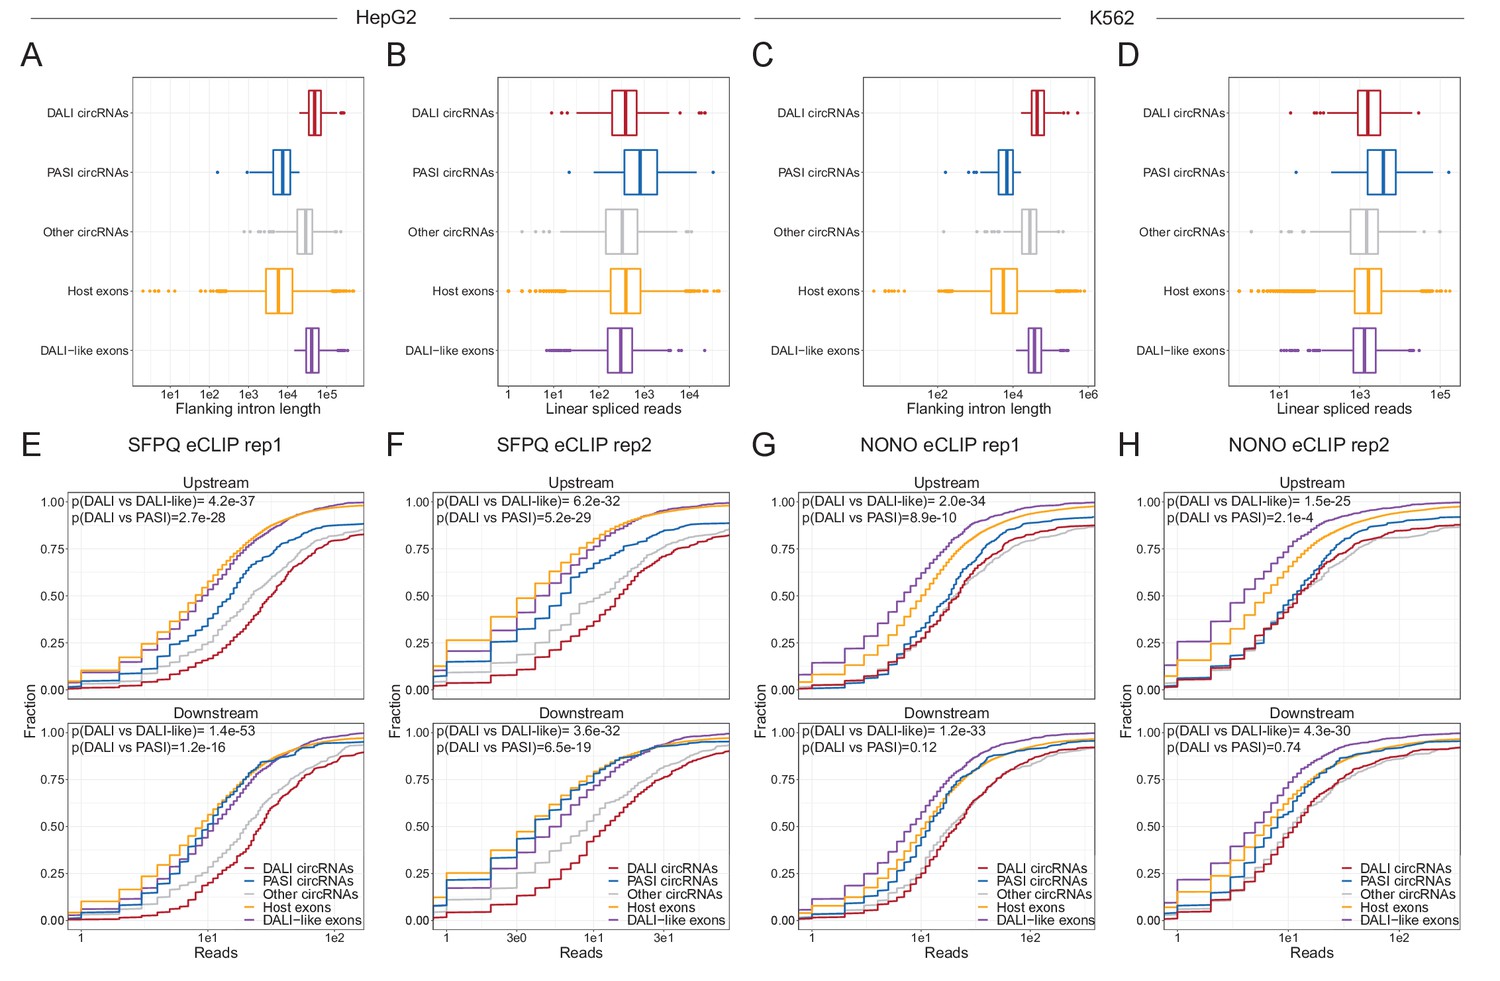
SFPQ and NONO enriched on circRNA flanking introns.
(A–D) For HepG2 (A and B) and K562 (C and D), boxplots showing the distribution of flanking intron length (A and C) or linear spliced reads (B and D) for DALI circRNAs (red), PASI circRNAs (blue), other circRNAs (gray), host exons, that is all other annotated exons from the circRNA-producing loci (orange), and DALI-like circRNAs, that is exon-pairs from annotated genes sampled to resemble DALI circRNAs based on flanking intron lengths and linear spliced reads (purple). (E–H) Boxplots of reads from SFPQ eCLIP rep1 (F), SFPQ eCLIP rep2 (G), NONO eCLIP rep1 (H), and NONO eCLIP rep2 associated with each subgroup in HepG2 cells (F–G) and K562 cells (H–I) stratified by upstream (upper facets) and downstream (lower facets) aligned reads. p-Values are calculated using Wilcoxon rank-sum tests.
Figure 2—figure supplement 2
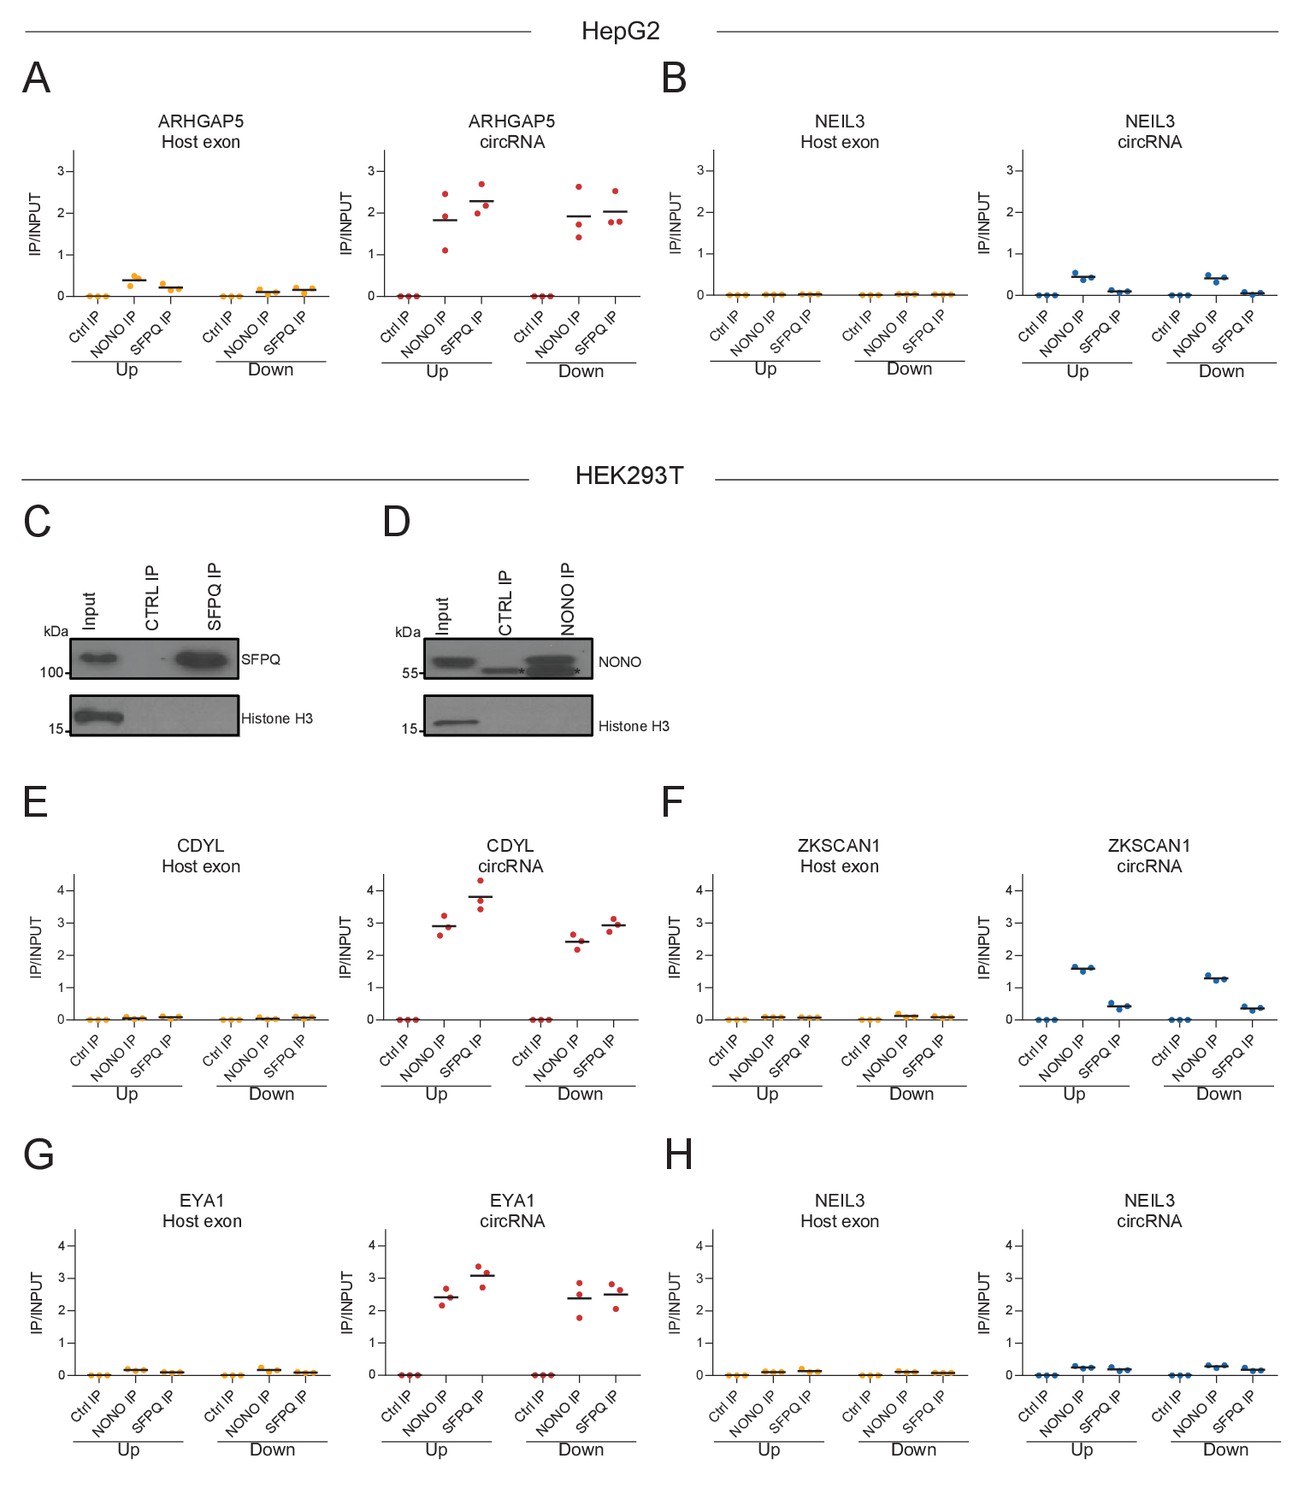
RNA immunoprecipitation of SFPQ and NONO confirms enrichment.
(A–B) As in Figure 1G–H, RT-qPCR on denoted intronic regions in ARHGAP5 (A) and NEIL3 (B) transcripts upon RNA IP of endogenous SFPQ or NONO from nuclear fractions of HepG2 cells. (C–D) Western blotting of endogenous immunoprecipitated (IP) SFPQ (C) or NONO (D) from nuclear fractions of HEK293T cells with Histone H3 as a loading control. Asterisks denote bands derived from the IP antibody. (E–H) As in A-B but using HEK293T cells and with RT-qPCR on CDYL (C), ZKSCAN1 (D), EYA (E), and NEIL3 (F). Data for three biological replicates are shown.
Figure 3 with 3 supplements
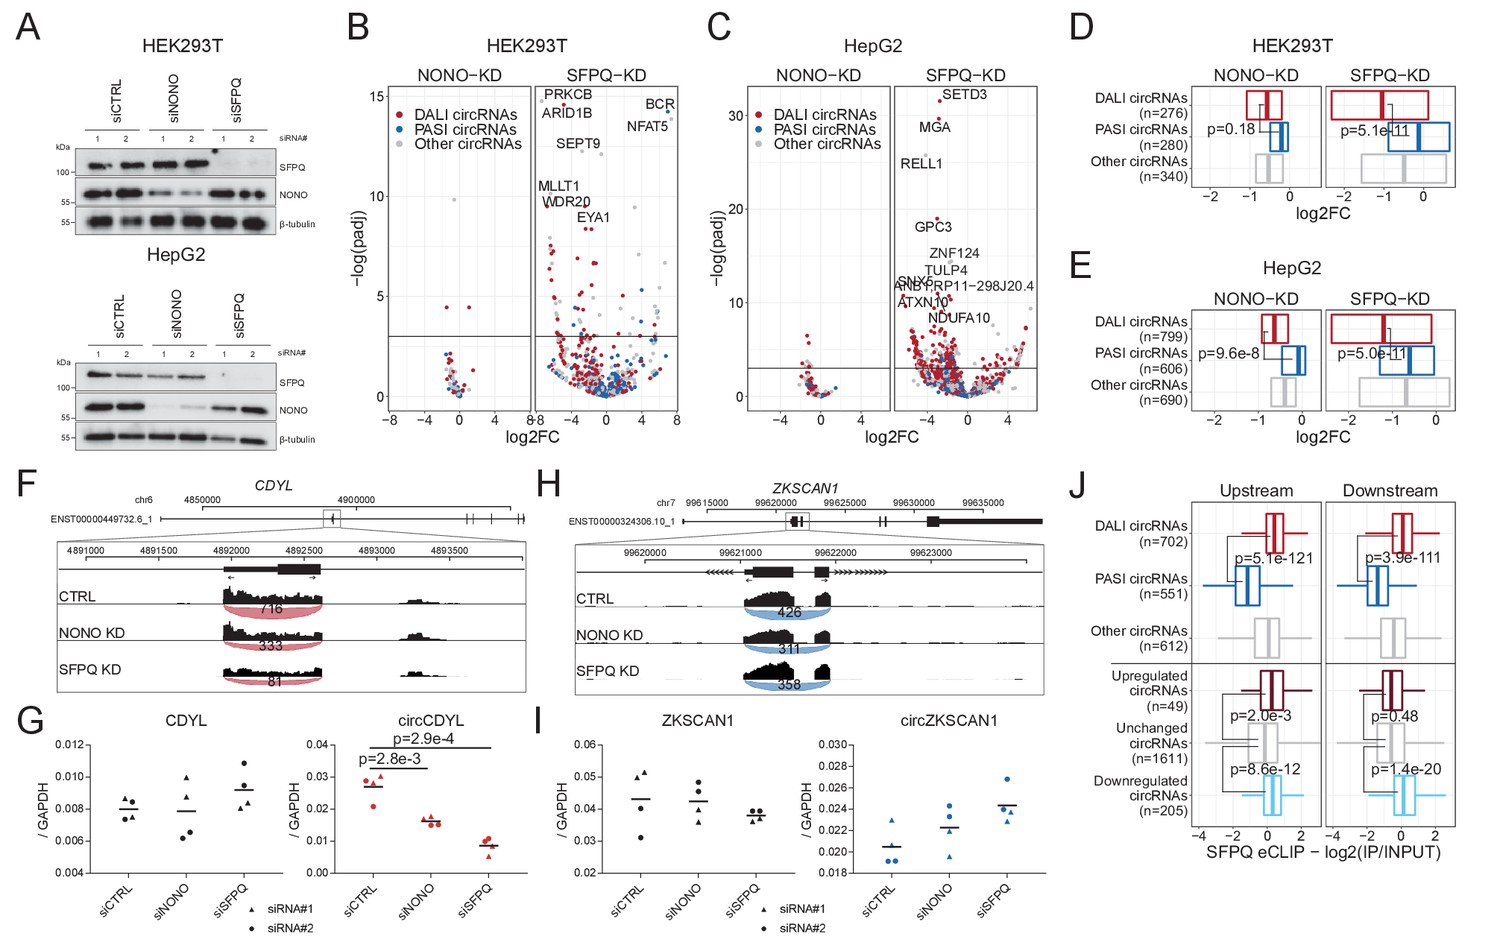
Knockdown of SFPQ affects DALI circRNAs.
(A) Western blotting of proteins from HEK293T (upper panel) and HepG2 (lower panel) cells transfected with either CTRL siRNAs, siRNAs targeting NONO mRNA, or siRNAs targeting SFPQ mRNA using antibodies against SFPQ, NONO, and β-tubulin (loading control) as denoted. (B–C) Volcano plot showing deregulated circRNAs upon NONO (left facet) and SFPQ (right facet) depletion in HEK293T cells (B) or HepG2 cells (C) color-coded by circRNA subgroup; DALI circRNAs (red), PASI circRNAs (blue) and ‘other’ circRNAs (gray). (D–E) Boxplot showing overall changes in expression (log2Foldchange) of the three circRNA subgroups upon NONO and SFPQ depletion in HEK293T (D) and HepG2 (E) cells. p-Values are calculated using two-sided Wilcoxon rank-sum tests. (F) Genome screen dump of the circCDYL expressing locus with BSJ-spanning reads visualized as junction-track in the IGV browser (G) RT-qPCR quantification of circCDYL and linear CDYL expression upon SFPQ and NONO-depletion in HepG2 cells relative to GAPDH mRNA using two different siRNA designs for each target. Data for four biological replicates are shown. p-Values are calculated using Student’s two-tailed t-test. (H–I) as in F and G, but for the PASI circRNA, circZKSCAN1. (J) Boxplot showing eCLIP enrichment for SFPQ either immediately upstream or downstream (within 2000 nucleotides from the circRNA splice sites) of expressed circRNAs stratified either by circRNA subgroup or by deregulation upon SFPQ depletion in HepG2 cells. p-Values are calculated using two-sided Wilcoxon rank-sum tests.
Figure 3—figure supplement 1

SFPQ/NONO-depletion in HEK293T and HepG2 cells.
(A) Schematic showing the siRNA-knockdown protocol in HEK293T and HepG2 cells. For each condition (CTRL, NONO-KD, and SFPQ-KD), two different siRNA designs were used to reduce off-targeting effects, and for each siRNA, the experiment was performed in biological duplicates. (B–E) Western blotting (2nd replicate, B and D) and RT-qPCR (C and E) validation of knockdown in HEK293T (B–C) and HepG2 (D–E) cells. Data for four biological replicates are shown comprising in all three cases two replicates with two different siRNA designs represented by triangles and circles. p-Values are calculated using student’s two-tailed t-test. (F–I) PCA analysis of top500 most variable mRNAs (F and H) and circRNAs (G–I) as measured across samples in HEK293T cells (F and G) and HepG2 cell (H and I) subjected to SFPQ and NONO-depletion. The individual samples are color-coded by the knockdown target as denoted. (J–K) Distributions of flanking intron lengths (J) and inverted Alu distances (K) for circRNAs detected in HEK293T (upper facet) and HepG2 (lower facet) cells. The vertical line and the corresponding value represents the median. (L) Contingency table for circRNAs stratified by flanking intron lengths and inverted Alu distances in HEK293T (left facet) and HepG2 (right facet) cells. The table is color-coded by circRNA subgroups; DALI (red), PASI (blue) and the others (gray). (M) Boxplot showing the number of BSJ-spanning reads for the top1000 circRNAs stratified by subgroup as denoted. p-Values are calculated using Wilcoxon rank-sum tests.
Figure 3—figure supplement 2
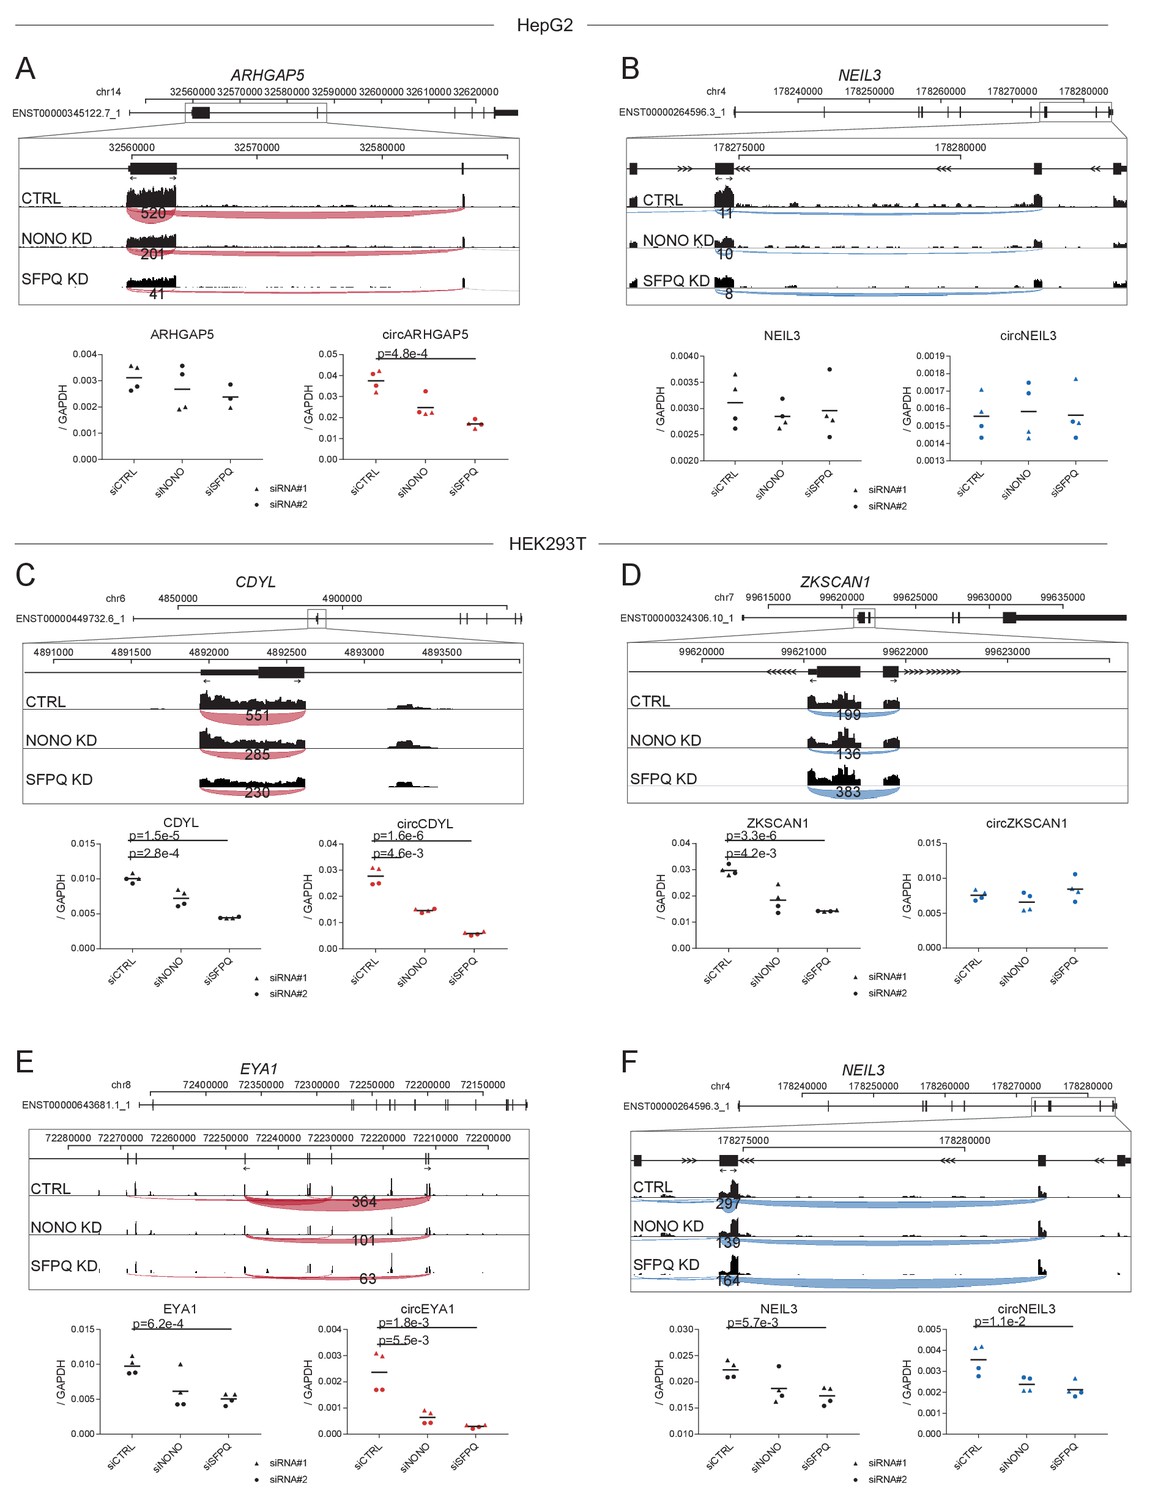
Expression profiles for selected circRNAs.
(A–F) Genomic exon-intron structures of selected circRNAs-producing genes with screendumps showing circRNAs backsplicing reads obtained from RNAseq and visualized using IGV genome browser from HepG2 (A–B) and HEK293T (C–F). Primers used for RT-qPCR are depicted schematically as divergent arrows. Below, RT-qPCR validation in independent experiment using BSJ-spanning primers (circRNAs expression) and flanking linear-splicing primers (host-gene expression) relative to GAPDH mRNA. Data for four biological replicates are shown. p-Values are calculated using student’s two-tailed t-test.
Figure 3—figure supplement 3
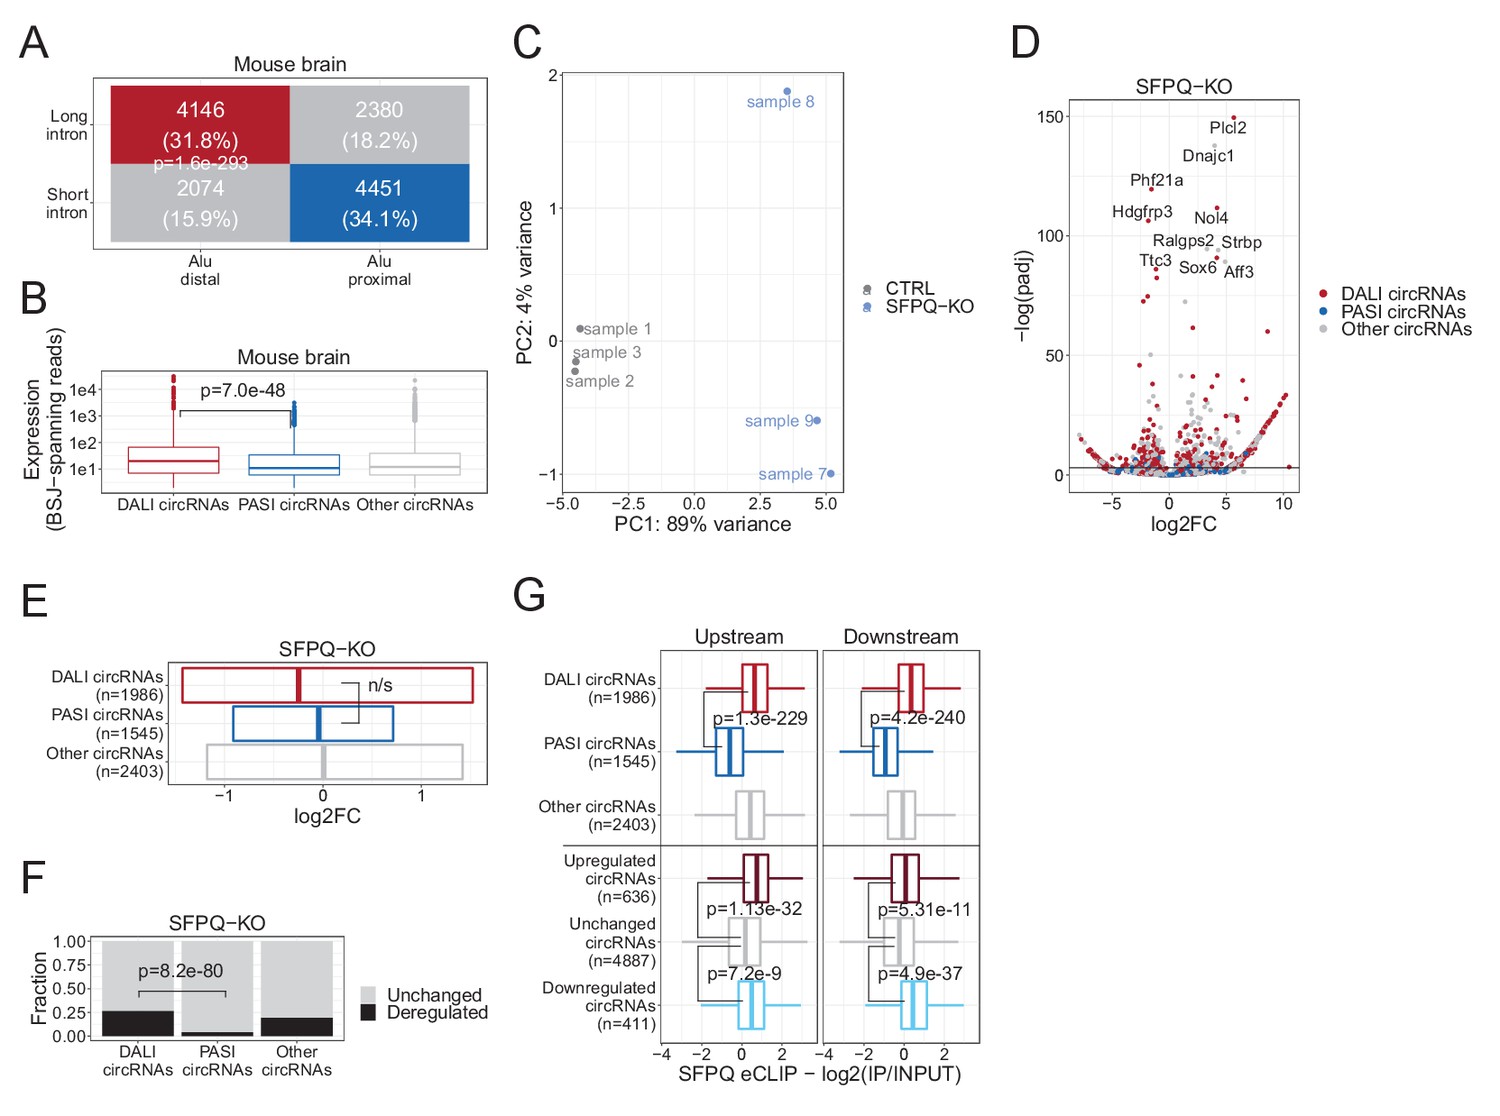
CircRNAome analysis of SFPQ knockout mouse brain data (GSE60246).
(A) Two-by-two contingency table of circRNAs stratified by intron length and inverted Alu distance. p-Value calculated by Fisher’s exact test. (B) Boxplot on the distribution of BSJ-spanning reads for each circRNAs subgroup. p-Value calculated using Wilcoxon rank-sum test. (C) PCA analysis of wild-type (CTRL) and SFPQ knockout (SFPQ-KO) samples based on circRNA expression. (D) Volcano plot showing deregulated circRNA expression comparing WT (CTRL) and SFPQ-KO mouse color-coded by circRNA subgroup as denoted. (E) Quantile plot showing 0.25, 0.5 (median), and 0.75 quantiles of the log2foldchange distribution between WT and SFPQ-KO for each circRNA subgroup (n/s; not significant, Wilcoxon rank sum test). (F) Barplot showing the fraction of circRNAs from each subgroup showing significant deregulation upon SFPQ knockout. p-Value calculated using the Fisher’s exact test. (G) Boxplot of SFPQ eCLIP enrichment (as in Figure 3J) in the 2000nt upstream (left) and downstream (right) flanking regions stratified by circRNAs subgroup (DALI, PASI, or other circRNAs) or by circRNAs deregulation (upregulated, unchanged, or downregulated). p-Values are calculated by Wilcoxon rank sum tests.
Figure 4 with 3 supplements
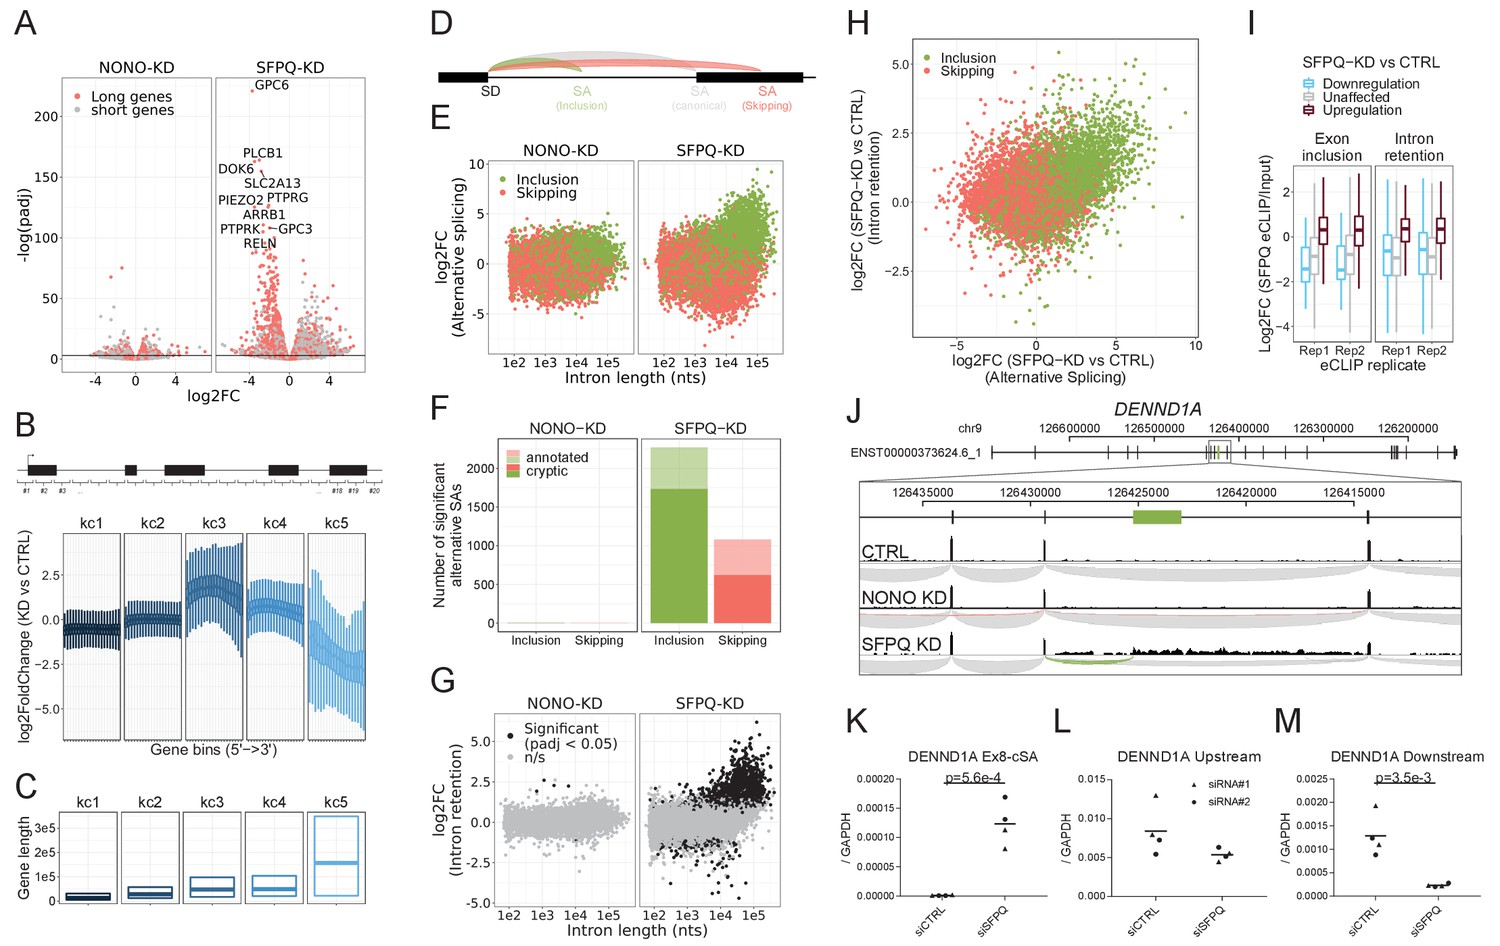
SFPQ ensures long-gene expression and suppresses cryptic splicing.
(A) Volcano plot depicting differential expression of annotated genes upon NONO or SFPQ KD compared to CTRL in HepG2 cells, stratified by median gene length into ‘long’ and ‘short’ genes as denoted. (B) Boxplot showing binned expression of clustered genes. Each gene is sliced into 20 equally sized bins, and the differential expression of each bin is determined and subgrouped into five k-means clusters (kc) (see Materials and methods). (C) Boxplot showing gene lengths distribution (0.25, 0.5 and 0.75 quantiles) stratified by clusters obtained in B. (D) Schematic representation of alternative splicing, where canonical (gray) denoted the most abundant splicing from the splice donor in question. Inclusion (green) and skipping (red) denotes an alternative splicing event shorter or longer than canonical, respectively. (E) Scatter plot showing alternative splicing in NONO and SFPQ depleted samples as a function of canonical intron length and color-coded by type of splicing either inclusion or skipping, see schematics in D. (F) Barplot with the number of unique alternative splicing events showing significant deregulation upon NONO and SFPQ depletion stratified by inclusion (green) and skipping (red), and whether the alternative SA site is annotated (transparent) or not (opaque). (G) Scatter plot showing effects on intron retention (IR) upon SFPQ and NONO depletion as a function of intron length, color-coded by significance (adjusted p-value<0.05) as denoted. (H) Scatterplot showing for each detectable intron the correlation between changes in exon-inclusion/skipping (red/green) and intron retention upon SFPQ depletion. (I) Boxplot showing the IP/Input enrichment of SFPQ eCLIP reads in introns harboring an exon inclusion or an intron retention event color-coded by whether the event is up or down (red or blue, respectively) or not significant (n/s, gray). (J) Schematic showing coordinates and full genic locus of DENND1A (top panel) and exon 8 and 9 with alternative, unannotated exon in-between (green, middle panel). Merged intron-spanning reads (lower panel) from CTRL, NONO-KD, and SFPQ-KD samples (HepG2) are shown and color-coded by splicing type; canonical (gray), inclusion (green), and skipping (red), see D. (K–M) RT-qPCR analysis of alternative splicing event (K), upstream expression (L) and downstream expression (M) relative to GAPDH mRNA using two different siRNA designs for each target. Data for four biological replicates are shown. p-Values are calculated using student’s two-tailed t-test.
Figure 4—figure supplement 1

Genic expression profile for selected long genes.
(A–D) Read coverage from HepG2 cells with either NONO- or SFPQ-depletion on DENND1A (A), GMDS (B), ATXN1 (C), and BAZ2B (D). The tracks are all depicted in the 5’–3’ direction and are composed of merged and normalized expression from all replicates/siRNA-designs.
Figure 4—figure supplement 2
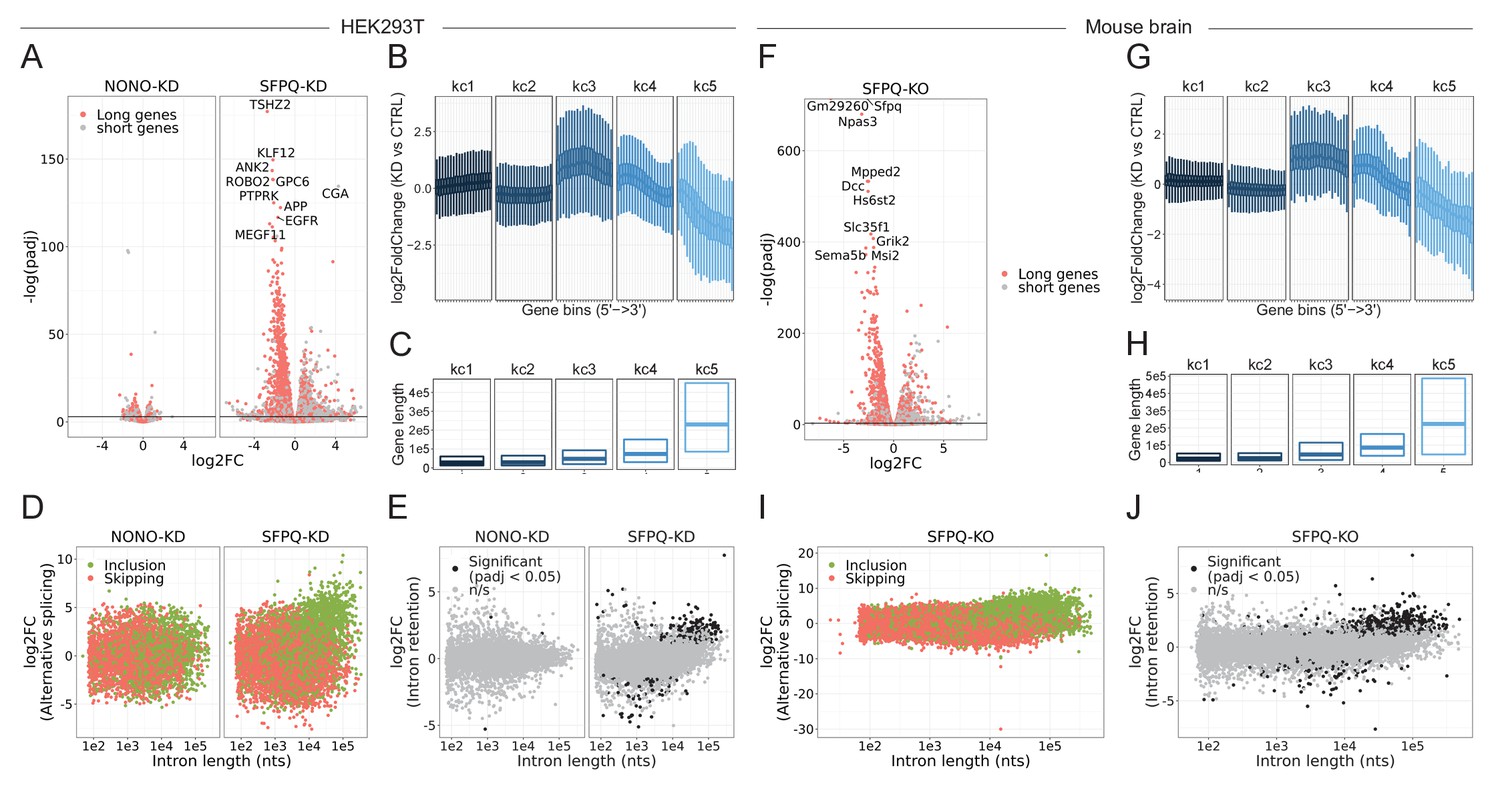
SFPQ ensures long-gene expression (HEK293T + MOUSE).
(A) Volcano plot stratified by genes higher or lower than median gene length, where length is the annotated distance from promoter to terminator. (B) Boxplot showing binned expression of clustered genes in SFPQ-depleted sampled relative to CTRL. Each gene is sliced into 20 bins, and the differential expression of each bin is determined and subgrouped into five kmeans clusters (see Materials and methods). (C) Boxplot showing gene lengths distribution stratified by clusters obtained in B. (D) Scatter plot showing alternative splicing in NONO and SFPQ-depleted samples as a function of canonical intron length and color-coded by type of splicing (either inclusion or skipping, see schematic in Figure 4H). (E) Scatter plot showing effects on retention upon SFPQ and NONO depletion as a function of intron length. (F–J) analyses as in A-E on mouse brain SFPQ knockout samples (GSE60246, see Supplementary file 5).
Figure 4—figure supplement 3
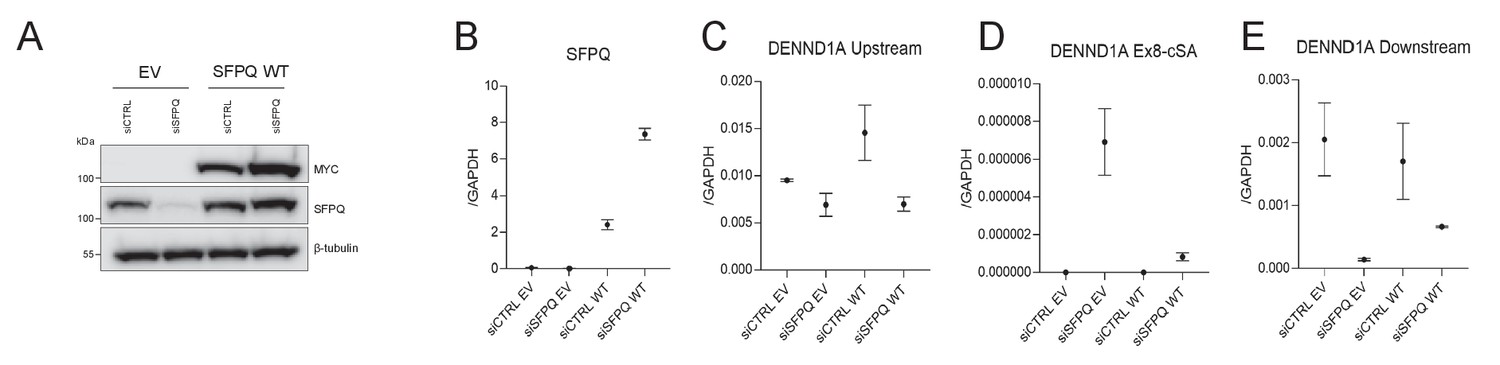
SFPQ co-expression rescue cryptic splicing.
(A) Western blot on HEK293T cells subjected to SFPQ knockdown combined with either empty vector (EV) or wild-type SFPQ (SFPQ WT) overexpression. The blot shows expression of myc-tagged ectopic SFPQ (upper panel), endogenous+ectopic SFPQ (middle panel) and β-tubulin as loading control (lower panel). (B–E) RT-qPCR on SFPQ mRNA (B) and three DENND1A loci (C-E, as in Figure 4K–M). The errorbars represent standard deviation from technical triplicates.
Figure 5 with 3 supplements
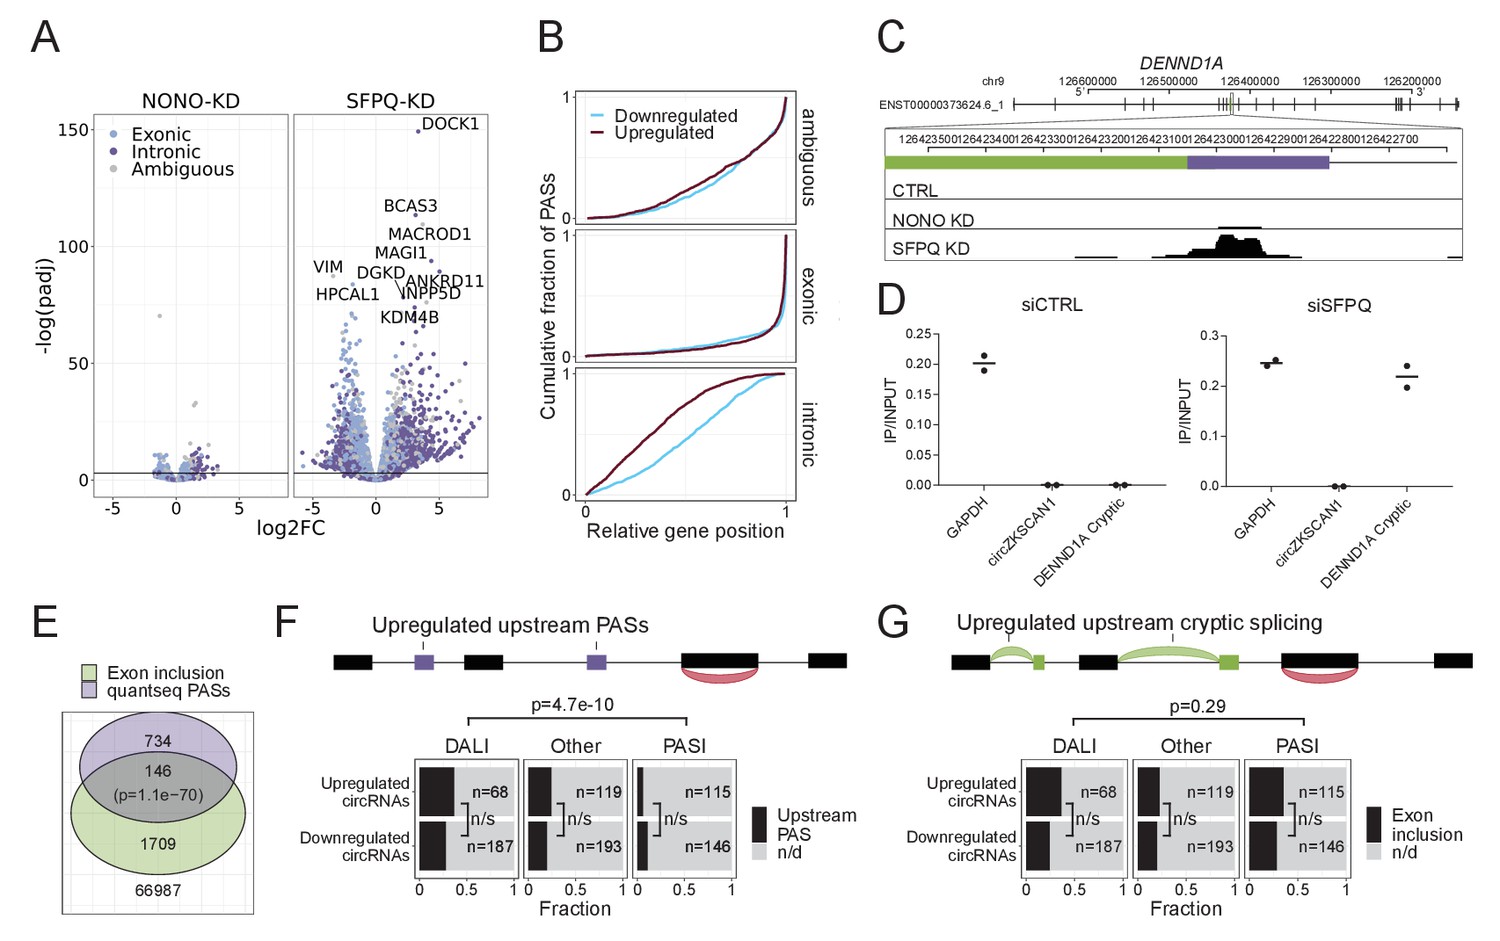
SFPQ depletion activates intronic polyA signal and premature termination.
(A) Volcano plot showing deregulated PAS usage as measured by quantseq upon NONO and SFPQ depletion in HEK293T cells. PAS signals are color-coded by their genic origin; intronic (dark blue), exonic (light blue), or ambiguous (gray). (B) Plot showing the cumulative fraction of PASs as a function of relative genic position stratified by genic origin (ambiguous, exonic or intronic, vertical facets) and color-coded by whether the PAS is significantly up (red) or downregulated (blue) upon SFPQ knockdown. (C) Schematic representation of the DENND1A exon 8–9 locus with alternative exon (green) and putative PAS element (purple). Below, merged quantseq coverage from each experiment. (D) RT-qPCR on input and oligo-dT purified RNA from control and SFPQ-depleted HEK293T cells using amplicons specific for GAPDH mRNA (positive control), circZKSCAN1 (negative control), and the alternative SFPQ-activated exon. Values reflect ratios between oligo-dT purified and input quantities. Data for two biological replicates are shown. (E) Venn diagrams showing the number of unique introns with co-occurring upregulation of PAS and upregulated alternative splicing. The number of expressed introns without any evidence of enriched PASs or alternative splicing is denoted below the diagram. P-values are calculated by Fisher’s exact test. (F–G) Schematic showing the outline of the analysis (upper panel): For each circRNA, the locus spanning from the promoter to the circRNA splice donor was interrogated for the presence of quantseq PASs (F) or exon inclusion (G). Barplot (lower panel) showing the fraction of upregulated and downregulated circRNAs upon SFPQ depletion in HEK293T cells with evidence of a concomitant upregulated upstream PAS (F) or an upstream exon inclusion event (G). Numbers indicate the total number of circRNAs in each group. p-Values are calculated by Fisher’s exact test.
Figure 5—figure supplement 1
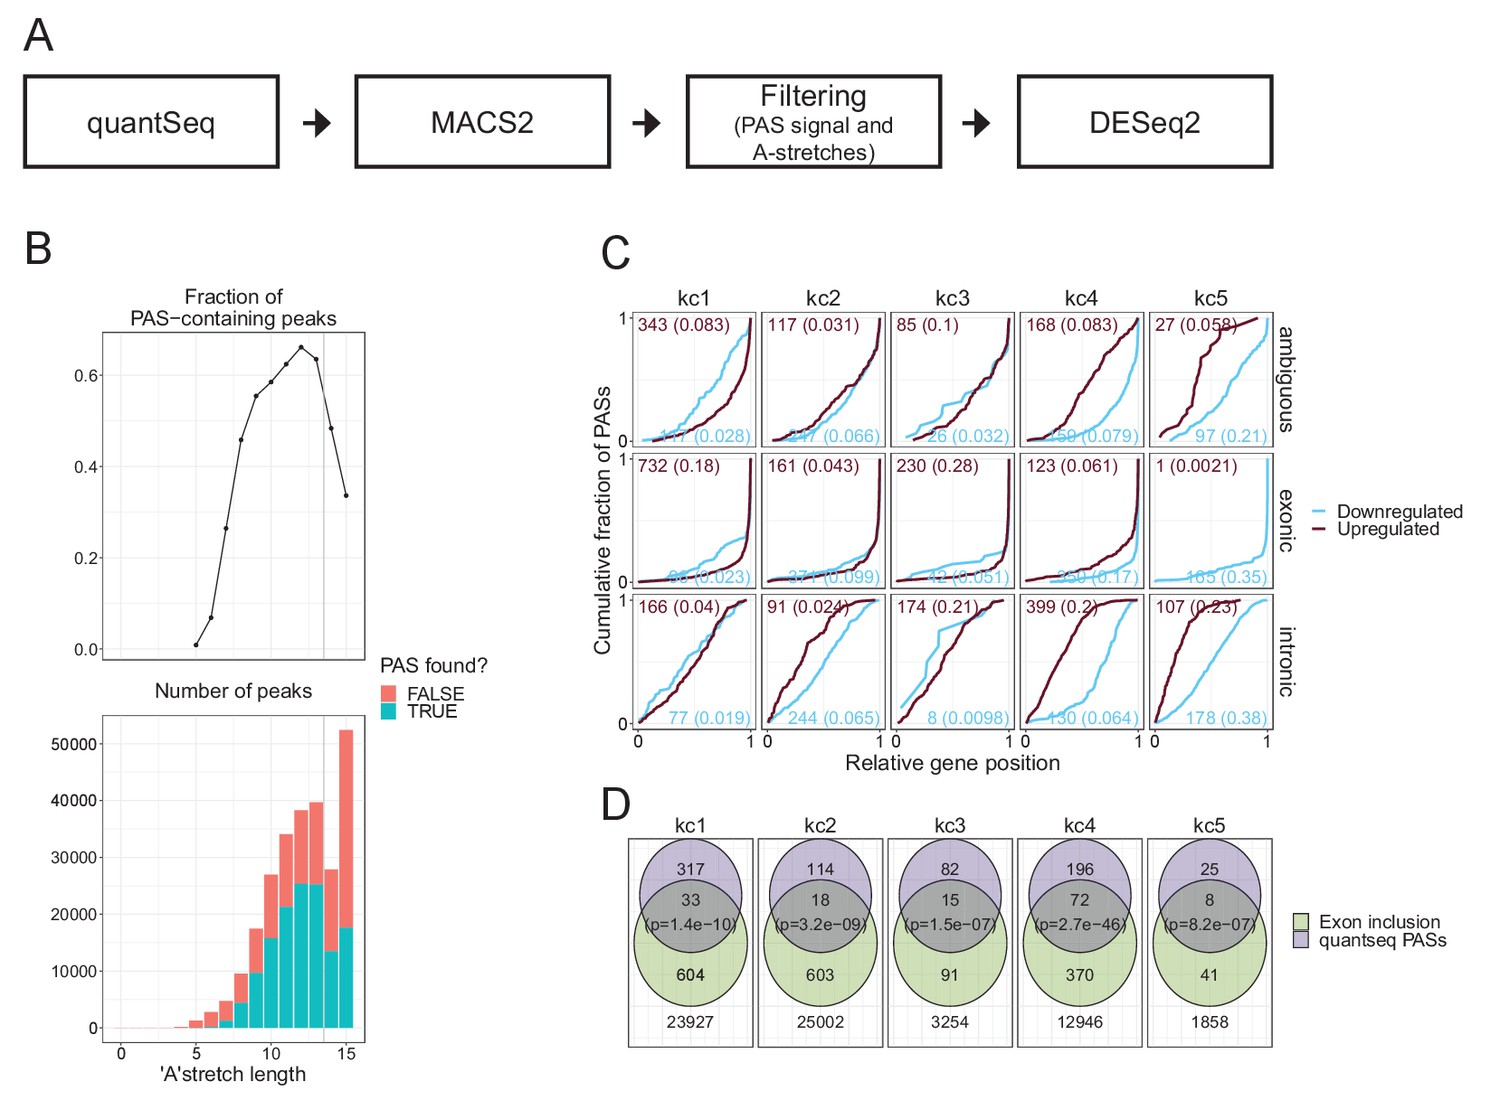
Quantseq analysis.
(A) Schematics depicting the quantseq workflow (B) Top: characterization of the fraction of PAS-containing peaks, where PAS is defined as AAUAAA or AUUAAA, as a function of longest oligo-A stretch identified in peak +/- 50 nt flanking region. Bottom: Total number of peaks identified with (green) or without (orange) PAS as a function of longest A-stretch. (C) Venn diagrams (as in Figure 5E) showing overlapping quantseq PASs and cryptic splicing but stratified into the five kmeans clusters. (D) Relative quantseq PAS position within annotated genes (as in Figure 5B) but stratified by kmeans clusters. Numbers denote the number of peaks in each group and the fraction of genes with significant deregulated peaks in parenthesis.
Figure 5—figure supplement 2
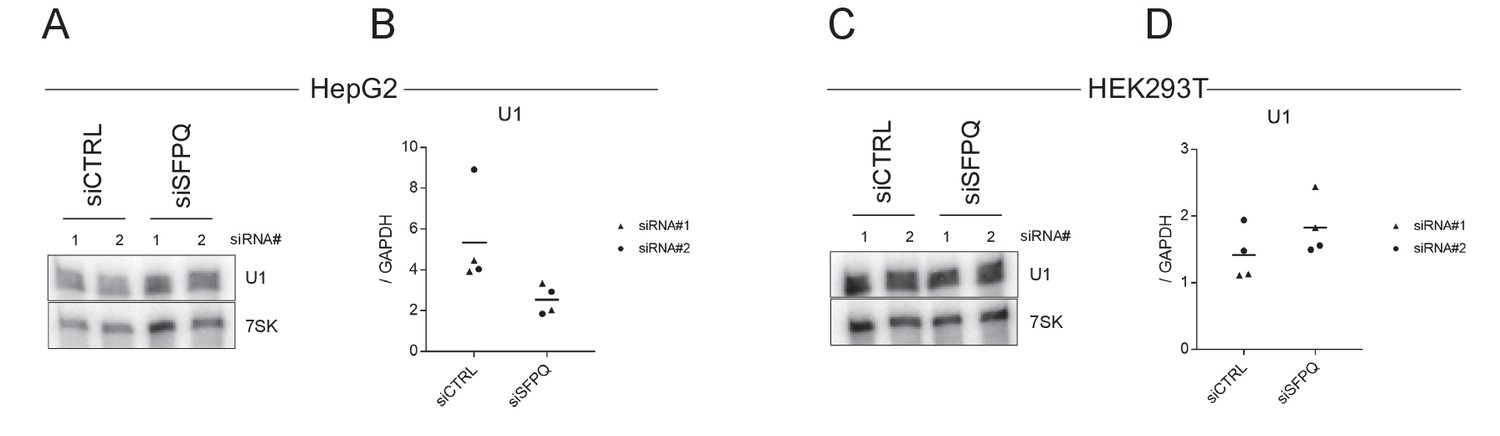
U1 snRNA abundance upon SFPQ knockdown.
(A) PAGE northern blot on U1 levels (upper panel) upon CTRL or SFPQ depletion in HepG2 cells using two different siRNA designs as denoted. 7SK (lower panel) is used as a loading control. (B) Abundance of U1 snRNA measured by RT-qPCR relative to GAPDH. Triangles and circles, as denoted, represent the two different siRNA designs. (C–D) as in A-B, but using HEK293T cells.
Figure 5—figure supplement 3
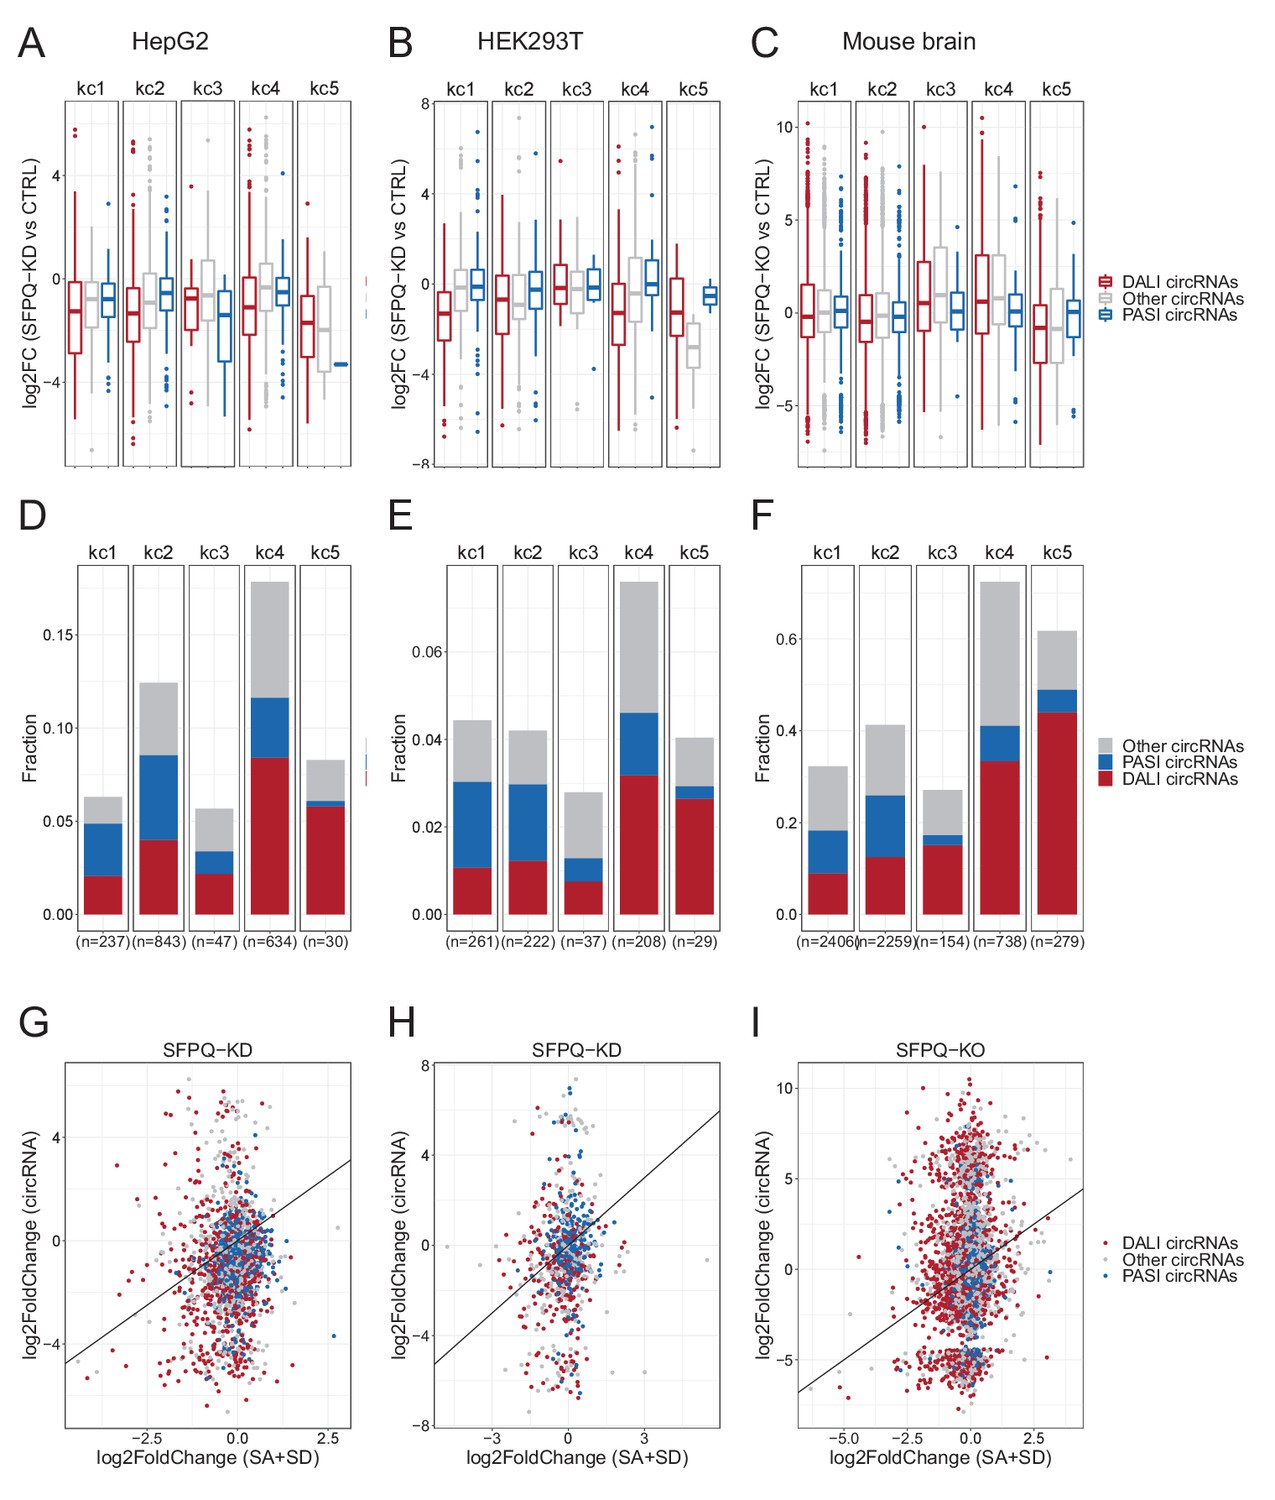
circRNAs in kmeans clusters.
(A–C) For each kmean cluster, boxplots showing the log2FoldChange of circRNAs expression upon SFPQ depletion in HepG2 (A), HEK293T (B) cells, and mouse brain (C) stratified by circRNAs subgroup. (D–F) Barplot of numbers and fraction of circRNAs in each kmean cluster in HepG2 (D), HEK293T (E) cells, and mouse brain (F). The fraction is determined by the number of genes hosting circRNAs relative to the total number of genes in each cluster. (G–I) Scatterplot relating the circRNA deregulation (log2FC) with the deregulation of host-gene linear splicing for HepG2 (G), HEK293T (H) cells, and mouse brain (I) colorcoded by circRNAs subgroup. The diagonal line represents the perfect correlation.
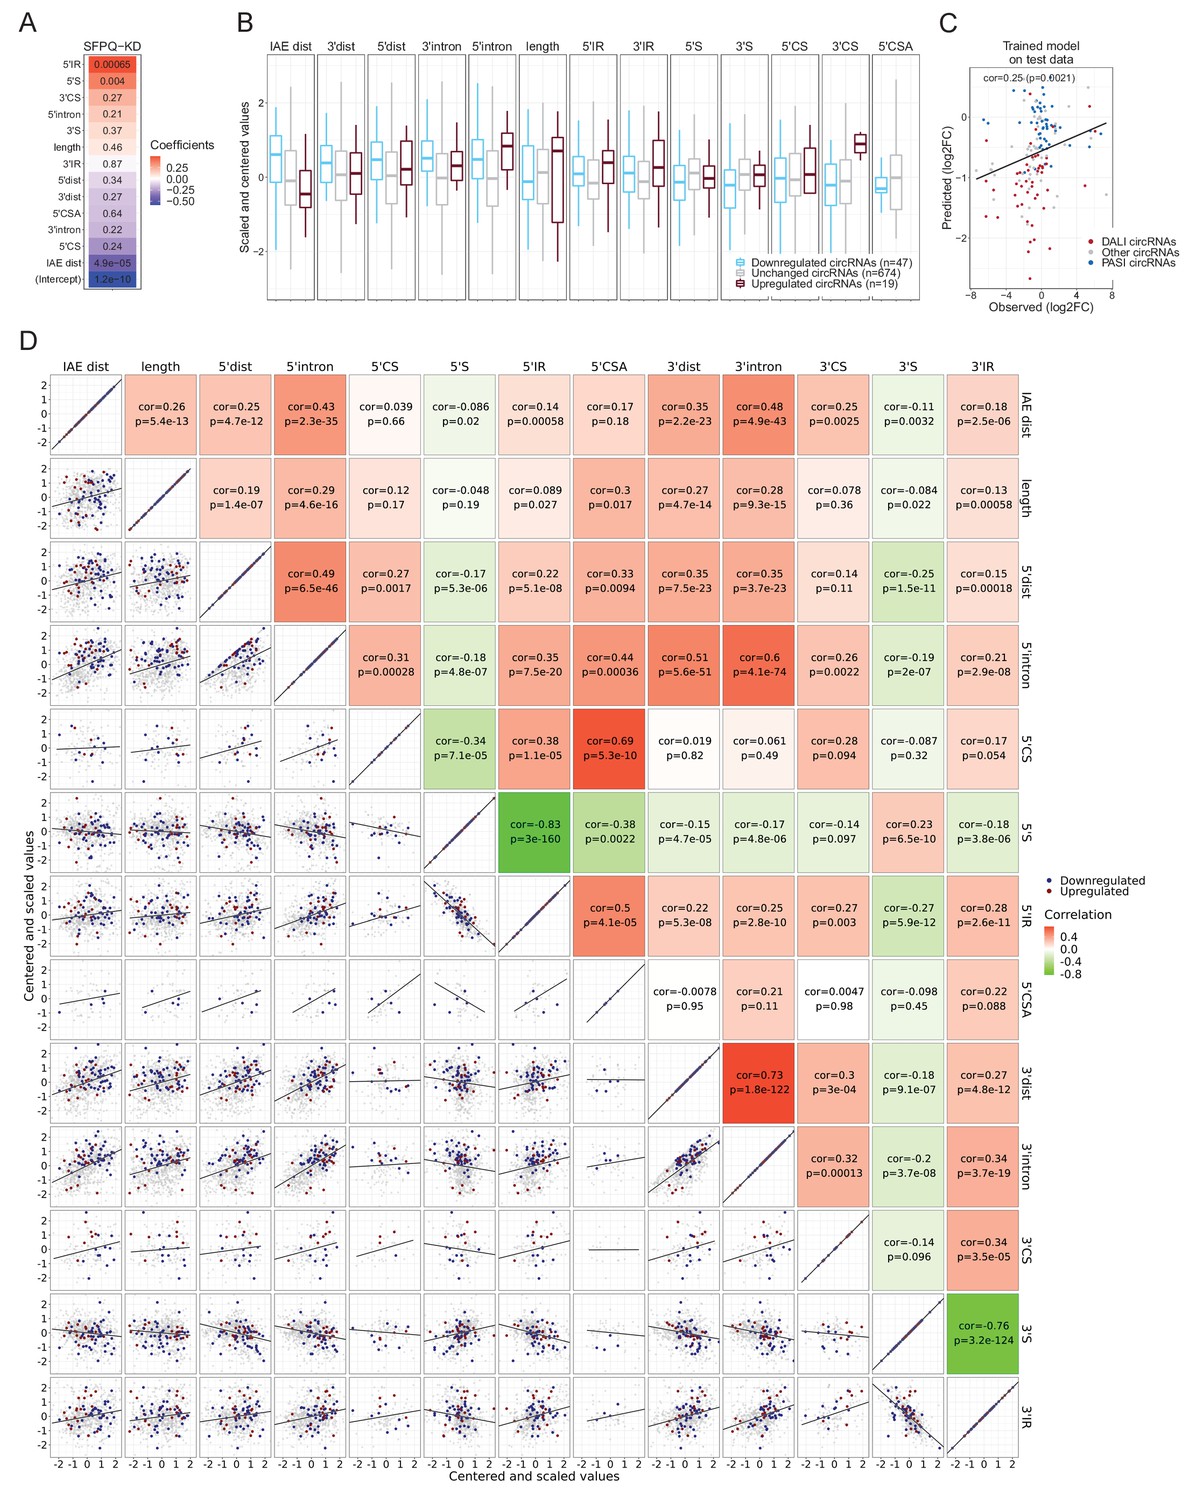
Figure 6 with 4 supplements
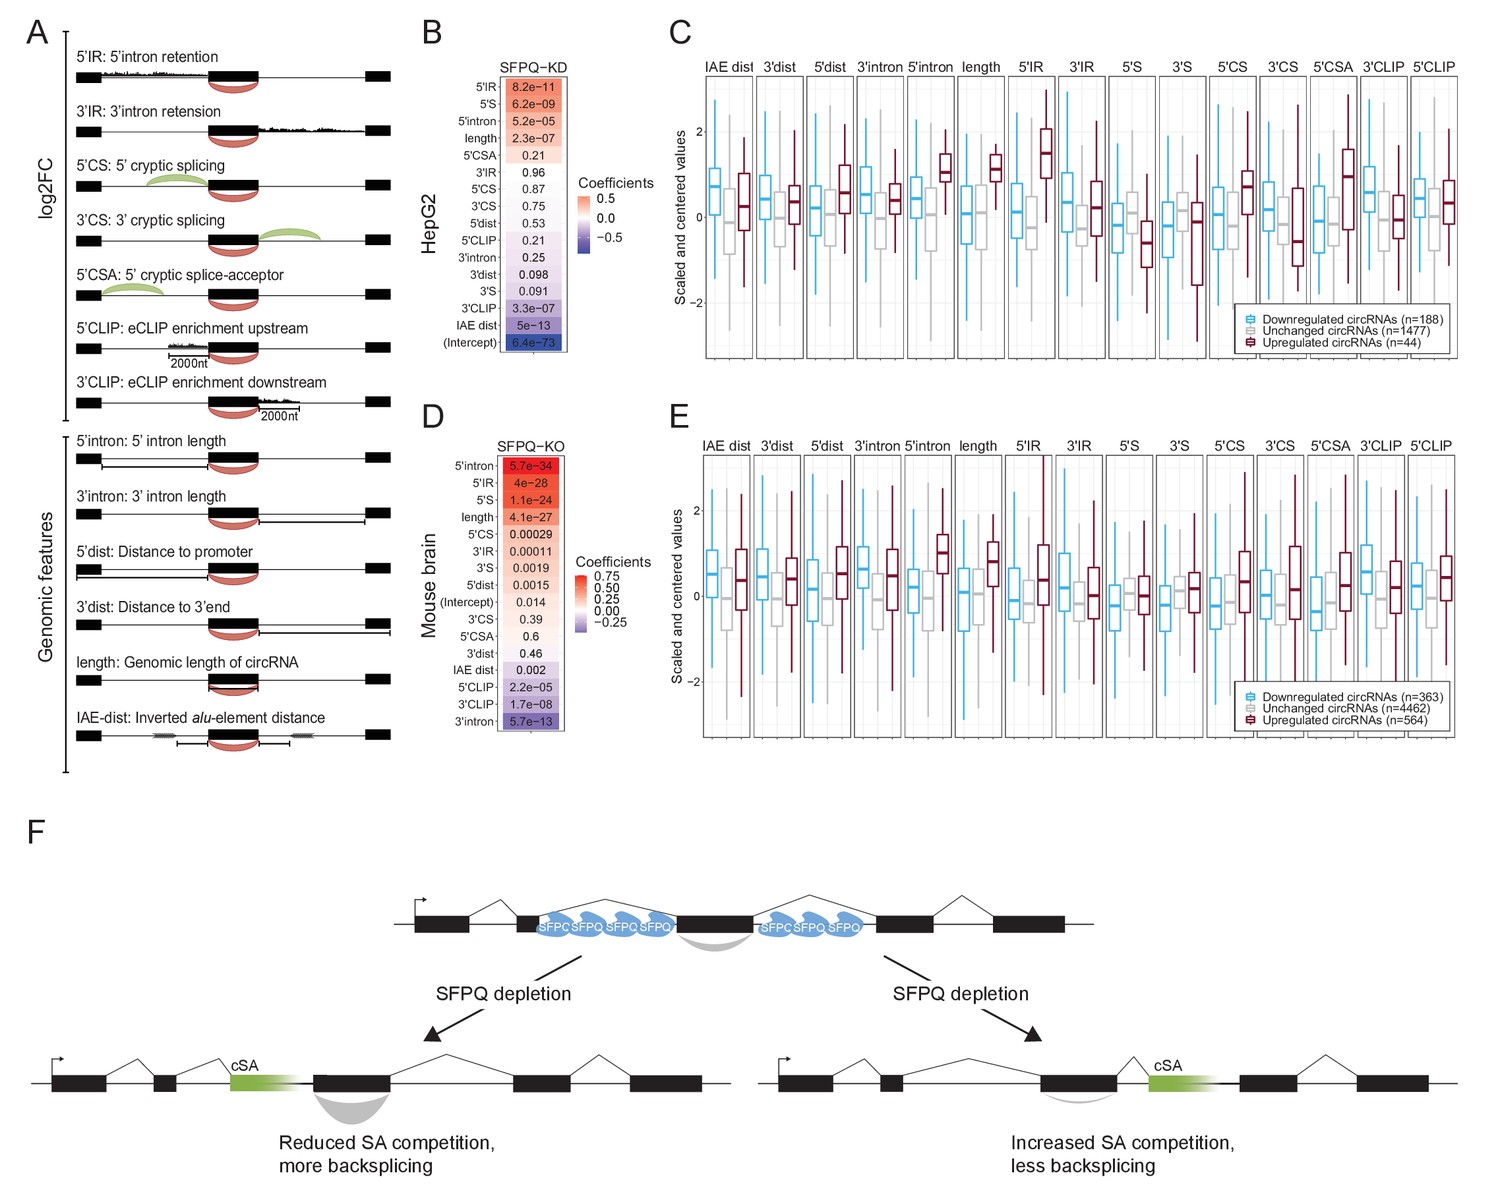
Multiple features contribute to circRNA regulation by SFPQ.
(A) Schematic representation of features used in analysis. (B) Heatmap showing the feature coefficients from modeling circRNA deregulation (log2FoldChange) upon SFPQ depletion in HepG2 cells. The numbers within the heatmap are the associated p-values. (C) Boxplot showing the centered and scaled feature-values for significant up (red), significant down (blue), and unchanged (gray) circRNAs in HepG2. (D–E) as in B and C using mouse brain data. (F) Schematic depicting the SFPQ-mediated regulation of circRNA expression. Upon SFPQ knockdown, usage of cryptic splice acceptor sites (cSA) is induced, particularly within long introns. For upstream cSA inclusion (left scenario), the adjacent circRNA is upregulated possibly due to reduced competition with backsplicing, whereas for downstream cSA inclusion (right scenario), the circRNA is repressed due to increased competition with backsplicing,.
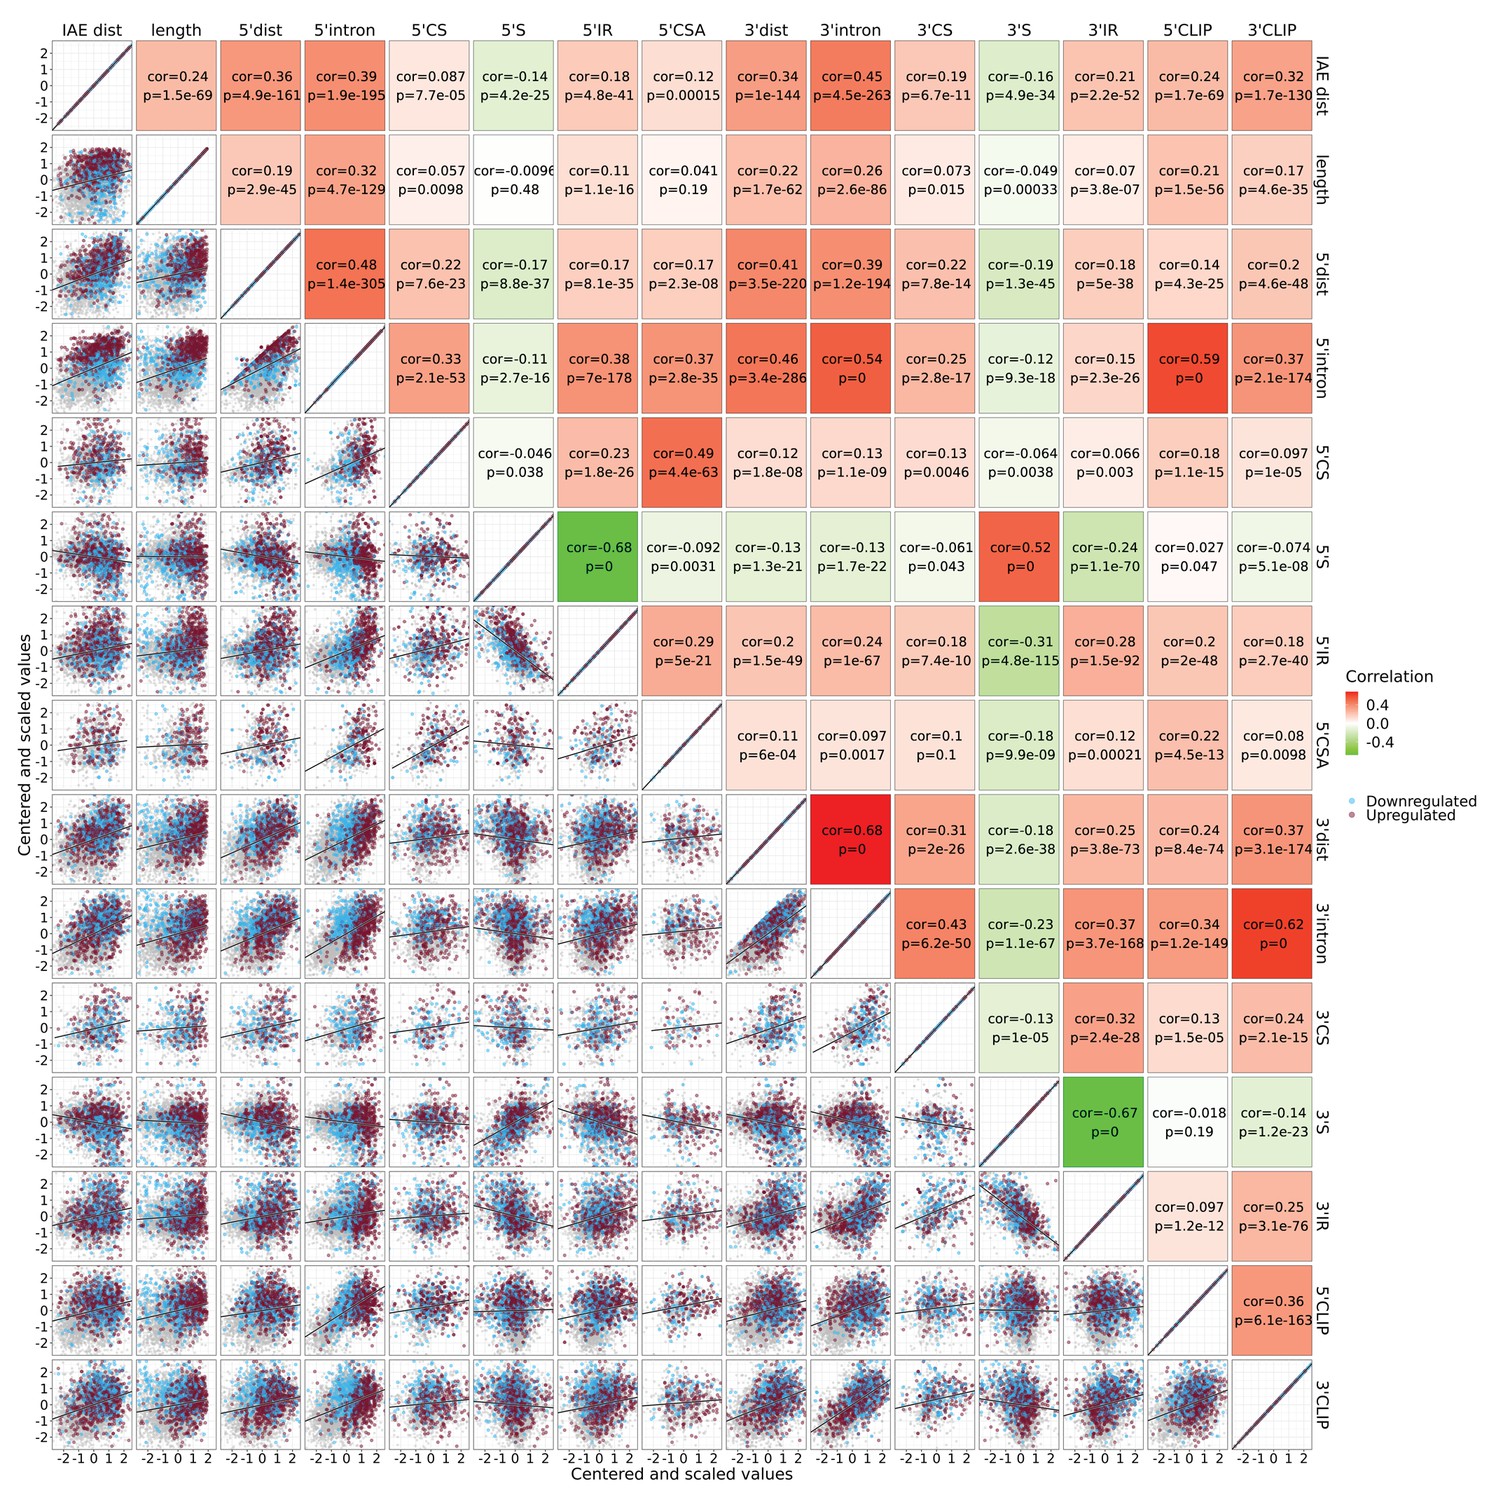
Figure 6—figure supplement 1

HepG2 features.
Bottom-left; Correlation matrix showing for each pair of features the correlation between standardized (centered and scaled) values. The points are color-coded by circRNA regulations, each significant up (red), significant down (blue), or unchanged (gray). Top-right; the correlation values (based on Pearson correlation) and corresponding p-values are shown. The tiles are color-coded by the correlation values.
Figure 6—figure supplement 2
Mouse brain features.
As in Figure 6—figure supplement 1, but with features from mouse brain data.
Figure 6—figure supplement 3
HEK293T features and GLM model performance.
(A) As in Figure 6, heatmap showing feature coefficients. (B) Boxplot showing the standardized feature values for up, down and unchanged circRNAs. (C) Model prediction compared to observed log2FC on the 20% test-set. (D) Correlation matrix as in Figure 6—figure supplement 1.
Figure 6—figure supplement 4
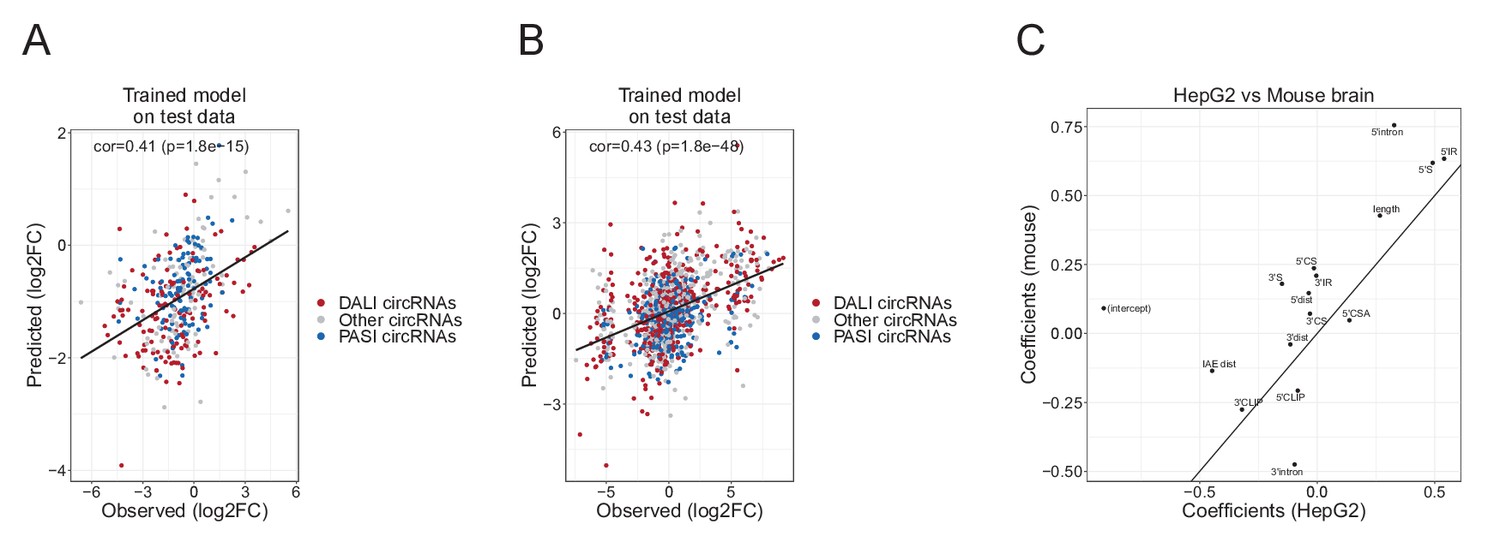
GLM model performance.
(A–B) Scatterplot showing the correlation between observed and predicted log2foldchange values on test-set using GLM model in HepG2 (A) and mouse brain (B). The Pearson correlation and corresponding p-value is denoted in the top-left corner. (C) Scatterplot showing the correlation between GLM coefficients obtain in HepG2 and mouse brain regression analyses.
Tables
Key resources table
| Reagent type (species) or resource | Designation | Source or reference | Identifiers | Additional information |
|---|---|---|---|---|
| Cell line (Homo sapiens) | HEK293T | Invitrogen | N/A | |
| Cell line (Homo sapiens) | HepG2 | ATCC | RRID:CVCL_0027 | |
| Transfected construct (human) | pcDNA3- Myc-SFPQ | Genscript | This paper | Transfected construct |
| Transfected construct (human) | pcDNA3-Empty Vector | Invitrogen | N/A | Transfected construct |
| Antibody | Anti-SFPQ antibody (Polyclonal, Rabbit) | Abcam | RRID:AB_882523 | WB (1:5,000) |
| Antibody | Anti-nmt55/ p54nrb antibody (Polyclonal, Rabbit) | Abcam | RRID:AB_1269576 | WB (1:20,000) IP (2.5 µg) |
| Antibody | Anti-SFPQ antibody (Monoclonal, Mouse) | Sigma | RRID:AB_260995 | IP (2.5 µg) |
| Antibody | Anti-FLAG antibody (Monoclonal, Mouse) | Sigma | RRID:AB_262044 | IP (2.5 µg) |
| Antibody | Anti-beta Tubulin (Monoclonal, Mouse) | Millipore | RRID:AB_309885 | WB (1:2,000) |
| Antibody | Anti-MYC (Polyclonal, Rabbit) | Sigma | RRID:AB_439694 | WB (1:5,000) |
| Antibody | Anti-Histone H3 antibody (Monoclonal, Rabbit) | Abcam | RRID:AB_302613 | WB (1:1,000) |
| Antibody | Anti-Rabbit antibody (Polyclonal, Goat) | Dako | RRID:AB_2617138 | WB (1:5,000) |
| Antibody | Anti-Mouse antibody (Polyclonal, Goat) | Dako | RRID:AB_2617137 | WB (1:5,000) |
| Sequenced-based reagent | GAPDH FW | This paper | qPCR Primer | GTCAGCCGCATCTTCTTTTG |
| Sequenced-based reagent | GAPDH RE | This paper | qPCR Primer | GCGCCCAATACGACCAAATC |
| Sequenced-based reagent | SFPQ FW | This paper | qPCR Primer | ACAGGGAAAGGCATTGTTGA |
| Sequenced-based reagent | SFPQ RE | This paper | qPCR Primer | TCATCTAGTTGTTCAAGTGGTTCC |
| Sequenced-based reagent | NONO FW | This paper | qPCR Primer | TGATGAAGAGGGACTTCCAGA |
| Sequenced-based reagent | NONO RE | This paper | qPCR Primer | AGCGCATGGCATATTCATACT |
| Sequenced-based reagent | CDYL FW | This paper | qPCR Primer | ACCCACTAGTGCCTCAGGTG |
| Sequenced-based reagent | CDYL lin RE | This paper | qPCR Primer | ATTTCCTTTTGCTGGCAGTC |
| Sequenced-based reagent | CDYL circ RE | This paper | qPCR Primer | CTCGCTGTCATAGCCTTTCC |
| Sequenced-based reagent | ZKSCAN1 FW | This paper | qPCR Primer | CCCAGTCCCACTTCAAACAT |
| Sequenced-based reagent | ZKSCAN1 lin RE | This paper | qPCR Primer | TCCGCTGTGAATAGTGCAGA |
| Sequenced-based reagent | ZKSCAN1 circ RE | This paper | qPCR Primer | TCATTCAGGCTCCAGGAACT |
| Sequenced-based reagent | NEIL3 FW | This paper | qPCR Primer | CAGCCCAATACTCATCACCA |
| Sequenced-based reagent | NEIL3 lin RE | This paper | qPCR Primer | GAGGCGGTTGTGTTTACTGC |
| Sequenced-based reagent | NEIL3 circ RE | This paper | qPCR Primer | CGGGTACTTCATTAAGTGGCTAA |
| Sequenced-based reagent | EYA1 FW | This paper | qPCR Primer | CCAATGCCACTTACCAGCTT |
| Sequenced-based reagent | EYA1 lin RE | This paper | qPCR Primer | TACTGCTCCCAATTGCTGAA |
| Sequenced-based reagent | EYA1 circ RE | This paper | qPCR Primer | TTTCCCATCTGAACCTCGAC |
| Sequenced-based reagent | ARHGAP5 lin FW | This paper | qPCR Primer | CGTGTCAGCGGGAATAAAACT |
| Sequenced-based reagent | ARHGAP5 lin RE | This paper | qPCR Primer | TGGAATTAAAGGATCTGGCAGA |
| Sequenced-based reagent | ARHGAP5 circ Fw | This paper | qPCR Primer | CCTGCAATCACTTCTGACCA |
| Sequenced-based reagent | ARHGAP5 circ RE | This paper | qPCR Primer | TTTGGTTCTTTGTATTTCCCTCA |
| Sequenced-based reagent | DENND1A Upstream FW | This paper | qPCR Primer | CCAAGTTTTGTTTCCCCTTC |
| Sequenced-based reagent | DENND1A Upstream RE | This paper | qPCR Primer | AGAAGCAGCTCTTCGCTCCT |
| Sequenced-based reagent | DENND1A Ex8 FW | This paper | qPCR Primer | ACCAGAGAACTTCCCAGCAT |
| Sequenced-based reagent | DENND1A cSA RE | This paper | qPCR Primer | TGGGAGAGGGGAAATATGTG |
| Sequenced-based reagent | DENND1A Downstream FW | This paper | qPCR Primer | AAGAGCAGCTGCCAAAGACT |
| Sequenced-based reagent | DENND1A Downstream RE | This paper | qPCR Primer | GCGATGTTGCTCTTTGGTCT |
| Sequenced-based reagent | circARHGAP5 intronic Ups Fw | This paper | qPCR Primer | ATGGAATCATTGTGCTTTTC |
| Sequenced-based reagent | circARHGAP5 intronic Ups Re | This paper | qPCR Primer | AATCTTAATCTGGCCCAACTGA |
| Sequenced-based reagent | circARHGAP5 intronic Ds Fw | This paper | qPCR Primer | GGCTAAAAGCTGATTATTTGAAAAG |
| Sequenced-based reagent | circARHGAP5 intronic Ds Re | This paper | qPCR Primer | TACATTTTTCCAGGACTTTGTTCAT |
| Sequenced-based reagent | ARHGAP5 exon five intronic Ups Fw | This paper | qPCR Primer | TGTGGCTAAAACAGGGTGTG |
| Sequenced-based reagent | ARHGAP5 exon five intronic Ups Re | This paper | qPCR Primer | AGGCACCTACAACCAACAGC |
| Sequenced-based reagent | ARHGAP5 exon five intronic Ds Fw | This paper | qPCR Primer | AATGCTGGGTCACTTTGGTC |
| Sequenced-based reagent | ARHGAP5 exon five intronic Ds Re | This paper | qPCR Primer | CAGCCTGGTTCCTAACAAGC |
| Sequenced-based reagent | circCDYL intronic Ups Fw | This paper | qPCR Primer | TTTTGTCTTTGTTTAATGCCATTTC |
| Sequenced-based reagent | circCDYL intronic Ups Re | This paper | qPCR Primer | GGCCAGACTGAGTATACATAAGGAA |
| Sequenced-based reagent | circCDYL intronic Ds Fw | This paper | qPCR Primer | TGACCTGCAAGCTCAGAATGG |
| Sequenced-based reagent | circCDYL intronic Ds Re | This paper | qPCR Primer | GGATTGGTGGTGGAAGTAAAT |
| Sequenced-based reagent | CDYL exon seven intronic Ups Fw | This paper | qPCR Primer | CTGGTTCCTTGTGCCTTGAT |
| Sequenced-based reagent | CDYL exon seven intronic Ups Re | This paper | qPCR Primer | TTTTCAGGGAATGGAACTG |
| Sequenced-based reagent | CDYL exon seven intronic Ds Fw | This paper | qPCR Primer | CCTGCTCCTCACCTTCTCAC |
| Sequenced-based reagent | CDYL exon seven intronic Ds Re | This paper | qPCR Primer | GTGCTGCTTGTTCCTCTCCT |
| Sequenced-based reagent | circNEIL3 intronic Ups Fw | This paper | qPCR Primer | TTCGAGGCTGCAGTGAACTA |
| Sequenced-based reagent | circNEIL3 intronic Ups Re | This paper | qPCR Primer | TTGCCTTGTTCTTGTCTGGA |
| Sequenced-based reagent | circNEIL3 intronic Ds Fw | This paper | qPCR Primer | CGATCCAAGGTTGGTTGAAT |
| Sequenced-based reagent | circNEIL3 intronic Ds Re | This paper | qPCR Primer | TTTACACCAAATGGTCCCTCA |
| Sequenced-based reagent | NEIL3 exon five intronic Ups Fw | This paper | qPCR Primer | TACCCAAATCAGTAGGAATGAAGC |
| Sequenced-based reagent | NEIL3 exon five intronic Ups Re | This paper | qPCR Primer | CATACTGAACTCACGTGTTCCAA |
| Sequenced-based reagent | NEIL3 exon five intronic Ds Fw | This paper | qPCR Primer | AACCTGAGGGAGCCAAAGAT |
| Sequenced-based reagent | NEIL3 exon five intronic Ds Re | This paper | qPCR Primer | TGAAGCAGAGACTTTTGAAGG |
| Sequenced-based reagent | circZKSCAN1 intronic Ups Fw | This paper | qPCR Primer | ATGGCCAAGCTGGTCTTGAACTCC |
| Sequenced-based reagent | circZKSCAN1 intronic Ups Re | This paper | qPCR Primer | CAGGAACAGCTGTATGAAATGG |
| Sequenced-based reagent | circZKSCAN1 intronic Ds Fw | This paper | qPCR Primer | TGGAACACTTAACCATGACTGG |
| Sequenced-based reagent | circZKSCAN1 intronic Ds Re | This paper | qPCR Primer | CCATGCCTGGCTGATTTATTAT |
| Sequenced-based reagent | ZKSCAN1 exon four intronic Ups Fw | This paper | qPCR Primer | GCAACAGAGGGAGATGCTG |
| Sequenced-based reagent | ZKSCAN1 exon four intronic Ups Re | This paper | qPCR Primer | GTGTGTGCCAGGATCTTTGA |
| Sequenced-based reagent | ZKSCAN1 exon four intronic Ds Fw | This paper | qPCR Primer | GAAAACTCACAGAATTGGAGAAA |
| Sequenced-based reagent | ZKSCAN1 exon four intronic Ds Re | This paper | qPCR Primer | GGAGCCTTCAGAGGTCACAG |
| Sequenced-based reagent | circEYA1 intronic Ups Fw | This paper | qPCR Primer | CGGTCCATGGTTTTAAGAGTGA |
| Sequenced-based reagent | circEYA1 intronic Ups Re | This paper | qPCR Primer | TGCAACACAAGAAAGGCTGA |
| Sequenced-based reagent | circEYA1 intronic Ds Fw | This paper | qPCR Primer | AGCCTTGTTGTGGAGTAGCT |
| Sequenced-based reagent | circEYA1 intronic Ds Re | This paper | qPCR Primer | TCTTGTTTCCCATGCACACA |
| Sequenced-based reagent | EYA1 exon 12 intronic Ups Fw | This paper | qPCR Primer | CAGATTCTATTTTTGGCATGAGG |
| Sequenced-based reagent | EYA1 exon 12 intronic Ups Re | This paper | qPCR Primer | GGGCAAGTAAACAATTTCCAA |
| Sequenced-based reagent | EYA1 exon 12 intronic Ds Fw | This paper | qPCR Primer | CTCCCATCTCCCACCCTTTC |
| Sequenced-based reagent | EYA1 exon 12 intronic Ds Re | This paper | qPCR Primer | TCTCATCGAGCCTGGTTTGT |
| Sequenced-based reagent | U1 Fw | This paper | qPCR Primer | GCTTATCCATTGCACTCCGG |
| Sequenced-based reagent | U1 Re | This paper | qPCR Primer | CCCCACTACCACAAATTATGCA |
| Sequenced-based reagent | U1 | This paper | Northern blot Probe | ACAAATTATGCAGTCGAGTTTCCCACATTTGGGGAAATCGCAGGGGTCAGCACATCCGGA |
| Sequenced-based reagent | 7SK | This paper | Northern blot Probe | TACTCGTATACCCTTGACCGAAGACCGGTCCTCCTCTATCGGGGATGGTC |
| Sequenced-based reagent | SFPQ siRNA #1 | Merck | SASI_Hs01_00073164 | Sense strand: GUACGAAUAUUCUCAGCGA[dT][dT] Antisense strand: UCGCUGAGAAUAUUCGUAC[dT][dT] |
| Sequenced-based reagent | SFPQ siRNA #2 | Merck | SASI_Hs01_00073165 | Sense strand: GGAAGAUGCCUAUCAUGAA[dT][dT] Antisense strand: UUCAUGAUAGGCAUCUUCC[dT][dT] |
| Sequenced-based reagent | NONO siRNA #1 | Merck | SASI_Hs02_00343478 | Sense strand: GAUGGAAGCUGCACGCCAU[dT][dT] Antisense strand: AUGGCGUGCAGCUUCCAUC[dT][dT] |
| Sequenced-based reagent | NONO siRNA #2 | Merck | SASI_Hs02_00343479 | Sense strand: CUCAGUAUGUGUCCAACGA[dT][dT] Antisense strand: UCGUUGGACACAUACUGAG[dT][dT] |
| Sequenced-based reagent | CTRL siRNA #1 | Merck | CAT#SIC001 | MISSION-siRNA Universal Negative Control #1 |
| Sequenced-based reagent | CTRL siRNA #2 | RiboTask | Targets eGFP Sense strand: GACGUAAACGGCCACAAGUUC Antisense strand: ACUUGUGGCCGUUUACGUCGC | |
| Commercial assay or kit | DNase I, RNase-free (1 U/µL) | Thermo Fisher Scientific | CAT# EN0521 | DNase Treatment |
| Commercial assay or kit | M-MLV Reverse Transcriptase kit | Thermo Fisher Scientific | CAT# 28025013 | Reverse trancription |
| Commercial assay or kit | NEBNext Poly(A) mRNA Magnetic Isolation Module | New England BioLabs Inc | CAT# E7490S | PolyA RNA selection |
| Commercial assay or kit | RiboCop rRNA Depletion Kit V1.2 | Lexogen | CAT# 037.24 | RNA ribodepletion |
| Commercial assay or kit | SENSE Total RNA-Seq Library Prep Kit | Lexogen | CAT# 009.24 | HEK293T RNA library preparation for total RNA sequencing |
| Commercial assay or kit | QuantSeq 3’ mRNA-Seq Library Prep Kit | Lexogen | CAT# 038.24 | HEK293T RNA library preparation for 3’end RNA sequencing |
| Chemical compound, drug | Lipofectamine 2000 | Thermo Fisher Scientific | CAT# 12566014 | Transfection HEK293T and HepG2 |
| Chemical compound, drug | Lipofectamine RNAiMAX | Thermo Fisher Scientific | CAT# 13778150 | Transfection HepG2 |
| Chemical compound, drug | SiLentFect Lipid Reagent | Bio-Rad | CAT# 1703361 | Transfection HEK293T |
| Software, algorithm | GraphPad | Prism7 | RRID:SCR_002798 | |
| Software, algorithm | R | R Project for statistical computing | RRID:SCR_001905 | |
| Software, algorithm | Typhoon FLA 9500 | GE Healthcare | V. 1.1.0.187 | Northern blot |
| Software, algorithm | Image Studio | Licor Odyssey Fc | Ver 5.2 | Western blot |
| Software, algorithm | DESeq2, v1.24.0 | Love et al., 2014 | RRID:SCR_015687 | |
| Software, algorithm | STAR, v2.7, | Dobin et al., 2013 | N/A | |
| Software, algorithm | featureCounts, v2.0.0 | Liao et al., 2014 | RRID:SCR_012919 | |
| Software, algorithm | ciri2 | Gao et al., 2015 | N/A | |
| Software, algorithm | find_circ v1.2 | https://github.com/marvin-jens/find_circ | N/A | |
| Software, algorithm | annotate_circ.py | This paper, github/ncrnalab/pyutils | N/A | |
| Software, algorithm | RepeatMasker | UCSC Genome Browser | RRID:SCR_012954 | |
| Software, algorithm | liftOver tool | UCSC genome browser | RRID:SCR_018160 | |
| Software, algorithm | get_flanking spliced_reads.py | This paper, github/ncrnalab/pyutils | N/A | |
| Software, algorithm | get_spliced_reads.py | This paper, github/ncrnalab/pyutils | N/A | |
| Software, algorithm | get_alternative_splicing.py | This paper, github/ncrnalab/pyutils | N/A | |
| Software, algorithm | MACS2 peakcall, v2.2.6 | https://github.com/macs3-project/MACS | RRID:SCR_013291 | |
| Other | Dynabeads Protein A | Thermo Fisher Scientific | CAT# 10001D | RIP |
| Other | Dynabeads Protein G | Thermo Fisher Scientific | CAT# 10003D | RIP |
| Other | TRIzol Reagent | Thermo Fisher Scientific | CAT# 15596018 | RNA Extraction |
| Other | Platinum SYBR Green I Master kit | Thermo Fisher Scientific | CAT# 11733046 | qPCR assay |
| Other | 10% Tris-Glycine SDS-PAGE gel | Thermo Fisher Scientific | CAT# XP00102BOX | Western blot |
| Other | Immobilon-P Transfer Membrane | EMD Millipore | CAT# IPVH85R | Western blot |
| Other | SuperSignal West Femto Maximum Sensitivity Substrate kit | Thermo Fisher Scientific | CAT# 34095 | Western blot |
| Other | Amersham Hyperfilm ECL | GE Healthcare | N/A | Western blot |
| Other | Medical film | MG-SR plus, Konica Minolta | N/A | Western blot |
Additional files
-
Supplementary file 1
ENCODE RNAseq.
List of ENCODE dataset accession numbers used in RNAseq analysis.
- https://cdn.elifesciences.org/articles/63088/elife-63088-supp1-v1.xlsx
-
Supplementary file 2
ENCODE eCLIP.
List of ENCODE dataset accession numbers used in eCLIP analysis.
- https://cdn.elifesciences.org/articles/63088/elife-63088-supp2-v1.xlsx
-
Supplementary file 3
HEK293T RNAseq.
Mapping statistics and annotated output from featureCounts, ciri2 and find_circ using RNAseq on HEK293T cells.
- https://cdn.elifesciences.org/articles/63088/elife-63088-supp3-v1.xlsx
-
Supplementary file 4
HepG2 RNAseq.
Mapping statistics and annotated output from featureCounts, ciri2 and find_circ using RNAseq on HepG2 cells.
- https://cdn.elifesciences.org/articles/63088/elife-63088-supp4-v1.xlsx
-
Supplementary file 5
Mouse brain RNAseq.
Mapping statistics and annotated output from featureCounts, ciri2 and find_circ using RNAseq on mouse brain (GSE60246).
- https://cdn.elifesciences.org/articles/63088/elife-63088-supp5-v1.xlsx
-
Supplementary file 6
HEK293T QuantSeq.
Mapping statistics and output from MACS2 analysis using quantseq data on HEK293T cells.
- https://cdn.elifesciences.org/articles/63088/elife-63088-supp6-v1.xlsx
-
Supplementary file 7
Primers, probes, and antibodies.
- https://cdn.elifesciences.org/articles/63088/elife-63088-supp7-v1.xlsx
-
Transparent reporting form
- https://cdn.elifesciences.org/articles/63088/elife-63088-transrepform-v1.pdf
Download links
A two-part list of links to download the article, or parts of the article, in various formats.
Downloads (link to download the article as PDF)
Open citations (links to open the citations from this article in various online reference manager services)
Cite this article (links to download the citations from this article in formats compatible with various reference manager tools)
The RNA-binding protein SFPQ preserves long-intron splicing and regulates circRNA biogenesis in mammals
eLife 10:e63088.
https://doi.org/10.7554/eLife.63088


