Tonic firing mode of midbrain dopamine neurons continuously tracks reward values changing moment-by-moment
- Graduate School of Comprehensive Human Sciences, University of Tsukuba, Japan
- Division of Biomedical Science, Faculty of Medicine, University of Tsukuba, Japan
- Transborder Medical Research Center, University of Tsukuba, Japan
Figures
Figure 1
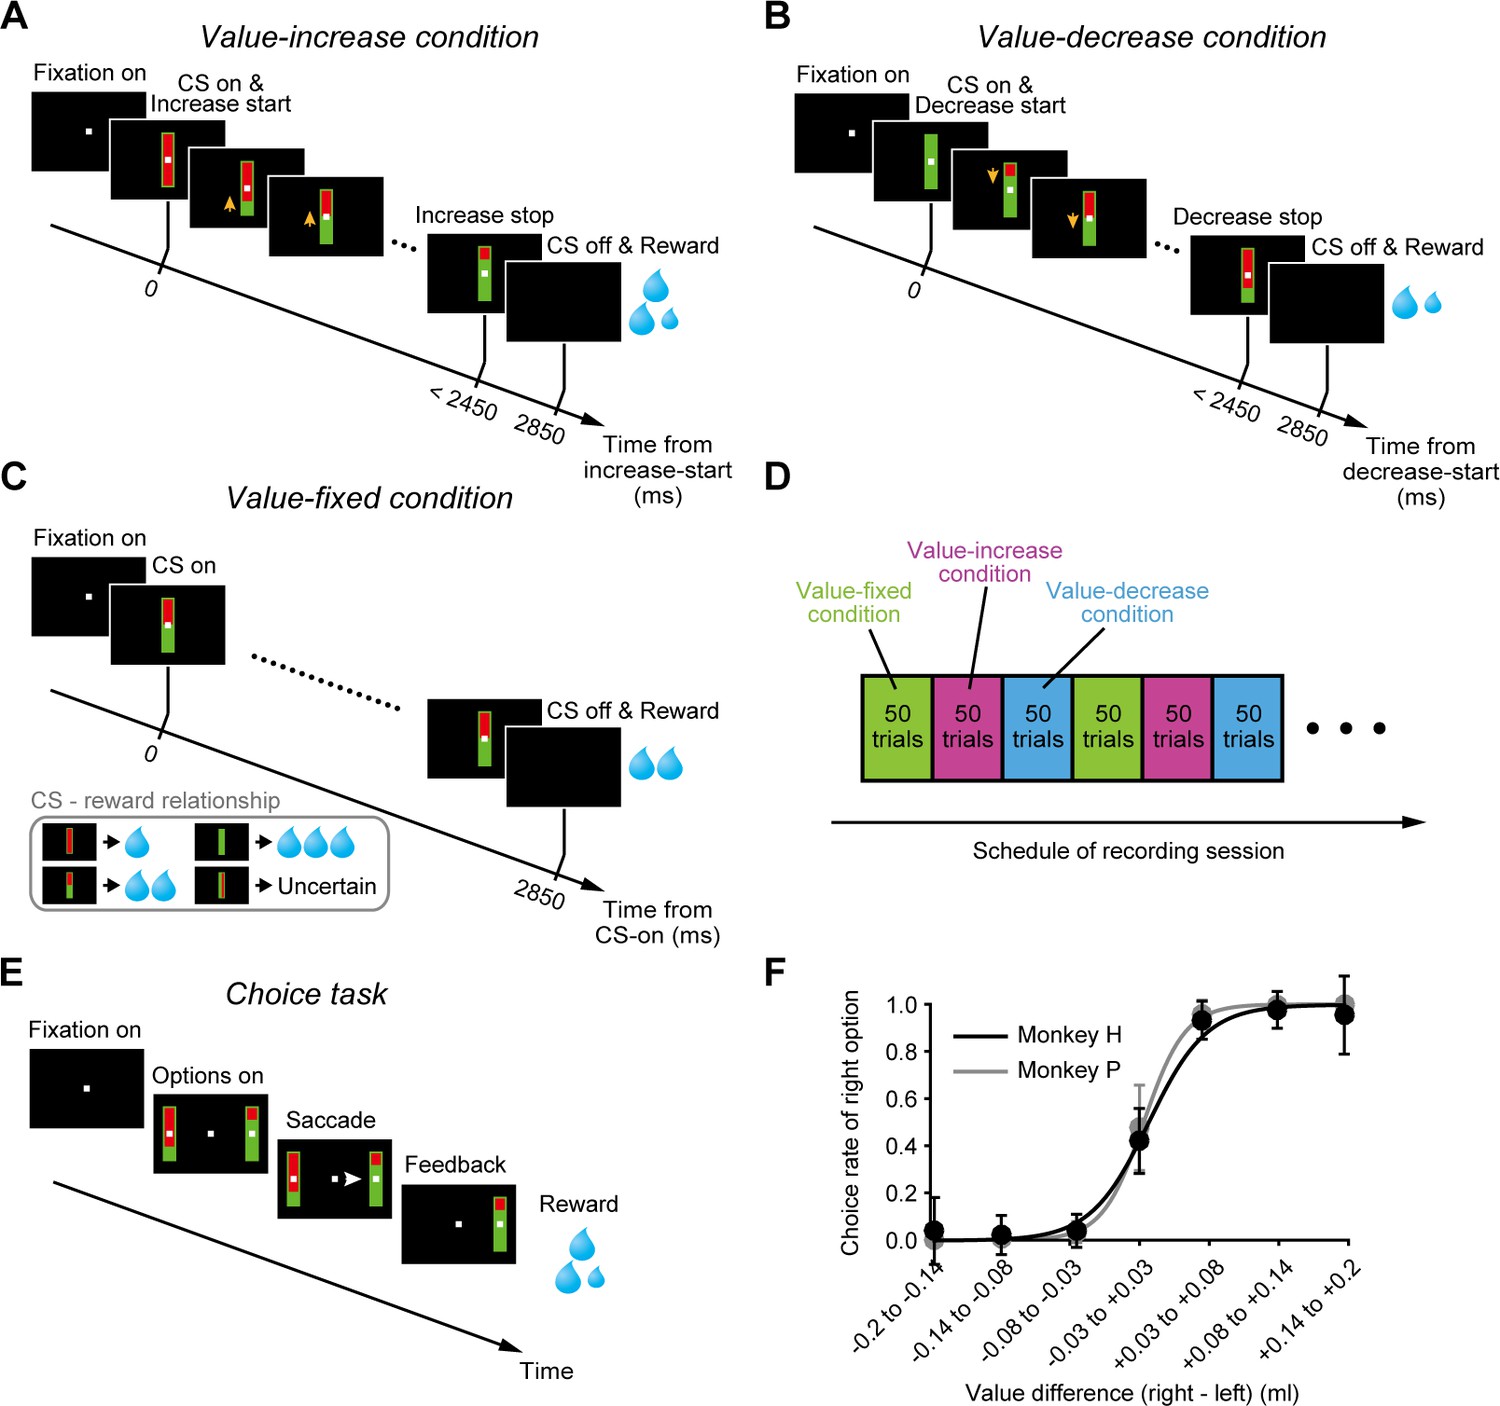
Pavlovian procedure in which the value of a cued reward gradually changed.
(A–C) Value-increase (A), value-decrease (B), and value-fixed (C) conditions in the Pavlovian procedure. (D) Schedule of recording session. Each condition consisted of a block of 50 trials and was repeated once or more. (E) Choice task. (F) Choice rate of the right bar stimulus as a function of the value difference between the right and left bar stimuli in monkey H (n = 85 sessions; black) and monkey P (n = 68 sessions; gray). Error bars indicate SEM.
-
Figure 1—source data 1
Numerical data for Figure 1F.
- https://cdn.elifesciences.org/articles/63166/elife-63166-fig1-data1-v1.mat
Figure 2 with 7 supplements
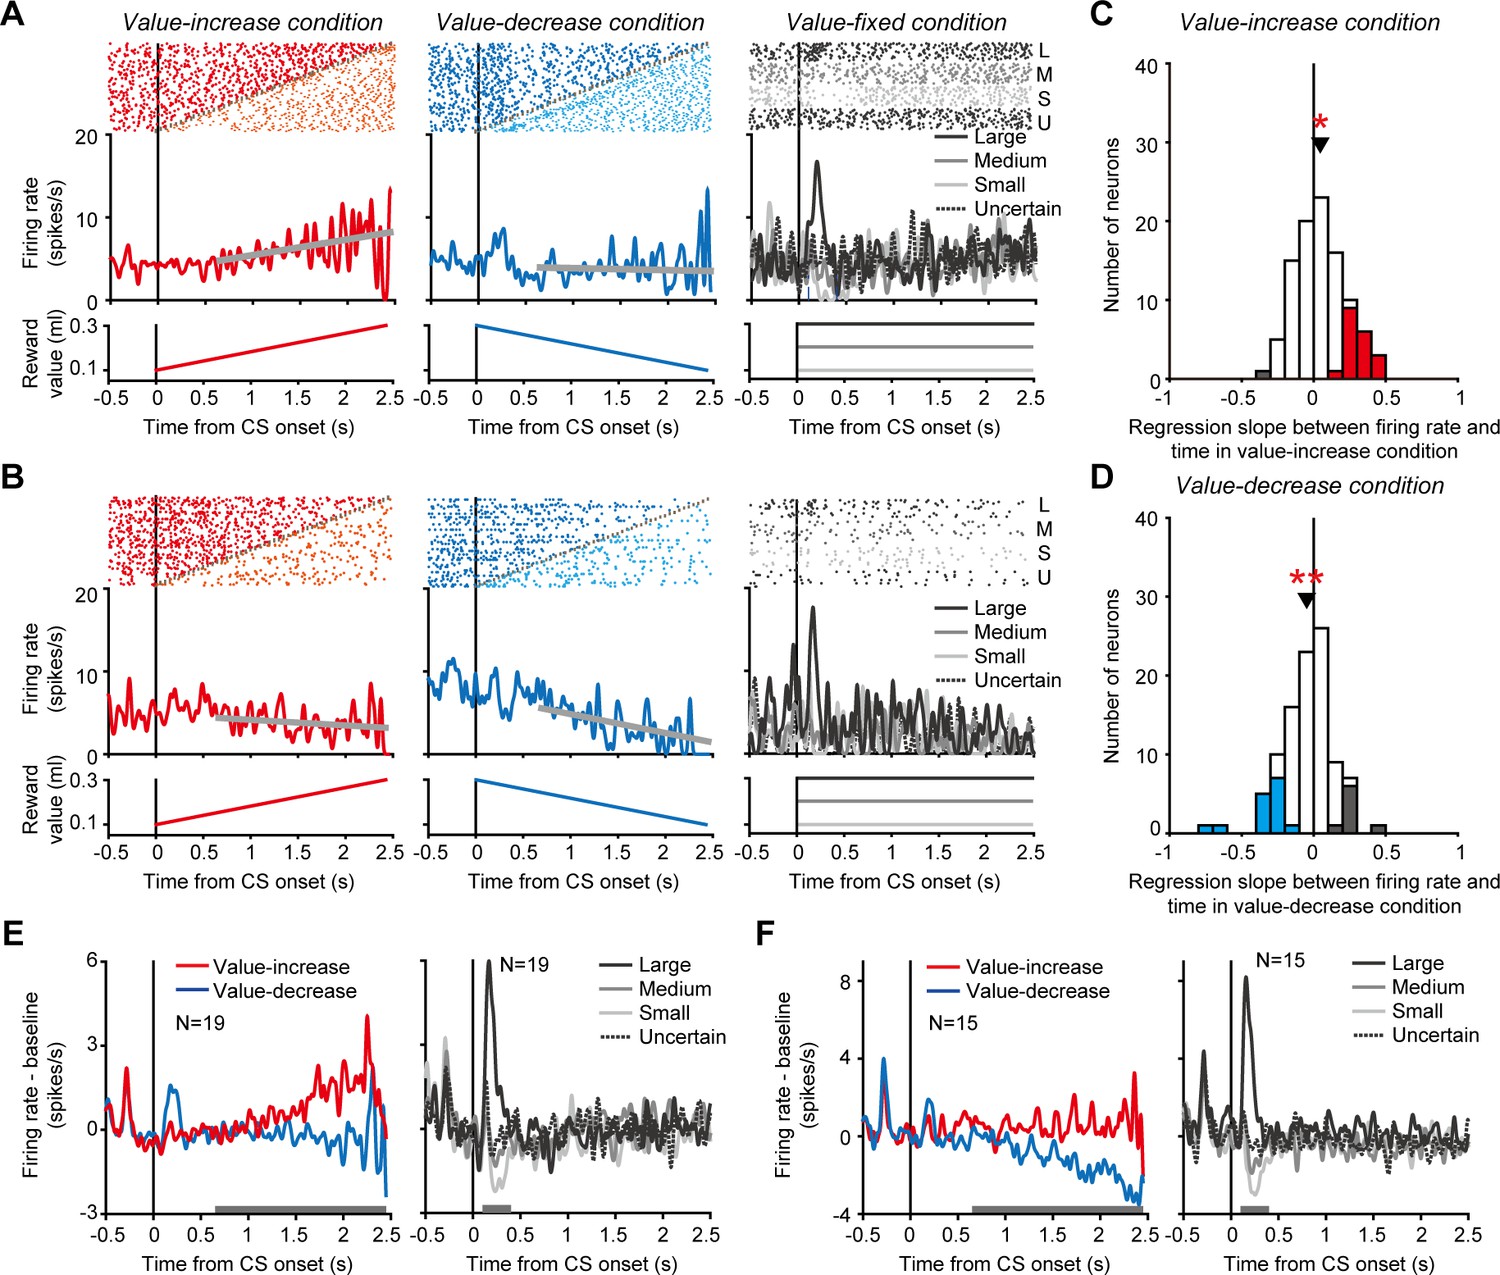
Tonic activity of dopamine neurons tracking gradually changing reward values.
(A and B) Activity of two example dopamine neurons in the value-increase (left), value-decrease (middle), and value-fixed (right) conditions. Rasters and spike density functions (SDFs) are aligned by the conditioned stimulus (CS) onset. Left: Red and orange rasters indicate spikes occurring before and after, respectively, the reward value stopped increasing. Gray plots indicate the time at which the reward value stopped changing. The spikes occurring before the stop were used to calculate the SDF. The thick gray line indicates the regression line between firing rate and time. The bottom graph indicates the reward value as a function of time. Middle: Blue and cyan rasters indicate spikes occurring before and after, respectively, the reward value stopped decreasing. Other conventions are as in the left panel. Right: Black (top), dark gray, light gray, and black (bottom) rasters indicate spikes in trials in which the reward value was large, medium, small, and uncertain, respectively. Black (solid), dark gray, light gray, and black (dotted) curves indicate the SDFs in these trials. (C and D) Regression slope between firing rate and time in the value-increase (C) and value-decrease (D) conditions (n = 99 neurons). Red and gray bars indicate neurons with significantly positive and negative slopes, respectively, in the value-increase condition (C), while blue and gray bars indicate neurons with a significantly negative and positive slope, respectively, in the value-decrease condition (D) (p<0.05; linear regression analysis). Arrowheads indicate the mean regression slopes. Single and double asterisks indicate a significant deviation from zero (p<0.05 and <0.01, respectively; Wilcoxon signed-rank test). (E and F) Averaged SDFs of the 19 dopamine neurons with a significantly positive regression slope in the value-increase condition (E) and those of the 15 dopamine neurons with a significantly negative regression slope in the value-decrease condition (F). Left: Red and blue curves indicate the SDFs in the value-increase and value-decrease conditions, respectively. Right: Black (solid), dark gray, light gray, and black (dotted) curves indicate the SDFs in trials in which the reward value was large, medium, small, and uncertain, respectively. Horizontal gray bars indicate the time windows used for analyses.
-
Figure 2—source data 1
Numerical data for Figure 2A–F.
- https://cdn.elifesciences.org/articles/63166/elife-63166-fig2-data1-v1.mat
Figure 2—figure supplement 1
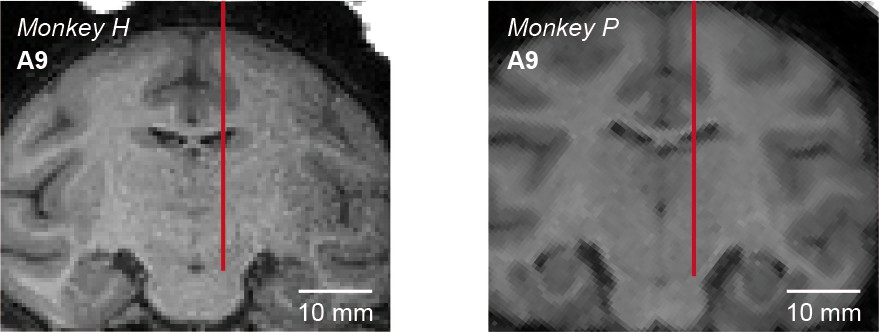
Localization of recording sites.
Images obtained by MRI scans for monkey H (left) and monkey P (right) are shown. Vertical red lines indicate representative recording tracks. The approximate anteroposterior distance (millimeters) from the interaural line is shown in the top-left corner of each panel.
Figure 2—figure supplement 2
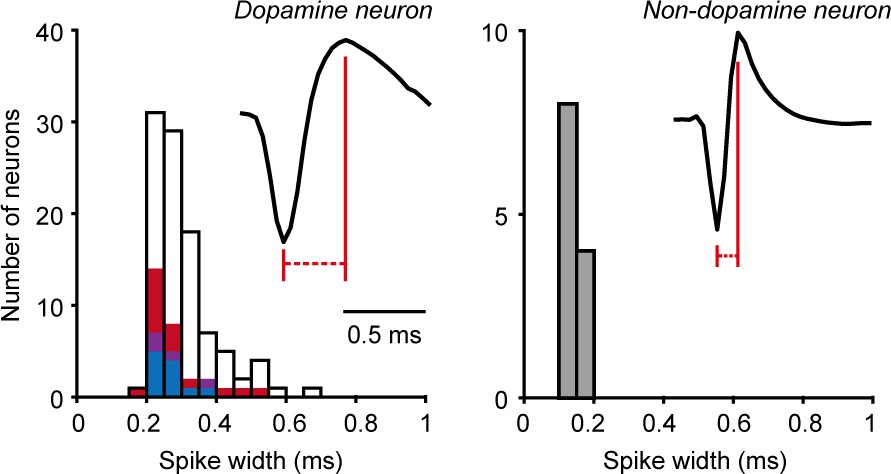
Spike waveforms of dopamine neurons.
Distributions of the spike widths of dopamine neurons (left, n = 99) and non-dopamine neurons in the substantia nigra pars reticulata (right, n = 12). Red bars indicate dopamine neurons with a significantly positive regression slope between firing rate and time in the value-increase condition, while blue bars indicate dopamine neurons with a significantly negative regression slope in the value-decrease condition (p<0.05; linear regression analysis). Purple bars indicate dopamine neurons with both of them, and open bars indicate dopamine neurons with neither of them. The spike widths of the dopamine neurons with a significantly positive regression slope in the value-increase condition, those with a significantly negative regression slope in the value-decrease condition, and those with neither of them were not significantly different (positive versus negative: p=0.77; positive versus no significance: p=0.051; negative versus no significance: p=0.058; Wilcoxon rank-sum test). Spike shapes of example dopamine and non-dopamine neurons are shown in the top-right corner of each panel. The two vertical lines show how the spike width was measured.
Figure 2—figure supplement 3
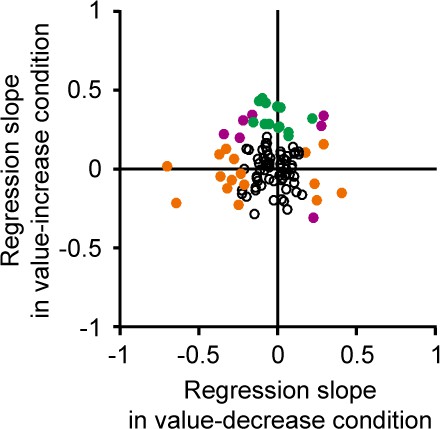
Relationship between the regression slopes in the value-increase and value-decrease conditions.
Regression slope between firing rate and time in the value-increase condition (ordinate) and that in the value-decrease condition (abscissa) (n = 99 neurons). Green and orange dots indicate dopamine neurons with a significant regression slope in the value-increase and value-decrease conditions, respectively (p<0.05; linear regression analysis). Purple dots indicate neurons with a significant regression slope in both conditions.
Figure 2—figure supplement 4
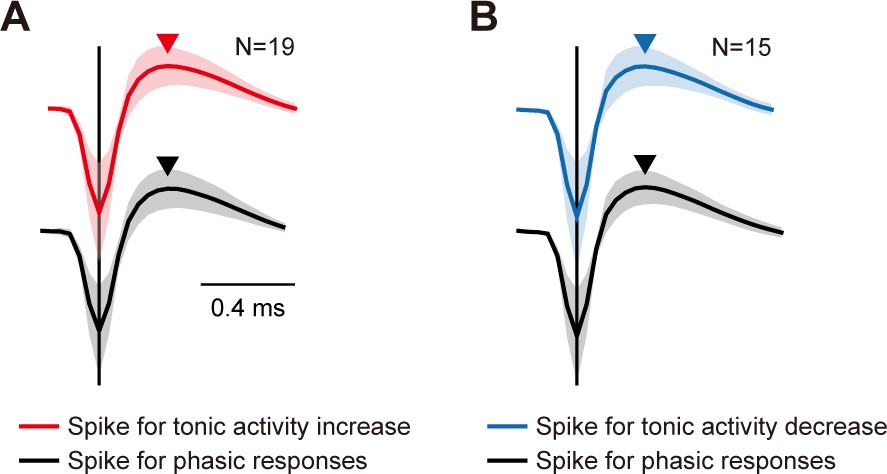
Waveforms of spikes causing the tonic activity changes and the conditioned stimulus (CS)-aligned phasic responses.
(A and B) Averaged spike waveforms of the 19 dopamine neurons with a tonic increase in activity in the value-increase condition (A) and the 15 dopamine neurons with a tonic decrease in activity in the value-decrease condition (B). The waveforms are shown for the spikes that occurred during the time window from 650 to 2450 ms after the CS onset in the value-increase (red curve) and value-decrease (blue curve) conditions and the spikes that occurred during the time window from 100 to 400 ms after the CS onset in the value-fixed condition (black curves). Vertical lines indicate the first negative peaks of the averaged spikes, and arrowheads indicate the following positive peaks of the spikes. Shaded areas indicate SD.
Figure 2—figure supplement 5
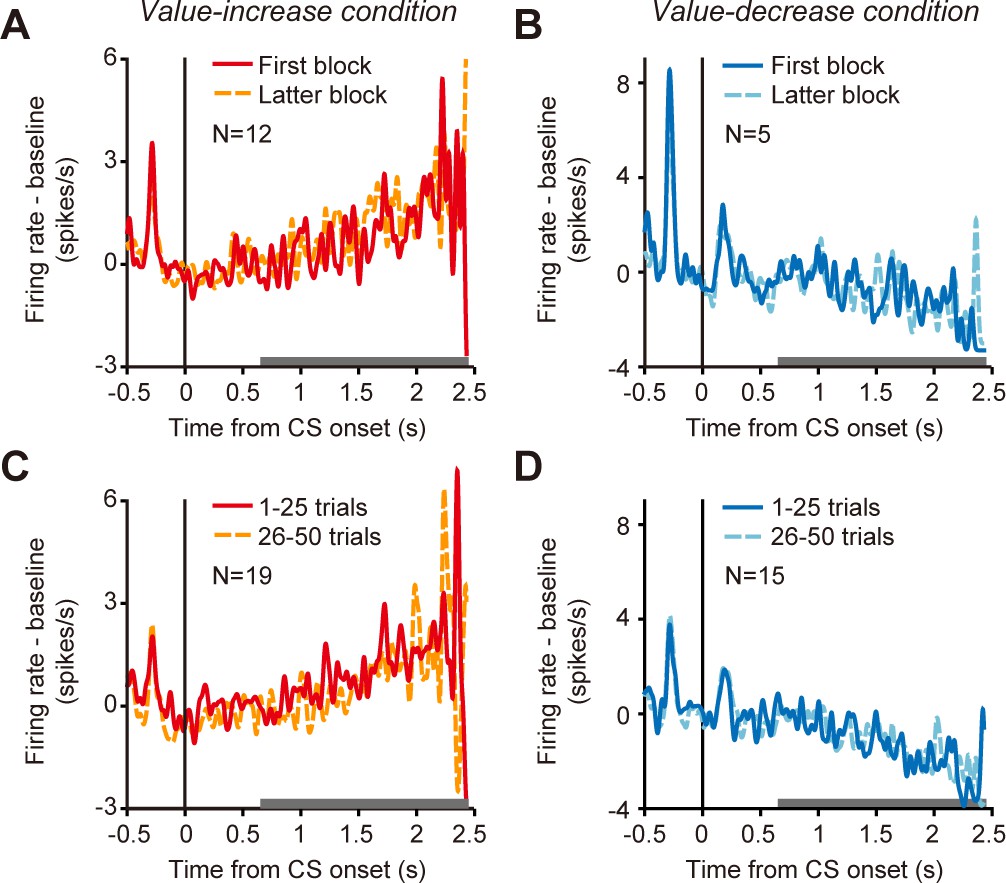
Changes in the tonic activity of dopamine neurons between and within blocks.
(A) Averaged spike density functions (SDFs) of dopamine neurons with a tonic increase in activity in the value-increase condition. The SDFs are shown for the first (red solid curve) and latter (orange dashed curve) blocks. Twelve of the 19 dopamine neurons with a tonic increase in activity could be used for this analysis because recording from these neurons was repeated for two or more blocks. (B) Averaged SDFs of dopamine neurons with a tonic decrease in activity in the value-decrease condition. The SDFs are shown for the first (blue solid curve) and latter (cyan dashed curve) blocks. Five of the 15 dopamine neurons with a tonic decrease in activity could be used for this analysis because recording from these neurons was repeated for two or more blocks. (C) Averaged SDFs of the 19 dopamine neurons with a tonic increase in activity in the value-increase condition. The SDFs are shown for the first half (red solid curve) and latter half (orange dashed curve) trials of blocks. (D) Averaged SDFs of the 15 dopamine neurons with a tonic decrease in activity in the value-decrease condition. The SDFs are shown for the first half (blue solid curve) and latter half (cyan dashed curve) trials of blocks.
Figure 2—figure supplement 6
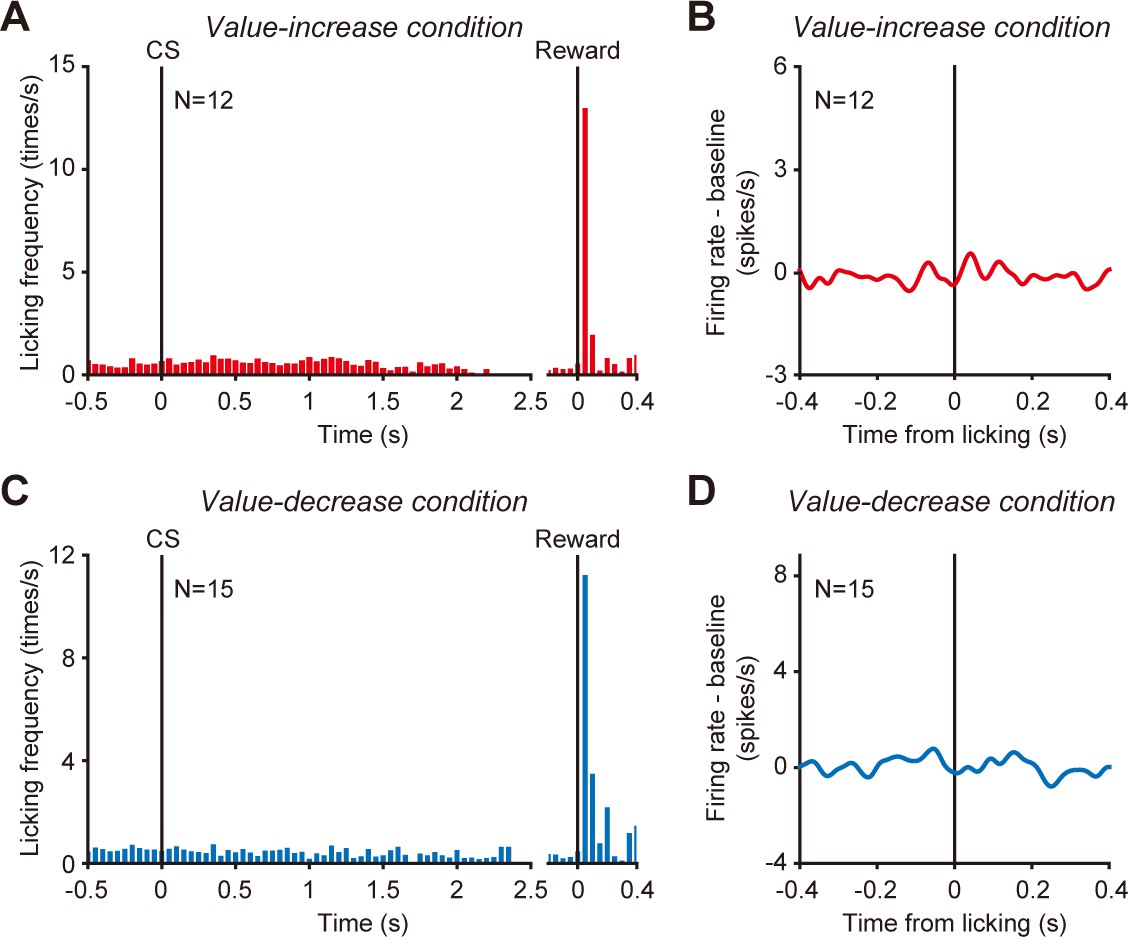
Effect of licking on dopamine neuron activity.
(A) Frequency of licking of the monkeys aligned by the conditioned stimulus (CS) onset (left) and the reward onset (right) in the value-increase condition. The data used for this analysis was measured during the recording of 12 of the 19 dopamine neurons with a tonic increase in activity in the value-increase condition. During the recording of the other dopamine neurons, we did not measure licking. (B) Averaged spike density function (SDF) of the 12 dopamine neurons aligned by the onset of each licking event in the value-increase condition. The spikes that occurred during value change was used to calculate the SDF. (C) Frequency of licking of the monkeys in the value-decrease condition. The data used for this analysis was measured during the recording of the 15 dopamine neurons with a tonic decrease in activity in the value-decrease condition. (D) Averaged SDF of the 15 dopamine neurons aligned by the onset of each licking event in the value-decrease condition.
Figure 2—figure supplement 7
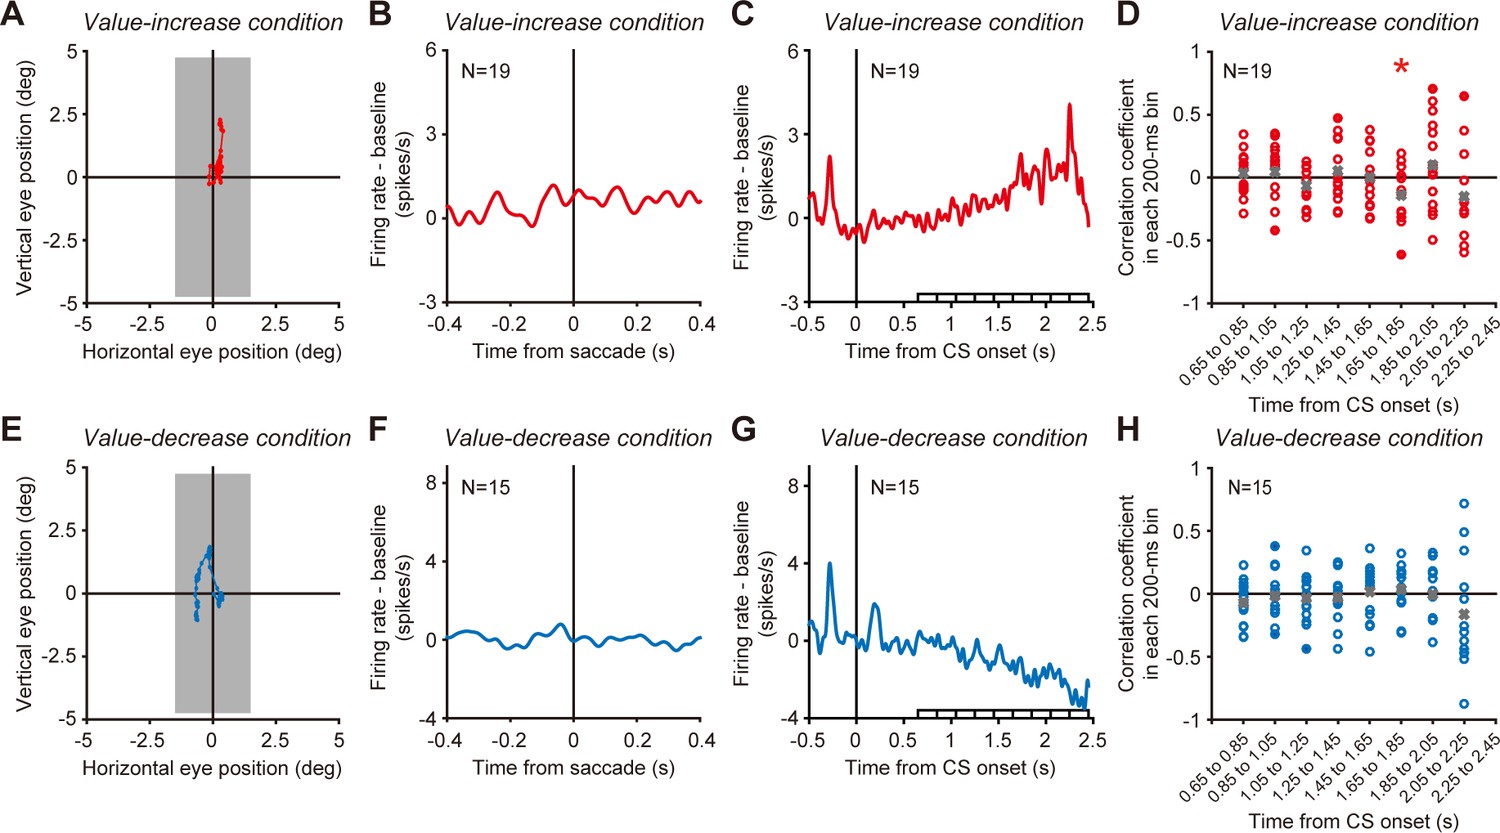
Effect of eye movements on dopamine neuron activity.
(A and E) Gaze positions of example trials during value change in the value-increase (A) and value-decrease (E) conditions. The position was plotted for each 25 ms. Gray areas indicate the vertical bar stimulus (i.e., conditioned stimulus [CS]). (B and F) Averaged spike density functions (SDFs) aligned by the onset of each saccade. The averaged SDF of the 19 dopamine neurons with a tonic increase in activity in the value-increase condition (B) and that of the 15 dopamine neurons with a tonic decrease in activity in the value-decrease condition (F) are shown. The spikes that occurred during value change was used to calculate the SDFs. (C and G) Averaged SDFs aligned by the CS onset and calculation time window. The averaged SDF of the 19 dopamine neurons (C) and that of the 15 dopamine neurons (G) are shown with the calculation time window divided into 200 ms bins (horizontal white bars). (D and H) Correlation coefficients between firing rate and vertical gaze position in each 200 ms bin in the value-increase (D) and value-decrease (H) conditions. Filled plots indicate dopamine neurons with a significant regression coefficient (p<0.05; correlation analysis), and open plots indicate dopamine neurons with no significance. Gray crosses indicate the mean of the correlation coefficients in each bin. Single asterisk above plots indicates a significant deviation from zero in a bin (p<0.05; Wilcoxon signed-rank test). The data in the bin from 2250 to 2450 ms were excluded from the correlation analysis because this bin included less than five trials for each neuron and, consequently, we were unable to conduct a statistically valid analysis.
Figure 3
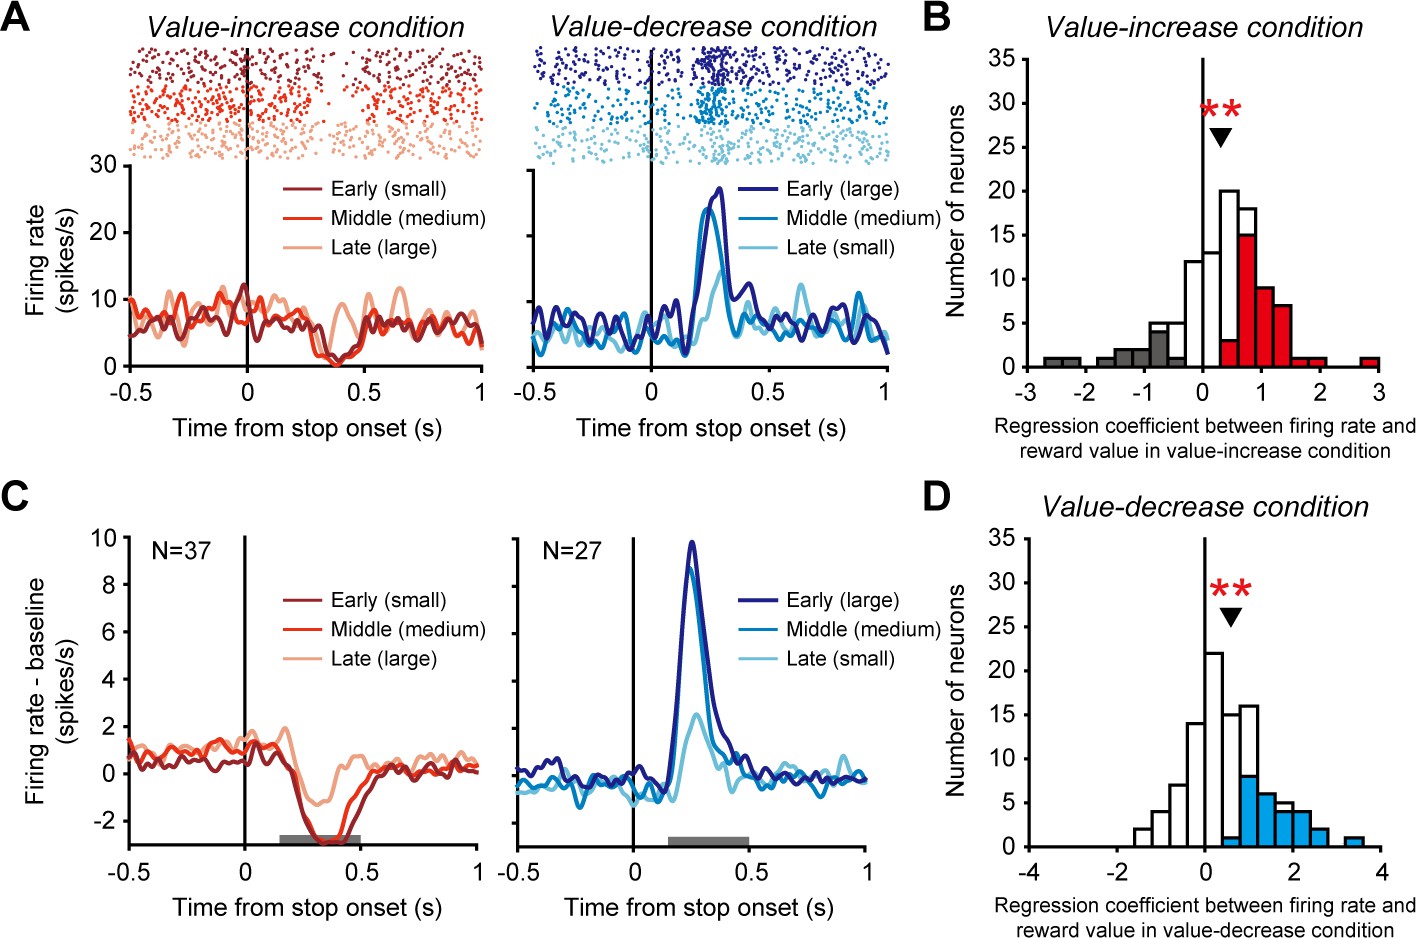
Phasic activity of dopamine neurons evoked when the reward value stopped changing.
(A) Activity of an example dopamine neuron. Rasters and spike density functions (SDFs) are aligned by the time at which the reward value stopped increasing or decreasing in the value-increase (left) and value-decrease (right) conditions, respectively. Left: Dark red, red, and light red indicate the activity in trials in which the stopping of the value increase occurred at early (small reward 0.1-0.16 ml), middle (medium reward 0.16-0.23 ml), and late (large reward 0.23-0.3 ml) times, respectively. Right: Dark blue, blue, and light blue indicate the activity in trials in which the stopping of the value decrease occurred at early (large reward 0.23-0.3 ml), middle (medium reward 0.16-0.23 ml), and late (small reward 0.1-0.16 ml) times, respectively. (B and D) Regression coefficient between firing rate and reward value in the value-increase (B) and value-decrease (D) conditions (n = 99 neurons). Conventions are as in Figure 2C,D. (C) Averaged SDFs of the 37 dopamine neurons with a significantly positive regression coefficient in the value-increase condition (left) and those of the 27 dopamine neurons with a significantly positive regression coefficient in the value-decrease condition (right). Horizontal gray bars indicate the time windows used for analyses. Conventions are as in A.
-
Figure 3—source data 1
Numerical data for Figure 3A–D.
- https://cdn.elifesciences.org/articles/63166/elife-63166-fig3-data1-v1.mat
Figure 4

Relationship between the tonic and phasic dopamine neuron activities.
(A) Regression slope between firing rate and time for the tonic activity increase in the value-increase condition (ordinate) and regression coefficient between firing rate and reward value for the cue-aligned phasic activity in the value-fixed condition (abscissa) (n = 99 neurons). (B) Regression slope between firing rate and time for the tonic activity decrease in the value-decrease condition (ordinate) and regression coefficient between firing rate and reward value for the cue-aligned phasic activity in the value-fixed condition (abscissa) (n = 99 neurons). (C) Regression slope between firing rate and time for the tonic activity decrease in the value-decrease condition (ordinate) and regression coefficient between firing rate and reward value for the stop-aligned phasic activity decrease in the value-increase condition (abscissa) (n = 99 neurons). (D) Regression slope between firing rate and time for the tonic activity increase in the value-increase condition (ordinate) and regression coefficient between firing rate and reward value for the stop-aligned phasic activity increase in the value-decrease condition (abscissa) (n = 99 neurons). (E) Regression slope between firing rate and reward value for the stop-aligned phasic activity decrease in the value-increase condition (ordinate) and regression coefficient between firing rate and reward value for the cue-aligned phasic activity in the value-fixed condition (abscissa) (n = 99 neurons). (F) Regression slope between firing rate and reward value for the stop-aligned phasic activity increase in the value-decrease condition (ordinate) and regression coefficient between firing rate and reward value for the cue-aligned phasic activity in the value-fixed condition (abscissa) (n = 99 neurons). Green and orange dots indicate neurons with a significant difference from zero in the ordinate and abscissa, respectively (p<0.05; linear regression analysis). Purple dots indicate neurons with significance for both.
-
Figure 4—source data 1
Numerical data for Figure 4A–F.
- https://cdn.elifesciences.org/articles/63166/elife-63166-fig4-data1-v1.mat
Figure 5
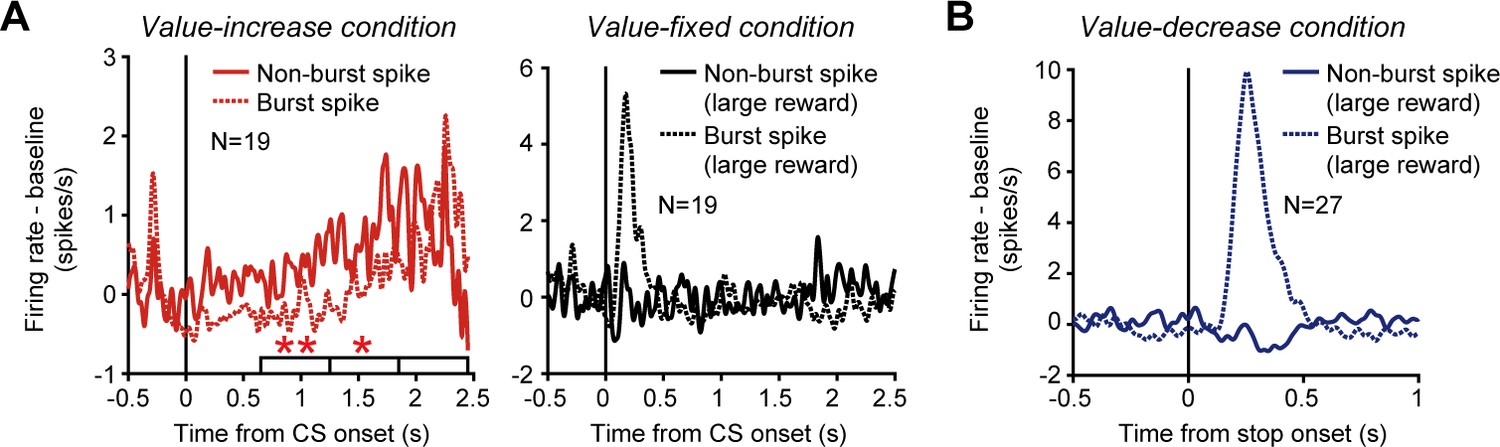
Phasic and tonic activities of dopamine neurons produced by burst and non-burst spikes.
(A) Averaged spike density functions (SDFs) of the 19 dopamine neurons with a tonic increase in activity in the value-increase condition. Left: SDFs in the value-increase condition. Right: SDFs in the value-fixed condition. The SDFs are aligned by the conditioned stimulus (CS) onset and shown for burst (dotted curve) and non-burst (solid curve) spikes. Horizontal white bars indicate the initial, middle, and late periods to calculate the neural modulation between burst and non-burst spike firing. Single and double asterisks above the horizontal bars indicate periods during which the firing rate (original firing rate – baseline firing rate) was significantly larger for non-burst spike firing than for burst spike firing (p<0.05 and <0.01, respectively; bootstrap test with 1000 repetitions). The SDFs in the value-fixed condition were calculated using large reward trials. (B) Averaged SDFs of the 27 dopamine neurons with a phasic activity that was modulated by reward values when the values stopped decreasing in the value-decrease condition. The SDFs in large reward trials are shown and aligned by the time at which the reward value stopped decreasing. Other conventions are as in A.
-
Figure 5—source data 1
Numerical data for Figure 5A,B.
- https://cdn.elifesciences.org/articles/63166/elife-63166-fig5-data1-v1.mat
Videos
Video 1
Bar stimuli in the value-increase condition of the Pavlovian procedure.
The size of the green area indicated the amount of a liquid reward. The green area was minimal at the beginning and gradually increased. The gradual increase randomly stopped within 2450 ms after the onset of the bar stimulus.
Video 2
Bar stimuli in the value-decrease condition of the Pavlovian procedure.
The green area was maximal at the beginning and gradually decreased. The gradual decrease randomly stopped within 2450 ms after the onset of the bar stimulus.
Tables
Key resources table
| Reagent type (species) or resource | Designation | Source or reference | Identifiers | Additional information |
|---|---|---|---|---|
| Biological sample (Macaca fuscata) | Macaca fuscata | National Bio Resource Project of the MEXT, Japan | ||
| Software, algorithm | MATLAB | MathWorks | RRID:SCR_001622 |
Additional files
Download links
A two-part list of links to download the article, or parts of the article, in various formats.
Downloads (link to download the article as PDF)
Open citations (links to open the citations from this article in various online reference manager services)
Cite this article (links to download the citations from this article in formats compatible with various reference manager tools)
Tonic firing mode of midbrain dopamine neurons continuously tracks reward values changing moment-by-moment
eLife 10:e63166.
https://doi.org/10.7554/eLife.63166


