A visual pathway for skylight polarization processing in Drosophila
- Department of Integrative Biology and Physiology, University of California, Los Angeles, United States
- Department of Molecular, Cell and Developmental Biology, University of California, Los Angeles, United States
Figures
Figure 1 with 2 supplements
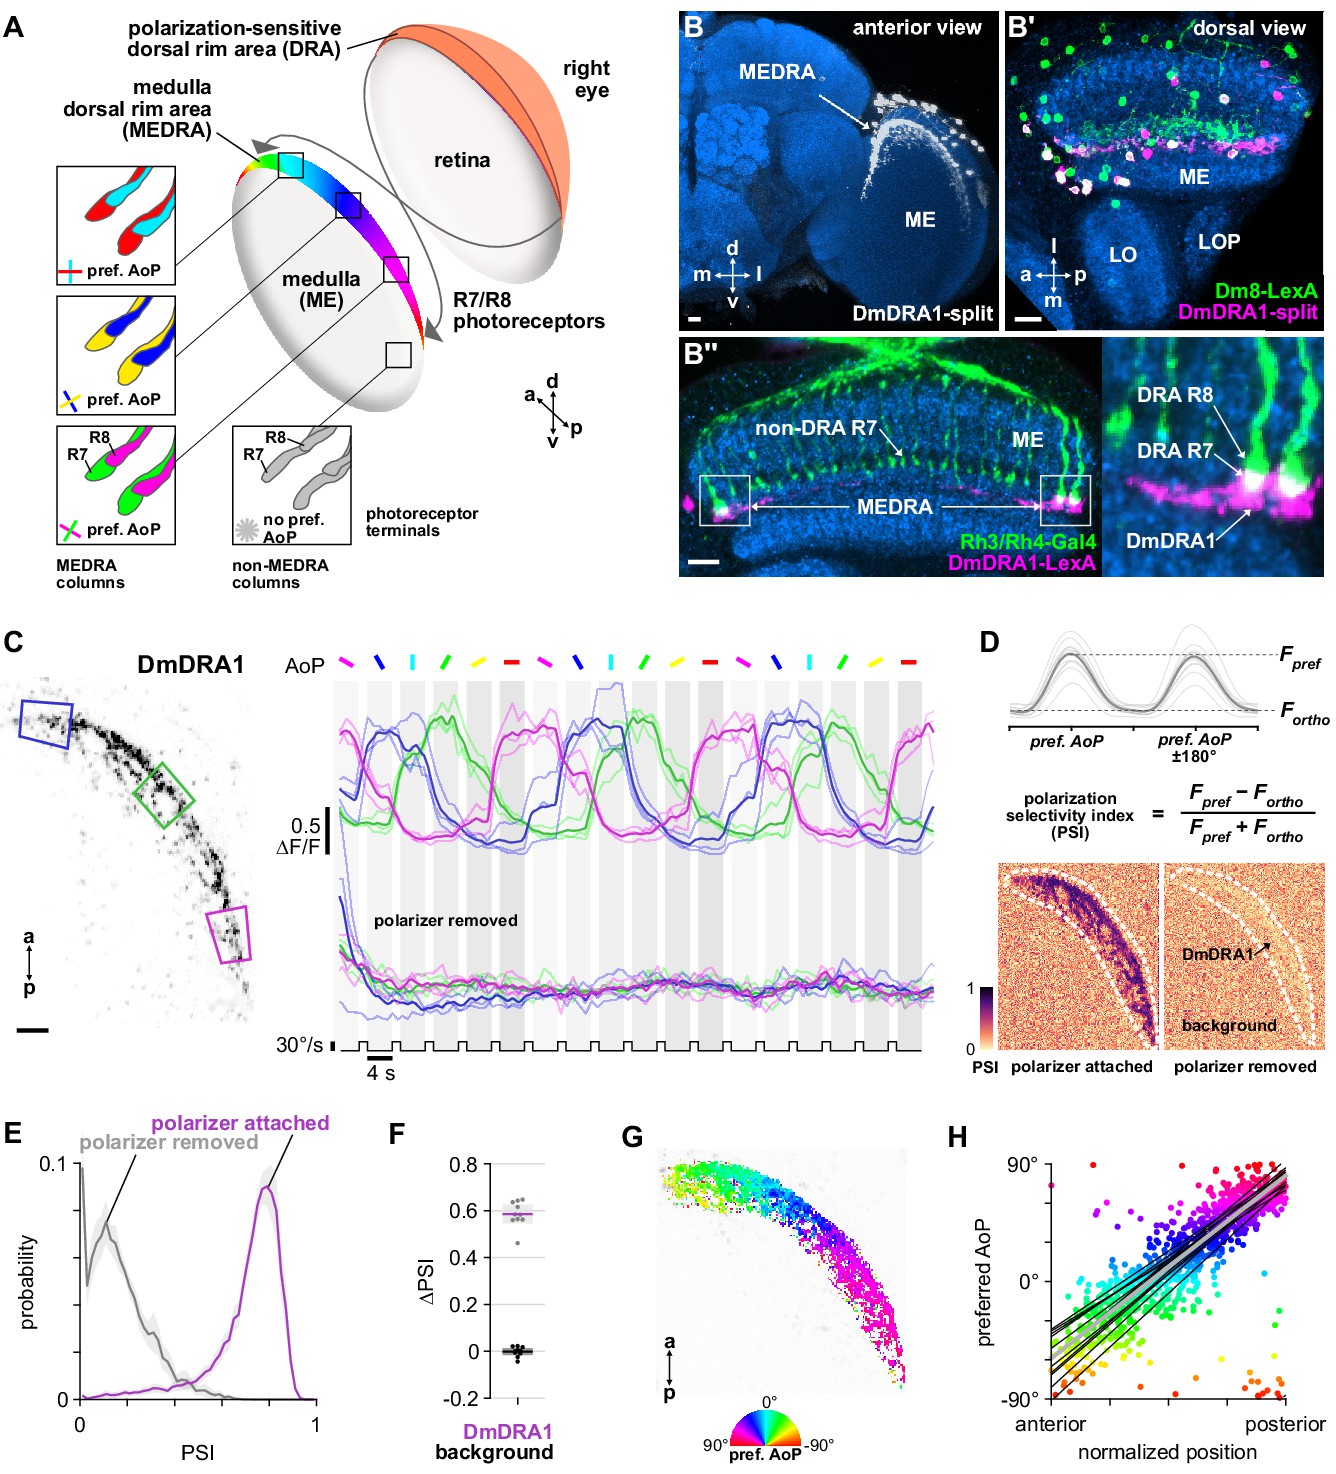
Polarization processing in the medulla dorsal rim area.
(A) Schematic of the dorsal rim area (DRA) of the right eye and the projection of DRA R7/R8 photoreceptors to corresponding columns in the medulla dorsal rim area (MEDRA) across the first optic chiasm. Insets: R7 and R8 terminals in each individual column are tuned to orthogonal angles of polarization (AoP), and their tunings change linearly across the MEDRA. R7/R8 outside the MEDRA are equally sensitive to all AoPs. (B) Confocal projection (anterior view) of DmDRA1 expression pattern in the MEDRA (DmDRA1-split>GFP). (B’) Dual-labeling of Dm8 and DmDRA1 neurons (dorsal view) (R24F06-LexA>GFP, green; DmDRA1-split>RFP, magenta) (mean cell bodies per brain hemisphere, DmDRA1: 23.13, SEM 1.16; Dm8∩DmDRA1: 21.25, SEM 0.49, N = 8 animals). Overlap in expression (visible as white cell bodies) indicates neurons in split driver are DmDRA1 neurons, and not DmDRA2 (Sancer et al., 2019). (B’’) Dorsal view of the medulla showing DRA R7/R8 photoreceptors (Rh3/Rh4-Gal4, green) and their proximity to DmDRA1 neurons (R13E04-LexA, magenta), indicating contact between R7 and DmDRA1. Right: Enlargement of medulla dorsal rim area (MEDRA). Scale bars denote 10 μm. (C) Left: Example time-averaged maximum-intensity projection showing dorso-posterior two-photon imaging view of GCaMP activity in DmDRA1 neurons (DmDRA1-split>sytGCaMP6s). Three ROIs were manually drawn in anterior (blue), dorsal (green), and posterior (magenta) MEDRA in each recording. Scale bar denotes 10 μm. Right: Time-series of normalized mean intensity values for ROIs in equivalent positions in three animals (thin traces) and their mean (thick trace), with the polarizing filter (polarizer) attached (top) and removed (bottom). Shaded patches denote periods that the polarizer remained at a fixed orientation. (D) Definition of polarization-selectivity index (PSI), as obtained from polarization tuning curves (top, see Appendix 1—figure 1), and example spatial maps of PSI for the example recordings in (C), with the polarizer attached (bottom, left) and removed (bottom, right). (E) Probability distributions of PSI values in DmDRA1 neurons with the polarizer attached (average PSI DmDRA: 0.74, CI95 [0.70 0.78], N = 10 animals) and removed (average PSI DmDRA1 control: 0.16, CI95 [0.18 0.21], N = 7 animals). Mean ± SEM. (F) Effect of polarizer on median PSI values versus controls with polarizer removed, within DmDRA1 neurons (light dots) and background regions (dark dots) in individual animals (DmDRA1, pink line: mean ΔPSI = 0.59, CI95 [0.55 0.63], N = 10, p < 10−6 t-test; background, black line: mean ΔPSI = −0.002, CI95 [−0.02 0.01], N = 10, p=0.82, t-test). (G) Example polarization tuning map for DmDRA1. Preferred angles of polarization are shown for each pixel with an above-threshold PSI value using the color map shown. Pixels with a below-threshold PSI value, or falling outside an ROI drawn around the DmDRA1 population, show average intensity in grayscale. Data shown are from maximum-intensity projections through the MEDRA. (H) Scatter plot showing the common polarotopic organization of DmDRA1 neurons. Individual points represent pixels recorded from DmDRA1 neurons, showing their normalized horizontal position in the MEDRA and their preferred angle of polarization (AoP). Thin lines show linear-circular fits for data from individual animals with significant correlations (mean individual ρ = 0.89, CI95 [0.85 0.91], N = 10 animals), thick line shows fit for all pooled data (pooled ρ = 0.85, CI95 [0.79 0.88], N = 10 recordings, p < 10−4 permutation test).
Figure 1—figure supplement 1
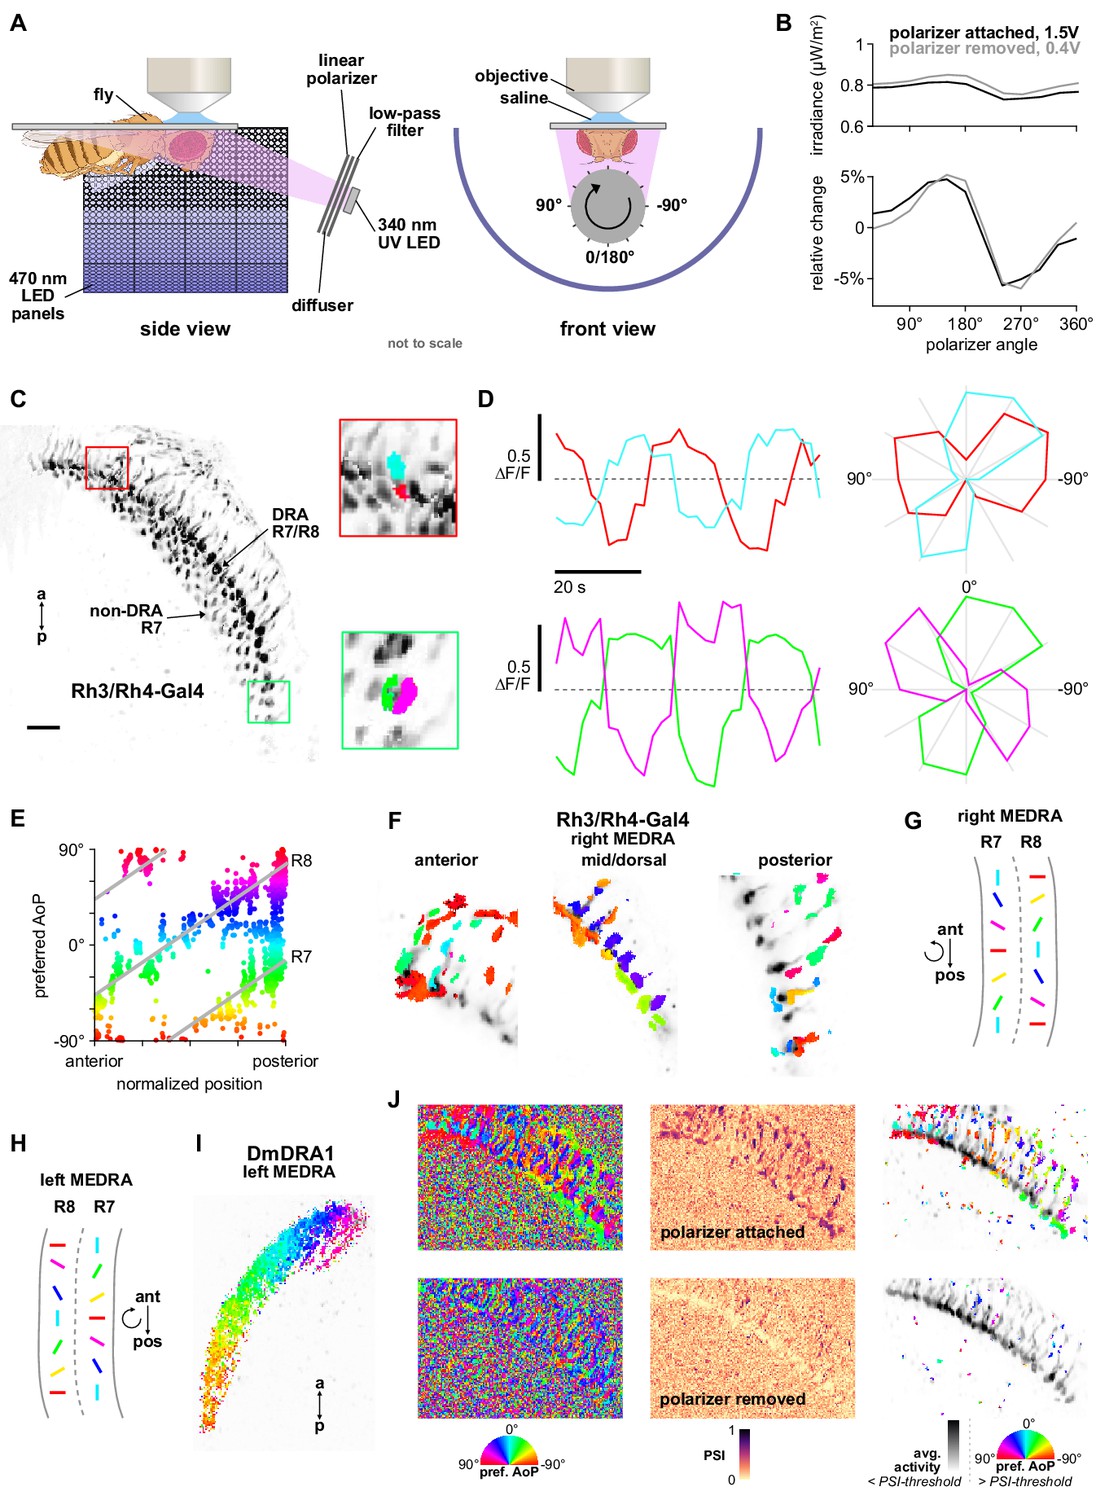
Polarizer stimulus characterization and R7/R8 photoreceptor stimulation.
(A) Schematic of experimental setup. Volumetric two-photon imaging of the medulla dorsal rim area (MEDRA) was performed while ultraviolet light was presented continuously and a linear polarizing filter varied the angle of polarization. Rotations and angles of polarization are expressed from the external viewpoint looking toward the animal’s head. (Fly illustration: BioRender.com). (B) Modulation of intensity over one revolution of the polarizer in absolute units (top) and with the mean subtracted (bottom). The amplitude of modulation (approximately ±5%) was similar with the polarizer attached or removed. (C) Example time-averaged maximum-intensity projection of GCaMP activity in DRA R7/R8 + non-DRA R7 photoreceptors in the dorsal medulla (Rh3/Rh4-Gal4>sytGCaMP6s). Insets: ROIs drawn on R7 and R8 terminals in anterior (top) and posterior (bottom) MEDRA. (D) GCaMP activity in R7/R8 terminals from (C) in response to rotations of polarizer. Dashed lines indicate 0 ΔF/F baseline. Right: Polar plot of average responses for each angle of polarization presented. (E) Example scatter plot showing the polarotopic organization of DRA R7/R8 photoreceptors for the recording in (C). Individual points represent pixels recorded from R7/R8, showing their normalized horizontal position in the MEDRA and their preferred angle of polarization (AoP). (F) Example tuning maps of preferred AoP for recordings in a single plane, showing details of R7/R8 terminals in posterior, mid/dorsal and anterior MEDRA in the right optic lobe. (G) Summary of preferred AoP in R7/R8 in the right MEDRA (based on data from Weir et al., 2016). Curved arrow indicates rotation of preferred angle of polarization in direction indicated. (H) As in (G), in the left MEDRA. (I) Example polarization tuning map for DmDRA1 in the left MEDRA. (J) Example construction of a polarization tuning map for a maximum-intensity projection of two-photon imaging data in the medulla. Left: Preferred AoP for all pixels, with the polarizer attached (top) and removed (bottom). GCaMP-expressing photoreceptors can be differentiated from background noise, and show a retinotopic organization of preferred AoP only with the polarizer attached. Center: Polarization-selectivity index (PSI), a measure of fluorescence intensity modulation by the polarizer device, for the same data. Right: Preferred AoP values with a PSI-threshold applied (mean PSI value in background regions + 1 SD). Below-threshold pixels (grayscale) show average intensity values over the experiment.
Figure 1—figure supplement 2
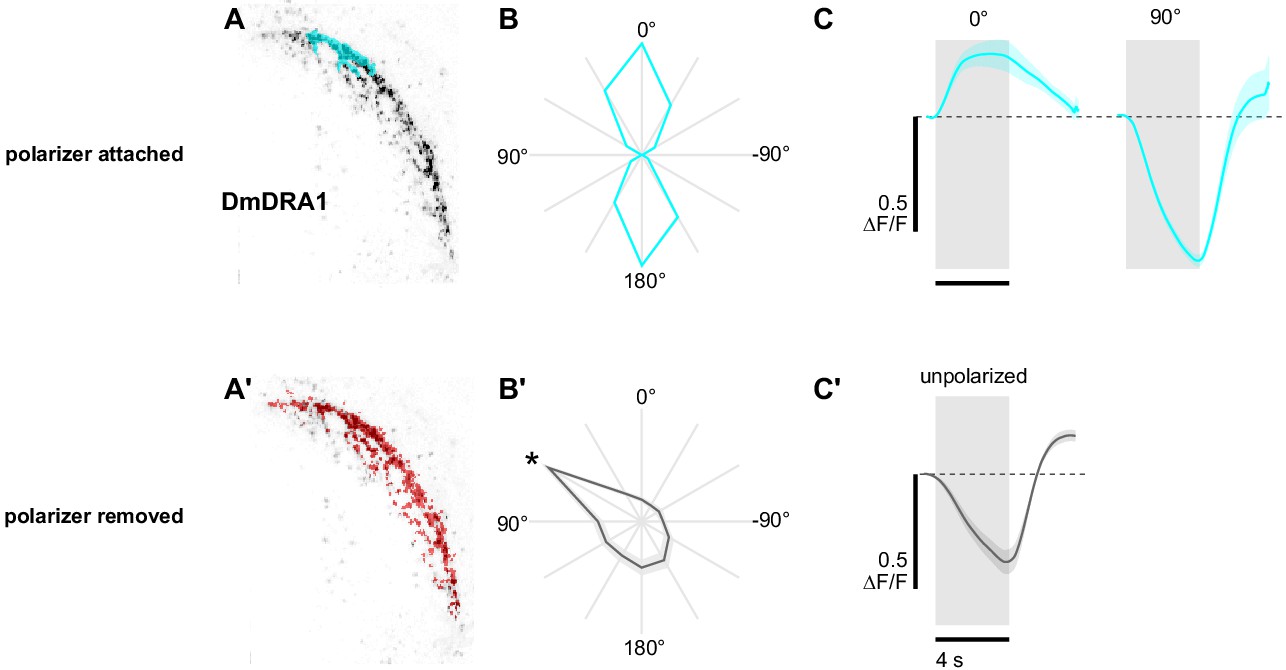
Polarization-opponent flash responses in DmDRA1.
(A) Example time-averaged maximum-intensity projection showing GCaMP activity in DmDRA1 neurons (DmDRA1-split>sytGCaMP6s) and example ROIs automatically generated around areas of DmDRA1 neurons with a preferred angle of polarization close to 0° (cyan) and (A’) around the brightest pixels for experiments with the polarizer removed (red). (B) Normalized tuning curves for ROIs (N = 11, one ROI per animal). Mean ± SEM. (B’) As in (B), for experiments with the polarizer removed. Asterisk denotes the first angle of polarization presented, during which time activity was often falling (see Figure 1C). (C) Average responses of ROIs to 4 s UV light flashes with the polarizer at 0° (pk ΔF/F = 0.28) and 90° (pk ΔF/F = −0.64, N = 10, p=0.0002), and (C') with the polarizer removed (pk ΔF/F = −0.38, N = 7). Dashed line indicates 0 ΔF/F baseline. Mean ± SEM.
Figure 2 with 1 supplement

Medulla projection neurons receive polarization signals from DmDRA1 and DRA photoreceptors.
(A) Confocal projection (anterior view) of R56F07-Gal4 driving a population of MeTu neurons with dendrites in the dorsal medulla (ME) and projections to the anterior optic tubercle (AOTU) via the anterior optic tract (AOT). High-magnification anterior (A’) and dorsal (A’’) views showing AOTU domains innervated by MeTu neurons in the driver line. (B) Confocal projection (anterior view) of trans-Tango signal (magenta) labeling putative postsynaptic partners from DmDRA1-split (green, visible as white due to overlap). High-magnification anterior (B’) and dorsal (B’’) views showing innervation of AOTU by postsynaptic neurons, similar to that of MeTu neurons in (A). (C) Confocal projection (anterior view) of trans-Tango signal (magenta) labeling putative postsynaptic partners from Rh3/Rh4-Gal4 (green), which labels DRA R7/R8 + non-DRA R7. Scale bar denotes 50 μm. High-magnification anterior (C’) and dorsal (C’’) views showing innervation of AOTU by postsynaptic neurons, similar to that of MeTu neurons in (A). Scale bars denote 10 μm. (D) Schematic of proposed parallel connectivity in the medulla dorsal rim area (MEDRA) and regions of the AOTU targeted by polarization-sensitive MeTu neurons. (E) Schematic of proposed one-dimensional mapping of MEDRA position to AOTU position by MeTu neurons (left) based on single-cell clones (see Figure 2—figure supplement 1B-D), and predicted polarotopy in the AOTU (right) assuming excitatory input from DmDRA1 neurons in the MEDRA. (F) Probability distributions of PSI values in MeTu neurons (average PSI R56F07: 0.48, CI95 [0.41 0.55], N = 17 animals; R73C04: 0.42, CI95 [0.29 0.56], N = 11 animals). Mean ± SEM. (G) Effect of polarizer on median PSI values versus controls with polarizer removed, within MeTu neurons (light dots) and background regions (dark dots) in individual animals (R56F07 MeTu, green line: mean ΔPSI = 0.28, CI95 [0.21 0.35], N = 17, p < 10−6 t-test; R56F07 background, black line: mean ΔPSI = 0.001, CI95 [−0.01 0.01], N = 17, p=0.84, t-test; R73C04 MeTu, green line: mean ΔPSI = 0.242, CI95 [0.11 0.38], N = 11, p=0.03 t-test; R73C04 background, black line: mean ΔPSI = 0.000, CI95 [−0.03 0.03], N = 11, p=0.98, t-test).
Figure 2—figure supplement 1
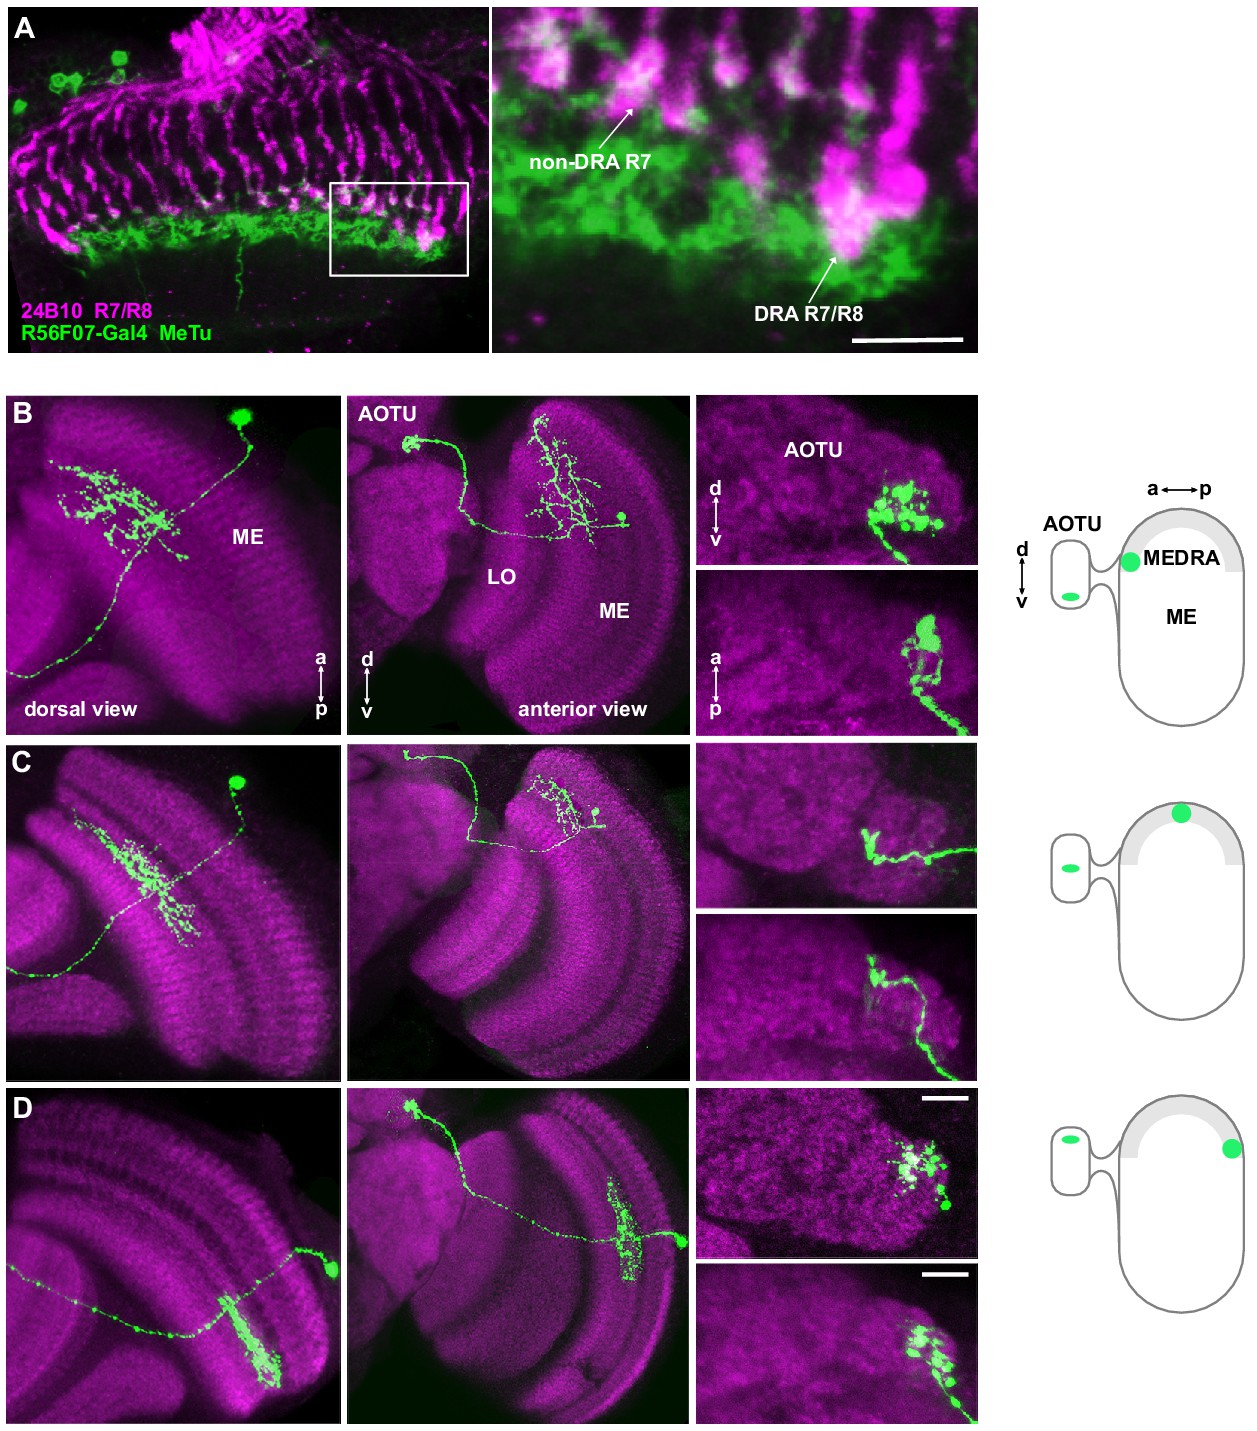
Retinotopic mapping of medulla dorsal rim area to AOTU by MeTu neurons.
(A) Confocal section of the medulla (dorsal view) showing R7/R8 photoreceptors (24B10 antibody staining: green) and their proximity to MeTu neurons (R56F07-Gal4>GFP: magenta). Right: Enlargement of medulla dorsal rim area (MEDRA), indicating contact between R7 and MeTu neurons. Scale bar denotes 10 μm. (B) Confocal projections of a single MCFO clone of R56F07 MeTu neurons with dendrites in the anterior/dorsal medulla (ME) in proximity to the medulla dorsal rim area. Left: Dorsal view. Center: Anterior view. Right: High-magnification projections showing the position of terminals in the anterior optic tubercle (AOTU), in anterior (top) and dorsal (bottom) view. Schematic indicates the position of the dendrites in the MEDRA and the terminals in the AOTU. (C) As in (B), for a MeTu neuron with dendrites in the mid/dorsal medulla. (D) As in (B), for a MeTu neuron with dendrites in the posterior medulla. Scale bars denote 10 μm.
Figure 3 with 1 supplement
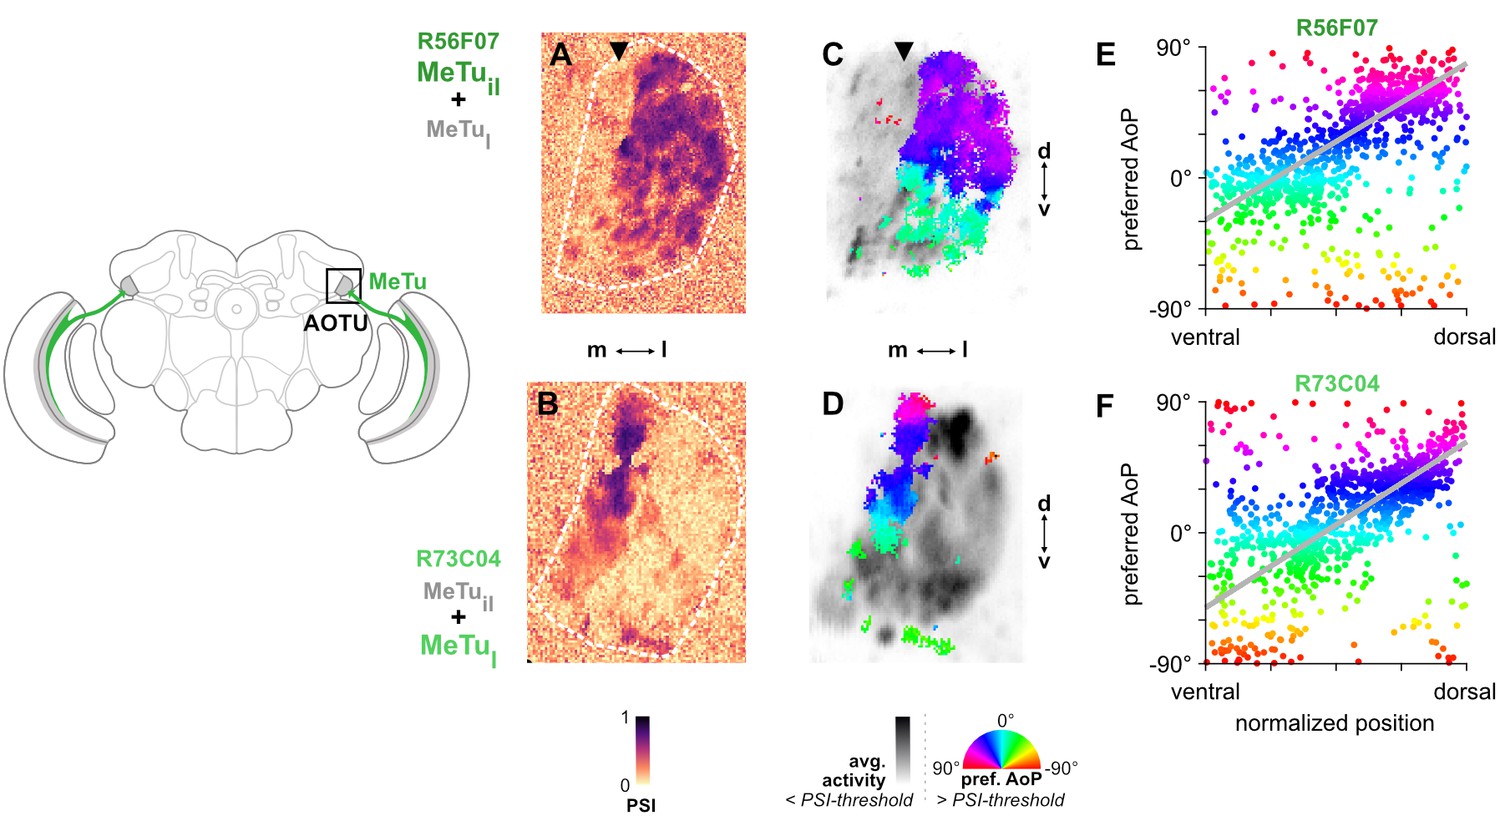
MeTu neurons convey polarization signals to the AOTU in a polarotopic fashion.
(A) Example spatial map of polarization-selectivity index (PSI) in MeTu terminals in the AOTU (R56F07-Gal4>sytGCaMP6s; predominantly MeTuil neurons innervating intermediate-lateral (il) domain, with smaller proportion of MeTula innervating lateral-anterior (la) domain, see Figure 2). Arrowhead indicates vertical band in medial region of population with low PSI values cf. average activity in (C). See also Figure 3—figure supplement 1A. (B) Example spatial map of PSI in MeTu terminals in the AOTU for an alternative driver (R73C04-Gal4>sytGCaMP6s; predominantly MeTul neurons innervating lateral (l) domains, with smaller proportion of MeTuil innervating intermediate-lateral (il) domain, see Figure 5A’). (C) Example polarization tuning map for above-threshold pixels in R56F07 MeTu neurons from the example recording in (A). (D) As in (C), for R73C04 MeTu neurons from the example recording in (B). (E) Scatter plot showing the predominant polarotopic organization of R56F07 MeTu neurons. Individual points represent pixels recorded in MeTu neurons, showing their normalized vertical position in the MEDRA and their preferred angle of polarization (AoP). Line shows fit for all pooled data (pooled ρ = 0.71, CI95 [0.54 0.80], N = 8 recordings, p < 10–4 permutation test). (F) As in (E), for R73C04 MeTu neurons (pooled ρ = 0.56, CI95 [0.42 0.69], N = 10 recordings, p < 10−4 permutation test).
Figure 3—figure supplement 1
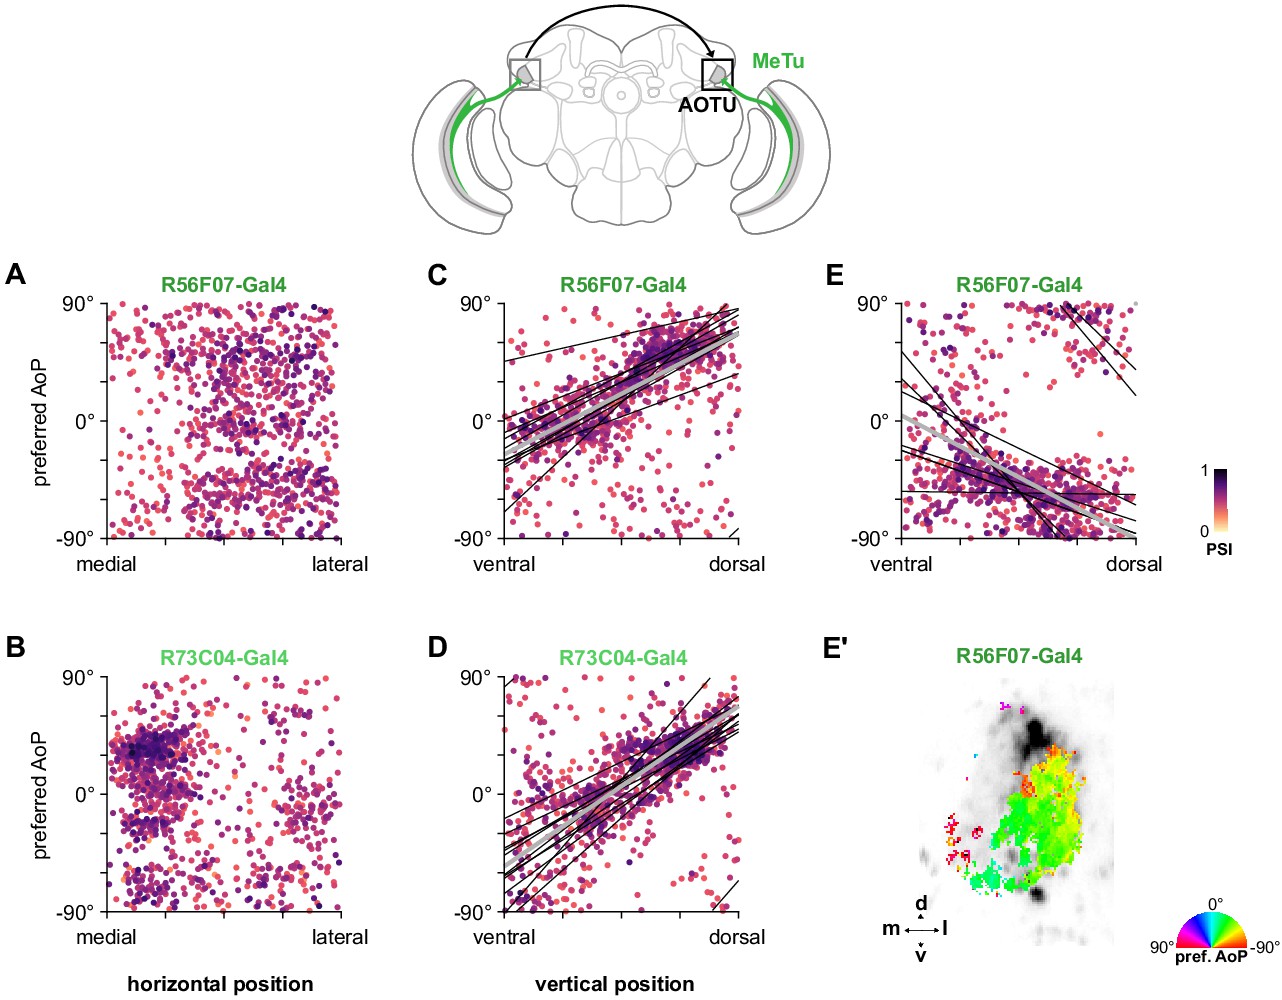
Organization of polarization-selective responses in MeTu neurons in the AOTU.
(A) Scatter plot showing the organization of polarized light responses in R56F07 MeTu neurons (pooled ρ = 0.04, CI95 [−0.22 0.22], N = 17 recordings). Individual points represent pixels recorded in MeTu neurons, showing their normalized horizontal position in the AOTU and their preferred angle of polarization (AoP). Color of individual points displays PSI value. (B) As in (A), for R73C04 MeTu neurons (pooled ρ = −0.21, CI95 [−0.32 0.11], N = 11 recordings). (C) Scatter plot showing the predominant polarotopic organization of R56F07 MeTu neurons. Thin lines show linear-circular fits for data from individual animals with significant correlations (mean individual ρ = 0.61, CI95 [0.37 0.78], N = 7 animals), thick line shows fit for all pooled data (pooled ρ = 0.71, CI95 [0.54 0.80], N = 8 recordings, p < 10−4 permutation test). (D) As in (C) for R73C04 MeTu neurons (mean individual ρ = 0.67, CI95 [0.47 0.78], N = 10 animals), thick line shows fit for all pooled data (pooled ρ = 0.56, CI95 [0.42 0.69], N = 10 recordings, p < 10−4 permutation test). (E) Scatter plot showing an occasional, second organization of responses in R56F07 MeTu neurons (mean individual ρ = −0.50, CI95 [−0.63–0.23], N = 6 animals), thick line shows fit for all pooled data (pooled ρ = −0.31, CI95 [−0.49–0.10], N = 7 recordings, p < 10−4 permutation test). (E’) Example polarization tuning map of second organization of responses.
Figure 4
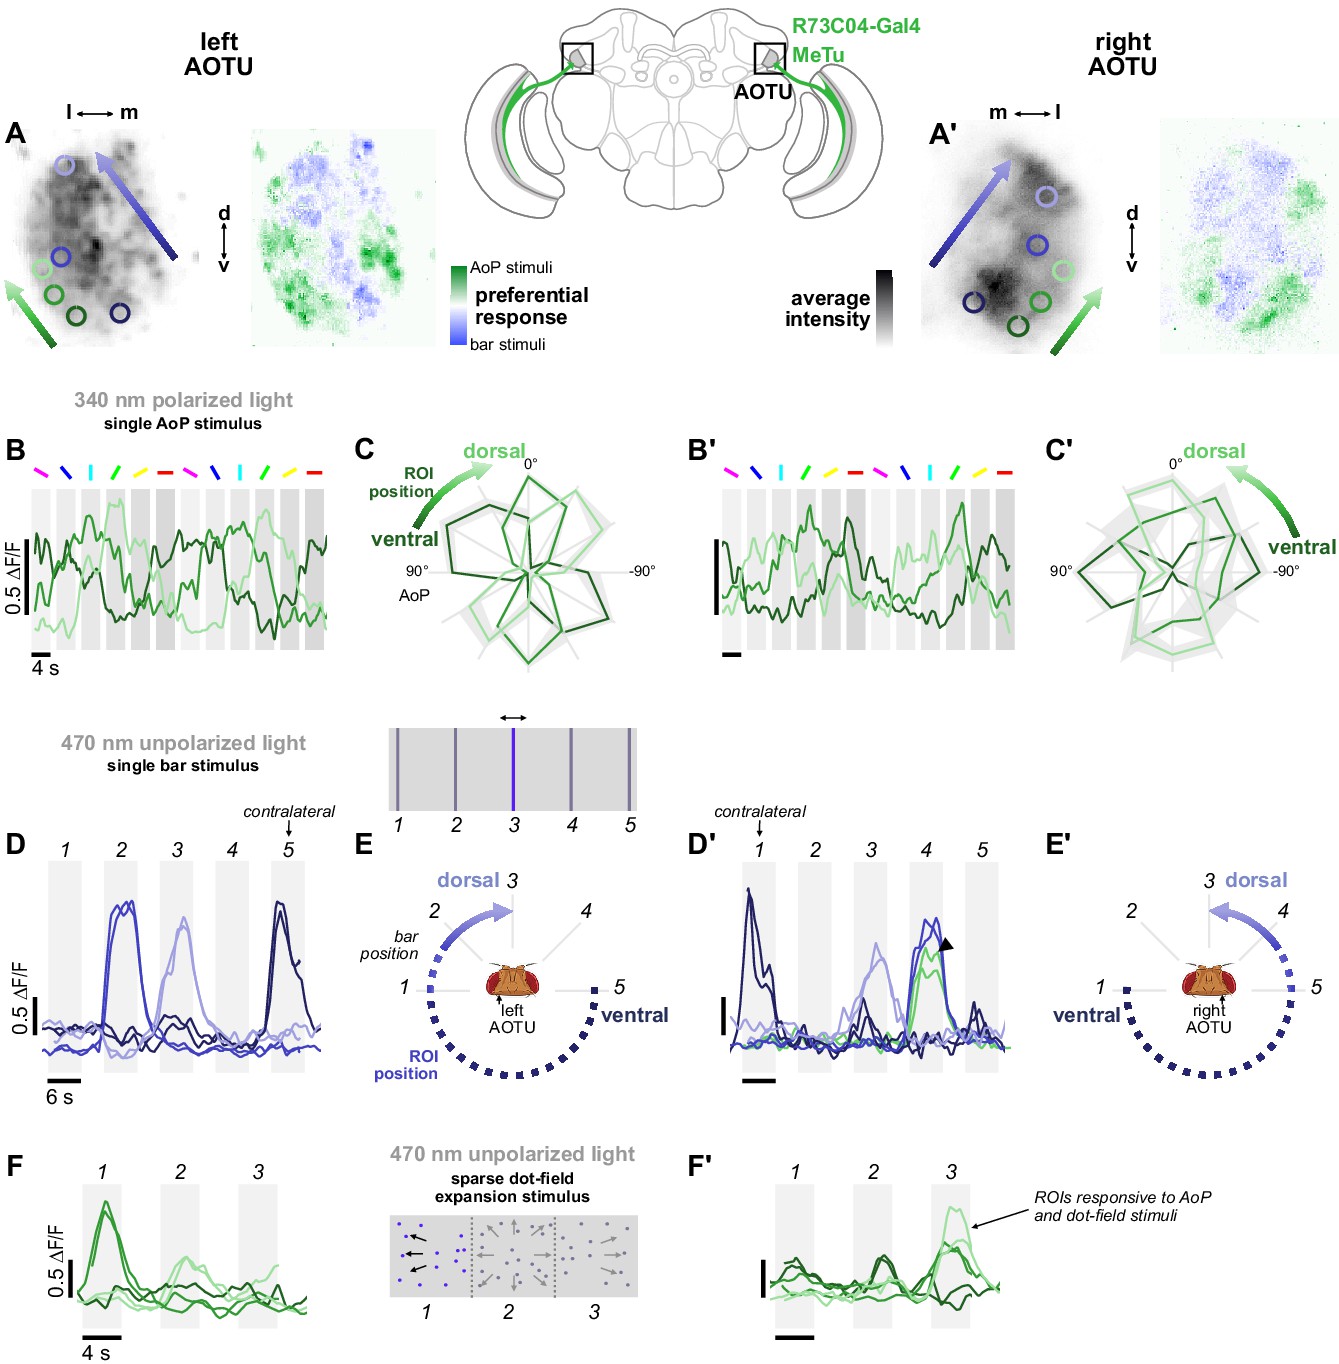
Retinotopic encoding of multiple visual features in the AOTU.
(A) Left: Example time-averaged maximum-intensity projection showing GCaMP activity in R73C04 MeTu neuron terminals in the left AOTU and examples of lateral ROIs (green) and medial ROIs (blue) (R73C04-Gal4>sytGCaMP6s). Right: corresponding spatial map of AoP-selective and bar-selective regions, based on responses to stimuli shown below. (A’) As in (A), for MeTu neurons recorded in the right AOTU in the same animal. (B) GCaMP activity in lateral MeTu neurons showing responses to different angles of polarization. Each trace shows the mean of ROIs at equivalent positions in three different animals (one ROI per animal). (B’) As in (B), for MeTu neurons recorded in the right AOTU in the same animals. (C) Normalized tuning curves for responses shown in (B). Mean ± SEM. (C’) As in (C), for MeTu neurons recorded in the right AOTU in the same animals. (D) Responses of MeTu neurons in medial positions to an unpolarized blue bar oscillating in five positions in the frontal visual field. Traces of the same color show the mean of three ROIs in equivalent positions in the AOTU in three different animals (one ROI per animal). Bar positions 1 and 5 correspond to ±90° azimuth in the contralateral visual field for recordings in the right (D’) and left (D) AOTU, respectively. (D’) As in (D), for MeTu neurons recorded in the right AOTU in the same animals. Arrowhead indicates the response of an ROI in a lateral position (green) with similar responses to the bar stimulus at position 4. (E) Proposed mapping of azimuthal position in visual field to vertical position in AOTU, based on (D). (E’) As in (E), for the right AOTU. (F) Responses of MeTu neurons in lateral positions to a sparse dot-field expansion pattern presented in three regions of the frontal visual field. Traces of the same color show the mean of three ROIs in equivalent positions in the AOTU in three different animals (one ROI per animal). (F’) As in (F), for MeTu neurons recorded in the right AOTU in the same animals.
Figure 5
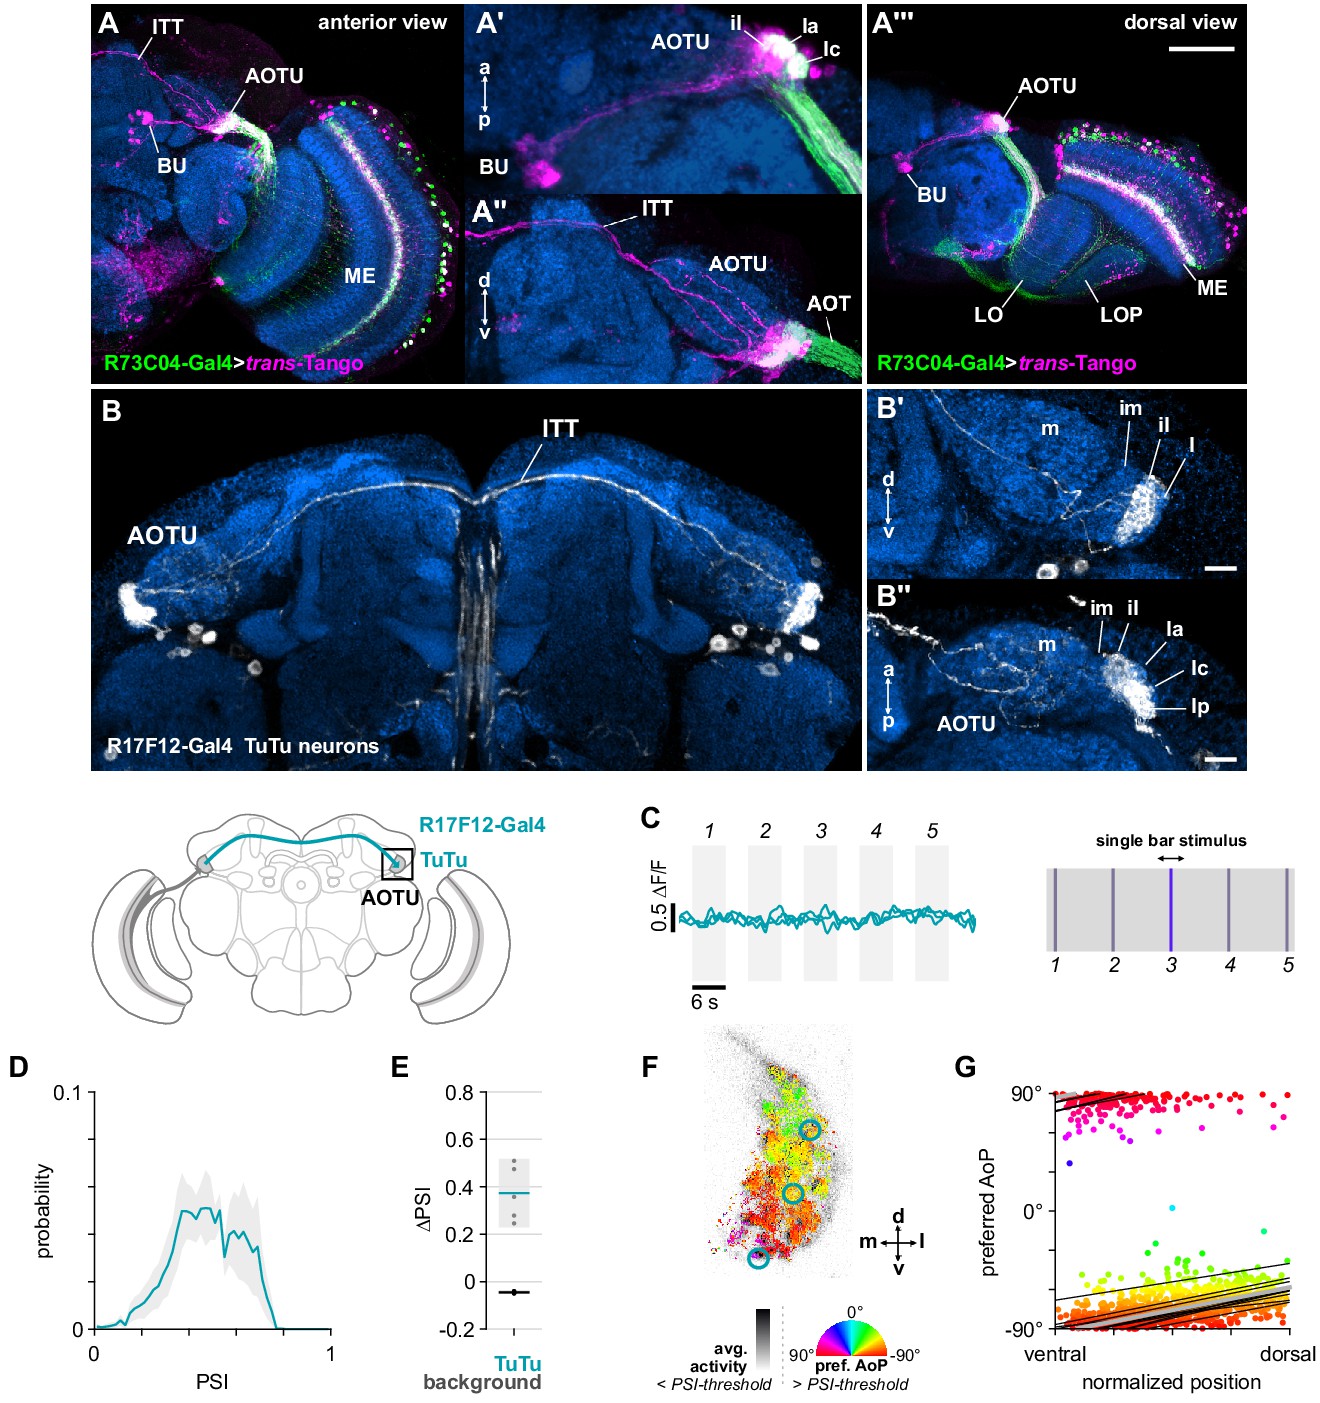
Bilateral TuTu neurons convey polarization signals to the contralateral AOTU.
(A) Confocal projection (anterior view) of trans-Tango signal (magenta) labeling putative postsynaptic partners of R73C04-Gal4 MeTu neurons (green). (A’) High-magnification dorsal view highlighting TuBu neurons projecting from AOTU to bulb (BU). (A’’) High-magnification anterior view highlighting projections to contralateral AOTU. (A’’’) Dorsal view. Scale bar denotes 50 μm. (B) Confocal projection (anterior view) of TuTu neuron expression pattern (R17F12-Gal4>GFP). High-magnification anterior (B’) and dorsal (B’’) views. Scale bars denote 10 μm. (C) Responses of presynaptic TuTu neurons to an unpolarized blue bar oscillating in five positions in the frontal visual field. Traces show the mean of three ROIs in equivalent positions in the contralateral AOTU (see F) in three different animals. (D) Probability distribution of PSI values in TuTu neurons (average PSI TuTu: 0.48, CI95 [0.34 0.63], N = 5 animals). Mean ± SEM. (E) Effect of polarizer on median PSI values versus controls with polarizer removed, within TuTu neurons (light dots) and background regions (dark dots) in individual animals (TuTu, blue line: mean ΔPSI = 0.37, CI95 [0.23 0.52], N = 5, p=0.02 t-test; background, black line: mean ΔPSI = −0.045, CI95 [−0.05 –0.04], N = 5, p < 10−4 t-test). (F) Example polarization tuning map for above-threshold pixels in the terminals of R17F12 TuTu neurons in a single imaging plane (R17F12-Gal4>sytGCaMP6s). (G) Scatter plot showing the common polarotopic organization of R17F12 TuTu neurons. Thin lines show linear-circular fits for data from individual animals with significant correlations (mean individual ρ = 0.64, CI95 [0.54 0.72], N = 5 animals), thick line shows fit for all pooled data (pooled ρ = 0.55, CI95 [0.39 0.68], N = 5 recordings, p < 10−4 permutation test).
Figure 6
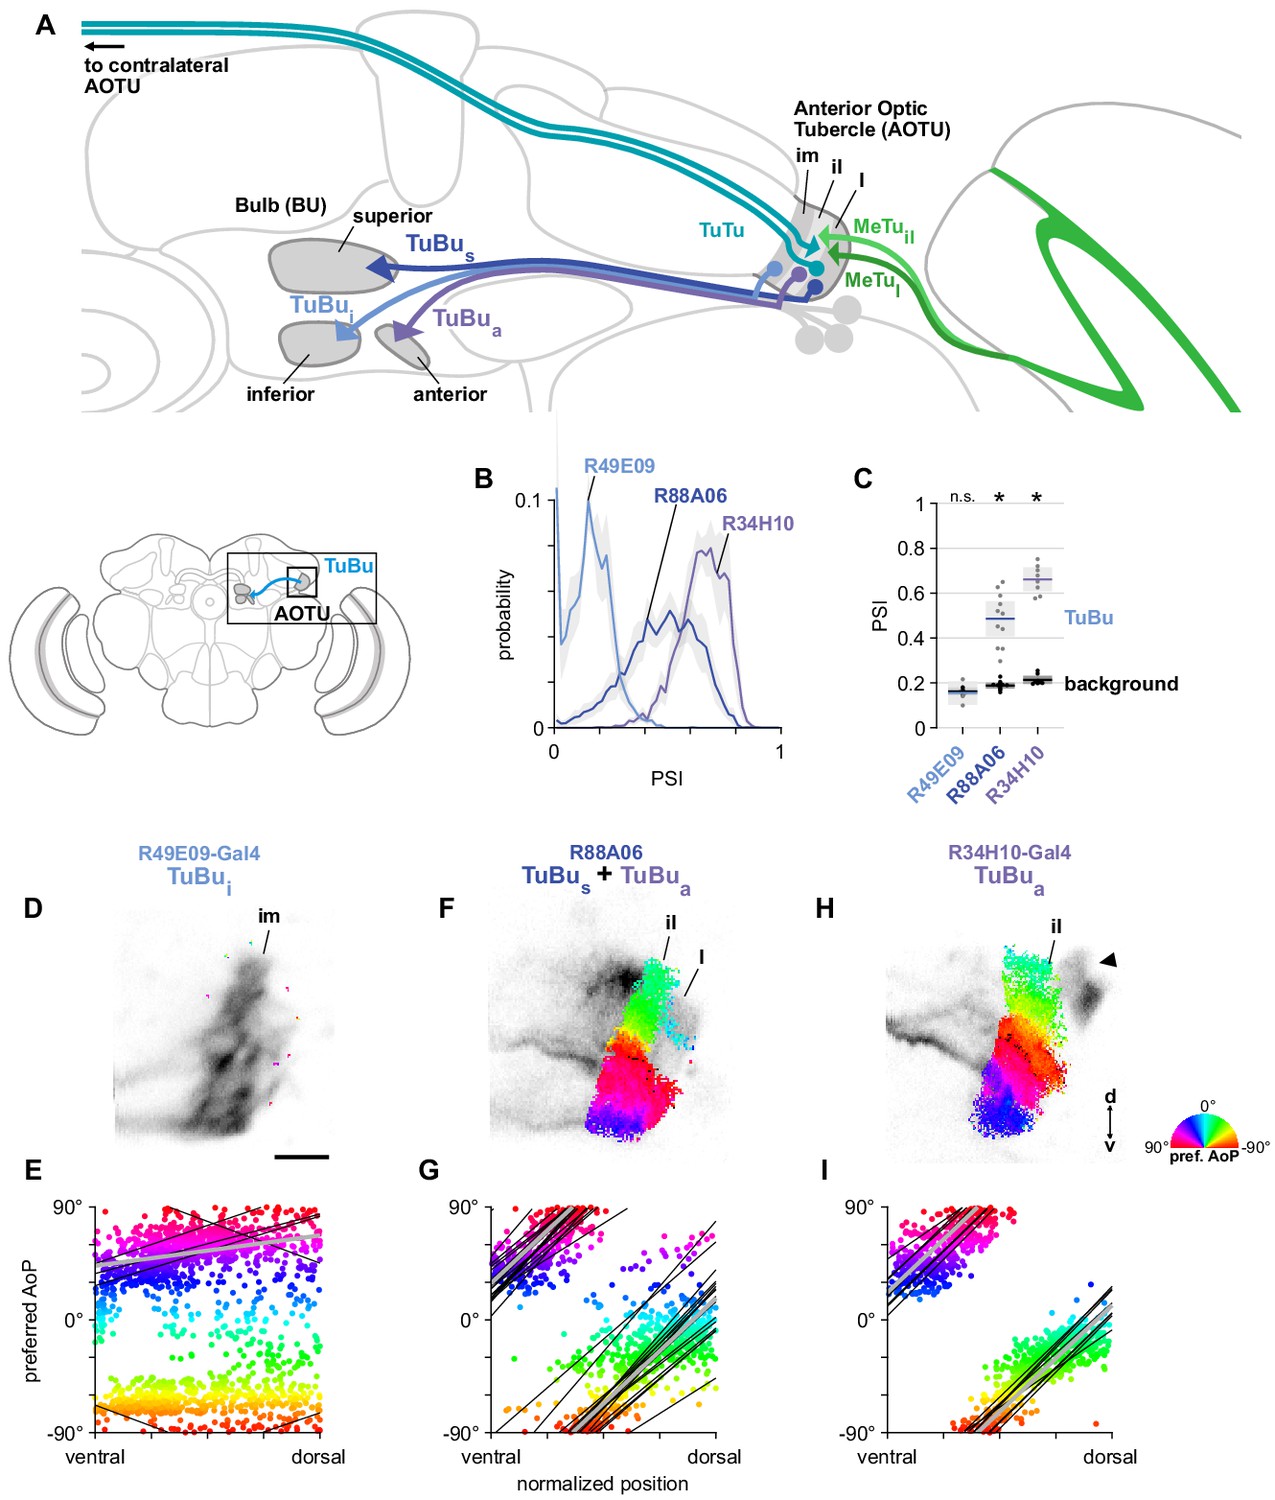
A population of TuBu neurons receives polarization signals in the AOTU.
(A) Schematic of TuBu neuron types projecting to the bulb (BU) and connectivity in the AOTU. (B) Probability distribution of PSI values in TuBu neurons recorded in the AOTU. Mean ± SEM. Summarized in (C). (C) Average PSI values within TuBu neurons (light dots) and background regions (dark dots) in individual animals (R49E09 TuBui neurons: 0.15, CI95 [0.10 0.21], background: 0.16, CI95 [0.15 0.18], N = 5 animals, p=0.76 t-test; R88A06 TuBus + TuBua neurons: 0.49, CI95 [0.41 0.56], background: 0.19, CI95 [0.18 0.20], N = 11 animals, p < 10−4 t-test; R34H10 TuBua neurons: 0.66, CI95 [0.61 0.71], background: 0.21, CI95 [0.20 0.23], N = 8 animals, p < 10−6 t-test). Shaded box denotes 95% confidence interval, asterisks denote statistically significant differences between neuron and background samples (p < 0.05, Bonferroni correction applied). (D) Example polarization tuning map for above-threshold pixels in the dendrites of TuBui neurons in a single imaging plane (R49E09-Gal4>GCaMP6s). Below-threshold pixels display average intensity in grayscale. Scale bar denotes 5 μm. (E) Scatter plot showing the lack of polarotopic organization in TuBui neurons. Individual points represent pixels recorded from TuBui neurons, showing their normalized vertical position in the AOTU and their preferred angle of polarization (AoP). Thin lines show linear-circular fits for data from individual animals with significant correlations (mean individual ρ = 0.27, CI95 [−0.41 0.53], N = 4 animals; pooled data ρ = 0.16, CI95 [−0.32 0.53], N = 5 recordings, p < 10−4 permutation test). (F) As in (D), for a population containing TuBus and TuBua neurons (R88A06-Gal4>GCaMP6s). (G) As in (E), for the common polarotopic organization in TuBus and TuBua neurons (mean individual ρ = 0.74, CI95 [0.55 0.81], N = 11 animals; pooled data ρ = 0.12, CI95 [0 0.21], N = 11 recordings, p < 10−4 permutation test). (H) As in (D), for TuBua neurons (R34H10-Gal4>GCaMP6s). Arrowhead indicates cell bodies excluded from analysis. (I) As in (E), for the common polarotopic organization in TuBua neurons (mean individual ρ = 0.72, CI95 [0.46 0.89], N = 8 animals; pooled data ρ = 0.64, CI95 [0.03 0.89], N = 8 recordings, p < 10−4 permutation test).
Figure 7 with 1 supplement

The anterior bulb is an entry point for polarization signals into the central complex.
(A) Example spatial maps of polarization-selectivity index (PSI, top) and tuning (bottom) in TuBu neuron output micro-glomeruli in the superior and anterior regions of the left (A) and right (A’) bulbs in an individual fly (R88A06-Gal4>sytGCaMP6s). Scale bar denotes 5 μm. (B) Probability distribution of PSI values in all pixels recorded in TuBu neurons in the three regions of the bulb (BU). Mean ± SEM. Summarized in (C). (C) Average PSI values within TuBu neurons in the BU (light dots) and background regions (dark dots) in individual animals, including responsive and non-responsive (below PSI-threshold) pixels (BUi neurons: 0.09, CI95 [0.06 0.12]; background: 0.09, CI95 [0.08 0.09], N = 12 animals, p=0.68 t-test; BUs neurons: 0.25, CI95 [0.21 0.28], background: 0.22, CI95 [0.20 0.24], N = 6 animals, p=0.18 t-test; BUa (R88A06) neurons: 0.55, CI95 [0.39 0.71], background: 0.21, CI95 [0.20 0.23], N = 5 animals, p=0.0048 t-test; (BUa) (R34H10) neurons: 0.59, CI95 [0.50 0.66], background: 0.20, CI95 [0.18 0.22], N = 7 animals, p < 10−4 t-test). Shaded box denotes 95% confidence interval, asterisks denote statistically significant differences between neuron and background samples (p < 0.05, Bonferroni correction applied). (D) Probability distribution of PSI values in 10% brightest pixels recorded in TuBus neurons in BUs. Mean ± SEM. Summarized in (E). (E) Effect of polarizer on median PSI values versus controls with polarizer removed, within TuBu neurons (light dots) and background regions (dark dots) in individual animals (mean ΔPSI TuBus neurons: 0.31, CI95 [0.21 0.41], N = 6, p=0.0005 t-test, background: 0.03, CI95 [−0.05 –0.01], N = 6, p=0.02, t-test; TuBua neurons (R88A06, center column): 0.62, CI95 [0.51 0.73], N = 5, p < 10−4 t-test, background: −0.02, CI95 [−0.04 –0.01], N = 5, p=0.18, t-test; TuBua neurons (R34H10, right column): 0.51, CI95 [0.44 0.58], N = 7, p < 10−5 t-test, background: −0.02, CI95 [0.01 0.04], N = 7, p=0.19, t-test). Shaded box denotes 95% confidence interval. (F) Polar histogram of preferred angles of polarization in TuBus neurons recorded in the left (F) and right (F’) superior bulb. Normalized probabilities in each bin are displayed as area of wedge; radial lengths of wedges not directly comparable. Arc denotes mean resultant angle ±95% confidence interval (TuBus left: 0.35, –43.0°, CI95 ±17.3°, N = 4, p=0.003 Rayleigh uniformity test; TuBus right: 0.35, 30.8°, CI95 ±14.9°, N = 5, p=0.0005 Rayleigh uniformity test). (G) As in (F), for TuBua neurons recorded in the anterior bulb (R34H10) (TuBua left: 0.08, –60.2°, CI95 N/A, N = 6, p=0.61 Rayleigh uniformity test; TuBua right: 0.14, 66.12°, CI95 N/A, N = 6, p=0.22 Rayleigh uniformity test).
Figure 7—figure supplement 1
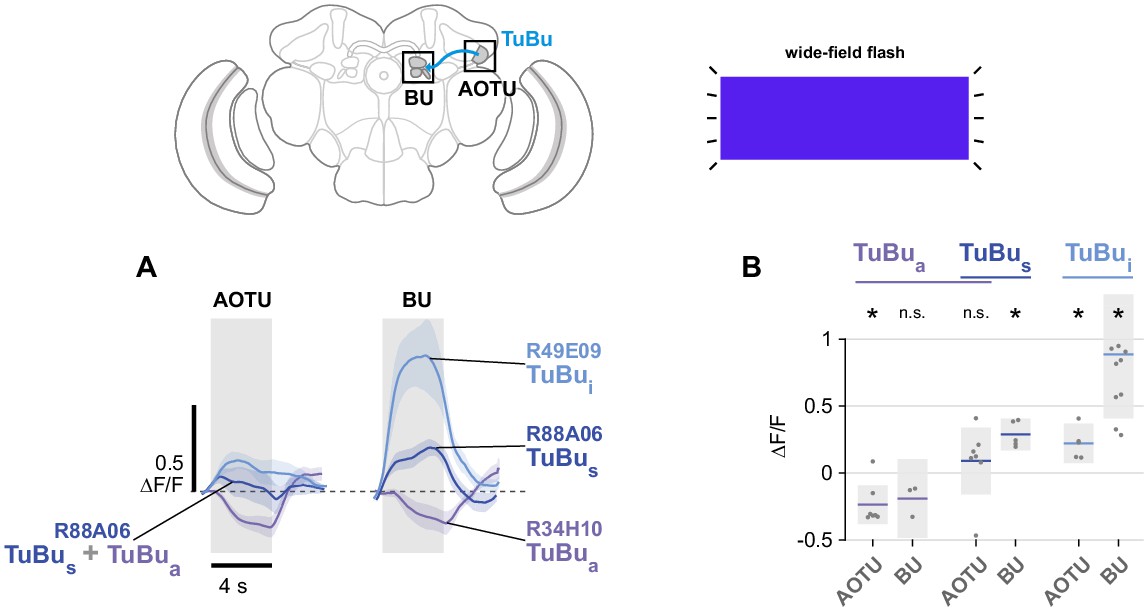
Unpolarized flash responses in TuBu neurons.
(A) Average responses of all TuBu neurons in each population to 4 s blue light flashes, recorded in the anterior optic tubercle (AOTU) (GCaMP6s) and bulb (BU) (sytGCaMP6s). Dashed line indicates 0 ΔF/F baseline. Mean ± SEM. (B) Peak responses for individual animals and their mean. (pk ΔF/F TuBua AOTU: −0.23, CI95 [−0.38 –0.09], N = 7, p=0.008, BU: −0.19, CI95 [−0.48 0.11], N = 3, p=0.11; TuBus + TuBua AOTU: 0.10, CI95 [−0.15 0.35], N = 7, p=0.38, BU: 0.30, CI95 [0.18 0.42], N = 5, p=0.02; TuBui AOTU: 0.23, CI95 [0.08 0.38], N = 5, p=0.013, BU: 0.90, CI95 [0.42 1.39], N = 10, p=0.002). Shaded box denotes 95% confidence interval, asterisks denote distributions with mean significantly different from zero (p < 0.05, Bonferroni correction applied).
Figure 8 with 1 supplement
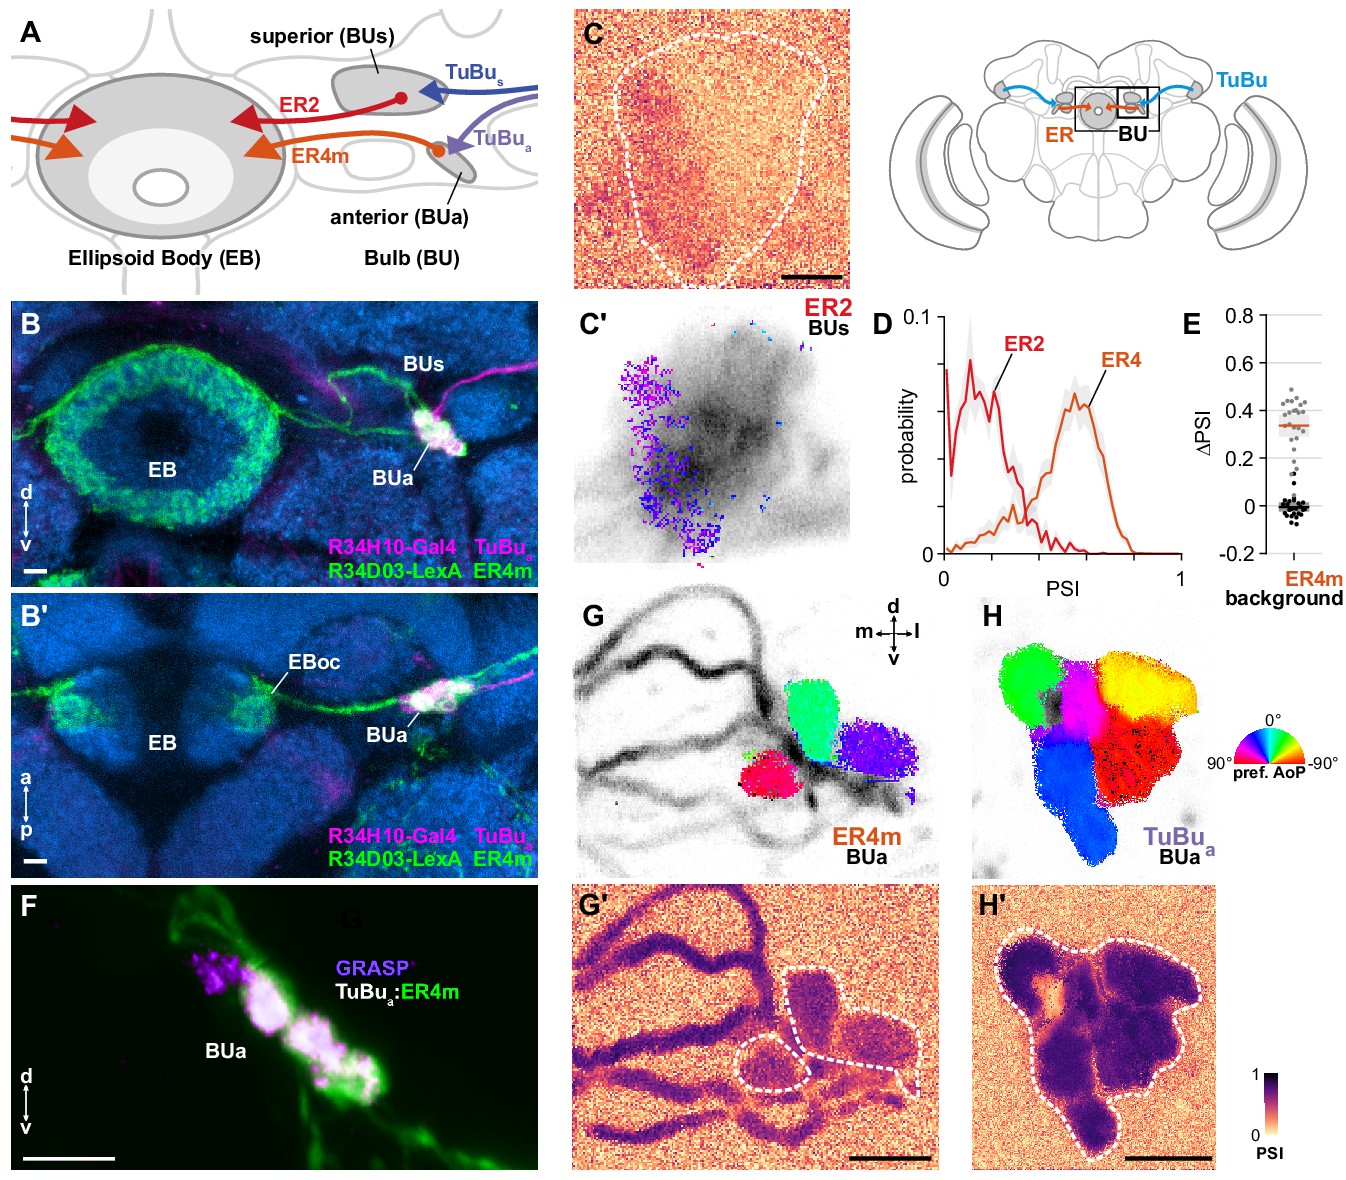
ER4m ring neurons receive polarization-tuned responses from TuBu neurons.
(A) Schematic of TuBu and ring neuron (ER) connectivity in the bulb (BU). (B) Confocal projection (anterior view) of dual-labeled TuBua neurons (R34H10-Gal4>RFP, magenta) and ER4m neurons (R34D03-Gal4>GFP, green), indicating overlap in anterior bulb (BUa). (B’) Dorsal view. Scale bars denote 5 μm. (C) Example spatial maps of polarization-selectivity index (PSI) and polarization tuning (C’) for ER2 dendrites recorded in the superior bulb (R19C08-Gal4>GCaMP6s). Scale bar denotes 5 μm. (D) Probability distributions of PSI values in ring neurons recorded in the bulb (average PSI ER2 neurons: 0.17, CI95 [0.09 0.24], background: 0.20, CI95 [0.16 0.24], N = 4 animals, p=0.29 t-test; ER4m neurons: 0.51, CI95 [0.46 0.55], background: 0.22, CI95 [0.20 0.24], N = 25 animals, p < 10−6 t-test). Mean ± SEM. (E) Effect of polarizer on median PSI values versus controls with polarizer removed, within ER4m neurons (light dots) and background regions (dark dots) in individual animals (mean ΔPSI ER4m neurons: 0.34, CI95 [0.29 0.38], N = 25, p < 10−6 t-test, background: −0.05, CI95 [−0.02 0.01], N = 25, p=0.58, t-test). (F) Confocal projection (anterior view) of activity-dependent synaptic GRASP (GFP reconstitution across synaptic partners) signal between presynaptic TuBua and postsynaptic ER4m neurons in anterior bulb (BUa). Scale bar denotes 5 μm. (G) Example polarization tuning map and corresponding PSI map (G’) in ER4m dendrites in BUa (R34D03-Gal4>GCaMP6s). Pixels falling outside an ROI drawn around the neurons of interest (shown in G’), show average intensity in grayscale. Clusters of similar colors correspond to individual polarization-tuned micro-glomeruli. Individual axons projecting medially to the EB are visible leaving the left side of the image. Scale bar denotes 5 μm. (H) As in (G), for TuBua output micro-glomeruli at an approximately corresponding location in BUa (R34H10-Gal4>sytGCaMP6s). Clusters of similar colors correspond to individual polarization-tuned micro-glomeruli.
Figure 8—figure supplement 1
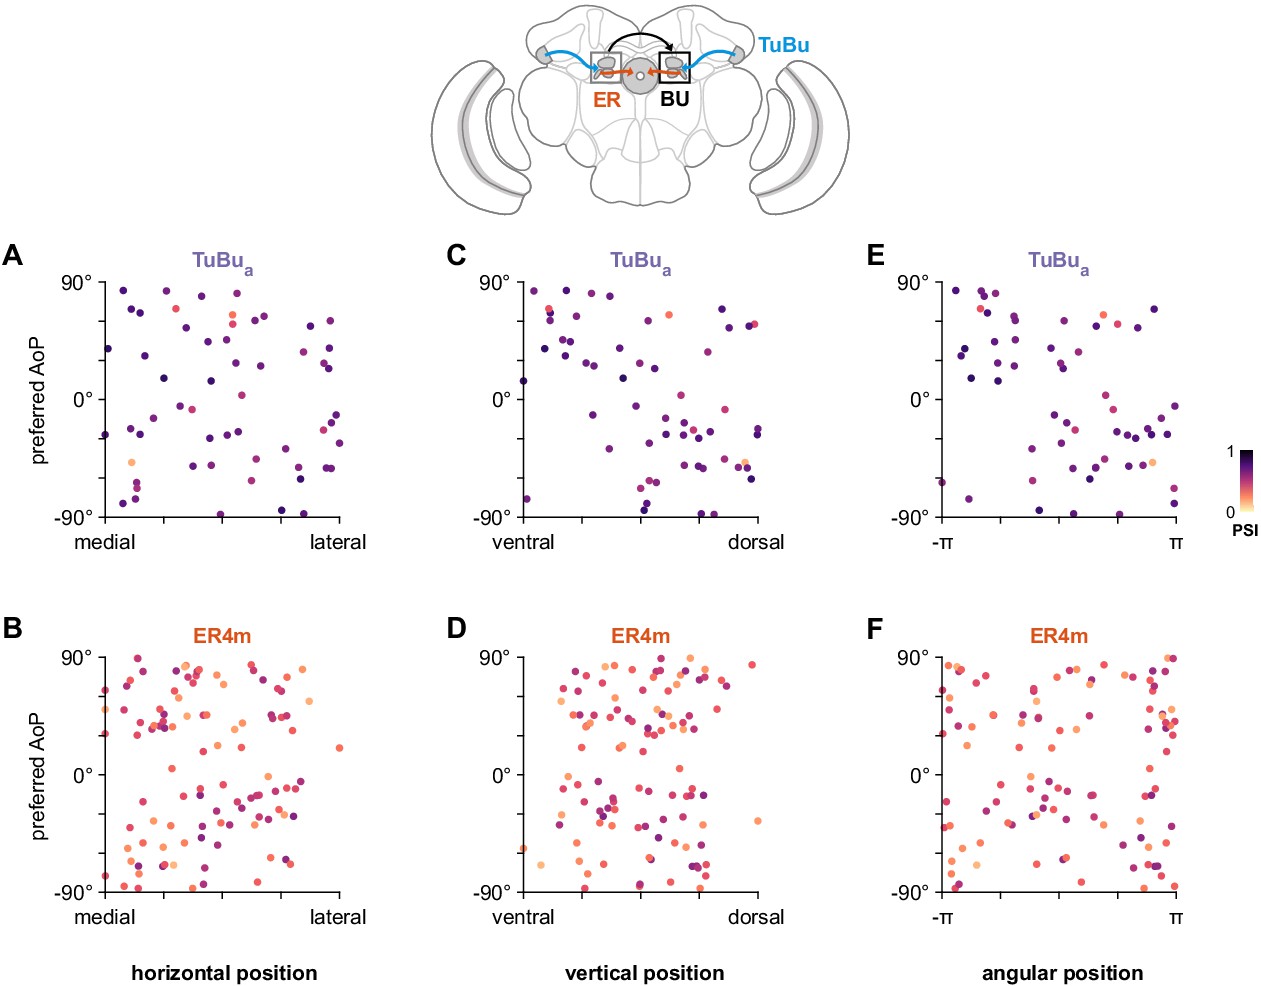
Unstructured organization of preferred angle of polarization in the anterior bulb.
(A) Scatter plot showing the horizontal organization of TuBua tunings in the anterior bulb (BUa). Individual points represent ROIs drawn on micro-glomeruli, showing their normalized horizontal position within the BUa and their preferred angle of polarization (AoP). Color of individual points displays PSI value (TuBua: N = 8 animals, 14 recordings, comprising six left BU recordings: 29 ROIs, mean 4.8 ROIs per animal, SEM ±1.0; eight right BU recordings: 28 ROIs, mean 4.7 per animal, SEM ±0.8; mean ROI PSI 0.65, SEM ±0.12; 0 significant individual linear-circular correlations; pooled data ρ = −0.02, p=0.91 permutation test). (B) As in (A), for horizontal organization of ER4m tunings (ER4m: N = 25 animals, 26 recordings, comprising two left BU recordings: 8 ROIs, mean 4.0 ROIs per animal, SEM ±0.0; 24 right BU recordings: 96 ROIs, mean 4.0 ROIs per animal, SEM ±0.8; mean ROI PSI 0.38, SEM ±0.12; one significant individual linear-circular correlation, ρ = −0.76; pooled data ρ = 0.01, p=0.96 permutation test). (C) As in (A), for vertical organization of TuBua tunings (one significant individual linear-circular correlation, ρ = −0.61; pooled data ρ = 0.46, p=0.002 permutation test). (D) As in (C), for vertical organization of ER4m tunings (0 significant individual linear-circular correlations; pooled data ρ = 0.09, p=0.47 permutation test). (E) As in (A), for circular organization of TuBua tunings (five significant individual circular-circular correlations, mean ρ = 0.84, SEM ±0.69; pooled data ρ = −0.43, p=0.23 permutation test). (F) As in (E), for circular organization of ER4m tunings (three significant individual circular-circular correlations, mean ρ = 0.98, SEM ±0.34; pooled data ρ = 0.02, p=0.98 permutation test).
Figure 9
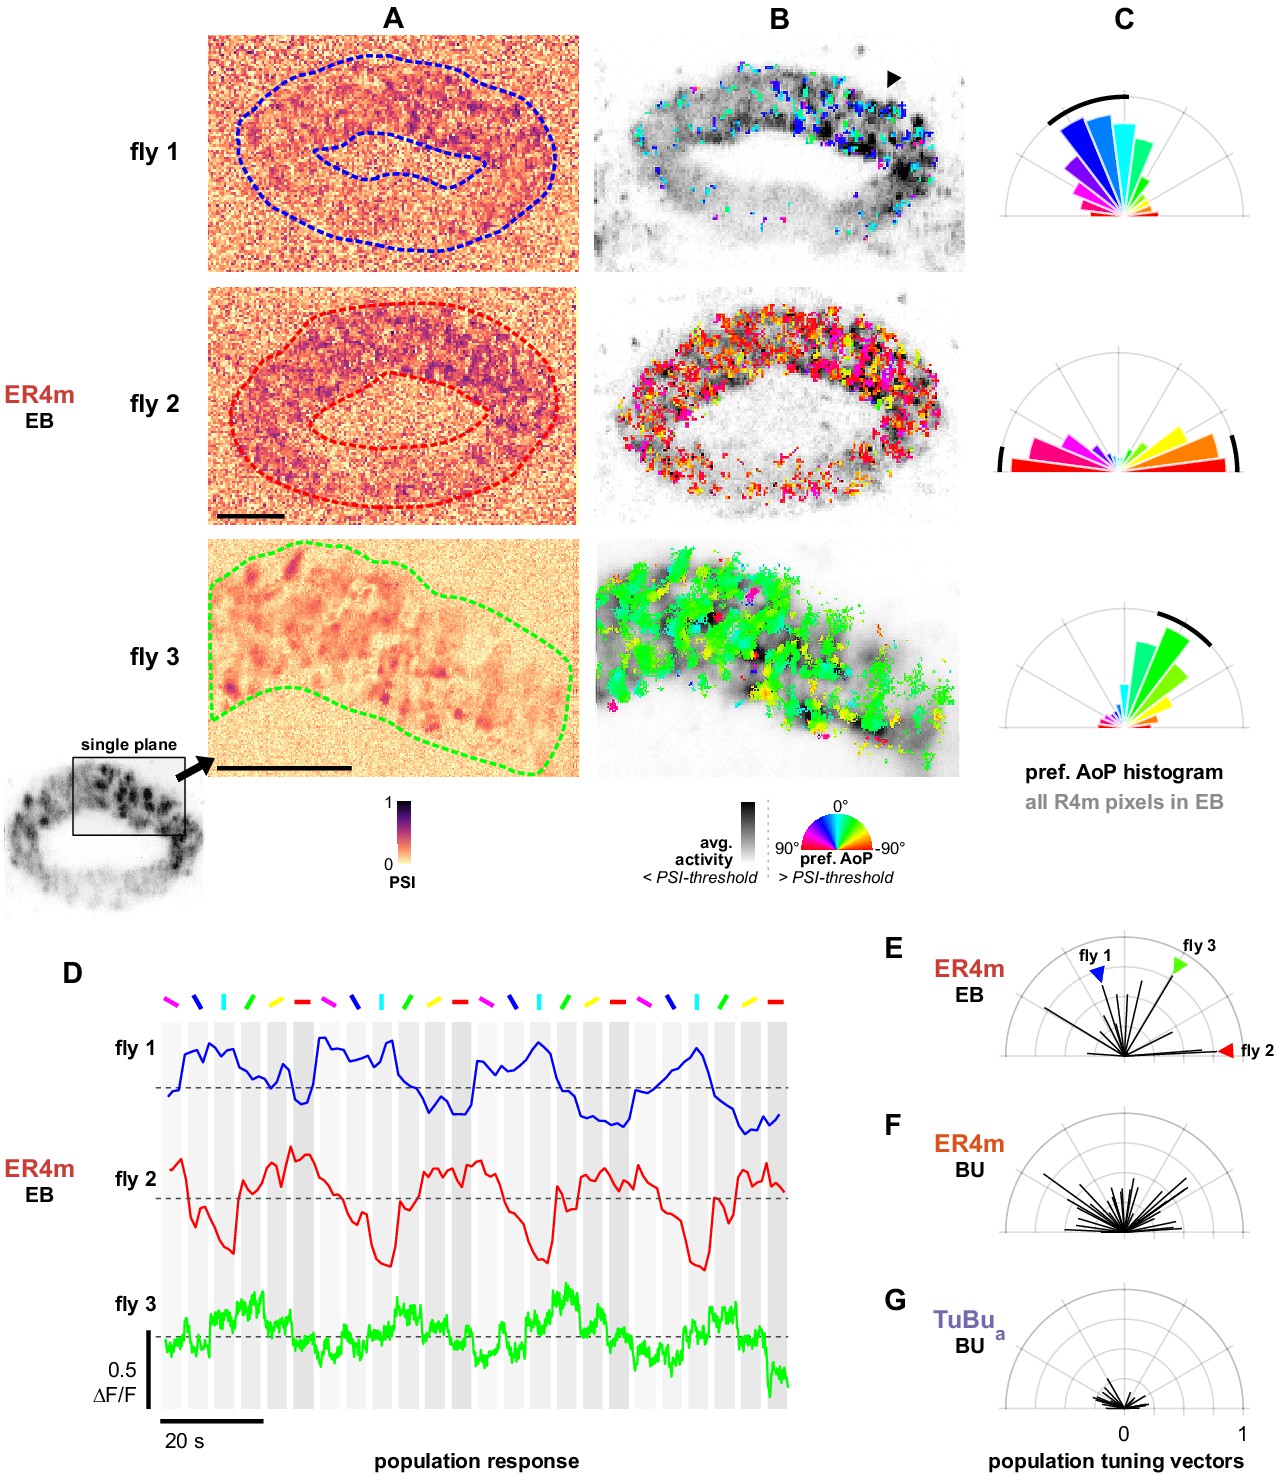
Populations of ER4m ring neurons exhibit a preferred angle of polarization.
(A) Example spatial maps of polarization-selectivity index (PSI) in ER4m synapses recorded in the ellipsoid body (EB) (R34D03-Gal4>sytGCaMP6s). Data shown are from maximum-intensity projections through the EB (top, middle) or a single plane (bottom). (B) Example polarization tuning maps corresponding to recordings in (A). Pixels with a below-threshold PSI value, or falling outside an ROI drawn around the ER4m population, show average intensity in grayscale. Scale bars denote 10 μm. (C) Polar histograms of preferred angle of polarization in all pixels within the ROIs in (A). Normalized probabilities in each bin are displayed as area of wedge; radial lengths of wedges not directly comparable. Arc denotes mean resultant angle ±95% confidence interval (resultant length and angle fly 1: 0.57, 18.7°, CI95 ±16.6°, N = 4, p=0.002 Rayleigh uniformity test; fly 2: 0.72, –87.3°, CI95 ±15.0°, p=0.001 Rayleigh uniformity test; fly 3: 0.71, –31.6°, CI95 ±15.4°, p=0.001 Rayleigh uniformity test). (D) Average GCaMP activity in the ROIs in (A) in response to different angles of polarization. Dashed lines indicate 0 ΔF/F baseline. (E) Resultant tuning vectors for the population of all recorded ER4m synapses in the EB of individual animals (mean length, pixel-based: 0.51, SEM ±0.44, N = 7, p < 10−6 t-test). Arrowheads indicate data for examples in A‒D. (F) Resultant tuning vectors for the population of all recorded ER4m neurons recorded in the left or right BU of individual animals (mean length, pixel-based: 0.39, SEM ±0.32, N = 25, p < 10−6 tailed t-test; ROI-based: 0.36, SEM ±0.46, N = 25, p=0.005 tailed t-test, 134 ROIs,>3 ROIs per BU). (G) Resultant tuning vectors for the population of all recorded TuBua neurons recorded in the left or right BU of individual animals (mean length, pixel-based: 0.18, SEM ±0.13, N = 7, p < 10−6 tailed t-test; ROI-based: 0.14, SEM ±0.15, N = 7, p=0.0002 tailed t-test, 101 ROIs,>3 ROIs per BU).
Figure 10 with 1 supplement
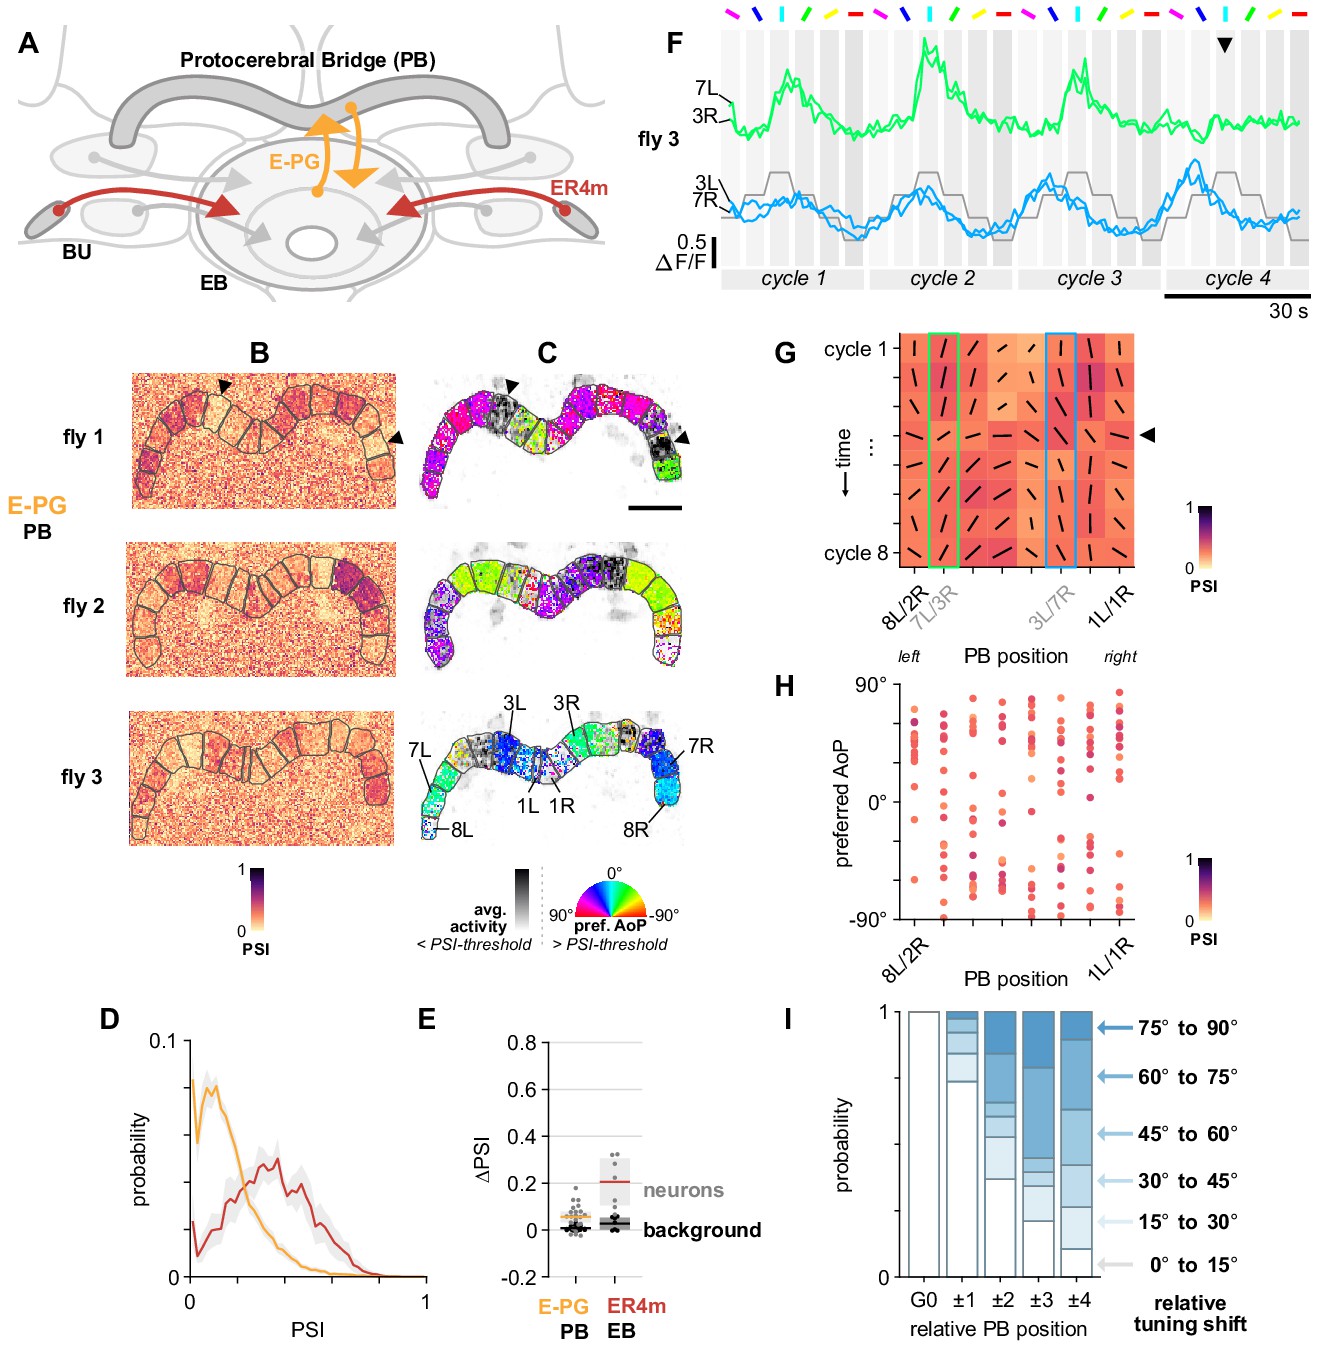
E-PG neurons respond to polarized light with flexible tuning and no fixed polarotopic map.
(A) Schematic of E-PG columnar neuron projections and connectivity with tangential ring neurons in the ellipsoid body (EB). See also Figure 10—figure supplement 1D. (B) Example spatial maps of polarization-selectivity index (PSI) in E-PG synapses recorded in the protocerebral bridge (PB) (SS00096-Gal4>sytGCaMP6s). Data shown are from maximum-selectivity projections through the PB. ROIs (gray) demarcate glomeruli. (C) Example polarization tuning maps corresponding to recordings in (A). Pixels with a below-threshold PSI value, or falling outside an ROI drawn around the PB, show average intensity in grayscale. Scale bar denotes 25 μm. (D) Probability distributions of PSI values in E-PG neurons recorded in the PB and ER4m neurons recorded in the EB (average PSI E-PG neurons: 0.14, CI95 [0.12 0.17], background: 0.19, CI95 [0.19 0.20], N = 22 animals, p=0.0001 t-test; ER4m neurons: 0.34, CI95 [0.24 0.44], background: 0.21, CI95 [0.19 0.24], N = 7 animals, p=0.02 t-test). Mean ± SEM. (E) Effect of polarizer on median PSI values versus controls with polarizer removed, within E-PG and ER4m neurons (light dots) and background regions (dark dots) in individual animals (mean ΔPSI E-PG neurons: 0.06, CI95 [0.03 0.08], N = 22, p < 10−4 t-test, background: 0.01, CI95 [0.00 0.01], N = 22, p=0.0007, t-test; ER4m neurons: 0.21, CI95 [0.11 0.31], N = 7, p=0.002 t-test, background: 0.03, CI95 [0.00 0.05], N = 7, p=0.04, t-test). (F) Activity in two pairs of L/R ROIs in (C) (fly 3) in response to different angles of polarization. Arrowhead indicates position of expected peak. (G) Cycle-by-cycle characterization of E-PG responses across the PB in a single recording (C,F) (fly 3). Orientation of individual vectors represents preferred AoP, length represents PSI (grid spacing equals PSI of 1). Highlighted boxes indicate extended data for pairs shown in (F). Arrowhead indicates the same cycle as the arrowhead in (F). (H) Scatter plot showing position of paired E-PG glomeruli in the PB and preferred angle of polarization (AoP) (pooled data ρ = 0.23, N = 19 animals, p=0.006 permutation test, 152 ROIs, mean ROI PSI 0.34, SEM 0.06; five significant individual circular-circular correlations, mean ρ = 0.46, SEM 0.45). (I) Normalized probability of tuning shift magnitude with distance from the glomerulus with the highest PSI value (mean shift from position 2 to 3, p=0.21; position 3 to 4, p=0.65; position 2 to 4, p=0.08; all other pairs p < 10−3, N = 19 animals, 152 ROIs). See also Figure 10—figure supplement 1F,G.
Figure 10—figure supplement 1
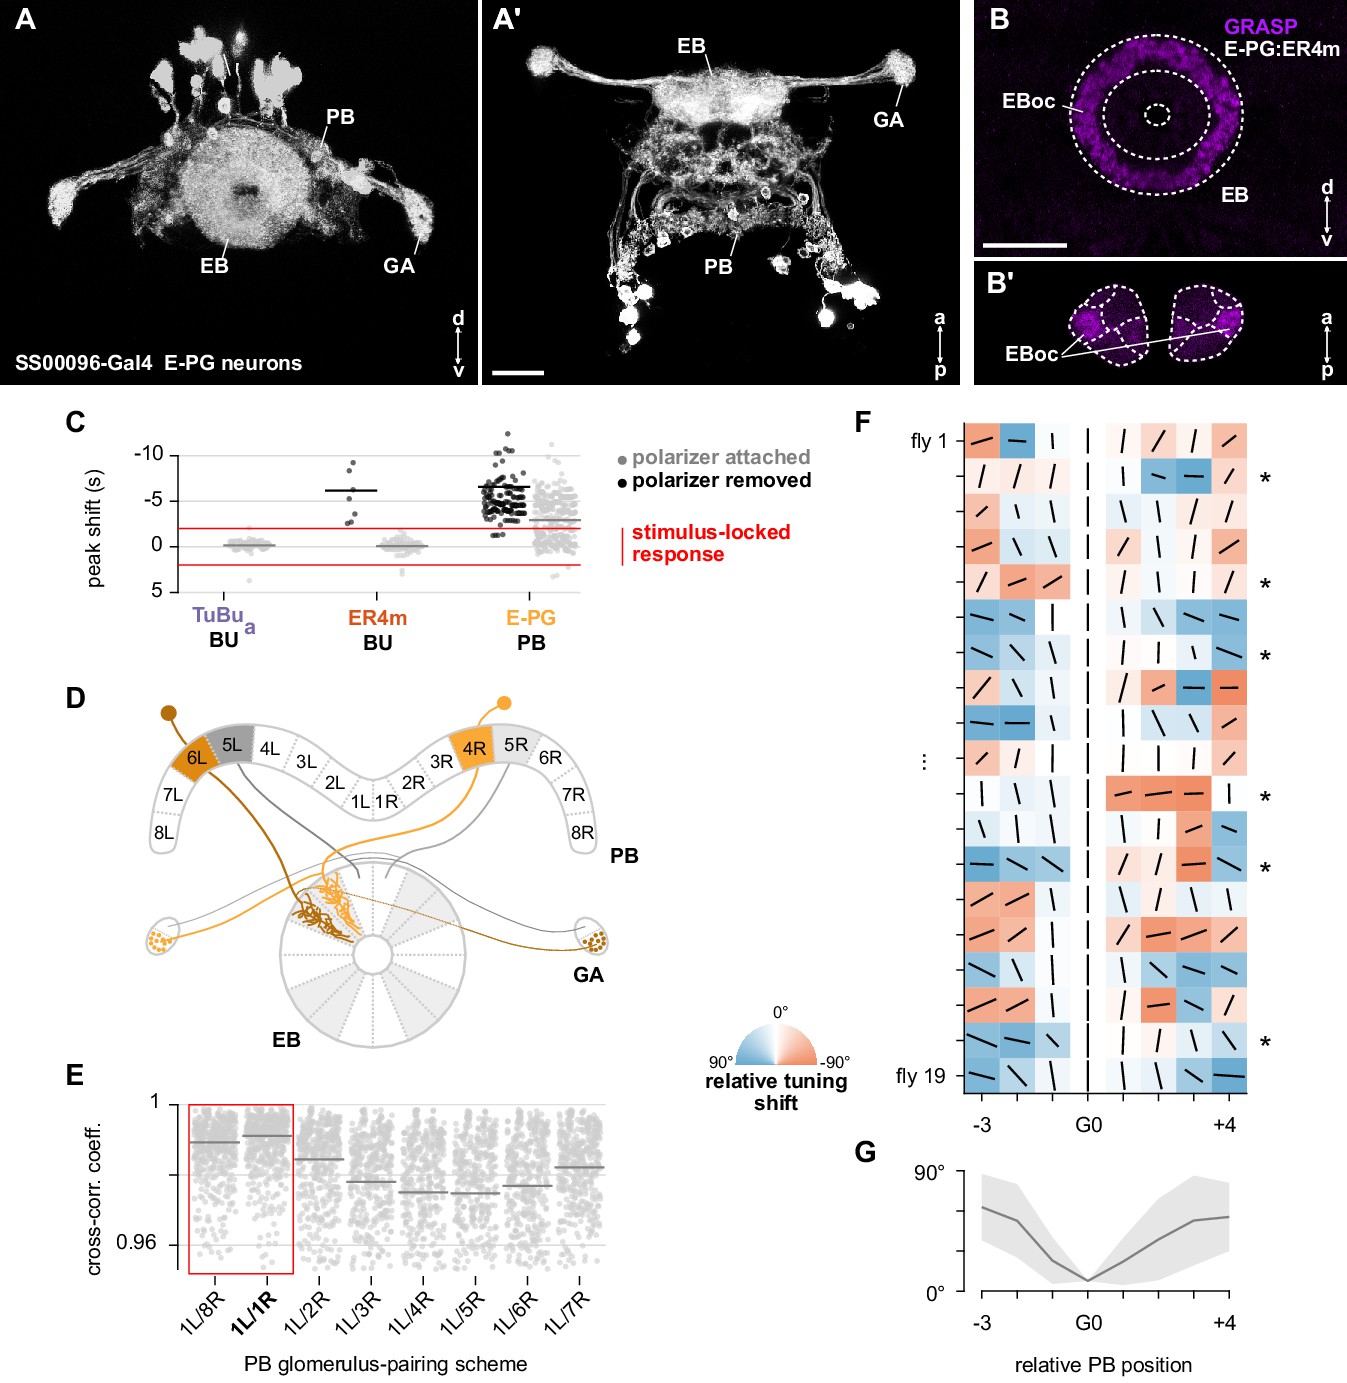
E-PG neurons show inconsistent responses and variable tunings.
(A) Confocal projection (anterior view) of E-PG expression pattern in the ellipsoid body (EB), protocerebral bridge (PB) and gall (GA) (SS00096-Gal4>GFP). (A’) Dorsal view. Scale bar denotes 25 μm. (B) Confocal projection of GRASP (GFP reconstitution across synaptic partners) signal for connections from E-PG to ER4m neurons in the EB. (B’) Dorsal view. Scale bar denotes 25 μm. (C) Shift in time of the first peak of each ROI’s auto-correlation function, relative to the period of the polarizer (0 s). Each dot represents data from a single ROI. Red lines indicate a window of ±2 s: a peak shift of greater magnitude indicates a response which was not phase-locked with the polarizer stimulus (median peak shift TuBua: attached 0.15 s, SEM ±0.06, N = 7 animals, 85 ROIs included; removed N/A (no ROIs showed significant auto-correlation peak due to lack of periodicity); ER4m: attached 0.07 s, SEM ±0.05, N = 25 animals, 126 ROIs included; removed 5.76 s, SEM ±2.82, N = 9 animals, 10 ROIs included; E-PG: attached 2.73 s, SEM ±0.12, N = 22 animals, 504 ROIs included; removed 4.79 s, SEM ±0.43, N = 18 animals, 175 ROIs included). (D) Summary schematic of E-PG neuron innervation patterns in the ellipsoid body (EB), protocerebral bridge (PB) and gall (GA). Highlighting indicates the L/R pairing scheme used. 9L/9R in PB not shown. (E) Normalized cross-correlation coefficient for all E-PG pairs of left and right glomeruli in the PB, using different pairing schemes. Each scheme name gives the pairing of 1L and its right PB partner; all other pairs within the scheme follow the same logic. Each dot represents data from a pair of glomeruli. Horizontal lines mark the Fisher z-transformed mean coefficient (N = 22 animals). Highlighted schemes (red outline) represent pairings of E-PGs innervating neighboring wedges of the EB, deemed the most plausible. The pairing scheme 1L/1R is used in this study. (F) Relative tunings in individual animals. Orientation of lines represent preferred AoP (relative to G0), length of each line indicates PSI (height of each square is equal to a PSI value of 1). Asterisks indicate animals with significant individual circular-circular correlations between position and preferred AoP. (G) Average tuning shift (relative to G0), summarizing data in G. Mean ± SEM (N = 19).
Appendix 1—figure 1
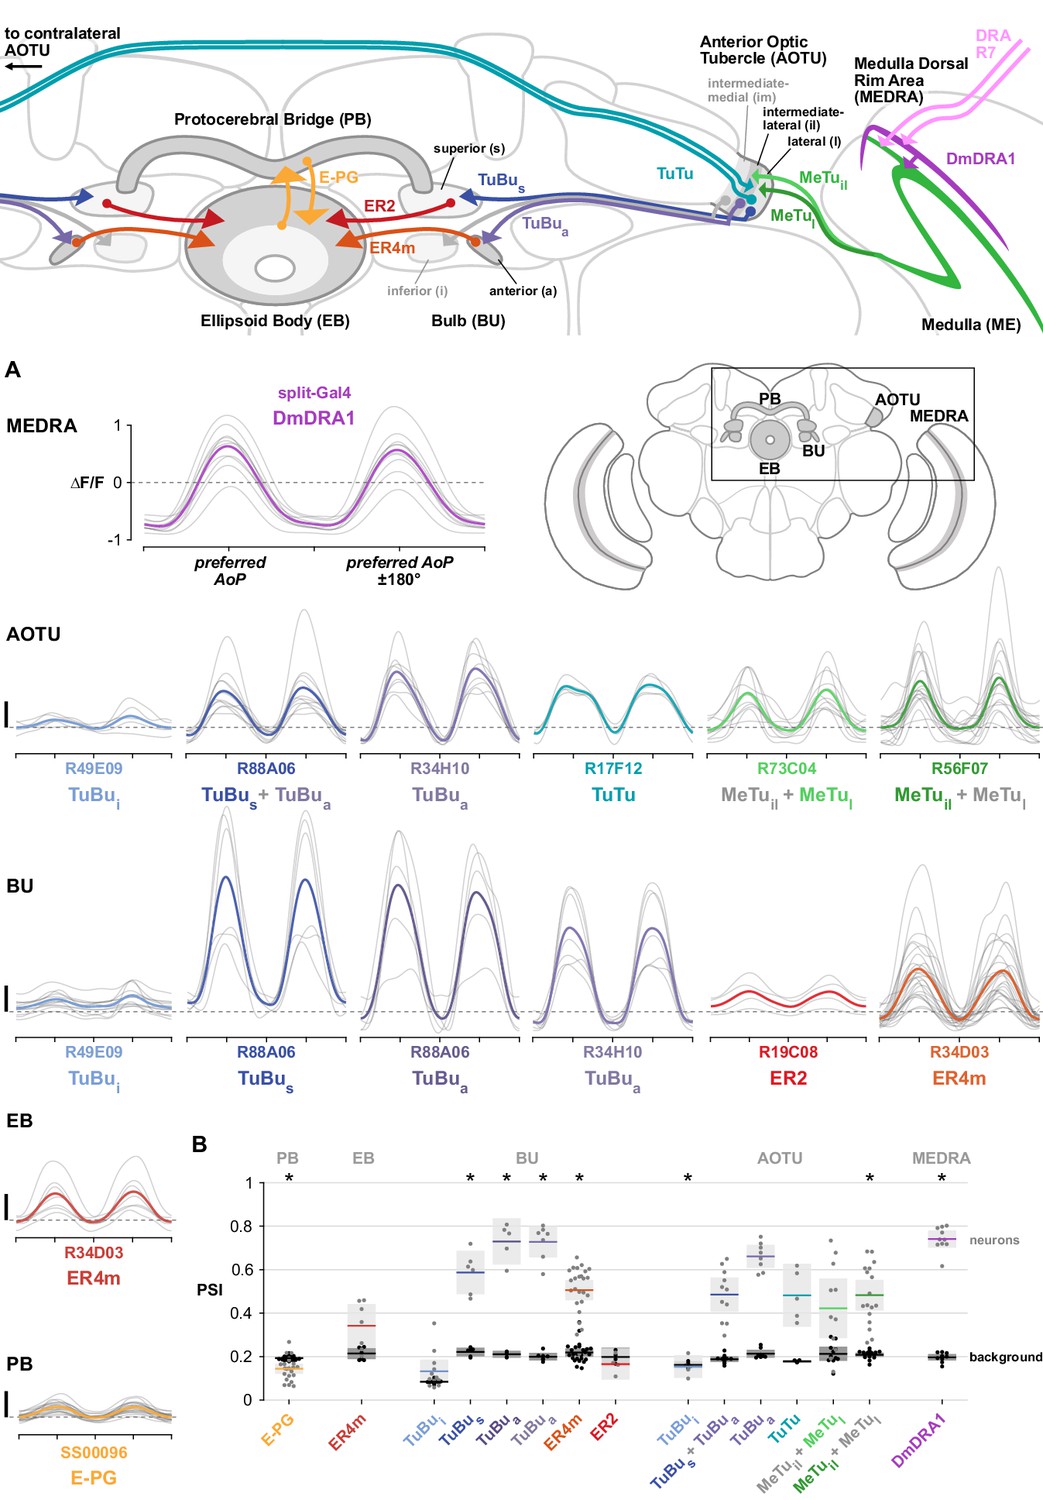
Summary of polarization pathway and response properties.
(A) Polarization tuning curves for each neuron population recorded. Thin traces show tuning curves for individual animals, thick traces show their mean. All scale bars denote 1 ΔF/F. Dashed horizontal lines indicate 0 ΔF/F baseline. (B) Average polarization selectivity index (PSI) within each neuron population recorded (light dots) and within background regions (dark dots) in individual animals. Solid horizontal line indicates mean, shaded box denotes 95% confidence interval, asterisks denote statistically significant differences between neuron and background samples (p < 0.05, Bonferroni correction applied). See Appendix 1–table 1 for corresponding data and p-values.
Tables
Key resources table
| Reagent type (species) or resource | Designation | Source or reference | Identifiers | Additional information |
|---|---|---|---|---|
| Genetic reagent (D. melanogaster) | Rh3/Rh4-Gal4 | Bloomington Drosophila Stock Center | FLYB:FBti0058802;RRID:BDSC_8603 | Synonym: pan-R7-Gal4 Wernet et al., 2006 |
| Genetic reagent (D. melanogaster) | DmDRA1 split (R13E04-p65.AD; VT059781-Gal4.DBD) | This paper | FLYB:FBti0187820;FLYB:FBti0194675 | Available upon request. Components: Dionne et al., 2018; Tirian and Dickson, 2017 |
| Genetic reagent (D. melanogaster) | R13E04-LexA | Bloomington Drosophila Stock Center | FLYB:FBtp0087918;RRID:BDSC_52457 | Pfeiffer et al., 2013 |
| Genetic reagent (D. melanogaster) | R24F06-LexA | Bloomington Drosophila Stock Center | FLYB:FBti0155501;RRID:BDSC_52695 | Pfeiffer et al., 2013 |
| Genetic reagent (D. melanogaster) | R56F07-Gal4 | Bloomington Drosophila Stock Center | FLYB:FBti0136983;RRID:BDSC_39160 | Jenett et al., 2012 |
| Genetic reagent (D. melanogaster) | R73C04-Gal4 | Bloomington Drosophila Stock Center | FLYB:FBti0138074;RRID:BDSC_39815 | Jenett et al., 2012 |
| Genetic reagent (D. melanogaster) | R17F12-Gal4 | Bloomington Drosophila Stock Center | FLYB:FBti0133538;RRID:BDSC_48779 | Jenett et al., 2012 |
| Genetic reagent (D. melanogaster) | R34H10-Gal4 | Bloomington Drosophila Stock Center | FLYB:FBti0135093;RRID:BDSC_49808 | Jenett et al., 2012 |
| Genetic reagent (D. melanogaster) | R88A06-Gal4 | Bloomington Drosophila Stock Center | FLYB:FBti0139280;RRID:BDSC_46847 | Jenett et al., 2012 |
| Genetic reagent (D. melanogaster) | R49E09-Gal4 | Bloomington Drosophila Stock Center | FLYB:FBti0136346;RRID:BDSC_38692 | Jenett et al., 2012 |
| Genetic reagent (D. melanogaster) | R34D03-Gal4 | Bloomington Drosophila Stock Center | FLYB:FBti0135043;RRID:BDSC_49784 | Jenett et al., 2012 |
| Genetic reagent (D. melanogaster) | R19C08-Gal4 | Bloomington Drosophila Stock Center | FLYB:FBti0133678;RRID:BDSC_48845 | Jenett et al., 2012 |
| Genetic reagent (D. melanogaster) | SS00096 (R19G02-p65.AD; R70G12- Gal4.DBD) | other | FLYB:FBtp0117182;FLYB:FBtp0122173 | Kim et al., 2017 Provided by V. Jayaraman and T.Wolff, available via https://www.janelia.org/split-GAL4 |
| Genetic reagent (D. melanogaster) | R60D05-LexA | Bloomington Drosophila Stock Center | FLYB:FBti0156166;RRID:BDSC_52867 | Pfeiffer et al., 2013 |
| Genetic reagent (D. melanogaster) | R34D03-LexA | Bloomington Drosophila Stock Center | FLYB:FBti0135043;RRID:BDSC_49784 | Pfeiffer et al., 2013 |
| Genetic reagent (D. melanogaster) | 20×UAS-IVS-Syn21-opGCaMP6s-p10 | other | FLYB:FBti0195669 | Provided by G. Rubin |
| Genetic reagent (D. melanogaster) | UAS-mCD4::tdTomato | Bloomington Drosophila Stock Center | FLYB:FBtp0068010;RRID:BDSC_35837 | Han et al., 2011 |
| Genetic reagent (D. melanogaster) | UAS-sytGCaMP6s | Bloomington Drosophila Stock Center | FLYB:FBti0181795;RRID:BDSC_64415 | Cohn et al., 2015 |
| Genetic reagent (D. melanogaster) | UAS-tdTomato | Bloomington Drosophila Stock Center | FLYB:FBti0145104;RRID:BDSC_36328 | Schulte, 2011; Shaner et al., 2004 |
| Genetic reagent (D. melanogaster) | 10×UAS-mCD8::GFP | Bloomington Drosophila Stock Center | FLYB:FBti0131930;RRID:BDSC_32184 | Pfeiffer, 2010 |
| Genetic reagent (D. melanogaster) | 26×LexAop-mCD8::GFP | Bloomington Drosophila Stock Center | FLYB:FBti0131946;RRID:BDSC_32207 | Pfeiffer, 2010 |
| Genetic reagent (D. melanogaster) | 10×UAS-mCD8::RFP; 13×LexAop-mCD8::GFP | Bloomington Drosophila Stock Center | FLYB:FBst0032229;RRID:BDSC_32229 | Pfeiffer, 2010 |
| Genetic reagent (D. melanogaster) | UAS-nSyb-spGFP1-10, LexAop-CD4-spGFP11 | Bloomington Drosophila Stock Center | FLYB:FBtp0111281;RRID:BDSC_64314 | Components: Gallio, 2016; Macpherson et al., 2015 |
| Genetic reagent (D. melanogaster) | MCFO-4 | Bloomington Drosophila Stock Center | FLYB:FBst0064088;RRID:BDSC_64088 | Nern et al., 2015 |
| Genetic reagent (D. melanogaster) | MCFO-5 | Bloomington Drosophila Stock Center | FLYB:FBst0064089;RRID:BDSC_64089 | Nern et al., 2015 |
| Genetic reagent (D. melanogaster) | MCFO-6 | Bloomington Drosophila Stock Center | FLYB:FBst0064090;RRID:BDSC_64090 | Nern et al., 2015 |
| Genetic reagent (D. melanogaster) | GRASP | Bloomington Drosophila Stock Center | FLYB:FBst0064314;RRID:BDSC_64314 | Macpherson et al., 2015 |
| Genetic reagent (D. melanogaster) | trans-Tango | Bloomington Drosophila Stock Center | FLYB:FBst0077124;RRID:BDSC_77124 | Talay et al., 2017 Provided by G. Barnea |
| Antibody | Anti-DN-cadherin (rat monoclonal) | Developmental Studies Hybridoma Bank | Cat#:DN-Ex #8; RRID:AB_528121 | (1:20) |
| Antibody | Anti-Neuroglian (mouse monoclonal) | Developmental Studies Hybridoma Bank | Cat#:BP 104; RRID:AB_528402 | (1:30) |
| Antibody | Anti-GFP (chicken polyclonal) | Abcam | Cat#:ab13970; RRID:AB_300798 | (1:1000) |
| Antibody | Anti-DsRed (rabbit polyclonal) | Takara Bio | Cat#:632496; RRID:AB_10013483 | (1:1000) |
| Antibody | Anti-HA (rabbit monoclonal) | Cell Signaling Technology | Cat#: 3724S; RRID:AB_1549585 | (1:300) |
| Antibody | Anti-V5 (mouse monoclonal) | Thermo Fisher Scientific | Cat#:37–7500; RRID:AB_2533339 | (1:1000) |
| Antibody | Anti-Mouse conjugated to Cy5 (goat polyclonal) | Jackson ImmunoResearch | Cat#:115-175-166; RRID:AB_2338714 | (1:300) |
| Antibody | Anti-Rat conjugated to Cy3 (goat polyclonal) | Jackson ImmunoResearch | Cat#:112-165-167;RRID:AB_2338251 | (1:300) |
| Antibody | Anti-Rat conjugated to Cy5 (goat polyclonal) | Jackson ImmunoResearch | Cat#:112-175-143;RRID:AB_2338263 | (1:300) |
| Antibody | Anti-Rabbit conjugated to Cy3 (goat polyclonal) | Jackson ImmunoResearch | Cat#:111-165-003;RRID:AB_2338000 | (1:300) |
| Antibody | Anti-GFP conjugated to Alexa488 (rabbit polyclonal) | Thermo Fisher Scientific | Cat#:A-21311;RRID:AB_221477 | (1:1000) |
| Antibody | Anti-GFP (mouse monoclonal) | Sigma-Aldrich | Cat#:G6539; RRID:AB_259941 | (1:1000) |
| Antibody | Anti-Chicken conjugated to Alexa488 (goat polyclonal) | Thermo Fisher Scientific | Cat#:A-11039;RRID:AB_2534096 | (1:1000) |
| Antibody | Anti-Mouse conjugated to Alexa488 (goat polyclonal) | Thermo Fisher Scientific | Cat#:A-10680;RRID:AB_2534062 | (1:1000) |
| Software, algorithm | Fiji | ImageJ | RRID:SCR_002285 | Schindelin et al., 2012 |
| Software, algorithm | SlideBook 6 | Intelligent Imaging Innovations | RRID:SCR_014300 | |
| Software, algorithm | MATLAB R2017a | Mathworks | RRID:SCR_001622 |
Appendix 1—table 1
Summary table of neurons in genetic drivers used, corresponding reconstructions in hemibrain connectome, and PSI data.
| Genetic driver | Hemibrain connectome v1.2 (Scheffer et al., 2020) | Average PSI† | Average ΔPSI(compared to control experiments with polarizing filter removed) | ||||||||
|---|---|---|---|---|---|---|---|---|---|---|---|
| Designation | Neurons recorded (recording site) | Estimated population size (per recording) | Corresponding neurons | Instances traced (per brain hemisphere) | Background | Neurons | p-value (t-test, background vs neurons) | Background | p-value (t-test) | Neurons | p-value (t-test) |
| DmDRA1-split | DmDRA1 (MEDRA) | 23 | n/a | n/a | 0.197 CI95 [0.18 0.21] N = 10 | 0.741 CI95 [0.70 0.78] N = 10 | 0.000000 | −0.002 CI95 [−0.02 0.01] N = 10 | 0.814673 | 0.586 CI95 [0.55 0.63] N = 10 | 0.000000 |
| R56F07 | MeTuil + MeTul (AOTU) | ~50–100 | MC61* | 347 | 0.209 CI95 [0.20 0.22] N = 17 | 0.483 CI95 [0.41 0.55] N = 17 | 0.000001 | 0.001 CI95 [−0.01 0.01] N = 17 | 0.836089 | 0.280 CI95 [0.21 0.35] N = 17 | 0.000000 |
| R73C04 | MeTul + MeTuil (AOTU) | ~100–150 | MC61* | 347 | 0.213 CI95 [0.18 0.25] N = 11 | 0.422 CI95 [0.29 0.56] N = 11 | 0.006841 | 0.000 CI95 [−0.03 0.03] N = 11 | 0.982761 | 0.242 CI95 [0.11 0.38] N = 11 | 0.002816 |
| R17F12 | TuTu (AOTU) | 2 | TuTuB | 2 | 0.178 CI95 [0.17 0.18] N = 5 | 0.482 CI95 [0.34 0.63] N = 5 | 0.003928 | −0.045 CI95 [−0.05 –0.04] N = 5 | 0.000027 | 0.373 CI95 [0.23 0.52] N = 5 | 0.002009 |
| R34H10 | TuBua (AOTU) | 5–6** | TuBu01 | 5 | 0.213 CI95 [0.20 0.23] N = 8 | 0.661 CI95 [0.61 0.71] N = 8 | 0.000000 | 0.033 CI95 [0.01 0.05] N = 8 | 0.003949 | 0.512 CI95 [0.46 0.57] N = 8 | 0.000000 |
| TuBua (BUa) | 5–6 | 0.200 CI95 [0.18 0.22] N = 7 | 0.728 CI95 [0.66 0.80] N = 7 | 0.000006 | 0.023 CI95 [0.01 0.04] N = 7 | 0.019318 | 0.512 CI95 [0.44 0.58] N = 7 | 0.000003 | |||
| R88A06 | TuBus + TuBua (AOTU) | 34 | TuBu01 TuBu06 TuBu08 TuBu09 | 5 4 10 11 | 0.188 CI95 [0.18 0.20] N = 11 | 0.485 CI95 [0.41 0.56] N = 11 | 0.000013 | ||||
| TuBus (BUs) | 28 | 0.221 CI95 [0.20 0.24] N = 6 | 0.587 CI95 [0.49 0.69] N = 6 | 0.000454 | −0.028 CI95 [−0.05 –0.01] N = 6 | 0.015342 | 0.305 CI95 [0.21 0.41] N = 6 | 0.000538 | |||
| TuBua (BUa) | 5–6 | 0.211 CI95 [0.20 0.23] N = 5 | 0.730 CI95 [0.62 0.84] N = 5 | 0.000230 | −0.022 CI95 [−0.04 –0.01] N = 5 | 0.017749 | 0.620 CI95 [0.51 0.73] N = 5 | 0.000086 | |||
| R49E09 | TuBui (AOTU) | 15–30 | TuBu02 TuBu03 TuBu05 | 7 15 5 | 0.162 CI95 [0.15 0.18] N = 5 | 0.154 CI95 [0.10 0.21] N = 5 | 0.758387 | ||||
| TuBui (BUi) | 15–30 | 0.085 CI95 [0.08 0.09] N = 12 | 0.132 CI95 [0.08 0.19] N = 12 | 0.088816 | |||||||
| R19C08 | ER2 (BUs) | ~40*** | ER2_a ER2_b ER2_d ER2_c | 4 3 3 11 | 0.199 CI95 [0.16 0.24] N = 4 | 0.165 CI95 [0.09 0.24] N = 4 | 0.287547 | ||||
| R34D03 | ER4m (BUa) | 5 | ER4m | 5 | 0.219 CI95 [0.20 0.24] N = 25 | 0.506 CI95 [0.46 0.55] N = 25 | 0.000000 | −0.005 CI95 [−0.02 0.01] N = 25 | 0.579771 | 0.336 CI95 [0.29 0.38] N = 25 | 0.000000 |
| ER4m (EB) | 10 | 0.214 CI95 [0.19 0.24] N = 7 | 0.342 CI95 [0.24 0.44] N = 7 | 0.020818 | 0.028 CI95 [0.00 0.05] N = 7 | 0.039868 | 0.206 CI95 [0.11 0.31] N = 7 | 0.002423 | |||
| SS00096 | E-PG (PB) | 70 | EPG | 25 | 0.193 CI95 [0.19 0.20] N = 22 | 0.144 CI95 [0.12 0.17] N = 22 | 0.000133 | 0.008 CI95 [0.00 0.01] N = 22 | 0.000727 | 0.056 CI95 [0.03 0.08] N = 22 | 0.000062 |
-
†Data for Appendix 1–figure 1B
*Unsorted group of MeTu-like neurons (partially traced: excludes dendrites in medulla).
-
**Also contains other TuBu neurons with weak expression, not visible in calcium imaging experiments.
***Also contains ER3w neurons (10 instances in hemibrain) and ER3p neurons (nine instances total of ER3p_a plus ER3p_b). A second, previously characterized, genetic driver for ER2 (R78B06) (Omoto et al., 2018) contains 20–25 cell bodies. Polarization-sensitive neurons in R19C08 likely correspond to ER2_a, ER2_b and ER2_d.
Appendix 2—table 1
Experimental genotypes.
| Figure panel | Genotype |
|---|---|
| Figure 1B | w / w; R13E04-p65.AD / +; VT059781-Gal4.DBD / 10xUAS-mCD8::GFP (R13E04-p65.AD; VT059781-Gal4.DBD is abbreviated as DmDRA1-split) |
| Figure 1B’ | 10xUAS-mCD8::RFP, 13xLexAop-mCD8::GFP / w; R13E04-p65.AD / R24F06-LexA; VT059781-Gal4.DBD / + |
| Figure 1B’’ | 10xUAS-mCD8::RFP, 13xLexAop-mCD8::GFP / w; Rh3/Rh4-Gal4 / R13E04-LexA; + / + |
| Figure 1C–H | w / w; R13E04-p65.AD / UAS-sytGCaMP6s; VT059781-Gal4.DBD / UAS-tdTomato |
| Figure 1—figure supplement 1C-F | w / w; Rh3/Rh4-Gal4 / UAS-sytGCaMP6s; + / UAS-tdTomato |
| Figure 1—figure supplement 1I | w / w; R13E04-p65.AD / UAS-sytGCaMP6s; VT059781-Gal4.DBD / UAS-tdTomato |
| Figure 1—figure supplement 1J | w / w; Rh3/Rh4-Gal4 / UAS-sytGCaMP6s; + / UAS-tdTomato |
| Figure 1—figure supplement 2 | w / w; R13E04-p65.AD / UAS-sytGCaMP6s; VT059781-Gal4.DBD / UAS-tdTomato |
| Figure 2A | w / w; + / +; R56F07-Gal4/10xUAS-mCD8::GFP |
| Figure 2B | UAS-myr::GFP, QUAS-mtdTomato-3×HA / w; R13E04-p65.AD / trans-Tango; VT059781-Gal4.DBD / + |
| Figure 2C | UAS-myr::GFP, QUAS-mtdTomato-3×HA / w; trans-Tango / +; Rh3/Rh4-Gal4 / + |
| Figure 2F,G | Comparison between: w / w; + / UAS-sytGCaMP6s; R56F07-Gal4 / UAS-tdTomato w / w; + / UAS-sytGCaMP6s; R73C04-Gal4 / UAS-tdTomato |
| Figure 2—figure supplement 1A | w / w; + / +; R56F07-Gal4 / 10xUAS-mCD8::GFP |
| Figure 2—figure supplement 1B-D | MCFO / w; MCFO / +; R56F07-Gal4 / MCFO |
| Figure 3A,C,E | w / w; + / UAS-sytGCaMP6s; R56F07-Gal4 / UAS-tdTomato |
| Figure 3B,D,F | w / w; + / UAS-sytGCaMP6s; R73C04-Gal4 / UAS-tdTomato |
| Figure 3—figure supplement 1A,C,E | w / w; + / UAS-sytGCaMP6s; R56F07-Gal4 / UAS-tdTomato |
| Figure 3—figure supplement 1B,D | w / w; + / UAS-sytGCaMP6s; R73C04-Gal4 / UAS-tdTomato |
| Figure 4A–F | w / w; + / UAS-sytGCaMP6s; R73C04-Gal4 / UAS-tdTomato |
| Figure 5A | UAS-myr::GFP, QUAS-mtdTomato-3×HA / w; trans-Tango / +; R73C04-Gal4 / + |
| Figure 5B | w / w; + / +; R17F12-Gal4 / 10xUAS-mCD8::GFP |
| Figure 5C–G | w / w; + / UAS-sytGCaMP6s; R17F12-Gal4 / UAS-tdTomato |
| Figure 6B,C | Comparison between: w / w; + / UAS-opGCaMP6s; R49E09-Gal4 / UAS-opGCaMP6s, UAS-CD4::tdTomato w / w; + / UAS-opGCaMP6s; R88A06-Gal4 / UAS-opGCaMP6s, UAS-CD4::tdTomato w / w; + / UAS-opGCaMP6s; R34H10-Gal4 / UAS-opGCaMP6s, UAS-CD4::tdTomato |
| Figure 6D,E | w / w; + / UAS-opGCaMP6s; R49E09-Gal4 / UAS-opGCaMP6s, UAS-CD4::tdTomato |
| Figure 6F,G | w / w; + / UAS-opGCaMP6s; R88A06-Gal4 / UAS-opGCaMP6s, UAS-CD4::tdTomato |
| Figure 6H,I | w / w; + / UAS-opGCaMP6s; R34H10-Gal4 / UAS-opGCaMP6s, UAS-CD4::tdTomato |
| Figure 7—figure supplement 1A,B | Comparison between: w / w; + / UAS-opGCaMP6s; R49E09-Gal4 / UAS-opGCaMP6s, UAS-CD4::tdTomato w / w; + / UAS-sytGCaMP6s; R49E09-Gal4 / UAS-tdTomato w / w; + / UAS-opGCaMP6s; R88A06-Gal4 / UAS-opGCaMP6s, UAS-CD4::tdTomato w / w; + / UAS-sytGCaMP6s; R88A06-Gal4 / UAS-tdTomato w / w; + / UAS-opGCaMP6s; R34H10-Gal4 / UAS-opGCaMP6s, UAS-CD4::tdTomato w / w; + / UAS-sytGCaMP6s; R34H10-Gal4 / UAS-tdTomato |
| Figure 7A | w / w; + / UAS-sytGCaMP6s; R88A06-Gal4 / UAS-tdTomato |
| Figure 7B,C | Comparison between: w / w; + / UAS-sytGCaMP6s; R49E09-Gal4 / UAS-tdTomato w / w; + / UAS-sytGCaMP6s; R88A06-Gal4 / UAS-tdTomato w / w; + / UAS-sytGCaMP6s; R34H10-Gal4 / UAS-tdTomato |
| Figure 7D | w / w; + / UAS-sytGCaMP6s; R88A06-Gal4 / UAS-tdTomato |
| Figure 7E | Comparison between: w / w; + / UAS-sytGCaMP6s; R88A06-Gal4 / UAS-tdTomato w / w; + / UAS-sytGCaMP6s; R34H10-Gal4 / UAS-tdTomato |
| Figure 7F | w / w; + / UAS-sytGCaMP6s; R88A06-Gal4 / UAS-tdTomato |
| Figure 7G | w / w; + / UAS-sytGCaMP6s; R34H10-Gal4 / UAS-tdTomato |
| Figure 8B | 10xUAS-mCD8::RFP, 13xLexAop-mCD8::GFP / w; R34D03-LexA / +; R34H10-Gal4 / + |
| Figure 8C | w / w; + / UAS-opGCaMP6s; R19C08-Gal4 / UAS-opGCaMP6s, UAS-CD4::tdTomato |
| Figure 8D | Comparison between: w / w; + / UAS-opGCaMP6s; R19C08-Gal4 / UAS-opGCaMP6s, UAS-CD4::tdTomato w / w; + / UAS-opGCaMP6s; R34D03-Gal4 / UAS-opGCaMP6s, UAS-CD4::tdTomato |
| Figure 8E | w / w; + / UAS-opGCaMP6s; R34D03-Gal4 / UAS-opGCaMP6s, UAS-CD4::tdTomato |
| Figure 8F | w / w; R34D03-LexA / UAS-nSyb-spGFP1-10, LexAop-CD4-spGFP11; R34H10-Gal4 / + |
| Figure 8G | w / w; + / UAS-opGCaMP6s; R34D03-Gal4 / UAS-opGCaMP6s, UAS-CD4::tdTomato |
| Figure 8H | w / w; + / UAS-sytGCaMP6s; R34H10-Gal4 / UAS-tdTomato |
| Figure 8—figure supplement 1A,C,E | w / w; + / UAS-sytGCaMP6s; R34H10-Gal4 / UAS-tdTomato |
| Figure 8—figure supplement 1B,D,F | w / w; + / UAS-opGCaMP6s; R34D03-Gal4 / UAS-opGCaMP6s, UAS-CD4::tdTomato |
| Figure 9A–E | w / w; + / UAS-sytGCaMP6s; R34D03-Gal4 / UAS-tdTomato |
| Figure 9F | w / w; + / UAS-opGCaMP6s; R34D03-Gal4 / UAS-opGCaMP6s, UAS-CD4::tdTomato |
| Figure 9G | w / w; + / UAS-sytGCaMP6s; R34H10-Gal4 / UAS-tdTomato |
| Figure 10B,C | w / w; R19G02-p65.AD / UAS-sytGCaMP6s; R70G12-Gal4.DBD / UAS-tdTomato (R19G02-p65.AD; R70G12-Gal4.DBD is abbreviated as SS00096) |
| Figure 10D,E | Comparison between: w / w; R19G02-p65.AD / UAS-sytGCaMP6s; R70G12-Gal4.DBD / UAS-tdTomato w / w; + / UAS-sytGCaMP6s; R34D03-Gal4 / UAS-tdTomato |
| Figure 10F–I | w / w; R19G02-p65.AD / UAS-sytGCaMP6s; R70G12-Gal4.DBD / UAS-tdTomato |
| Figure 10—figure supplement 1A | w / w; R19G02-p65.AD / +; R70G12-Gal4.DBD / 10xUAS-mCD8::GFP |
| Figure 10—figure supplement 1B | w / w; R19G02-p65.AD / R34D03-LexA; R70G12-Gal4.DBD / UAS-nSyb-spGFP1-10, LexAop-CD4-spGFP11 |
| Figure 10—figure supplement 1C | Comparison between: w / w; + / UAS-sytGCaMP6s; R34H10-Gal4 / UAS-tdTomato w / w; + / UAS-opGCaMP6s; R34D03-Gal4 / UAS-opGCaMP6s, UAS-CD4::tdTomato w / w; R19G02-p65.AD / UAS-sytGCaMP6s; R70G12-Gal4.DBD / UAS-tdTomato |
| Figure 10—figure supplement 1E-G | w / w; R19G02-p65.AD / UAS-sytGCaMP6s; R70G12-Gal4.DBD / UAS-tdTomato |
Additional files
Download links
A two-part list of links to download the article, or parts of the article, in various formats.
Downloads (link to download the article as PDF)
Open citations (links to open the citations from this article in various online reference manager services)
Cite this article (links to download the citations from this article in formats compatible with various reference manager tools)
A visual pathway for skylight polarization processing in Drosophila
eLife 10:e63225.
https://doi.org/10.7554/eLife.63225


