Dissecting phenotypic transitions in metastatic disease via photoconversion-based isolation
- Department of Medicine, University of Pennsylvania, United States
- Department of Cell and Developmental Biology, University of Pennsylvania, United States
- Abramson Family Cancer Research Institute, University of Pennsylvania, United States
- Department of Dermatology, University of Pennsylvania, United States
- Department of Biomedical Sciences, School of Veterinary Medicine, United States
- Institute for Regenerative Medicine, University of Pennsylvania, United States
- Abramson Cancer Center, University of Pennsylvania, United States
Figures
Figure 1 with 3 supplements
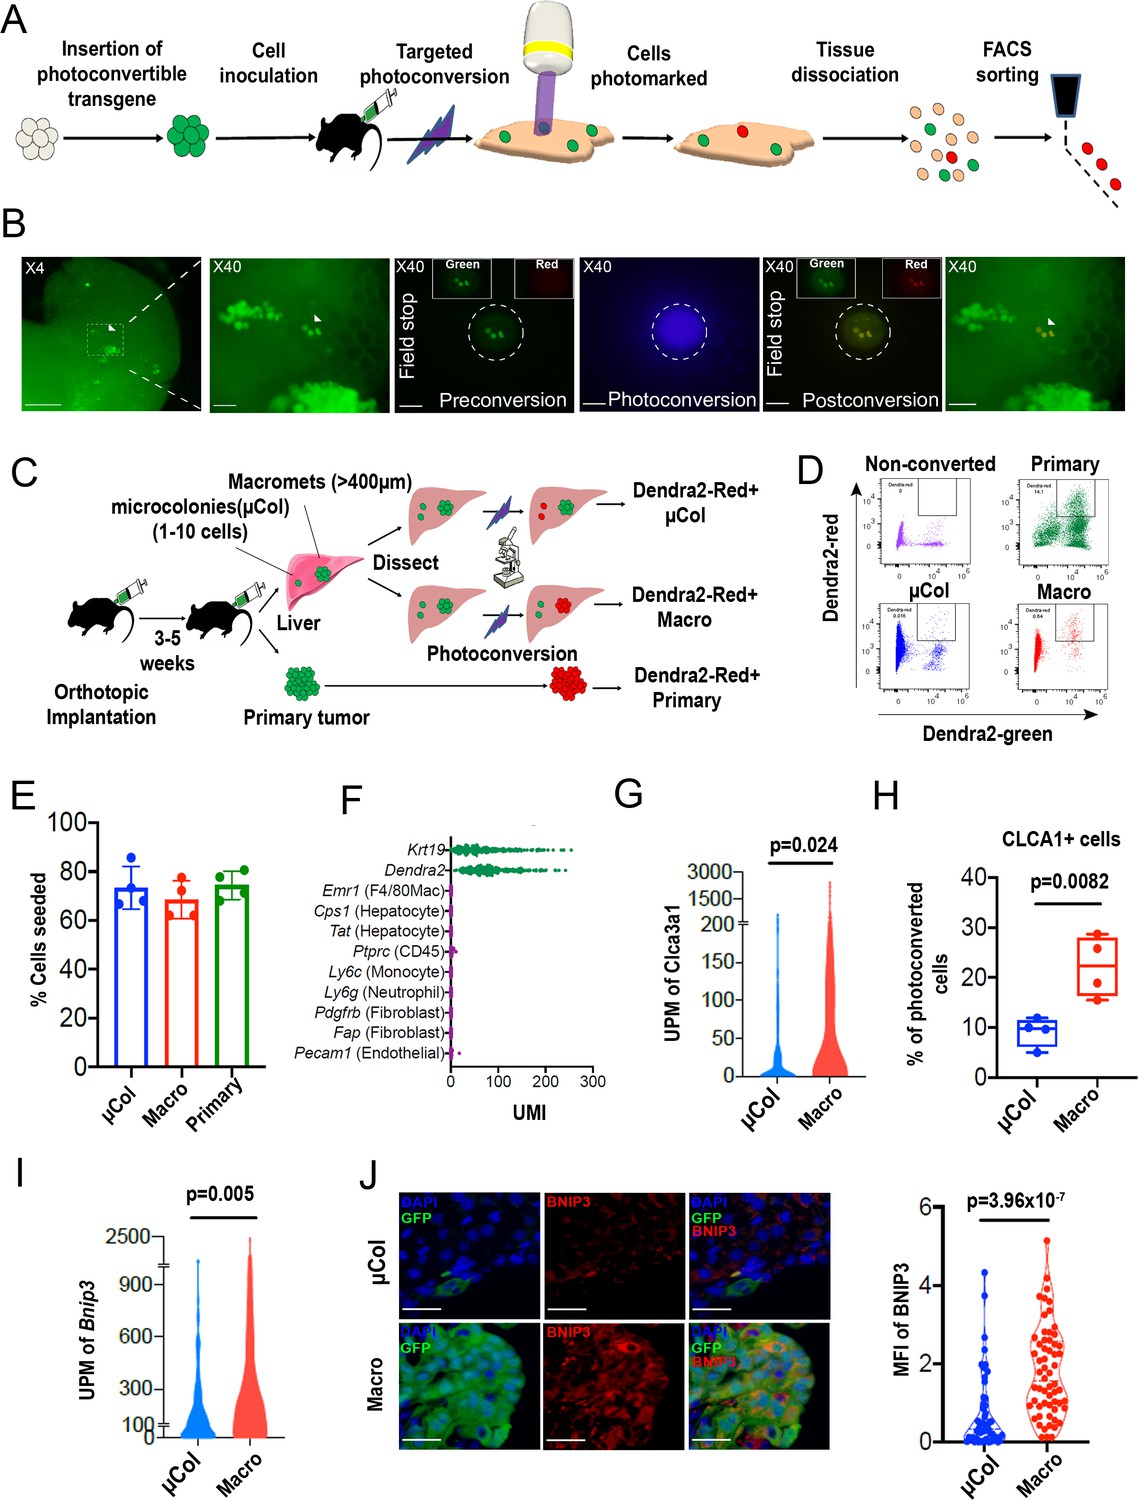
PIC-IT allows isolation of size-defined microcolonies and macrometastases from live animals.
(A) Schematic of the PIC-IT protocol. (B) Photoconversion of Dendra2 in microcolonies spontaneously arising in the liver of a pancreatic cancer tumor model. Left to right: Microscopic views acquired through a 4× objective with region of interest containing three cell clusters destined for photoconversion located in the marked area (arrows denote the three cells of interest, scale bar = 250 µm). Focus on the marked area with 40× objective (scale bar = 25 µm). Field-stop-confined FOV within the 40× objective region, encircling the targeted three cell focus prior to photoconversion (‘Preconversion’). In boxes, images representing individual green and red channels for the field-stop FOV. Field-stop image of a photoconversion session (violet light exposure, ‘Photoconversion’). Field-stop confined FOV of an 40× objective following photoconversion (‘Postconversion’). The 40× region with a full FOV demonstrating specificity of photoconversion to field-stop confined area. (C) Experimental scheme utilized for photoconversion-based isolation of metastatic cells from liver fragments. Orthotopic tumors derived from Dendra2-expressing cells produce liver metastasis. In different fragments, microcolonies (µCol) or macrometastases are photoconverted. Dissociated tissue from each group are pooled and sorted for subsequent applications. (D) Flow cytometry charts showing expression of Dendra2-green (X-axis) and Dendra2-red (Y-axis) in converted tumor cells and non-converted controls. (E) Seeding efficiency of photoconverted tumor cells, calculated as the fraction of cells counted in tissue culture plates 24 hr post-isolation relative to the number sorted by FACS (n = 4). (F) UMI profiles indicate expression of the markers Krt19 and Dendra2 in the sorted cells but no expression of other lineage markers (N = 361). (G, H) High prevalence of RNA-seq transcripts of CLCA3A1 (G, NµCol = 94, Nmacro = 111) and the corresponding CLCA1 protein expression (H) determined by flow cytometry on macrometastasis-derived vs. microcolonies (n = 4). (I, J) Concordance between elevated transcription (UMI per million) of BNIP3 in RNA-seq (I) and (J) BNIP3 MFIs in (left) immunostained microcolonies and macrometastases populating the livers of 6419c5-YFP tumor-bearing mice (NµCol = 53, Nmacro = 60). On the right, representative images of microcolonies and macrometastases immunostained for BNIP3 (red), YFP (green), and DAPI (blue). Scale bar = 50 µm. Bars represent mean ± SEM in all graphs. p-values were calculated by unpaired two-tailed Student’s t-test.
Figure 1—figure supplement 1
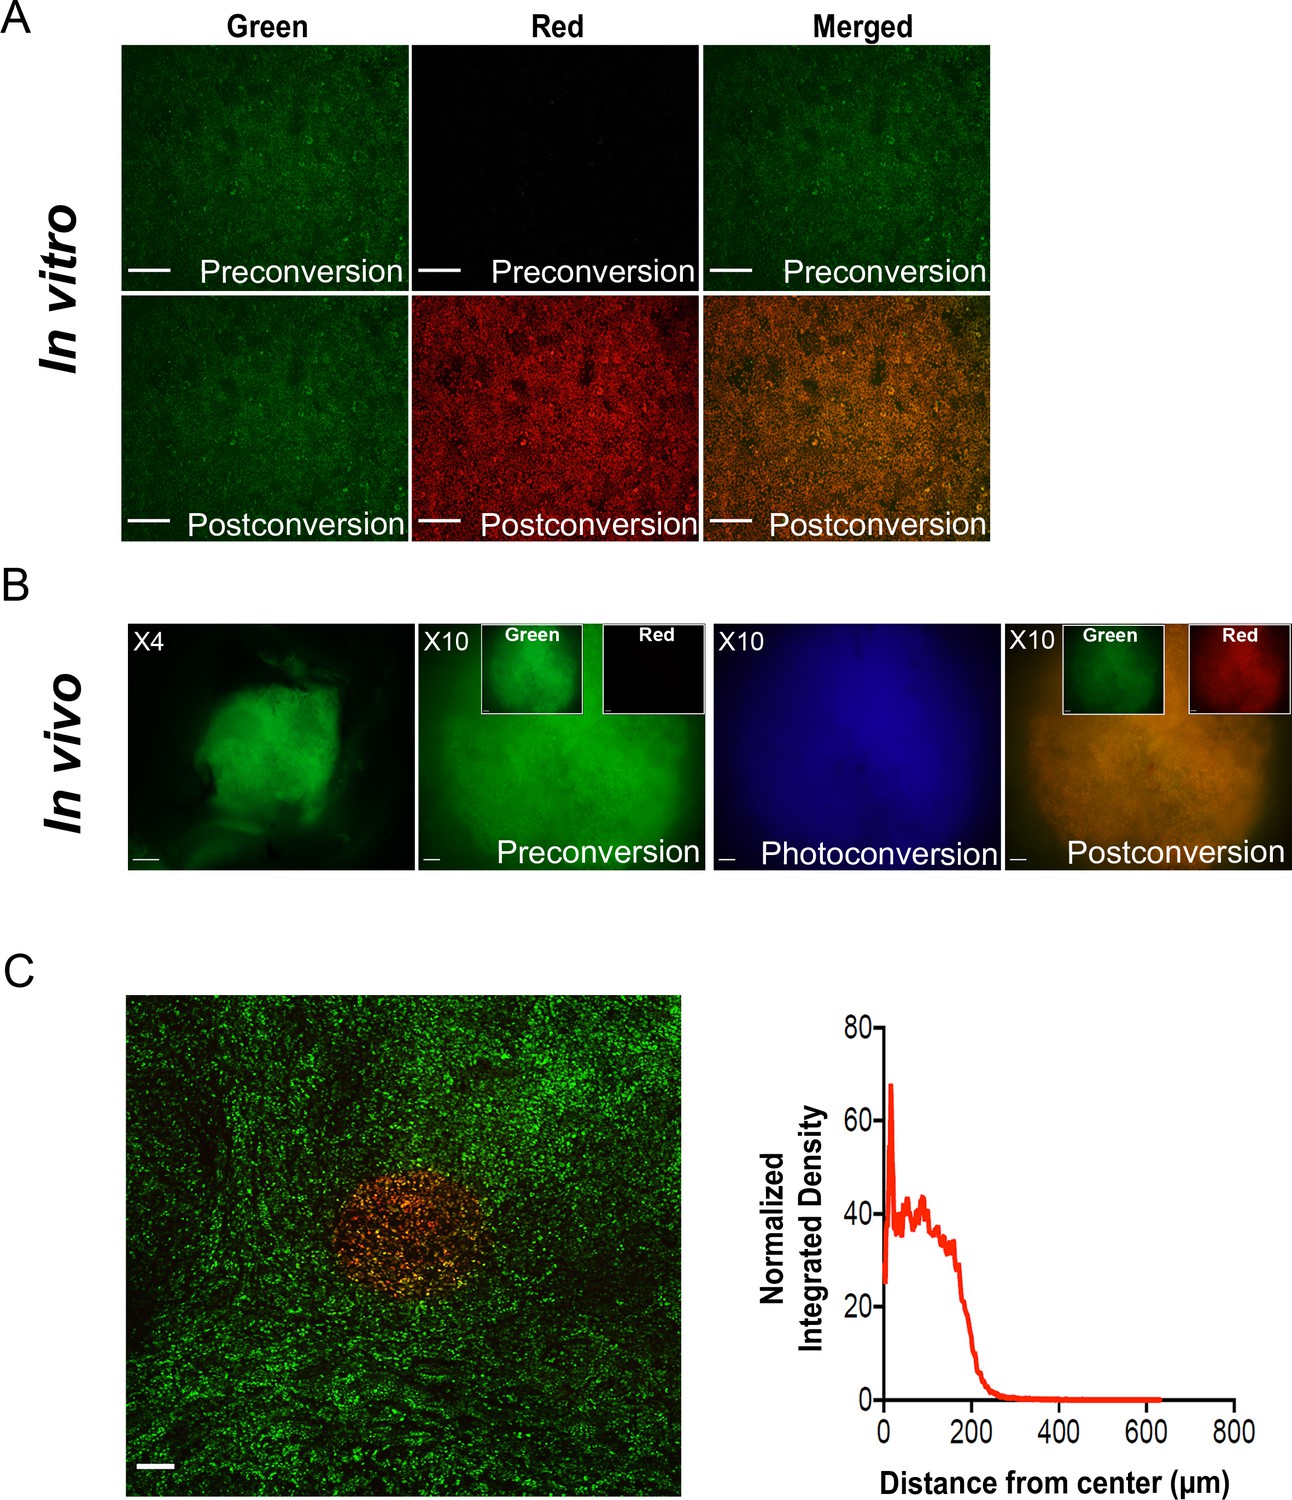
Spatial flexibility of PIC-IT.
(A) Photoconversion of cultured PDA tumor cells. Representative images of pancreatic tumor cells preconversion and following 30 s exposure mercury lamp-generated violet light in vitro (10× objective, scale bar = 100 µm). (B) Photoconversion of Dendra2 in spontaneously arising macrometastases. Left to right: Low magnification microscopic view of a Dendra2-positive macrometastasis before conversion (4× objective, scale bar = 250 µm). FOV of the lesion prior to photoconversion (10× objective, scale bar = 100 µm). In boxes, images representing individual green and red channels for the field-stop FOV. Image acquired during photoconversion session. FOV of the macrometastasis following photoconversion. (C) Spatial resolution of photoconversion. Representative confocal microscopy image of a precision slice from a liver metastasis photoconverted in one maximally confined FOV using a 10× objective (left, scale bar = 100 µm) and radial intensity profile derived (n = 10) for Dendra2-red channel of the photoconverted FOV (right).
Figure 1—figure supplement 2
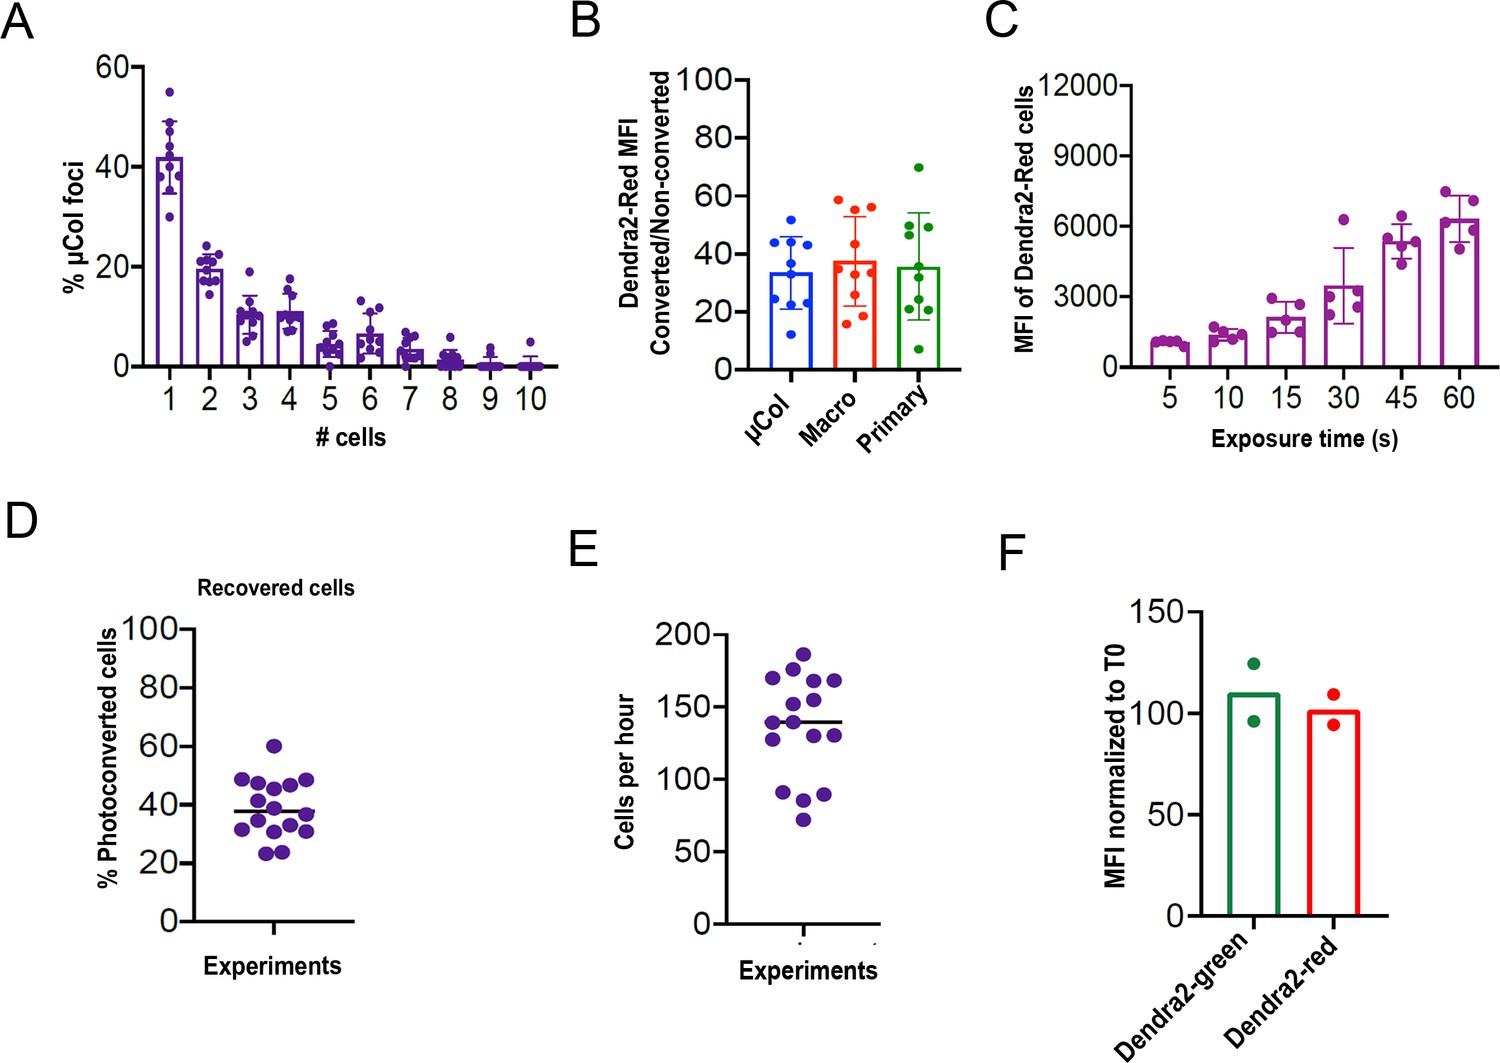
Kinetics of cell marking and efficiency of isolation using PIC-IT.
(A) Size distribution of microcolonies collected in isolation sessions. Metastatic foci of 1–10 cells were binned according to size and the frequency of each size plotted as a percentage of the total across 10 independent experiments. (B) Average fold-change in red signal over background of non-converted samples in metastatic and primary tumors (n = 10 independent experiments). (C) Fold-change increase in Dendra2-red in photoconverted primary tumor cells as a function of time of exposure (seconds) to violet light. Data represents an average of three technical replicates per time point. (D) Recovery of tumor cells from microcolonies foci calculated as the ratio of the number of photoconverted cells recovered by flow cytometry to the number of cells photoconverted in each microscopy session (n = 16 sessions). (E) Average number of tumor cells recovered from microcolonies per hour photoconversion session (n = 16). (F) Stability of Dendra2-red in photoconverted metastatic tumor cells. Ratios of Dendra2-green and Dendra2-red intensities between macrometastasis-derived photoconverted cells processed and analyzed by flow cytometry 7 hr and 5 min post-conversion. Ratio of fractions of Dendra2-red cells at 7 hr and 5 min (n = 2) independent experiments. Bars represent mean ± SEM in all graphs.
Figure 1—figure supplement 3

Viable isolation of tumor cells by PIC-IT.
(A) Evaluation of DNA integrity of isolated metastatic cells. Immunostaining for γ-H2AX staining intensity (MFI, mean fluorescence intensity) in tumor cells at 24 hr post-isolation (n = 2). (B) Comparison of colony formation ex vivo of photoconverted and non-converted cells derived from macrometastases or primary tumors 6 days post-seeding (n = 2 independent experiments and six technical replicates for each group). A colony was defined as a cell cluster > 10 cells.
Figure 2 with 1 supplement
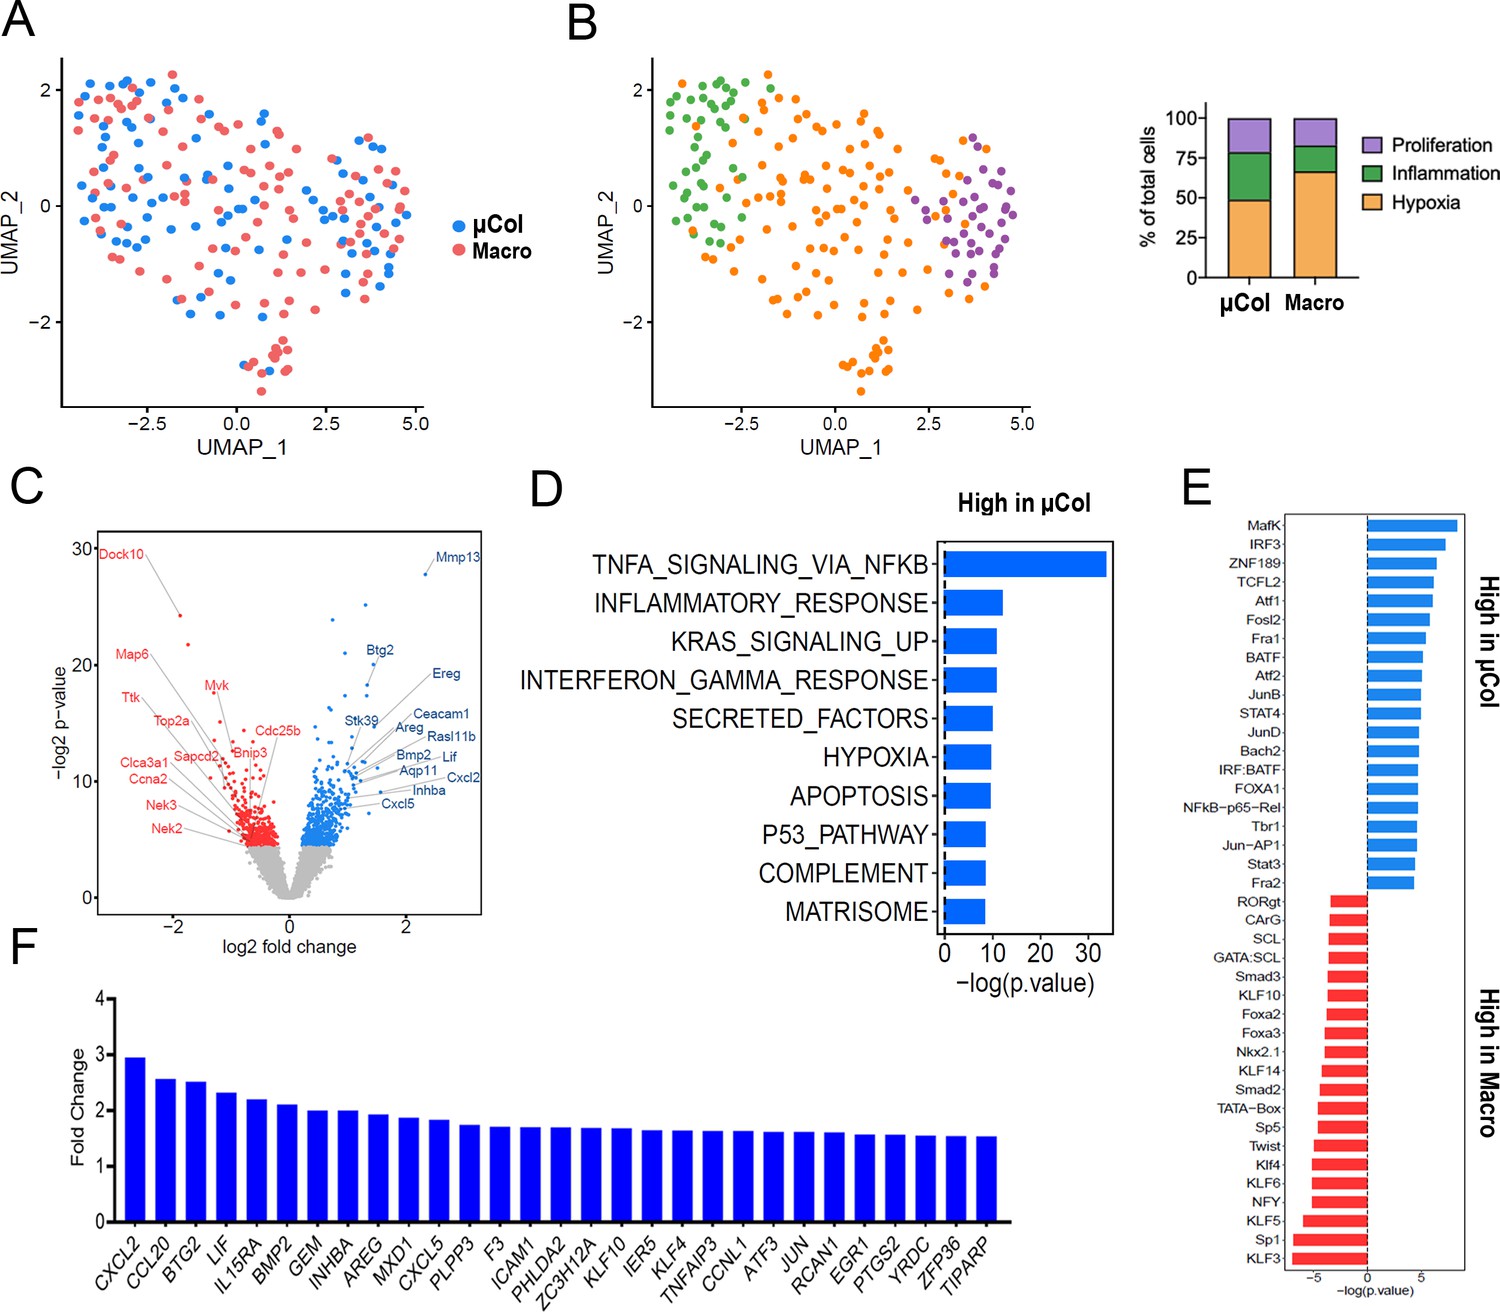
Phenotypic transitions in pancreatic tumor cells colonizing mouse liver.
(A) Transcriptome distribution visualized by UMAP. (B) Distribution of metastatic cells for the different clusters functionally annotated by GSEA msGDMIB (p<0.05, 200 highest fold-change genes). On the right, proportions of clusters in microcolonies and macrometastases. (C) Volcano plot of differentially expressed genes in microcolonies and large metastasis derived from differential gene analysis (EdgeR). (D) Functional annotation of genes upregulated in macrometastasis. GSEA msGDMIB for Hallmark and canonical pathways (p<0.05, 200 highest fold-change genes). (E) Motif analysis of potential transcriptional regulator using HOMER with −1000 bp to +300 bp as scanning region and p<0.05, 200 highest fold-change genes as input (showing known results with p<0.01). (F) Fold-change increase (microcolonies vs. macrometastases) in differentially expressed genes (p<0.05) associated with Hallmark TNF-α-signaling-via-NF-κB signaling category derived from GSEA msGDMIB analysis.
Figure 2—figure supplement 1
Phenotypic transition from microcolony to macrometastasis.
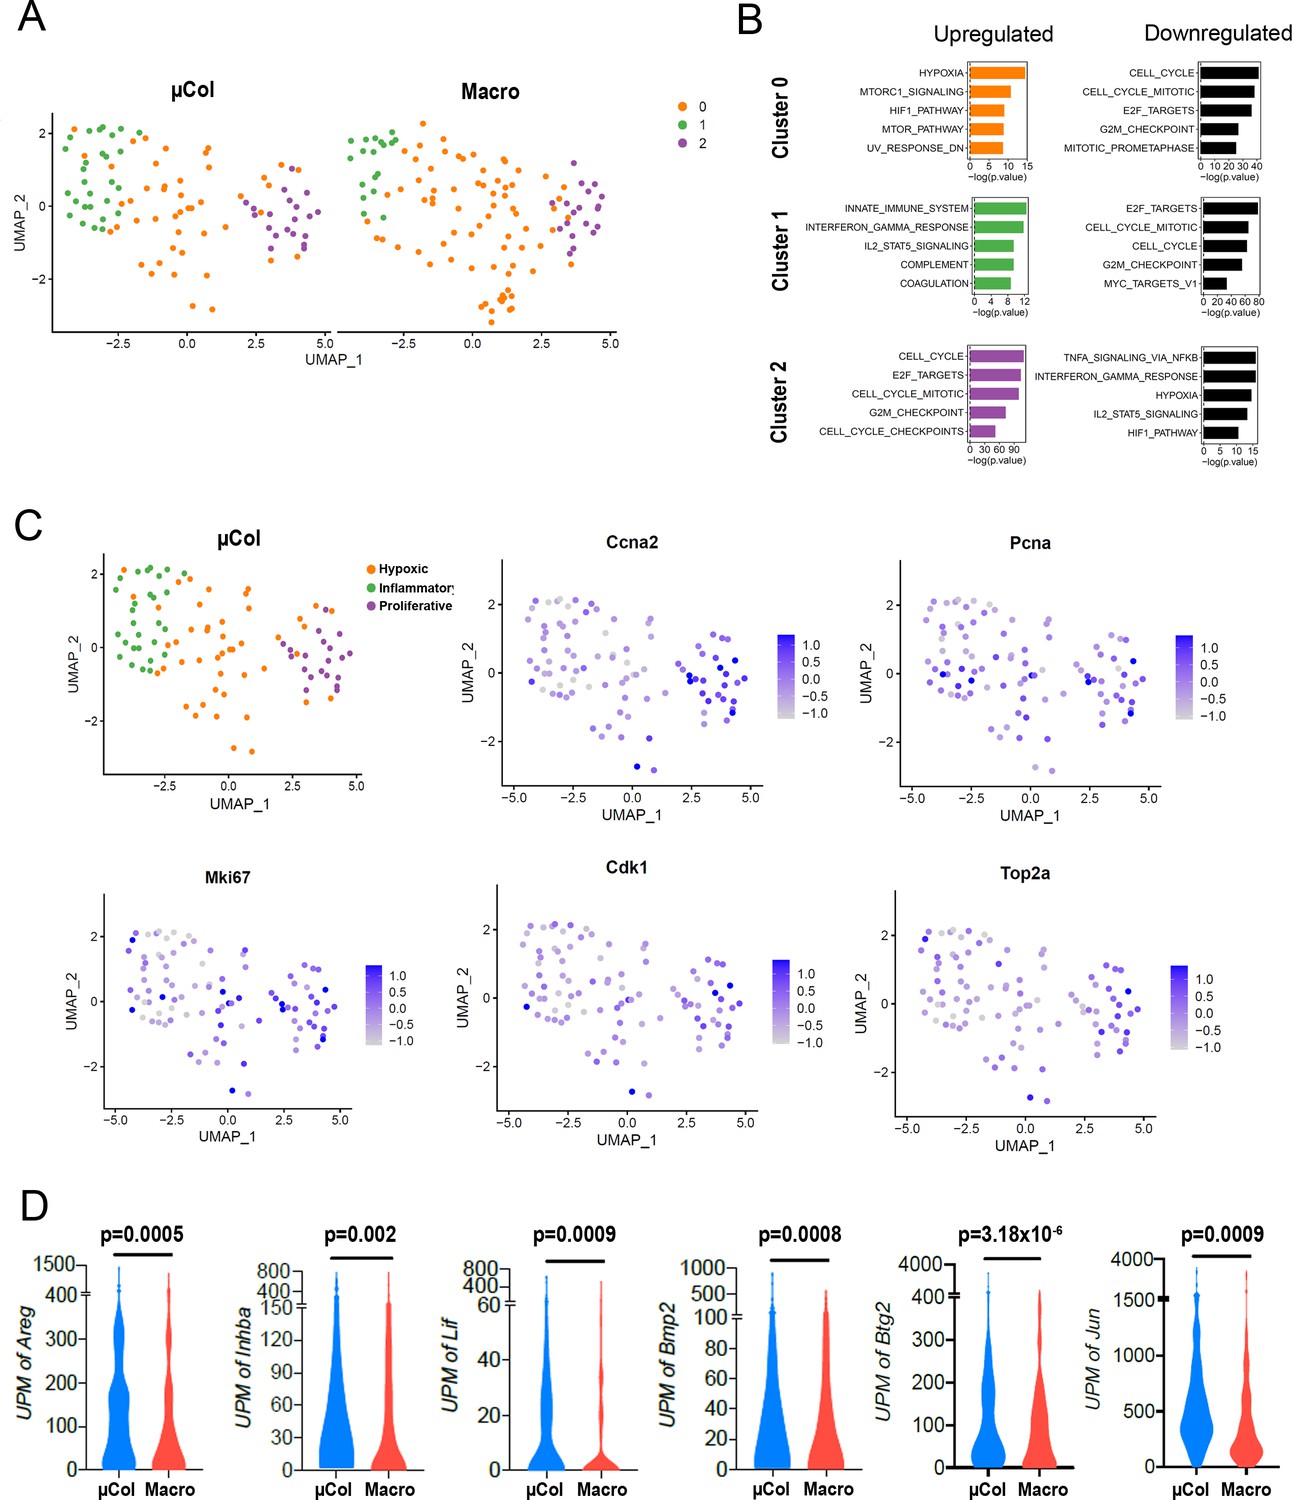
(A) Microcolony and macrometastasis clustering visualized by UMAP. (B) Functional annotation for Hallmark and canonical pathways via GSEA msGDMIB (p<0.05, 200 highest fold-change genes in each cluster). (C) UMAP plots displaying transcript abundance of proliferation markers in Seurat-stratified clusters of microcolonies. (D) Abundance of transcripts in RNA-seq for transcriptional targets of NF-κB significantly upregulated in microcolonies. (NµCol = 94, Nmacro = 110). p-values were calculated by unpaired two-tailed Student’s t-test.
Figure 3

Microcolonies exhibit a hypo-proliferative phenotype.
(A) Functional annotation of genes downregulated in microcolonies/higher in macrometastases. GSEA msGDMIB for Hallmark and canonical pathways (p<0.05, 200 highest fold-change genes). (B) Abundance of transcripts in RNA-seq for genes associated with cell cycle arrest (Top) and positive regulation of mitosis (Bottom). (NµCol = 94, Nmacro = 111). Fraction of Ki-67-positive cells (C) and phosphorylated-histone H3-positive cells (D) in microcolonies and macrometastases as determined by immunostaining (n = 5 samples per group). (E) Representative confocal images of microcolonies and macrometastases from livers of 6419 c5 mice stained with anti-phospho-Rb (pRB; Ser807/811). Scale bar = 50 µm. (F) Fraction of pRB+ microcolonies and macrometastases, and (G) RB phosphorylation levels in pRB-positive cells normalized to average MFI in each mouse (n = 5 samples per group). (H) Fraction of p21+ cells in microcolonies and macrometastases as determined by immunostaining (n = 5 samples per group). (I) Schematic for ex vivo proliferation assay. Microcolonies and macrometastases are extracted via PIC-IT, seeded at 45 cells/96 wells and colony growth is monitored via microscopy over 72 hr. (J) Colony size distribution of metastatic cells over the first 72 hr after isolation. Left panel, colonies derived from microcolonies. Right panel, colonies derived from macrometastases (n = 3 independent experiments). (K) Fraction of isolated metastatic cells residing as solitary cells at 24, 48 and 72 hr post-isolation (n = 3 independent experiments). Bars represent mean ± SEM in all graphs. p-values were calculated by unpaired two-tailed Student’s t-test.
Figure 4 with 1 supplement

Microcolonies are susceptible to inhibition of NF-κB /AP-1 signaling.
(A) Representative confocal images of microcolonies and macrometastases from livers of KPCY mice stained with NF-κB (red) and YFP (green) antibodies. Scale Bar = 50 µm. On the bottom, higher magnification inset showing nuclear signal of NF-κB in 1 µm z-section, with NF-κB (red) and DAPI (blue). Scale bar = 5 µm. (B) Quantification of mean nuclear intensity of NF-κB in microcolonies and macrometastases of orthotopic 6419c5-YFP (top) and KPCY mice (bottom). Each dot represents one animal. (C) Experimental scheme for targeting NF-κB /AP-1 in established tumors with triptolide (TPL). (D–G) Quantification of metastatic colonies in livers of TPL- and vehicle-treated mice. (D) Percentage area of liver occupied by macrometastases. (E) Absolute number of microcolonies per unit area in liver sections. (F) Ratio of microcolony frequency to macrometastatic area. (G) Ratio of metastatic single-cell frequency to macrometastatic area. (For D–G, n = 6 animals per group, 10 liver sections sampled for each animal.) Bars represent mean ± SEM in all graphs. p-values were calculated by unpaired two-tailed Student’s t-test.
Figure 4—figure supplement 1
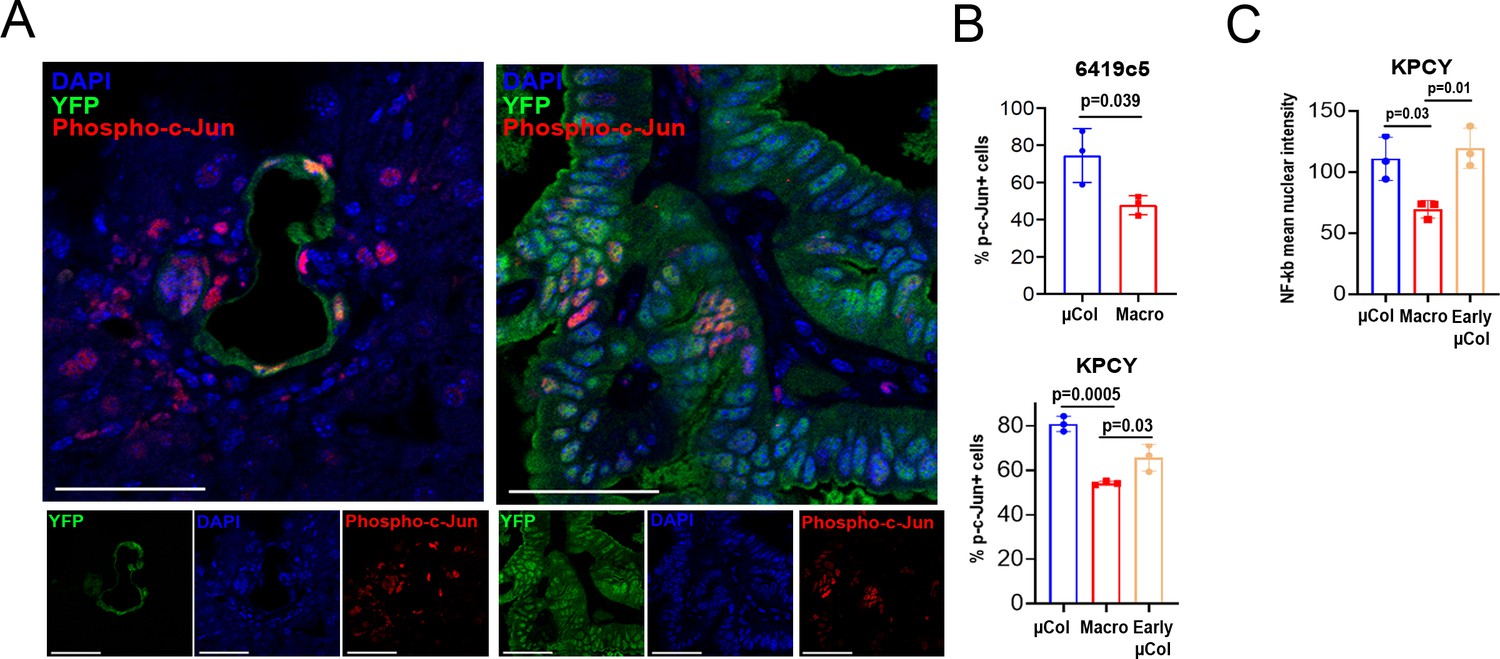
Increased activity of c-JUN and NF-kB in microcolonies.
(A) Representative confocal images of microcolonies and macrometastases from livers of KPCY mice stained with phosphorylated c-Jun (red) and YFP (green) antibodies. Scale bar = 50 µm. On the bottom, individual channels. (B) Fraction of Ser73-phosphorylated c-Jun-positive cells in microcolonies and macrometastases of orthotopic 6419c5-YFP (top) and KPCY mice (Bottom). (n = 3 animals per group). Early µCol denotes early microcolonies (microcolonies in KPCY mice that did not harbor macrometastases). (C) Comparison of mean nuclear intensity of NF-kB between microcolonies, macrometastases, and early microcolonies. Bars represent mean ± SEM in all graphs. p-values were calculated by unpaired two-tailed Student’s t-test. One-way ANOVA was used for comparison of multiple groups with Tukey’s test for multiple comparisons.
Author response image 1
Additional files
Download links
A two-part list of links to download the article, or parts of the article, in various formats.
Downloads (link to download the article as PDF)
Open citations (links to open the citations from this article in various online reference manager services)
Cite this article (links to download the citations from this article in formats compatible with various reference manager tools)
Dissecting phenotypic transitions in metastatic disease via photoconversion-based isolation
eLife 10:e63270.
https://doi.org/10.7554/eLife.63270


