Medical education and distrust modulate the response of insular-cingulate network and ventral striatum in pain diagnosis
- Theory of Pain Laboratory, Department of Psychology, Faculty of Psychology and Educational Sciences (FPSE), University of Geneva, Switzerland
- Geneva Neuroscience Center, University of Geneva, Switzerland
- Swiss Center for Affective Sciences, University of Geneva, Switzerland
- Department of Psychology, Swiss Distance University Institute, Switzerland
Figures
Figure 1
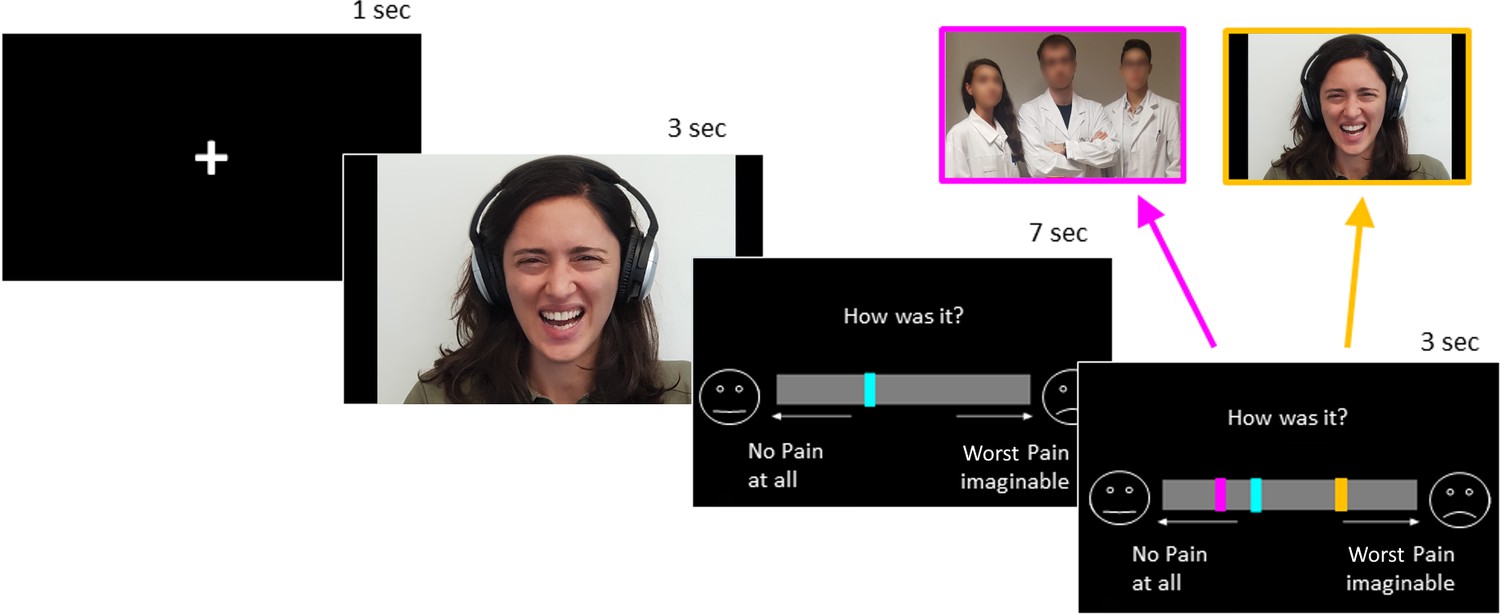
Schematic representation of trial structure in the first session.
For demonstrative purposes, one author of the study (GD) is depicted in the figure expressing pain in similar way to the video-clips used as stimuli (Lamm et al., 2007).
Figure 2
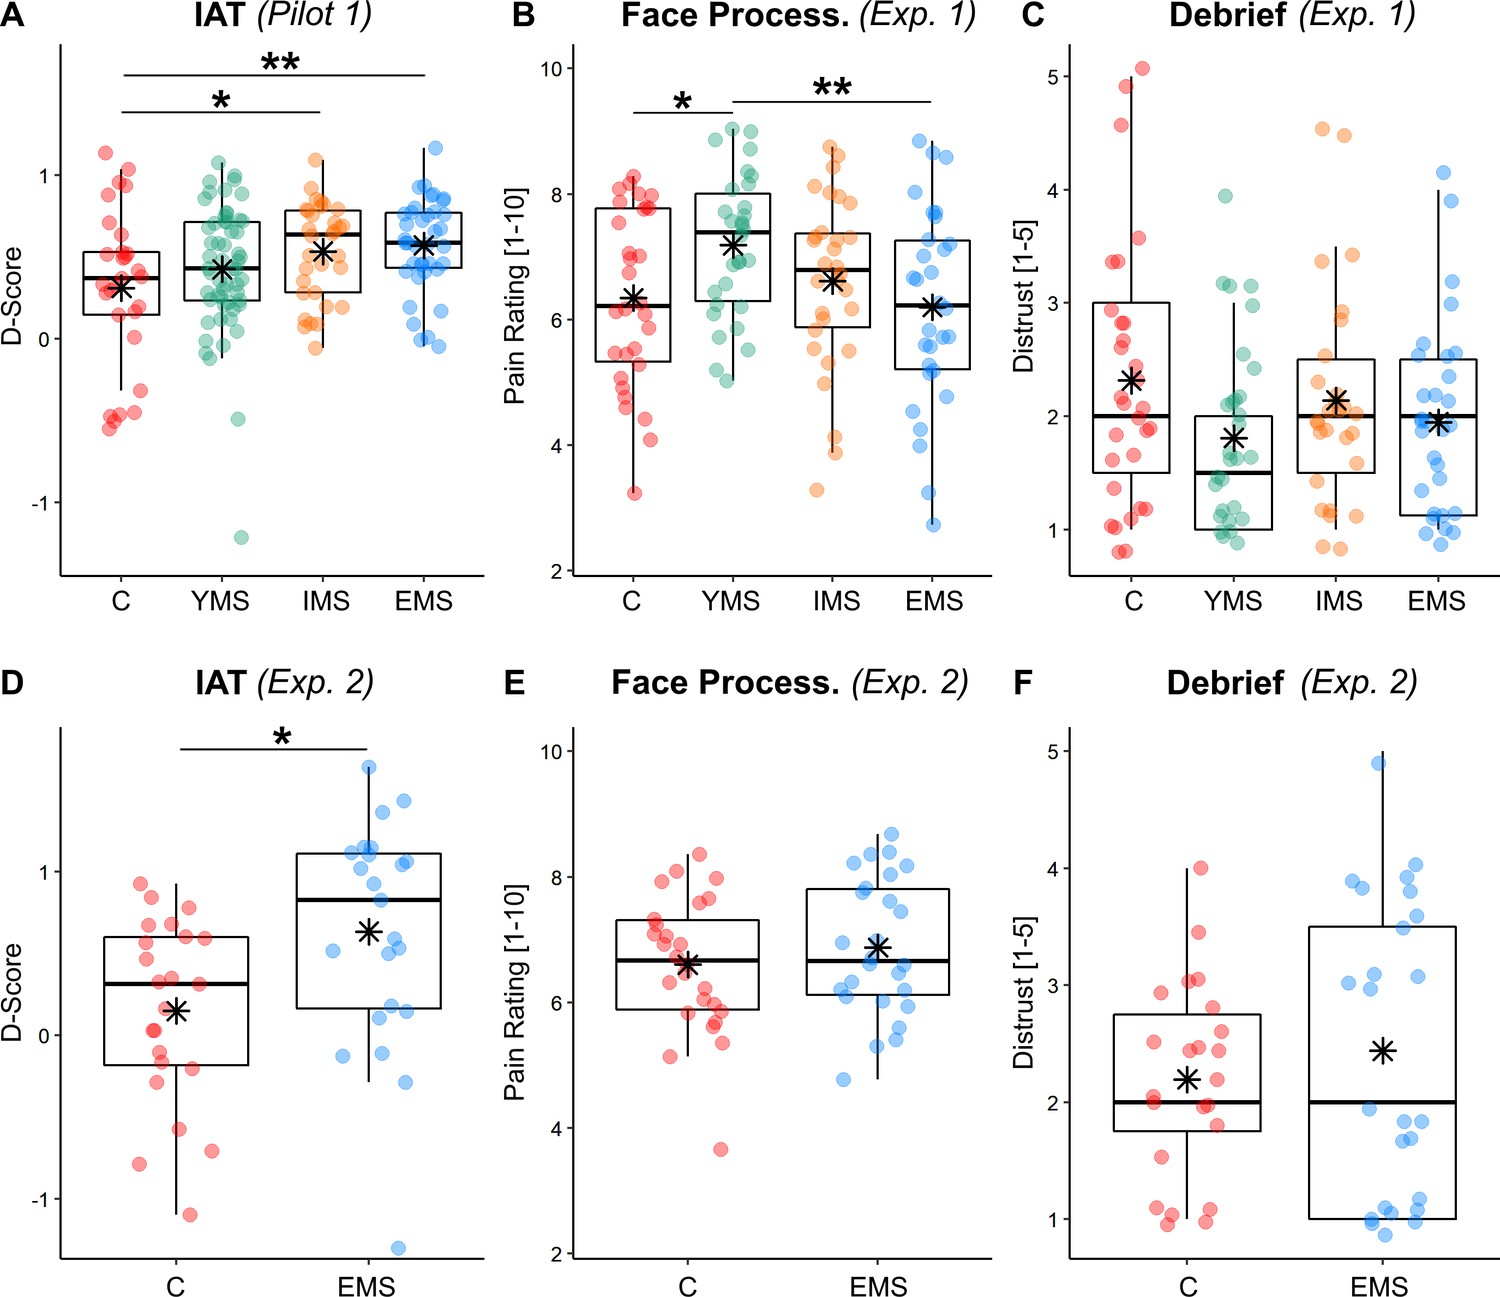
Behavioral Results of IAT and first session.
Boxplots and individual data describing (A–D) the IAT D-score across groups (higher values refer to stronger implicit positive dispositions toward the category of MPs; see Appendix 1); (B–E), Pain Intensity Ratings from first session of the task; (C–F) the Distrust about pain authenticity from the final debrief session. In all plots, data are divided across groups, referring to Controls [C], Young Medical Students [YMS], Intermediate Medical Students [IMS] and Experienced Medical Students [EMS]. For each boxplot graph, the horizontal line represents the median value of the distribution, the star represents the average, the box edges refer to the inter-quartile range, and the whiskers to the data range within 1.5 of the inter-quartile range. Individual data-points are also displayed as dots. '**' and '*' refer to independent sample t-tests associated with p<0.01 and p<0.05, respectively.
Figure 3
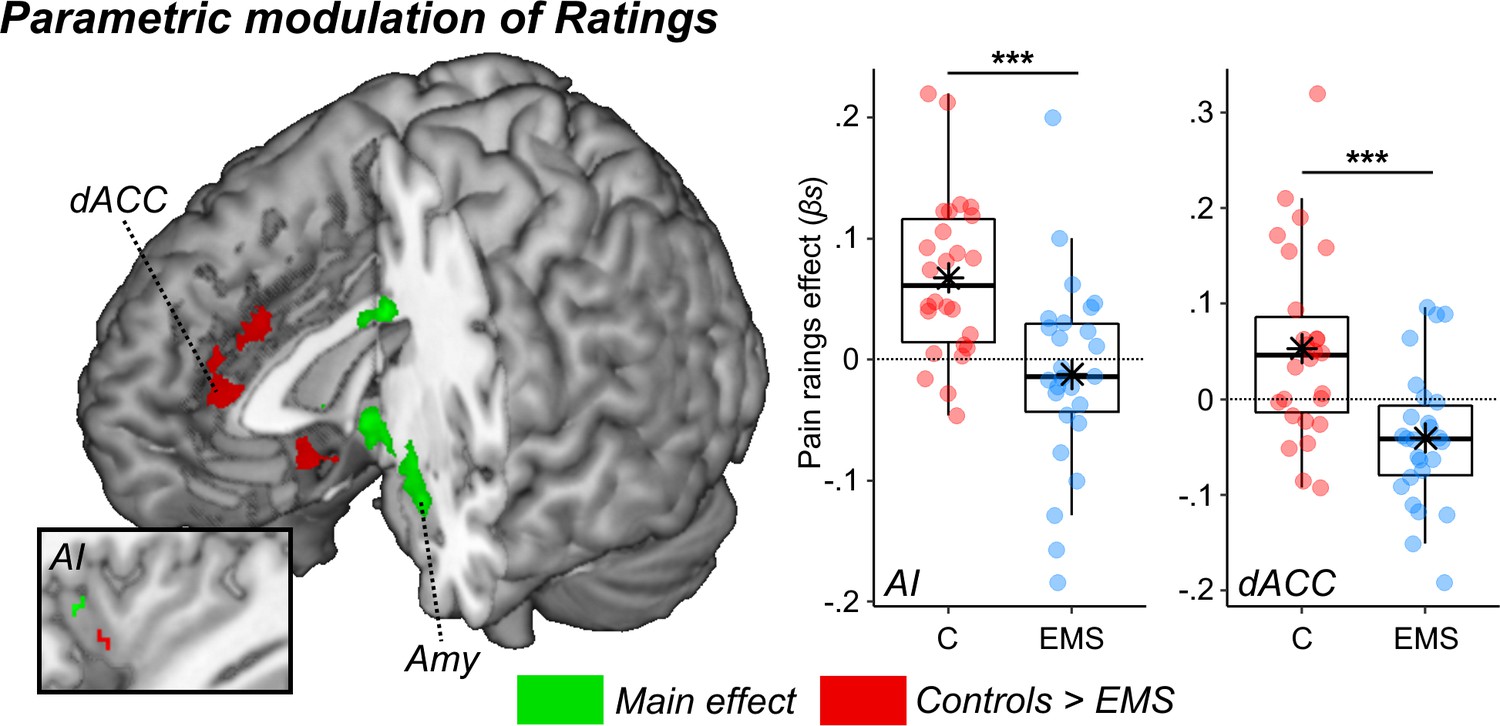
Surface renderings displaying regions implicated in the parametrical modulation of pain ratings.
Effects are displayed under a height threshold corresponding to p<0.001, with each region surviving cluster-correction for multiple comparisons for the whole brain, or associated with a peak surviving small volume correction for a mask of interest (this is the case of the two insular activations). Green blobs describe regions observed when taking into account both groups (main effect), whereas red regions display stronger effects for Controls as opposed to EMS. Parameter estimates from two regions implicated in group differences are displayed through boxplots. AI: Anterior Insula. dACC: dorsal Anterior Cingulate Cortex; Amy: Amygdala.
Figure 4
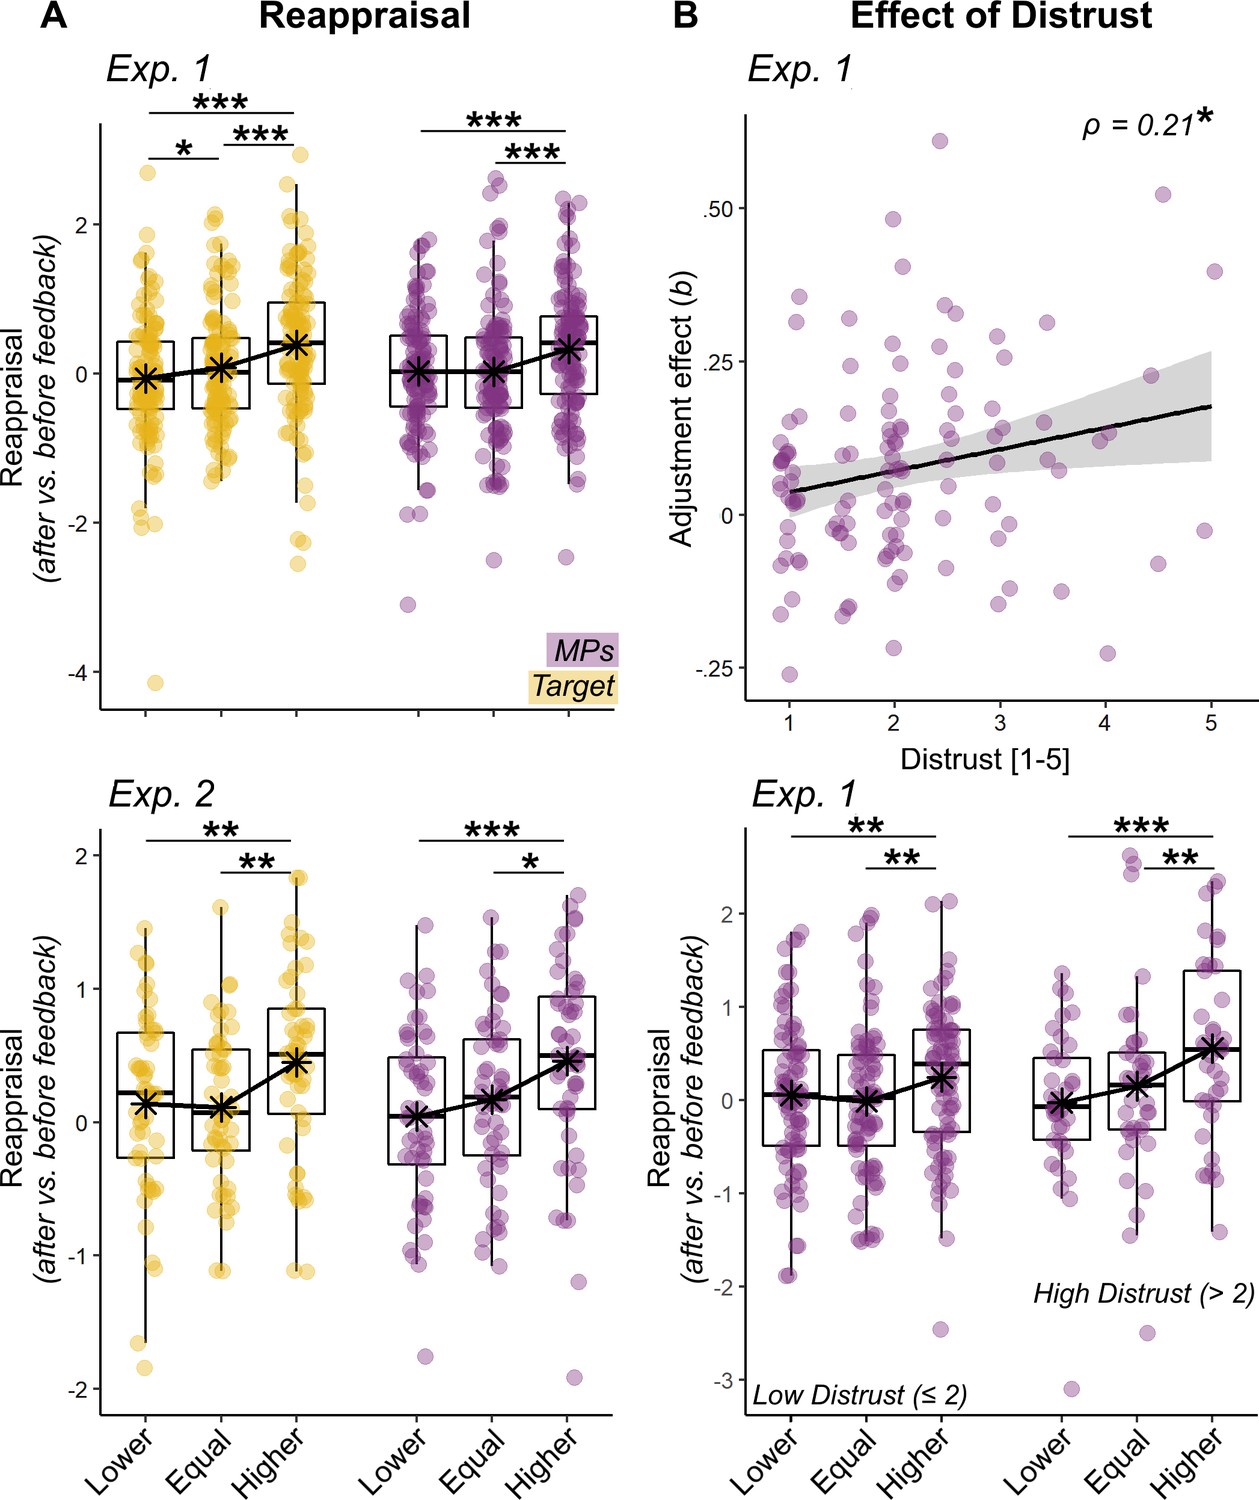
Behavioral Results of Reapprisal and Distrust.
(A) Boxplots and individual data describing the mean. Reappraisal index, resulted from the differential pain rating from two separate sessions (after vs. before presentation of feedbacks). Data are presented separately for Target (yellow dots) and MPs (violet dots) feedbacks, and for their relative position (Lower, Equal, Higher) with respect to participants initial ratings. The top subplot describes the data from Experiment 1, whereas the bottom subplot describes the data from Experiment 2. (B) For Experiment 1, we display also a scatter plot and confidence intervals area describing individual effects of MPs feedbacks’ on Reappraisal plotted against Distrust (top row). Parameters (b) were obtained by a linear regression, similar to that used in the main analysis, but run separately for each individual subject. The higher b, the more the reappraisal is explainable according to the position of a specific feedback. The linear relation is further explored through boxplots displaying the Reappraisal for MPs’ feedbacks, separately for individuals with high/low levels of distrust (bottom row). Note that in all subplots the feedbacks’ position is displayed across three discrete categories to improve readability, although in the experiment it changed across a continuum. ‘***”, ‘**”, ‘*” refer to significance associated with paired t-tests or Spearman’s ρ rank-correlation coefficient at p<0.001, p<0.01, and p<0.05 respectively.
Figure 5

Surface rendering showing significant increase of neural activity associated with the (A) deviation or (B) agreement with the social feedbacks.
Activation associated with the Target are displayed in yellow, whereas those associated with the MPs are displayed in violet. Common responses across the two kinds of feedbacks are displayed in light white. (C) Regions showing differential agreement effects with the Target and MPs feedbacks. All effects are displayed under a height threshold corresponding to p<0.001, with each region surviving cluster-correction for multiple comparisons for the whole brain. dpMPFC: dorsal-posterior Medial Prefrontal Cortex; vMPFC: ventral Medial prefrontal Cortex; TP: Temporal Pole; MFC: Middle Frontal Gyrus; IFG: Inferior Frontal Gyrus; AI: Anterior Insula; SPC: Superior Parietal Cortex; IOG: Inferior Occipital Gyrus; VS: Ventral Striatum. (D) Parameter estimates extracted from two regions of interest and displayed separately for Target (yellow dots) and MPs (violet dots) feedbacks, and for their relative position (Lower, Equal, Higher) with respect to participants ratings. Note that feedbacks’ position is displayed across three discrete categories to improve readability, although in the experiment it changed across a continuum (see Materials and methods). '***', '**', and '*' refer to t-tests associated with p<0.001, p<0.01, and p<0.05, respectively.
Figure 6

Distrust effect.
(A) Surface rendering displaying the effects of agreement toward the Target feedback interacting with Distrust. The effect is displayed under a height threshold corresponding to p<0.001, and survivse cluster-correction for multiple comparisons for the whole brain. (B) The parameters extracted by the highlighted Ventral Striatum (VS) plotted against Distrust self-reports in a linear regression with confidence intervals area (higher parameters reflect stronger agreement effects). (C) The linear regression is further explored through boxplots displaying VS neural activity separately for Target (yellow dots) and MPs (violet dots) feedbacks, for their relative position (Lower, Equal, Higher) with respect to participants ratings, and separately for individuals with high/low levels of distrust. Parameter plots are associated with Spearman’s ρ rank-correlation coefficient or paired-sample t-test, with '***', '**', and '*' referring to significance at p<0.001, p<0.01, and p<0.05, respectively.
Appendix 1—figure 1
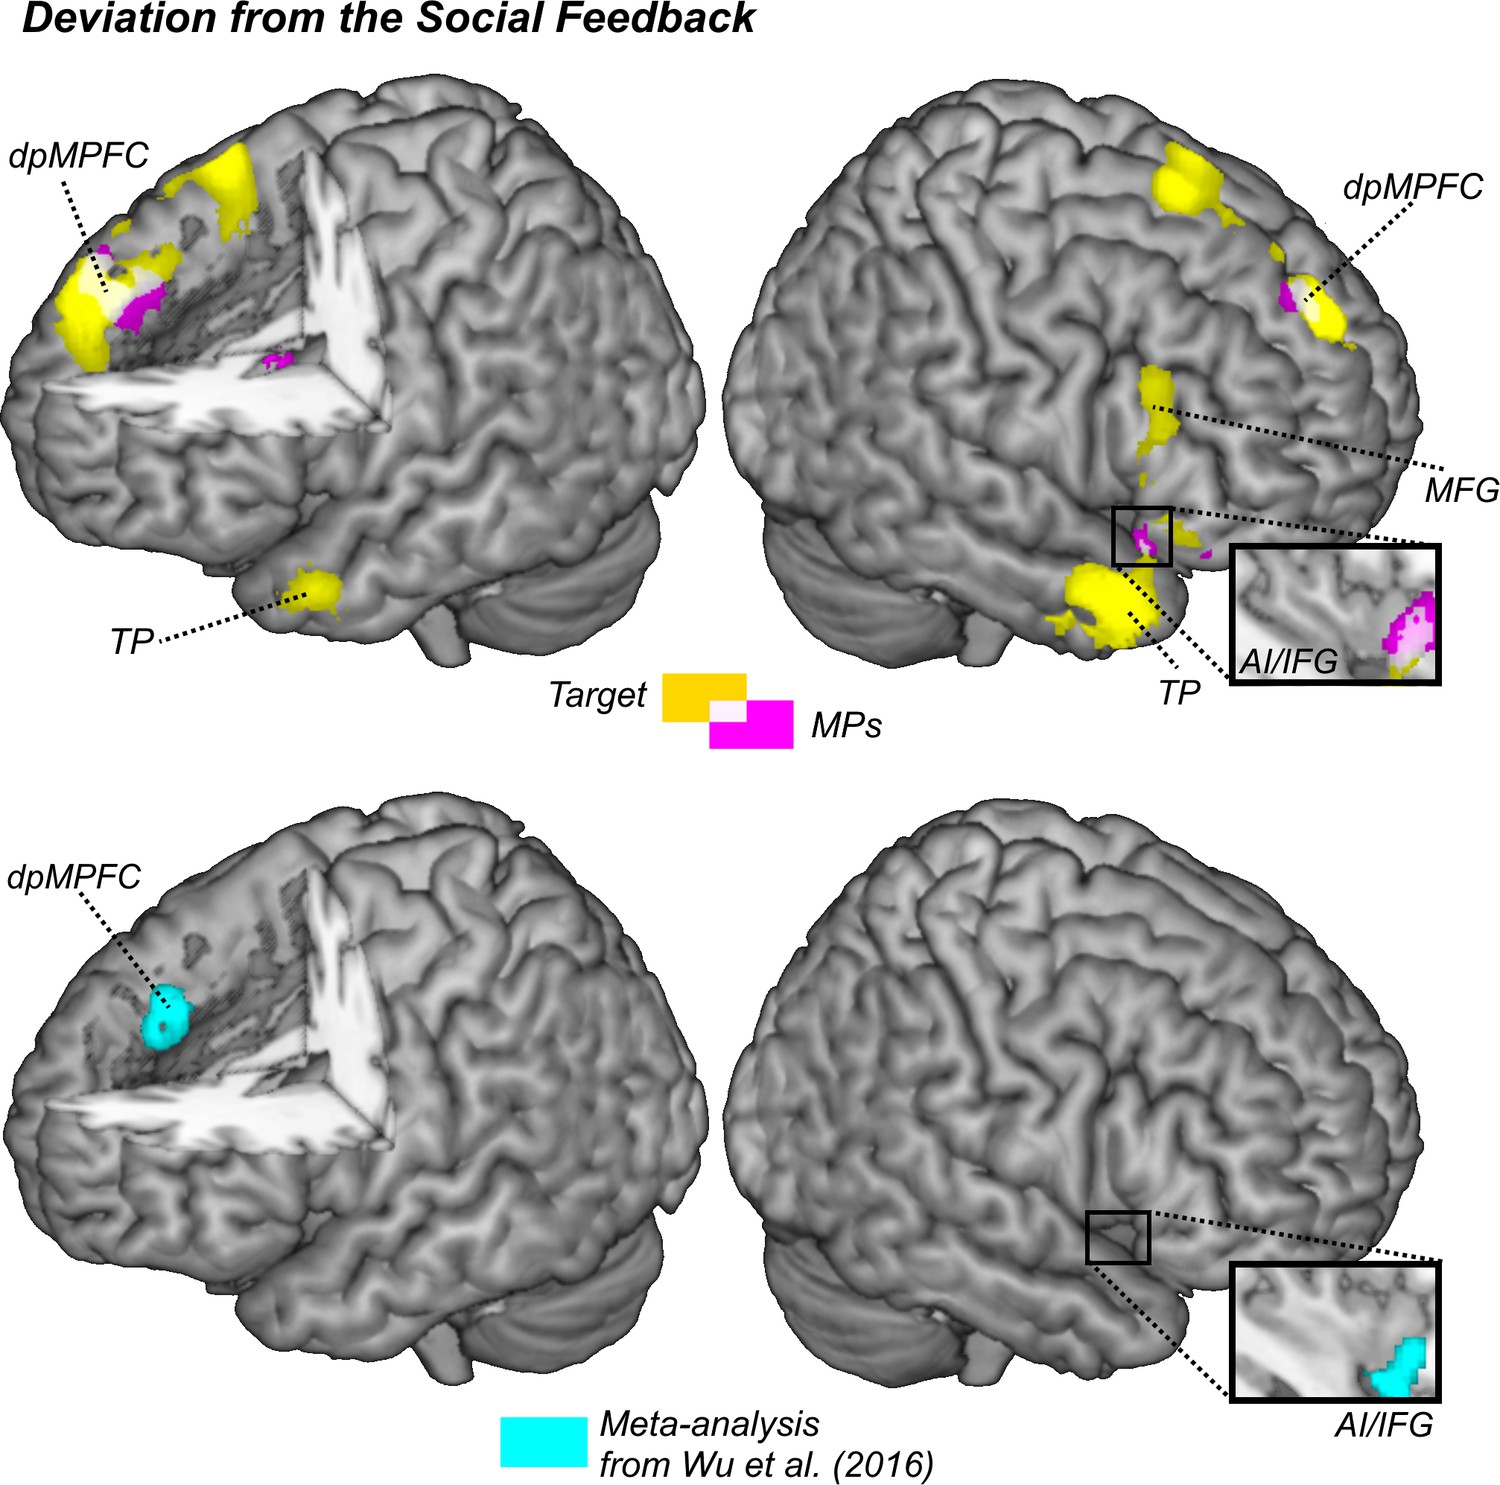
Surface renderings displaying regions implicated in the deviation from the social feedback.
Yellow blobs refer to regions implicated in the deviation from the Target’s feedback, whereas violet blobs refer to regions implicated in the MPs feedback. White blobs refer to regions implicated in both feedbacks. Finally cyan blobs describe regions implicated in disagreement from the social group in the meta-analysis from Wu et al., 2016. All effects are displayed under a height threshold corresponding to p<0.001, with each region surviving cluster-correction for multiple comparisons for the whole brain. dpMPFC: dorsal-posterior Medial Prefrontal Cortex; TP: Temporal Pole; MFG: Middle Frontal Gyrus; IFG: Inferior Frontal Gyrus; AI: Anterior Insula.
Appendix 1—figure 2

Surface renderings displaying regions showing group differences associated with processing (A) the Target’s and (B) the MPs’ feedback.
Parameter estimates extracted from the outlined regions are displayed separately for Controls (red dots) and EMS (blue dots), and for their relative position (Lower, Equal, Higher) with respect to the initial ratings. All effects are displayed under a height threshold corresponding to p<0.001, with each region surviving cluster-correction for multiple comparisons for the whole brain. Note that feedbacks’ position is displayed across three discrete categories to improve readability, although in the experiment it changed across a continuum (see methods). SMG: Supramarginal Gyrus; MCC: Middle Cingulate Cortex.
Author response image 1
Tables
Appendix 1—table 1
Demographic characteristics of the sample tested in the present study.
| Experiment 1 | Experiment 2 | |||||
|---|---|---|---|---|---|---|
| Group | Controls | YMS | IMS | EMS | Controls | EMS |
| Size | 30 | 30 | 30 | 30 | 26 | 26 |
| Age (sd) | 25.03 (4.75) | 21.37 (3.81) | 22.03 (1.40) | 24.25 (2.00) | 23.73 (4.11) | 24.15 (1.41) |
| Males | 12 (40%) | 6 (20%) | 10 (33.33%) | 10 (33.33%) | 13 (50%) | 9 (34.62%) |
| Pilot 1 | Pilot 2 | Pilot 3 | ||||
| Group | Controls | YMS | IMS | EMS | Controls | Controls |
| Size | 29 | 56 | 32 | 38 | 24 | 23 |
| Age (sd) | 21.69 (3.52) | 20.11 (2.33) | 22.03 (1.43) | 24.34 (1.68) | 23.54 (4.12) | 22.26 (3.86) |
| Males | 4 (13.79%) | 16 (28.57%) | 6 (18.75%) | 15 (39.47%) | 7 (29.17%) | 11 (47.83%) |
Appendix 1—table 2
Group differences in Empathic and personality traits, and in scores of pain sensitivity and coping.
Scores are described in terms of mean and standard deviation. Italicized values on grey background refer to significant group differences, as measured through one-way Analysis of Variance (Exp. 1, SPQ P: F(3,116) = 5.73, p=0.001; Exp. 2, BF C: F(1,48) = 8.80, p=0.005; all other variables: Exp. 1, F(3,116) ≤ 2.35, p≥0.076, Exp. 2, F(1,48) ≤ 2.96, p≥0.092). IRI: Interpersonal Reactivity Index; PT: Perspective Taking; EC: Empathic Concern; PD: Personal Distress; FS: Fantasy; SPQ: Situational Pain Questionnaire; P: Receiver operating characteristic curve probability; PCS: Pain Catastrophizing Scale; BF: Big Five Inventory; E: extroversion; A: agreeableness; C: conscientiousness; N: neuroticism; O: openness.
| Experiment 1 | Experiment 2 | |||||
|---|---|---|---|---|---|---|
| Group | Controls | YMS | IMS | EMS | Controls | EMS |
| IRI PT | 20.47 (3.87) | 20.83 (4.50) | 18.87 (4.12) | 20.37 (3.62) | 19.76 (9.93) | 21.76 (4.28) |
| IRI EC | 20.40 (4.91) | 22.70 (3.46) | 21.30 (2.83) | 21.90 (2.92) | 20.80 (4.16) | 20.24 (4.24) |
| IRI PD | 12.77 (5.86) | 10.30 (4.40) | 10.37 (3.76) | 10.53 (5.46) | 12.32 (6.19) | 10.48 (4.25) |
| IRI FS | 18.03 (5.60) | 20.47 (4.76) | 17.87 (5.55) | 18.73 (4.69) | 17.96 (7.18) | 17.96 (5.86) |
| SPQ P | 0.89 (0.08) | 0.94 (0.05) | 0.94 (0.04) | 0.94 (0.05) | 0.92 (0.05) | 0.94 (0.04) |
| PCS | 20.27 (10.04) | 21.70 (5.45) | 22.93 (7.72) | 17.97 (6.52) | 20.56 (9.92) | 19.84 (5.70) |
| BF E | 29.00 (5.13) | 28.53 (6.39) | 28.53 (6.85) | 27.33 (6.82) | 24.76 (6.22) | 27.00 (6.79) |
| BF A | 38.57 (5.95) | 38.87 (6.58) | 38.87 (5.59) | 41.77 (3.75) | 40.16 (4.04) | 41.96 (3.92) |
| BF C | 33.47 (4.97) | 35.03 (5.63) | 33.23 (6.00) | 33.10 (6.80) | 31.08 (5.09) | 35.20 (4.72) |
| BF N | 23.13 (6.25) | 22.10 (6.41) | 22.10 (6.50) | 21.23 (7.14) | 21.68 (7.19) | 19.68 (6.13) |
| BF O | 38.87 (5.88) | 37.53 (6.60) | 37.17 (6.45) | 37.27 (6.99) | 35.64 (6.36) | 36.84 (6.69) |
Appendix 1—table 3
Regions implicated when observing painful facial expressions.
As default regions are displayed if surviving correction for multiple comparisons for the whole brain at the cluster level. Entries in italic refer to regions surviving only small volume correction for brain structures implicated in previous meta-analyses on the same paradigm (Kogler et al., 2020). Coordinates (in standard MNI space) refer to maximally activated foci as indicated by the highest t value within an area of activation: x = distance (mm) to the right (+) or the left (−) of the midsagittal line; y = distance anterior (+) or posterior (−) to the vertical plane through the anterior commissure (AC); z = distance above (+) or below (−) the inter-commissural line. L and R refer to the left and right hemisphere, whereas M refers to medial structures.
| SIDE | Coordinates | T | Cluster size | |||
|---|---|---|---|---|---|---|
| X | Y | Z | ||||
| Parametric modulation of Ratings (positive effect) | ||||||
| Anterior Insula (AI) | L | −38 | 20 | 0 | 3.71† | 2 |
| Middle Cingulate Cortex | M | -4 | -4 | 26 | 4.80 | 187* |
| Amygdala (Amy) | L | −20 | -8 | −10 | 4.74 | 489*** |
| Periaqueductal Grey | M | 6 | −26 | −12 | 3.78 | |
| Fusiform Gyrus | R | 34 | −72 | −10 | 4.09 | 652*** |
| Superior Occipital Gyrus | R | 32 | −80 | 18 | 4.51 | |
| Middle Temporal Gyrus | R | 44 | −58 | 0 | 4.81 | |
| Parametric modulation of Ratings: Controls > EMS | ||||||
| Anterior Insula (AI) | L | −36 | 12 | -8 | 3.72† | 3 |
| dorsal Ant. Cingulate Cortex (dACC) | M | -6 | −38 | 8 | 4.30 | 203* |
| Caudate | L | -8 | 12 | -6 | 4.59 | 227* |
| Caudate | R | 8 | 14 | -6 | 4.12 | 219* |
| Basal Forebrain | R | 18 | 8 | −16 | 4.51 | |
-
***p < 0.001; **p<0.01; *p<0.05 family-wise corrected for the whole brain.
†p<0.05 small volume corrected for conjoint activation between self and others’ pain from Kogler et al., 2020.
Appendix 1—table 4
Target.
Regions modulated linearly by the absolute distance between participants’ ratings and the Target’s Feedback position. All regions survived correction for multiple comparisons for the whole brain at the cluster level, or small volume correction for brain structures implicated in previous meta-analyses on the same paradigm (Wu et al., 2016).
| SIDE | Coordinates | T | Cluster size | |||
|---|---|---|---|---|---|---|
| X | Y | Z | ||||
| Feedback discrepancy | ||||||
| dorsal-post. Medial Prefrontal Cortex (dpMPFC) | M | 6 | 54 | 38 | 6.84 | 692*** |
| Supplementary Motor Area | M | 8 | 16 | 68 | 6.01 | 792*** |
| Ant. Insula/Inf. Front. Gyrus (AI/IFG) | R | 46 | 26 | -6 | 4.42 | 1437*** |
| Temporal Pole (TP) | R | 48 | 14 | −28 | 7.08 | |
| Middle Frontal Gyrus (MFG) | R | 56 | 28 | 32 | 4.32 | 219* |
| Temporal Pole (TP) | L | −54 | 14 | −26 | 4.70 | 184* |
| Occipital Pole | L | −16 | −86 | -8 | 7.75 | 1327*** |
| Occipital Pole | R | −14 | −88 | 2 | 6.19 | |
| Feedback agreement | ||||||
| Ventral Striatum (VS)/Putamen | L | -8 | 10 | -8 | 6.09 | 254** |
| Ventral Striatum (VS)/Putamen | R | 14 | 14 | -6 | 6.26 | 724*** |
| ventral Medial Prefrontal Cortex (vMPFC) | M | −12 | 38 | −12 | 4.64 | 373** |
| Middle Cingulate Gyrus | M | 6 | 0 | 36 | 4.17 | 184* |
| Superior Frontal Gyrus | L | −14 | 32 | 40 | 4.99 | 371** |
| Superior Parietal Cortex (SPC) | L | −26 | −52 | 62 | 5.51 | 7245*** |
| Postcentral Gyrus | L | −54 | −24 | 38 | 7.92 | |
| Middle Insula/Putamen | L | −24 | −10 | 6 | 4.47 | |
| Superior Parietal Cortex (SPC) | R | 26 | −52 | 68 | 6.42 | 6324*** |
| Postcentral Gyrus | R | 36 | −32 | 32 | 6.47 | |
| Middle Insula/Putamen | R | 26 | -8 | 6 | 4.80 | |
| Inferior Occipital Gyrus (IOG) | L | −30 | −90 | -8 | 6.96 | 4537*** |
| Inferior Temporal Gyrus | L | −46 | −64 | -8 | 5.13 | |
| Middle Temporal Gyrus | L | −56 | −56 | −10 | 5.22 | |
| Inferior Occipital Gyrus (IOG) | R | 34 | −88 | -8 | 8.01 | 3346*** |
| Inferior Temporal Gyrus | R | 54 | −50 | −20 | 4.20 | |
| Cerebellum | M | -2 | −56 | −24 | 5.13 | 705*** |
| Feedback discrepancy: Controls > EMS | ||||||
| Supramarginal Gyrus (SMG) | L | −64 | −48 | 30 | 4.73 | 547*** |
| Feedback agreement: effect of Distrust (negative modulation) | ||||||
| Ventral Striatum (VS) | M | 0 | 10 | 4 | 3.55† | 3 |
-
***p < 0.001; **p<0.01; *p<0.05 family-wise corrected for the whole brain.
†p<0.05 small volume corrected for the contrast ‘agree >disagree’ from Wu et al., 2016.
Appendix 1—table 5
MPs.
Regions modulated linearly by the absolute distance between participants’ ratings and the MPs Feedback position.
| SIDE | Coordinates | T | Cluster size | |||
|---|---|---|---|---|---|---|
| X | Y | Z | ||||
| Feedback discrepancy | ||||||
| dorsal-post. Medial Prefrontal Cortex (dpMPFC) | M | 8 | 38 | 38 | 4.32 | 272** |
| Caudate | M | 6 | 6 | 16 | 4.92 | 186* |
| Ant. Insula/Inf. Front. Gyrus (AI/IFG) | R | 42 | 26 | -8 | 5.08 | 471*** |
| Occipital Pole | L | −14 | −88 | -2 | 5.58 | 1002*** |
| Occipital Pole | R | 18 | −82 | -6 | 5.70 | |
| Feedback agreement | ||||||
| Superior Parietal Cortex (SPC) | R | 28 | −54 | 62 | 5.84 | 1531*** |
| Supramarginal Gyrus | R | 64 | −26 | 46 | 6.52 | |
| Superior Parietal Cortex (SPC) | L | −34 | −48 | 64 | 6.78 | 3023*** |
| Supramarginal Gyrus | L | −60 | −24 | 38 | 6.12 | |
| Inferior Occipital Gyrus (IOG) | R | 47 | −70 | −10 | 8.16 | 2321*** |
| Inferior Temporal Gyrus | R | 52 | −46 | −22 | 4.78 | |
| Inferior Occipital Gyrus (IOG) | L | −32 | −90 | −14 | 7.62 | 1542*** |
| Inferior Temporal Gyrus | L | −50 | −62 | -6 | 7.62 | |
| Feedback discrepancy: Controls > EMS | ||||||
| Middle Cingulate Cortex (MCC) | M | 10 | −10 | 46 | 4.49 | 598*** |
| Feedback agreement: effect of Distrust (positive modulation) | ||||||
| Retrosplenial Cortex | R | 28 | −60 | 22 | 4.99 | 187* |
-
***p < 0.001; **p<0.01; *p<0.05 family-wise corrected for the whole brain.
Appendix 1—table 6
Target vs MPs.
Regions showing differential effects between the two feedbacks.
| Feedback agreement: Target > MPs | ||||||
|---|---|---|---|---|---|---|
| Ventral Striatum/Putamen | R | 16 | 12 | -8 | 5.96 | 570*** |
| Middle Insula | R | 34 | 2 | 14 | 3.94 | 558*** |
| Caudate | R | 16 | -2 | 22 | 6.30 | |
| Ventral Striatum/Putamen | L | −26 | 10 | -4 | 4.35 | 887*** |
| Middle Insula | L | −40 | -2 | 8 | 5.34 | |
| Caudate | L | −20 | 2 | 22 | 5.03 | |
| Thalamus | L | −18 | −20 | 18 | 6.08 | |
| Feedback agreement: (Target > MPs)*Distrust (positive modulation) | ||||||
| Ventral Striatum | R | 14 | 20 | 6 | 4.94 | 227** |
| Supplementary Motor Area | M | -4 | 24 | 40 | 4.22 | 286** |
-
***p < 0.001; **p<0.01; family-wise corrected for the whole brain.
†p<0.05 small volume corrected for the contrast ‘agree >disagree’ from Wu et al., 2016.
Appendix 1—table 7
Average non-grey matter nuisance covariate, defined through the coordinates whose grey matter probability is <0.02.
Table below represents the effects of a GLM similar to the one used in the main neuroimaging analysis but applied only to such estimate of nuisance signal with MarsBaR 0.44 toolbox (http://marsbar.sourceforge.net/). Group-level main effects were explored through one-sample t-tests on the GLM parameters. Groups differences were explored through two-sample t-tests, whereas linear effects of Distrust were analyzed through Spearman rank correlation. None of the effects were significant.
| Faces | No Grey Matter Signal (GM p < 0.02) | |
|---|---|---|
| Controls vs. EMS | t(50) = −1.69 | |
| Parametric Modulation (PM) of Pain Ratings | ||
| Main effect | t(51) = −0.78 | |
| Controls vs. EMS | t(50) = −0.99 | |
| PM of Protagonist’s Feedback Position | ||
| Main effect | t(51) = −1.90 | |
| Controls vs. EMS | t(50) = 0.94 | |
| Distrust | ρ = −0.06 | |
| PM of MP’s Feedback Position | ||
| Main effect | t(51) = −1.18 | |
| Controls vs. EMS | t(50) = 1.97 | |
| Distrust | ρ = −0.14 | |
| PM of Protagonist vs. MP’s Feedback Position | ||
| Main effect | t(51) = −0.92 | |
| Controls vs. EMS | t(50) = −0.24 | |
| Distrust | ρ = 0.07 | |
Author response table 1
| Global Signal | No Grey Matter Signal (GM p < 0.02) | |
|---|---|---|
| Faces | ||
| Controls vs. EMS | t(50) = -2.18* | t(50) = -1.69 |
| Parametric Modulation (PM) of Pain Ratings | ||
| Main effect | t(51) = 0.75 | t(51) = -0.78 |
| Controls vs. EMS | t(50) = 0.34 | t(50) = -0.99 |
| PM of Protagonist’s Feedback Position | ||
| Main effect | t(51) = -2.74** | t(51) = -1.90 |
| Controls vs. EMS | t(50) = 0.64 | t(50) = 0.94 |
| Distrust | ρ = 0.04 | ρ = -0.06 |
| PM of MP’s Feedback Position | ||
| Main effect | t(51) = 0.13 | t(51) = -1.18 |
| Controls vs. EMS | t(50) = 2.04* | t(50) = 1.97 |
| Distrust | ρ = -0.20 | ρ = -0.14 |
| PM of Protagonist vs. MP’s Feedback Position | ||
| Main effect | t(51) = -2.32* | t(51) = -0.92 |
| Controls vs. EMS | t(50) = -0.63 | t(50) = -0.24 |
| Distrust | ρ = 0.21 | ρ = 0.07 |
| **p < 0.01, *p < 0.05 |
Additional files
Download links
A two-part list of links to download the article, or parts of the article, in various formats.
Downloads (link to download the article as PDF)
Open citations (links to open the citations from this article in various online reference manager services)
Cite this article (links to download the citations from this article in formats compatible with various reference manager tools)
Medical education and distrust modulate the response of insular-cingulate network and ventral striatum in pain diagnosis
eLife 10:e63272.
https://doi.org/10.7554/eLife.63272


