Ablation of STAT3 in Purkinje cells reorganizes cerebellar synaptic plasticity in long-term fear memory network
- Department of Physiology, Seoul National University College of Medicine, Republic of Korea
- Department of Brain and Cognitive Sciences, Seoul National University Graduate School, Republic of Korea
- Memory Network Medical Research Center, Seoul National University College of Medicine, Republic of Korea
- Neuroscience Research Institute, Seoul National University College of Medicine, Republic of Korea
- Department of Pharmacology, Seoul National University College of Medicine, Republic of Korea
- Department of Biomedical Sciences, Seoul National University College of Medicine, Republic of Korea
- Department of Biochemistry and Molecular Biology, Seoul National University College of Medicine, Republic of Korea
Figures
Figure 1 with 1 supplement
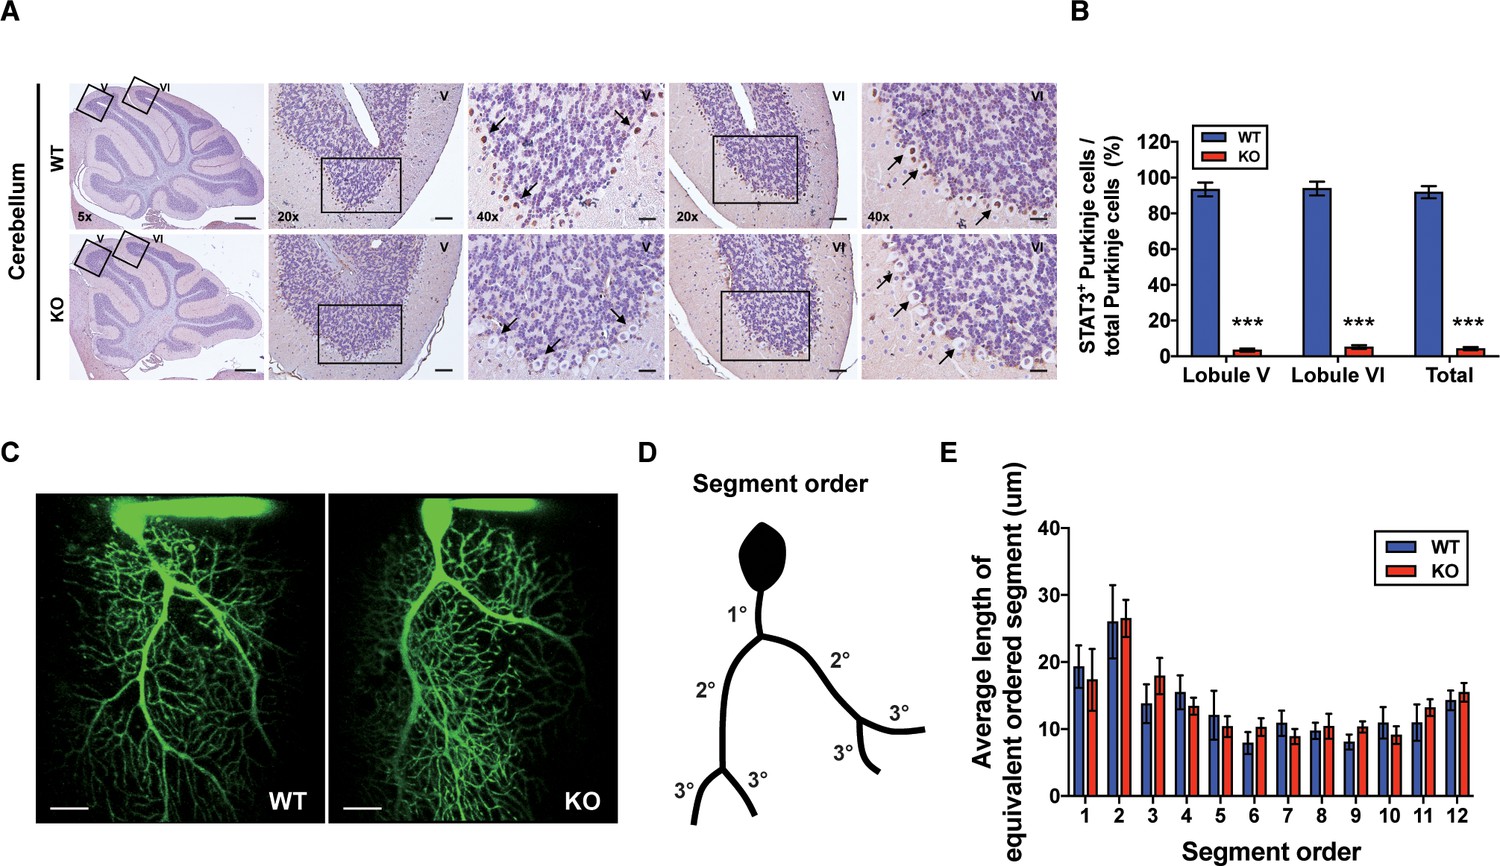
Generation of Purkinje cell (PC)-specific STAT3 knockout mice.
(A) Immunohistochemistry analysis for STAT3 in cerebellar slices from wild-type (WT) and STAT3PKO mice. Scale bars of 5× image = 1 mm, 20× image = 100 μm, and 40× image = 50 μm. Arrows indicate PC expressing (brown) or not (blue) STAT3. (B) Bar graph shows quantification of STAT3 expression in PCs (WT vs. STAT3PKO; Lobule V: 93.3 ± 1.35 vs. 3.43 ± 0.882, Lobule VI: 93.9 ± 1.36 vs. 5.18 ± 1.01, Total: 91.8 ± 1.20 vs. 2.40 ± 0.849, p<0.001, n = 8 slices of five mice per experimental group; two-tailed Student’s t-test). (C) Two-photon microscopy images of PCs in WT and STAT3PKO mice. Scale bar = 20 μm. (D) Schematic organization of segment order in PCs. (E) Bar graph for the average length of equivalent ordered segment (WT and STAT3PKO groups; n = 3 neurons; two-tailed Student’s t-test). Data are presented as mean ± SEM.
Figure 1—figure supplement 1
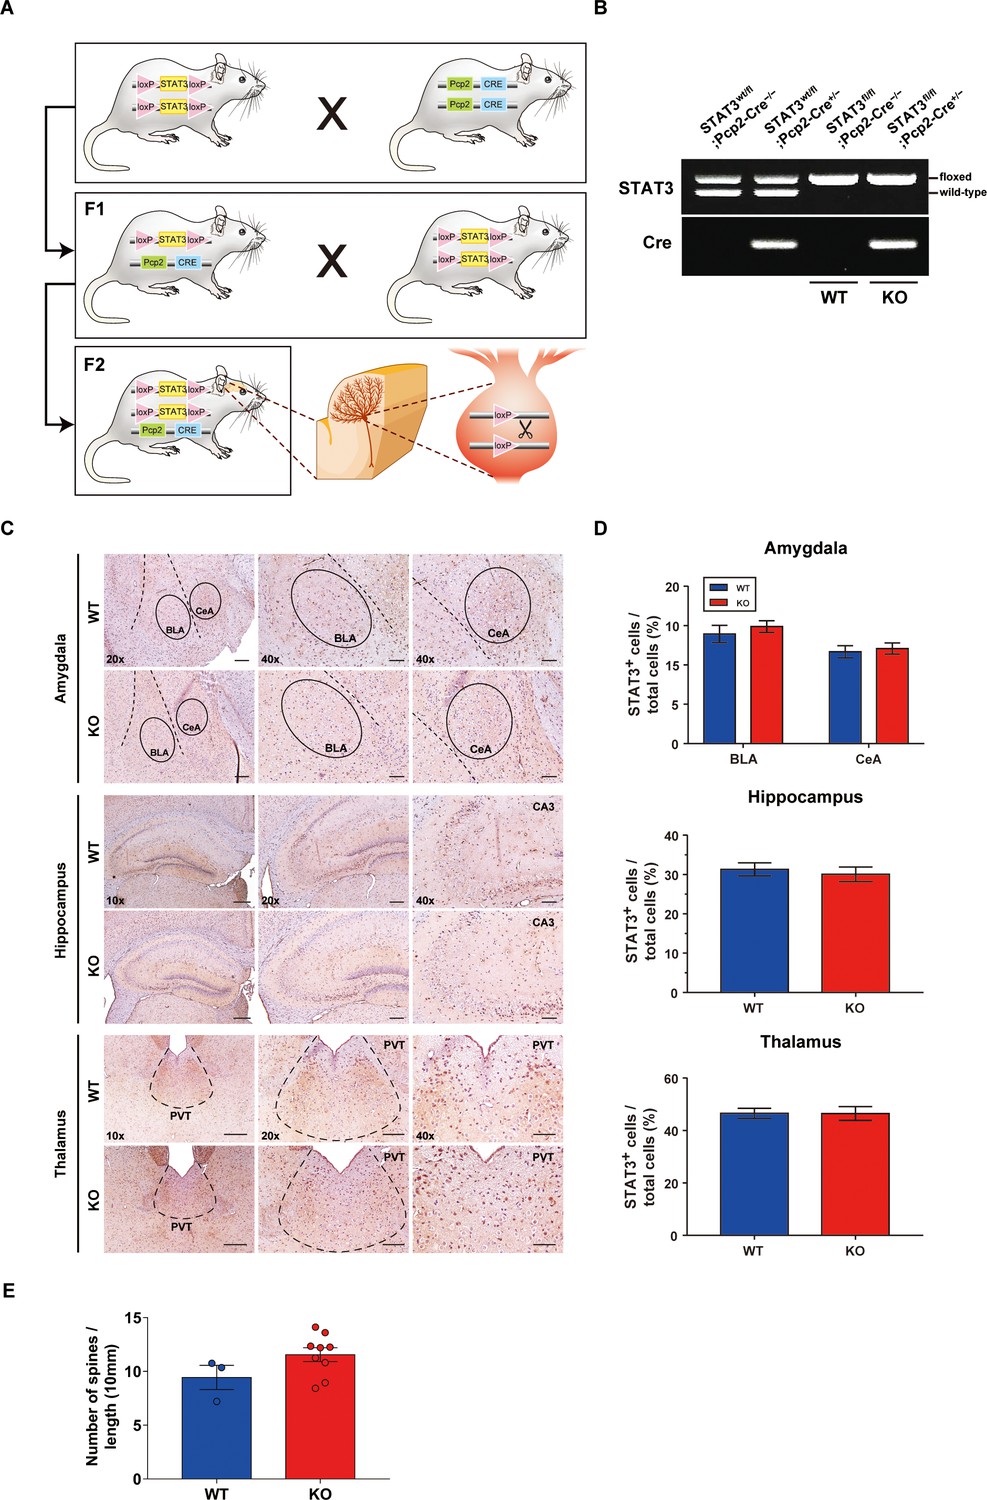
Generation of STAT3PKO mice model.
(A) Schematic representation of a breeding strategy for Purkinje cell (PC)-specific STAT3 knockout mouse generation. The first-generation offspring (F1) were obtained from STAT3 floxed mice crossing Pcp2-Cre mice, and STAT3wt/fl;Pcp2-Cre−/− (F1) were further mated with STAT3 floxed mice. (B) Genotype analysis of the second-generation offspring (F2) using RT-PCR. The second-generation offspring (F2) were divided into four genotypes: STAT3wt/fl;Pcp2-Cre−/−, STAT3wt/fl;Pcp2-Cre+/−, STAT3fl/fl;Pcp2-Cre−/− (wild-type [WT]), and STAT3fl/fl;Pcp2-Cre+/− (KO). (C) Immunohistochemistry analysis for STAT3 in amygdala, hippocampus, and thalamus regions from WT and STAT3PKO mice. Scale bars of 10× image = 200 μm, 20× image = 100 μm, and 40× image = 50 μm. (D) Bar graphs show quantification of STAT3 expression (WT vs. STAT3PKO, Amygdala-BLA: 13.9 ± 1.09 vs. 14.8 ± 0.737, p=0.487; Amygdala-CeA: 11.6 ± 0.773 vs. 12.0 ± 0.705, p=0.702; Hippocampus: 31.3 ± 1.66 vs. 30.0 ± 1.85, p=0.624; Thalamus: 46.5 ± 1.91 vs. 46.4 ± 2.61, p=0.985, n = 8 slices of five mice per experimental group; two-tailed Student’s t-test). (E) Measurement for the number of dendritic spines in PCs WT vs. STAT3PKO, 9.44 ± 1.12 vs. 11.5 ± 0.640, p=0.131, n = 3, 9 cells (two-tailed Student’s t-test). Data are presented as mean ± SEM.
Figure 2 with 1 supplement
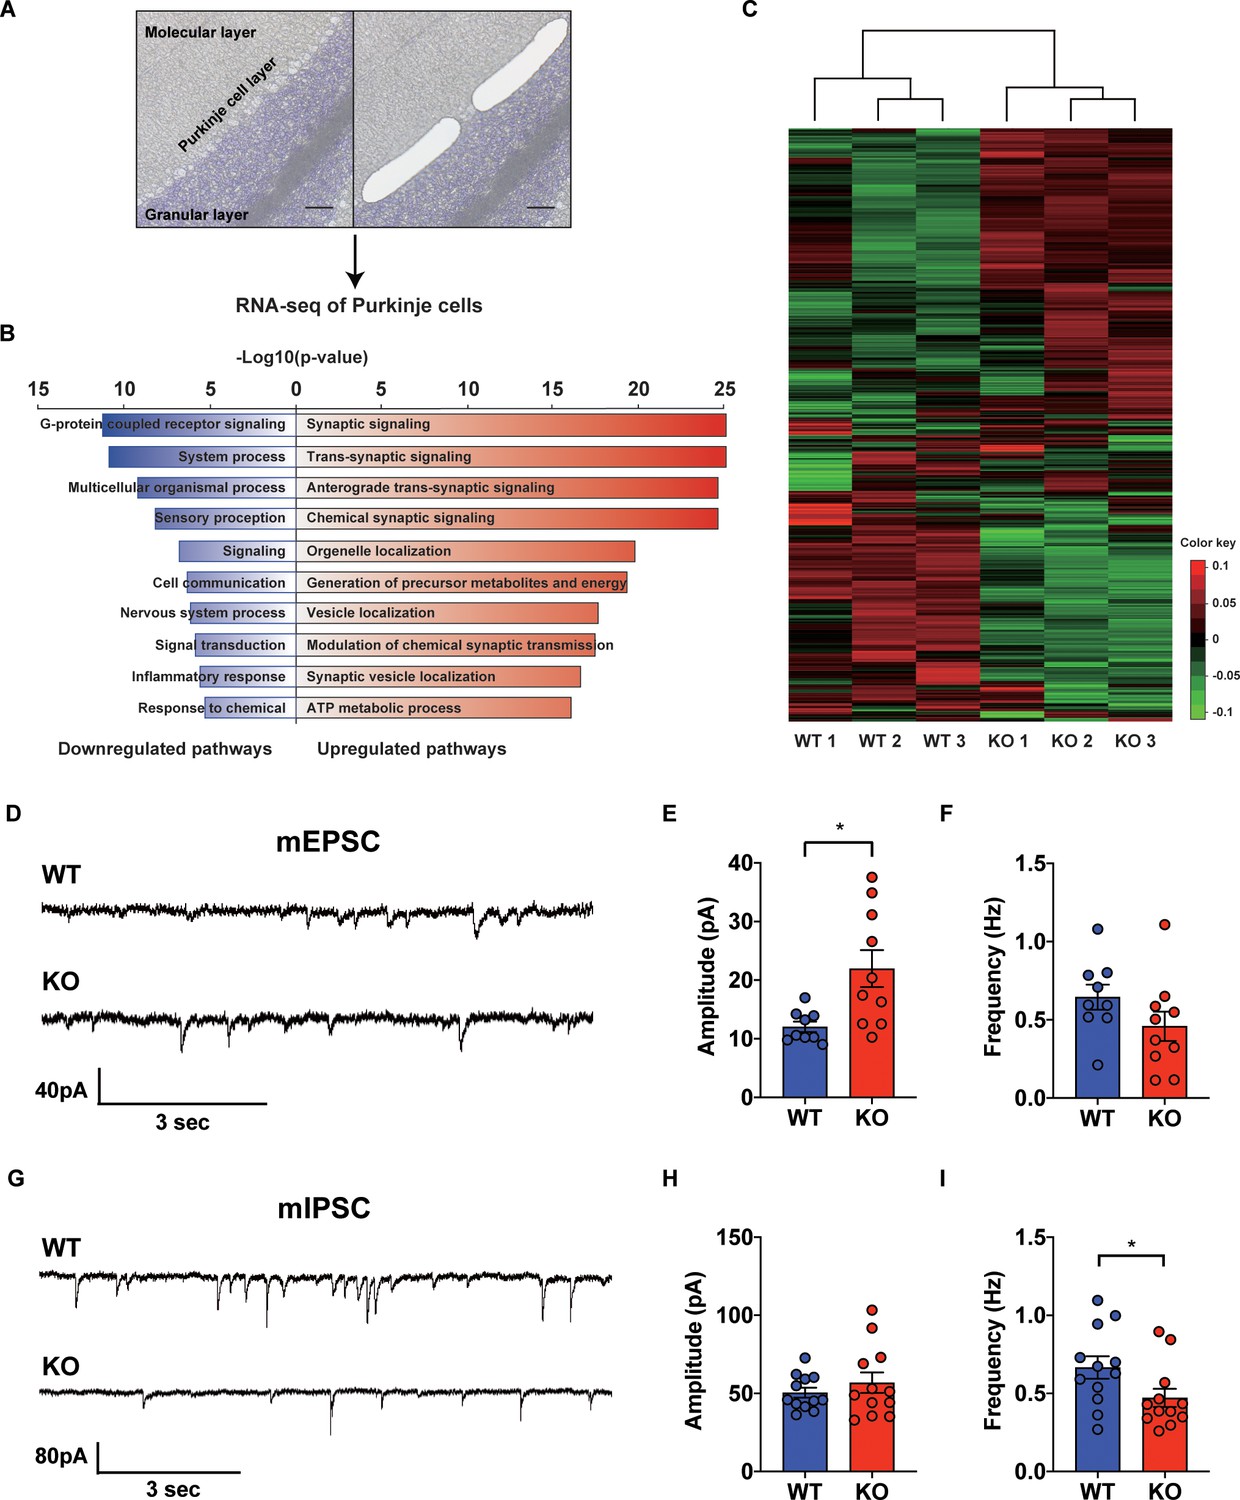
Transcriptional regulation of synaptic signaling and transmission in the STAT3PKO mice.
(A) Schematic representation of RNA sequencing analysis of Purkinje cells (PCs) from wild-type (WT) and STAT3PKO mice. PC layers were isolated using laser capture microdissection. Scale bar = 100 μm. (B) The upregulated/downregulated pathways for the STAT3PKO mice compared to WT. Gene ontology (GO) analysis was performed using significantly up- and downregulated genes in Figure 2—figure supplement 1. Bar graph for the most significant GO pathways. (C) Heatmap depicting 579 differentially expressed transcripts in synaptic signaling. Estimated read count was rlog transformed using DEseq2, then gene centered and normalized for heatmap value. (D) Representative traces for the miniature excitatory postsynaptic currents (mEPSCs) in WT and STAT3PKO mice. (E) Bar graph for the average of mEPSCs amplitude (WT vs. STAT3PKO; 12.0 ± 0.886 vs. 21.9 ± 3.13, p=0.00980, n = 9, 10 cells; two-tailed Student’s t-test). (F) Bar graph for the average of mEPSCs frequency (WT vs. STAT3PKO; 0.645 ± 0.0803 vs. 0.459 ± 0.0933, p=0.153, n = 9, 10 cells; two-tailed Student’s t-test). (G) Representative traces for the miniature inhibitory postsynaptic currents (mIPSCs) in WT and STAT3PKO mice. (H) Bar graph for the average of mIPSC amplitude (WT vs. STAT3PKO; 50.4 ± 3.22 vs. 59.3 ± 7.39, p=0.222, n = 12, 7 cells; two-tailed Student’s t-test). (I) Bar graph for the mIPSC frequency (WT vs. STAT3PKO; 0.666 ± 0.0723 vs. 0.424 ± 0.0316, p=0.0252, n = 12, 7 cells; two-tailed Student’s t-test). Data are presented as mean ± SEM, and *p<0.05, **p<0.01.
-
Figure 2—source data 1
Source data file for differentially expressed gene (DEG) analysis.
- https://cdn.elifesciences.org/articles/63291/elife-63291-fig2-data1-v1.ssv.xlsx
-
Figure 2—source data 2
Source data file for up/down gene pathways.
- https://cdn.elifesciences.org/articles/63291/elife-63291-fig2-data2-v1.xlsx
-
Figure 2—source data 3
Source data file for gProfiler results (up-genes).
- https://cdn.elifesciences.org/articles/63291/elife-63291-fig2-data3-v1.xlsx
-
Figure 2—source data 4
Source data file for gProfiler results (down-genes).
- https://cdn.elifesciences.org/articles/63291/elife-63291-fig2-data4-v1.xlsx
-
Figure 2—source data 5
Source data file for differentially expressed gene (DEG) analysis from DEseq2.
- https://cdn.elifesciences.org/articles/63291/elife-63291-fig2-data5-v1.xlsx
Figure 2—figure supplement 1
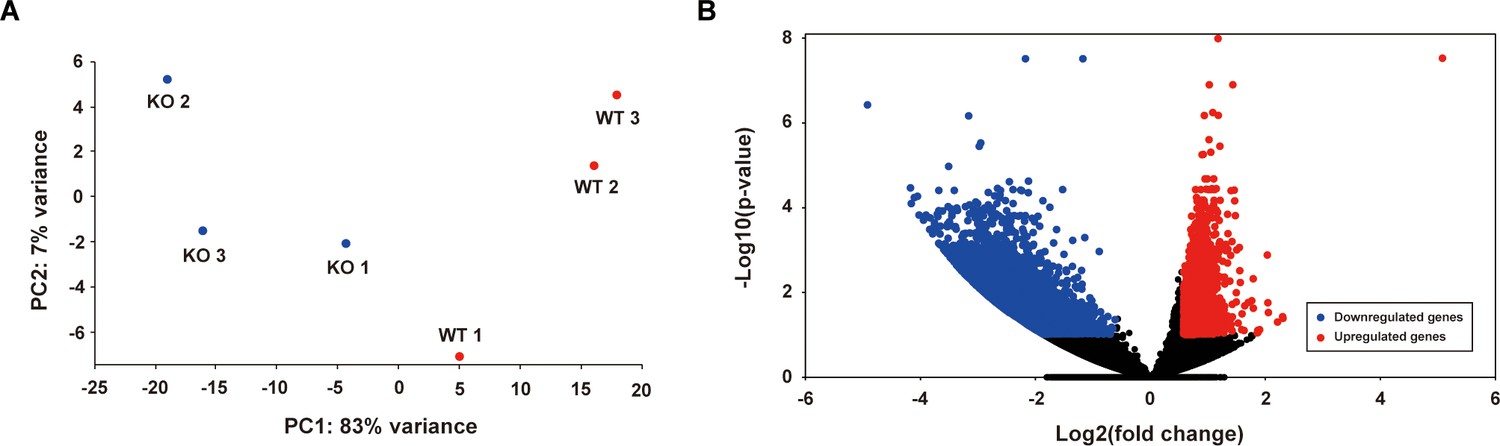
Transcriptome analysis of Purkinje cells in wild-type (WT) and STAT3PKO mice.
(A) Principal component analysis of the normalized RNA-seq data for WT and STATPKO groups. (B) Volcano plot representation of fold change of transcripts in WT and STATPKO groups, p<0.05.
Figure 3 with 1 supplement
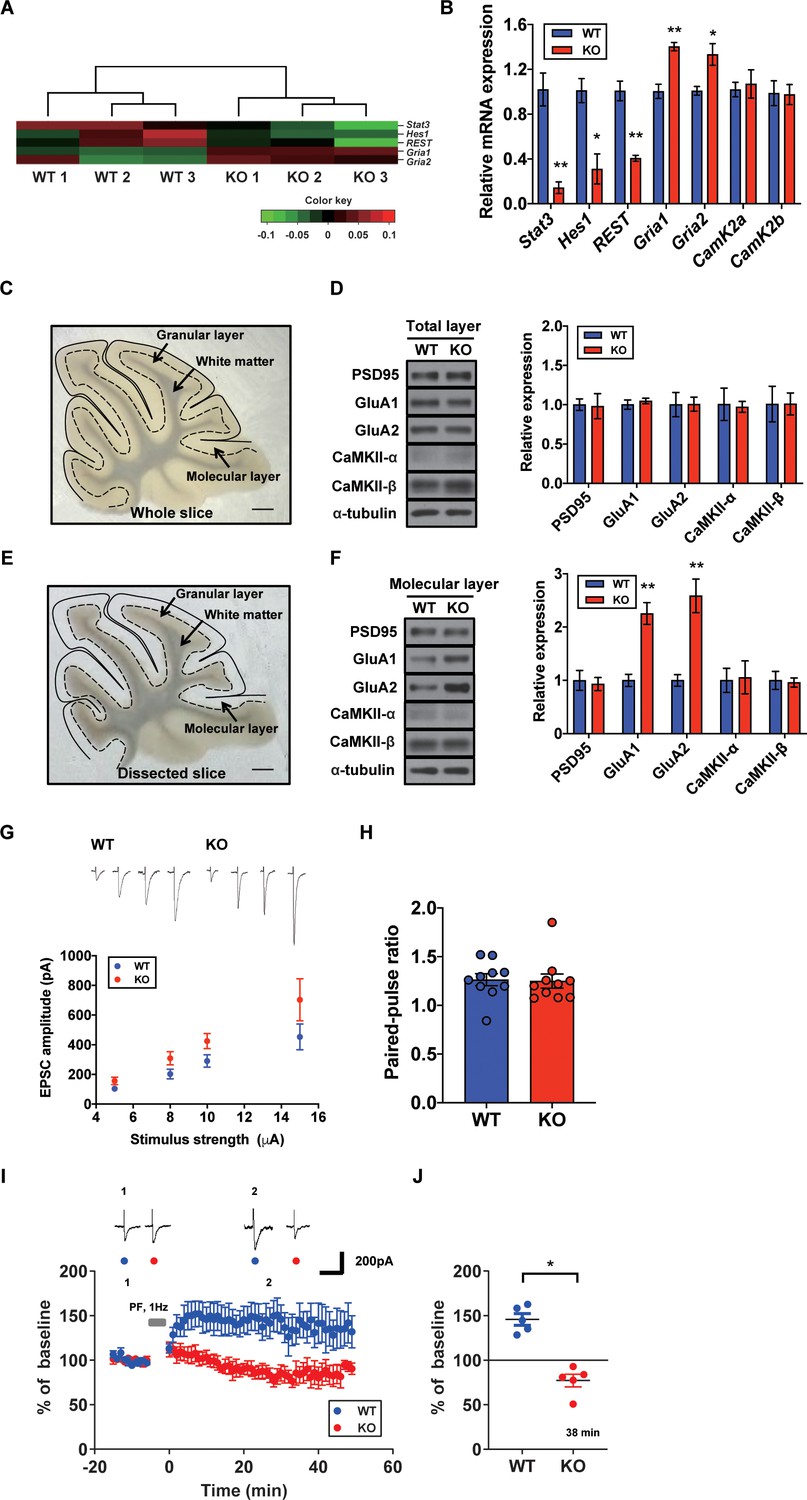
Increased AMPA receptor expression and occluded long-term potentiation (LTP) in the STAT3PKO mice.
(A) Heatmap showing normalized transcripts of Stat3, Hes1, Rest, Gria1, and Gria2 in wild-type (WT) and STAT3PKO mice. (B) Relative mRNA levels of Stat3, Hes1, Rest, Gria1, Gria2, CamK2a, and CamK2b in Purkinje cells (PCs) of the cerebellar slices (WT vs. STAT3PKO; Stat3: 1.02 ± 0.147 vs. 0.144 ± 0.0523, p=0.00490, Hes1: 1.01 ± 0.108 vs. 0.310 ± 0.134, p=0.0151, Rest: 1.00 ± 0.0874 vs. 0.406 ± 0.0264, p=0.00270, Gria1: 1.00 ± 0.0630 vs. 1.40 ± 0.0373, p=0.00550, Gria2:1.00 ± 0.0389 vs. 1.33 ± 0.0968, p=0.0358, CamK2a: 1.02 ± 0.0647 vs. 1.07 ± 0.126, p=0.741, and CamK2b: 0.988 ± 0.111 vs. 0.975 ± 0.0894, p=0.935, n = 3 mice; two-tailed Student’s t-test). Relative mRNA levels were normalized to the signals of GAPDH expression. (C) Representative image of the whole cerebellar slice. Scale bar = 1 mm. (D) Western blot analysis of PSD95, GluA1, GluA2, CaMKII-α, CaMKII-β, and α-tubulin in the total layers of cerebellar slice (WT vs. STAT3PKO; PSD95: 1.00 ± 0.0726 vs. 0.982 ± 0.159, p=0.918, GluA1: 1.00 ± 0.0594 vs. 1.04 ± 0.0349, p=0.541, GluA2: 1.00 ± 0.154 vs. 1.00 ± 0.0897, p=0.980, CaMKII-α: 1.00 ± 0.206 vs. 0.973 ± 0.0700, p=0.888, and CaMKII-β: 1.00 ± 0.226 vs. 1.01 ± 0.139, p=0.993, n = 3 mice; two-tailed Student’s t-test). (E) Representative image of the dissected cerebellar slice. Scale bar = 1 mm. (F) Western blot analysis of PSD95, GluA1, GluA2, CaMKII-α, CaMKII-β, and α-tubulin in the molecular layer of cerebellar slice (WT vs. STAT3PKO; PSD95: 1.00 ± 0.187 vs. 0.932 ± 0.123, p=0.776, GluA1: 1.00 ± 0.115 vs. 2.25 ± 0.205, p=0.00590, GluA2: 1.00 ± 0.109 vs. 2.58 ± 0.314, p=0.0088, CaMKII-α: 1.00 ± 0.227 vs. 1.05 ± 0.309, p=0.888, and CaMKII-β: 1.00 ± 0.169 vs. 0.960 ± 0.0871, p=0.845, n = 3 mice; two-tailed Student’s t-test). Quantification of western blot analysis was obtained with relative densitometry and normalized with α-tubulin. (G) Representative traces and graph for evoked excitatory postsynaptic current (eEPSC) amplitudes of PC in WT and STAT3PKO groups (WT and STAT3PKO; genotype × stimulus strength interaction: F(3,59)=0.8479, p=0.4733; genotype effect: F(1,59)=10.89, p=0.0016; stimulus strength effect: F(3,59)=17.77, p<0.0001; n = 10, 10 cells; two-way ANOVA with Bonferroni correction). (H) The graph for paired pulse ratio at the 100 ms intervals (WT vs. STAT3PKO; p=0.8896, n = 10, 10 cells; two-tailed Student’s t-test). (I) Representative traces and graph for LTP induction in WT and STAT3PKO groups (WT and STAT3PKO groups, respectively, genotype × time interaction: F(59,560)=1.23, p=0.117; genotype effect: F(1,560)=261.3, p<0.0001; time effect: F(59,560)=0.766, p=0.897; n = 7, 5 cells; two-way ANOVA with Bonferroni correction). All EPSC amplitudes were normalized in percentile. (J) Graph for LTP induced EPSC amplitudes at 38 min (WT vs. STAT3PKO; 145 ± 18.7 vs. 81.1 ± 12.2, p=0.0411, n = 7, 5 cells; two-tailed Student’s t-test). Data are presented as mean ± SEM, and *p<0.05, **p<0.01.
Figure 3—figure supplement 1
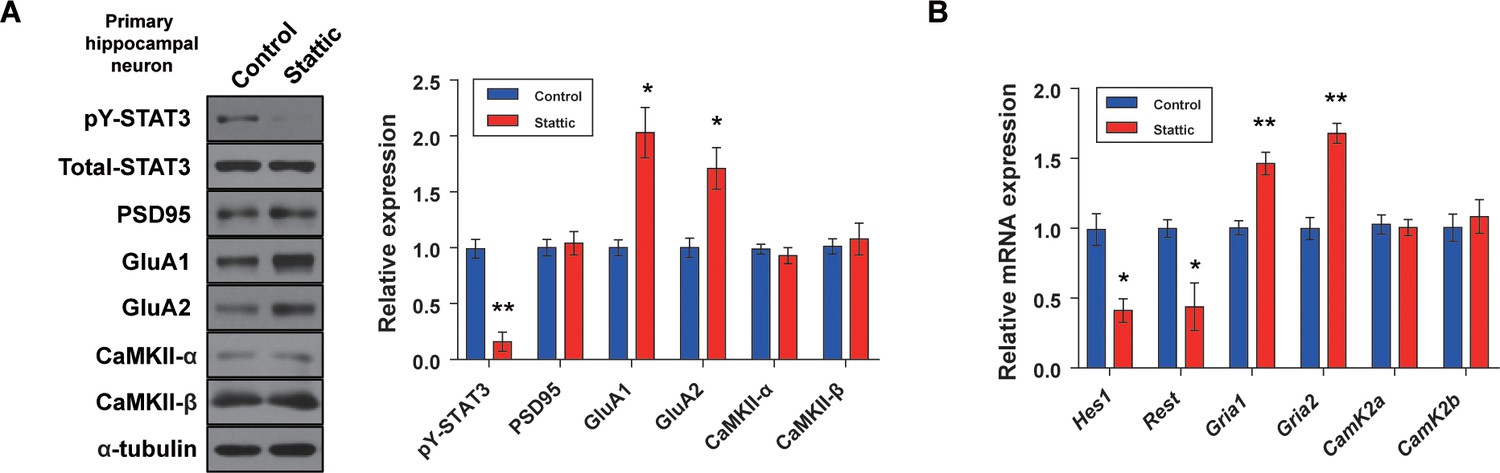
Mechanism underlying the STAT3-modulated AMPA receptor expressions in hippocampal neuron model.
(A) Western blot analysis of pY-STAT3, STAT3, PSD95, GluA1, GluA2, CaMKII-α, CaMKII-β, and α-tubulin in primary hippocampal neuron with or without STAT3 inhibition (STAT3: p=0.00220, GluA1: p=0.0120, GluA2: p=0.0254, n = 3 mice; two-tailed Student’s t-test). Quantification of western blot analysis was obtained with relative densitometry and normalized with α-tubulin. (B) Relative mRNA levels of Hes1, Rest, Gria1, Gria2, CamK2a, and CamK2b in primary hippocampal neuron with or without STAT3 inhibition (Hes1: p=0.0149, Rest: p=0.0364, Gria1: p=0.00870, Gria2: p=0.00300, n = 3 mice; two-tailed Student’s t-test). Data are presented as mean ± SEM, and *p<0.05, **p<0.01.
Figure 4
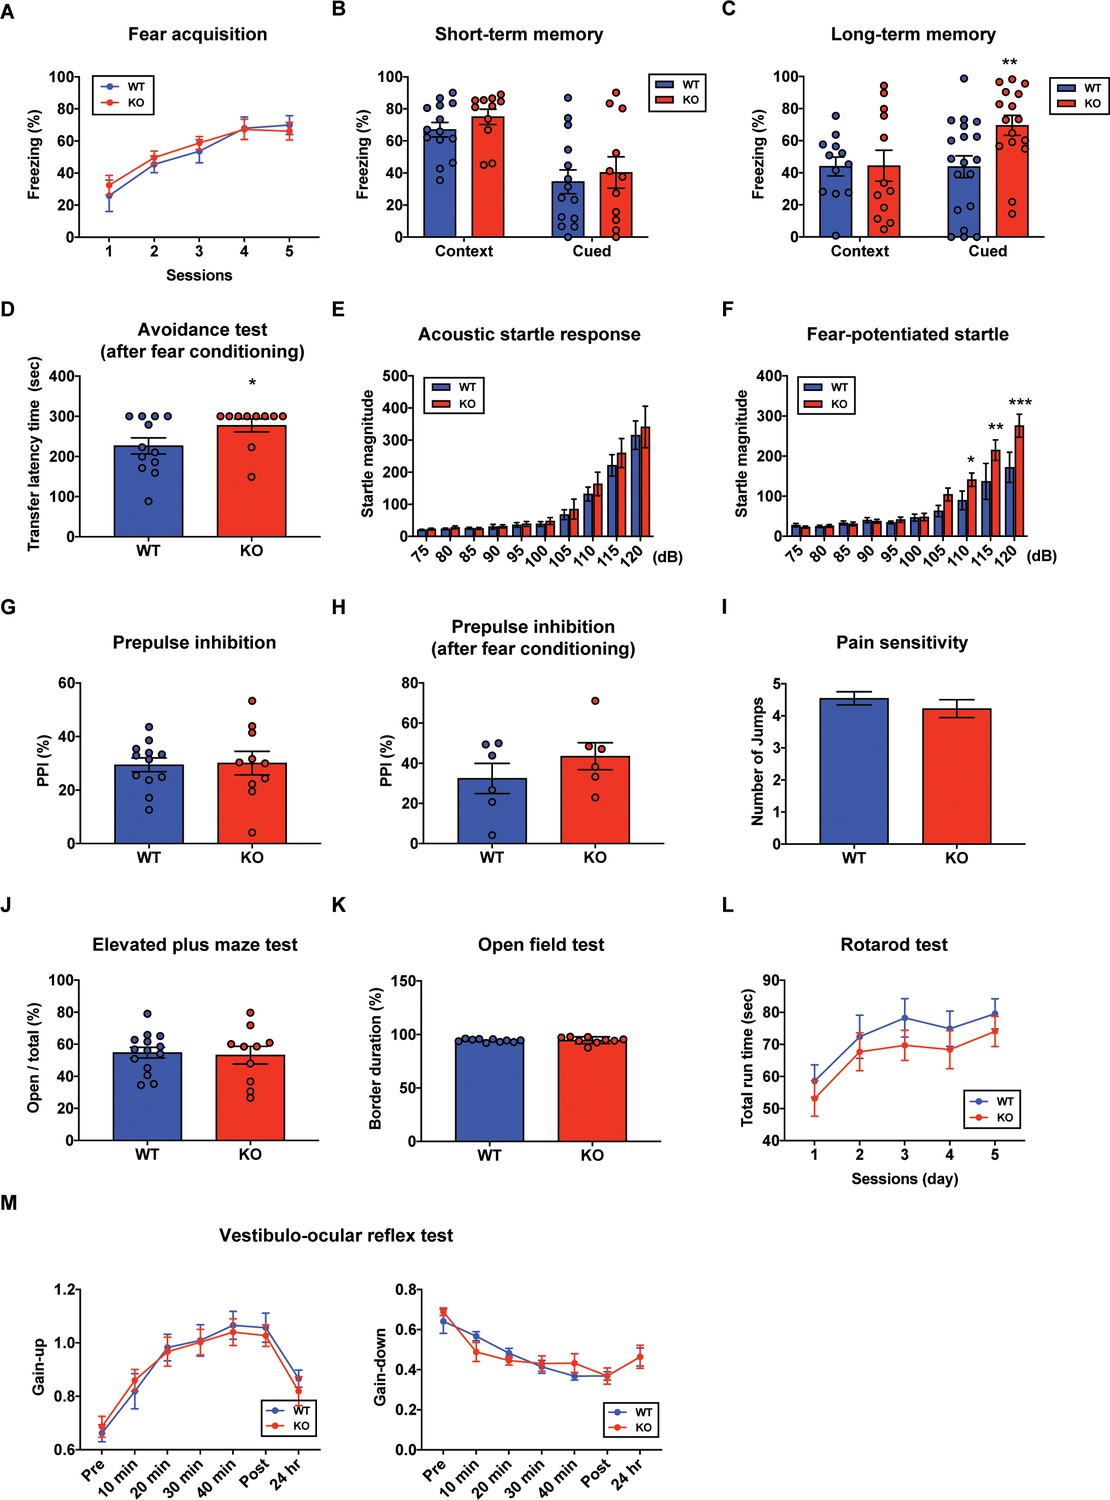
Aberrant long-term fear memory in the STAT3PKO mice.
(A) The percentage of freezing time spent during fear acquisition (genotype × time interaction: F(4,56)=0.276, p=0.892; genotype effect: F(1,14)=0.260, p=0.617; time effect: F(4,56)=14.9, p<0.001, n = 7, nine mice; wild-type (WT) and STAT3PKO groups, respectively; two-way ANOVA with Bonferroni correction). (B) The percentage of freezing time spent in short-term contextual and cued fear memory tests (WT vs. STAT3PKO, context: 67.0 ± 4.54 vs. 75.0 ± 4.79, p=0.198, n = 14, 11 mice, Mann–Whitney test; WT vs. STAT3PKO, cued: 34.5 ± 7.44 vs. 40.2 ± 9.84, p=0.702, n = 14, 11 mice, Mann–Whitney test). (C) The percentage of freezing time spent in long-term contextual and cued fear memory tests (WT vs. STAT3PKO, context: 43.9 ± 5.84 vs. 44.3 ± 9.67, p=0.967, n = 12, 12 mice, two-tailed Student’s t-test; WT vs. STAT3PKO, cued: 43.7 ± 6.80 vs. 69.4 ± 6.21, p=0.00960, n = 19, 16 mice, two-tailed Student’s t-test). (D) The transfer latency time was assessed in the step-through passive avoidance test (WT vs. STAT3PKO, 226 ± 20.1 vs. 277 ± 16.1, p=0.0452, n = 12, 10 mice, Mann–Whitney test). (E) The startle magnitude in a wide range of sound intensities was assessed in the acoustic startle response test (n = 12, 12 mice; WT and STAT3PKO groups, genotype × sound interaction: F(9,198)=0.208, p=0.993; genotype effect: F(1,22)=0.423, p=0.521; sound effect: F(9,198)=48.7, p<0.001; two-way ANOVA with Bonferroni correction). (F) After fear conditioning, the startle magnitude in a wide range of sound intensities was assessed in the acoustic startle response test (n = 10, 10 mice; WT and STAT3PKO groups, genotype × sound interaction: F(9,162)=2.84, p=0.00390; genotype effect: F(1,18)=4.42, p=0.0496; sound effect: F(9,162)=36.3, p<0.001; two-way ANOVA with Bonferroni correction). (G) Comparison between WT and STAT3PKO mice in prepulse inhibition test (WT vs. STAT3PKO, 29.42 ± 2.57 vs. 30.0 ± 4.39, p=0.895, n = 12, 10 mice, two-tailed Student’s t-test). (H) The percentage of prepulse inhibition of WT and STAT3PKO mice after fear conditioning (WT vs. STAT3PKO, 32.4 ± 7.51 vs. 43.5 ± 6.71, p=0.297, n = 6, six mice, two-tailed Student’s t-test). (I) Measurement of the number of jumps during fear learning session for pain sensitivity (WT vs. STAT3PKO; p=0.374, n = 11, 10 mice, Mann–Whitney test). (J) The percentage of time spent in the open arms of plus arms (WT vs. STAT3PKO, 54.7 ± 3.34 vs. 53.1 ± 5.50, p=0.797, n = 14, 10 mice, two-tailed Student’s t-test). (K) The percentage of time spent in the border of the open field (WT vs. STAT3PKO, 94.3 ± 0.438 vs. 94.6 ± 1.05, p=0.808, n = 10, nine mice, two-tailed Student’s t-test). (L) Total run time on the rotating drum (n = 14, 15 mice; WT and STAT3PKO groups, respectively, genotype × session interaction: F(4,108)=0.0520, p=0.994; genotype effect: F(1,27)=0.143, p=0.241; session effect: F(4,108)=6.12, p<0.001; two-way repeated measured ANOVA with Bonferroni correction). (M) Vestibulo-ocular reflex (VOR) gain through 50 min of gain-up and -down training sessions, and at 24 hr point after training (gain-up: n = 9, seven mice; WT and STAT3PKO groups, respectively, genotype × time interaction: F(6,84)=0.396, p=0.879; genotype effect: F(1,14)=0.0247, p=0.877; time effect: F(6,84)=31.8, p<0.001, gain-down: n = 6 mice; WT and STAT3PKO groups, genotype × time interaction: F(6,60)=0.169, p=0.138; genotype effect: F(1,10)=0.00200, p=0.965; time effect: F(6,60)=28, p<0.001; two-way ANOVA with Bonferroni correction). Data are presented as mean ± SEM, and *p<0.05, **p<0.01, ***p<0.001.
Figure 5 with 1 supplement
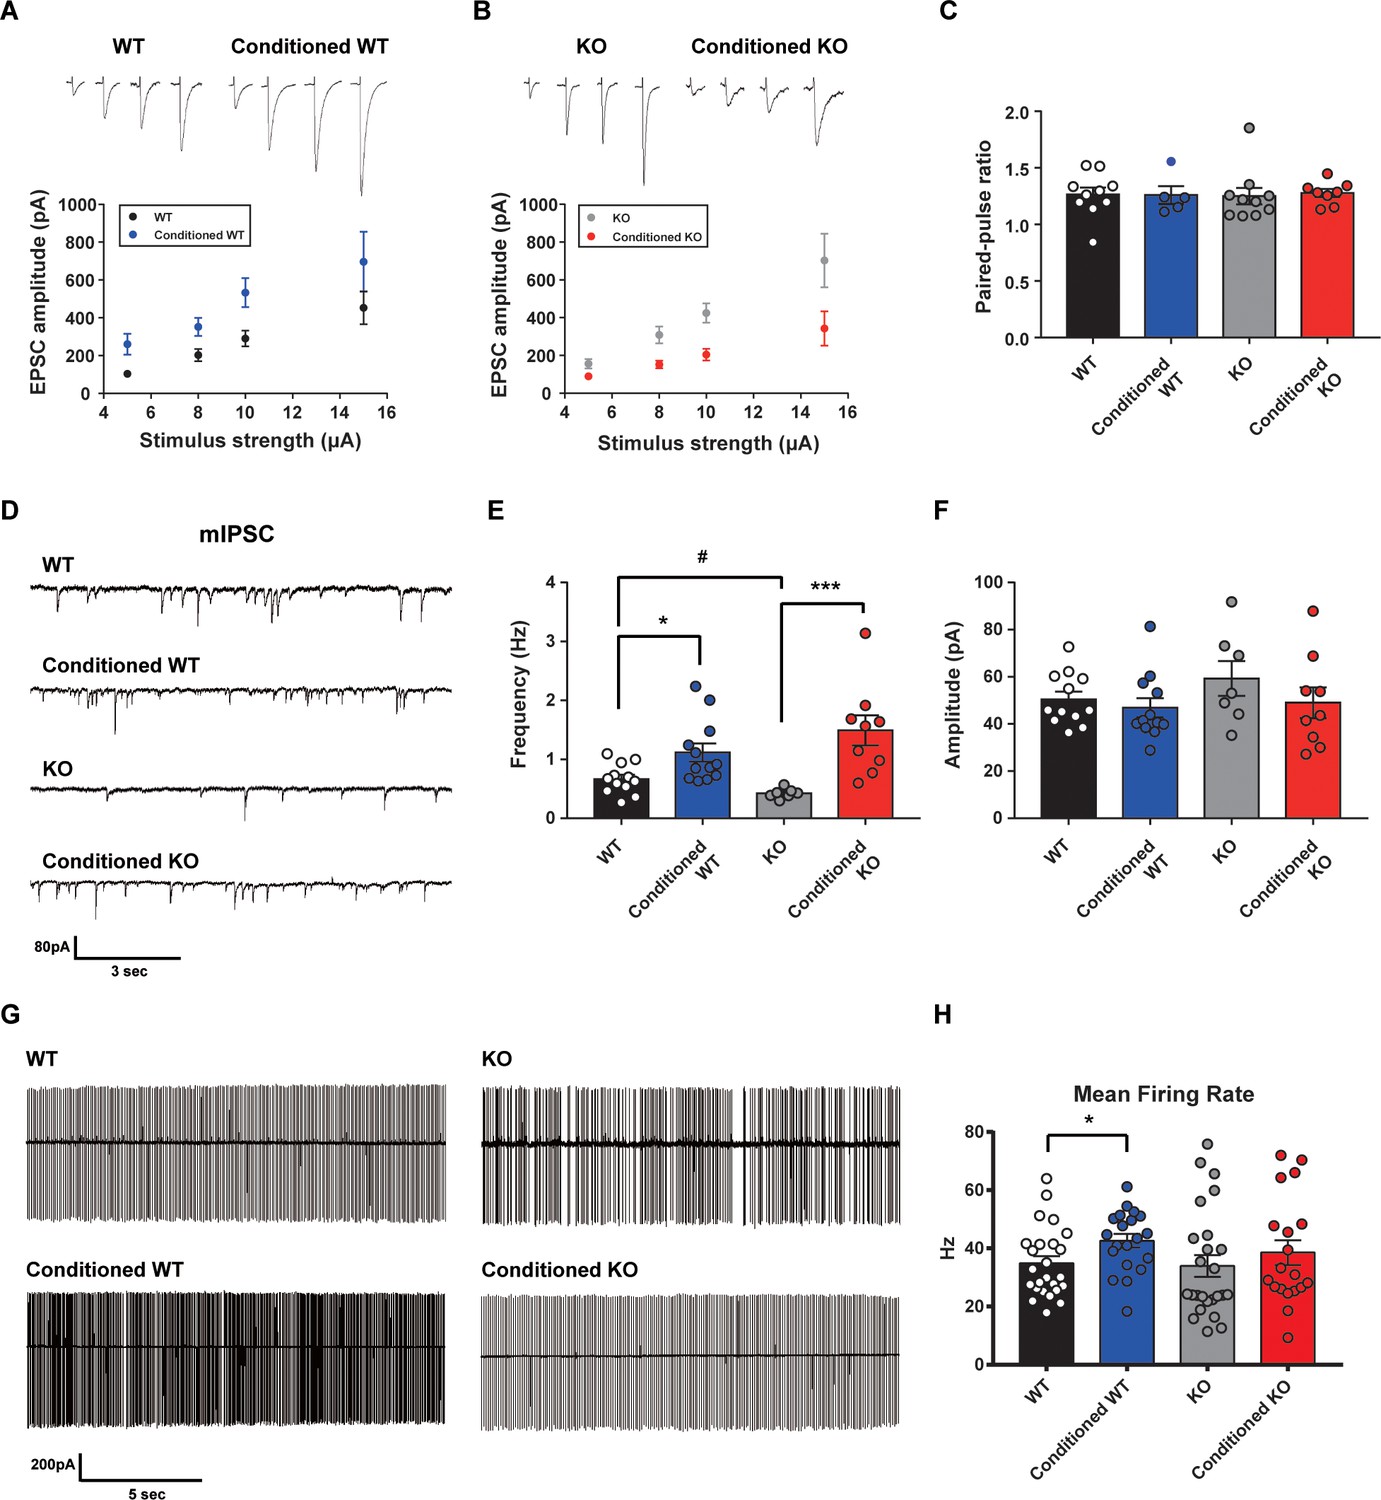
Altered learning-induced long-term synaptic plasticity of fear memory in STAT3PKO mice.
(A) Representative traces of synaptic strength of wild-type (WT) mice before and after fear conditioning. The plot graph shows the evoked excitatory postsynaptic current (eEPSC) amplitude of WT and fear-conditioned WT mice (n = 10, 8 cells; WT and conditioned WT groups, respectively, group × stimulus strength interaction: F(3,51)=0.329, p=0.804; group effect: F(1,51)=17.4, p<0.001; stimulus strength effect: F(3,51)=11.1, p<0.001; two-way ANOVA with Bonferroni correction). (B) Representative traces of synaptic strength of STAT3PKO mice before and after fear conditioning. The plot graph shows the eEPSC amplitude of STAT3PKO mice and fear-conditioned STAT3PKO mice (n = 10, 8 cells; KO and conditioned KO groups, respectively, group × stimulus strength interaction: F(3,55)=2.38, p=0.0788; group effect: F(1,55)=29.4, p<0.001; stimulus strength effect: F(3,55)=17.6, p<0.001; two-way ANOVA with Bonferroni correction). (C) The graph for paired pulse ratio at the 100 ms intervals (WT, conditioned WT, KO, and conditioned KO groups, n = 10, 5, 10, and 8 cells; F(3,29)=0.0301, p=0.992; one-way ANOVA). (D) Representative traces for the miniature inhibitory postsynaptic currents (mIPSCs) of WT and STAT3PKO mice under control or fear conditions (n = 12, 12, 7, 9 cells; WT, Conditioned WT, KO, and Conditioned KO groups, respectively). (E) Bar graph for the mIPSC frequency (WT vs. Conditioned WT, 0.666 ± 0.0723 vs. 1.11 ± 0.155, p=0.0140, Mann–Whitney test; WT vs. KO, 0.666 ± 0.0723 vs. 0.424 ± 0.0316, p=0.0252, two-tailed Student’s t-test; KO vs. Conditioned KO, 0.424 ± 0.0316 vs. 1.49 ± 0.254, p=0.00100, Mann–Whitney test). (F) Bar graph for the mIPSC amplitude (WT vs. Conditioned WT, 50.4 ± 3.22 vs. 46.8 ± 4.07, p=0.248, Mann–Whitney test; WT vs. KO, 50.4 ± 3.22 vs. 59.3 ± 7.39, p=0.222, two-tailed Student’s t-test; KO vs. Conditioned KO, 59.3 ± 7.39 vs. 49.0 ± 6.54, p=0.314, two-tailed Student’s t-test). (G) Representative traces for tonic pattern firings of Purkinje cells (PCs) in WT and STATPKO mice, before and after fear conditioning (n = 25, 20, 25, 20 cells; WT, Conditioned WT, KO, and Conditioned KO groups, respectively). (H) Mean firing rate of total patterns of PCs in WT and STATPKO mice in naïve and fear-conditioned groups (WT vs. Conditioned WT, 34.8 ± 2.40 vs. 42.6 ± 2.33, p=0.0282, two-tailed Student’s t-test; WT vs. KO, 34.8 ± 2.40 vs. 33.9 ± 3.71, p=0.277, Mann–Whitney test; KO vs. Conditioned KO, 33.9 ± 3.71 vs. 38.5 ± 4.23, p=0.142, Mann–Whitney test). Data are presented as mean ± SEM, and *p<0.05, **p<0.01.
Figure 5—figure supplement 1
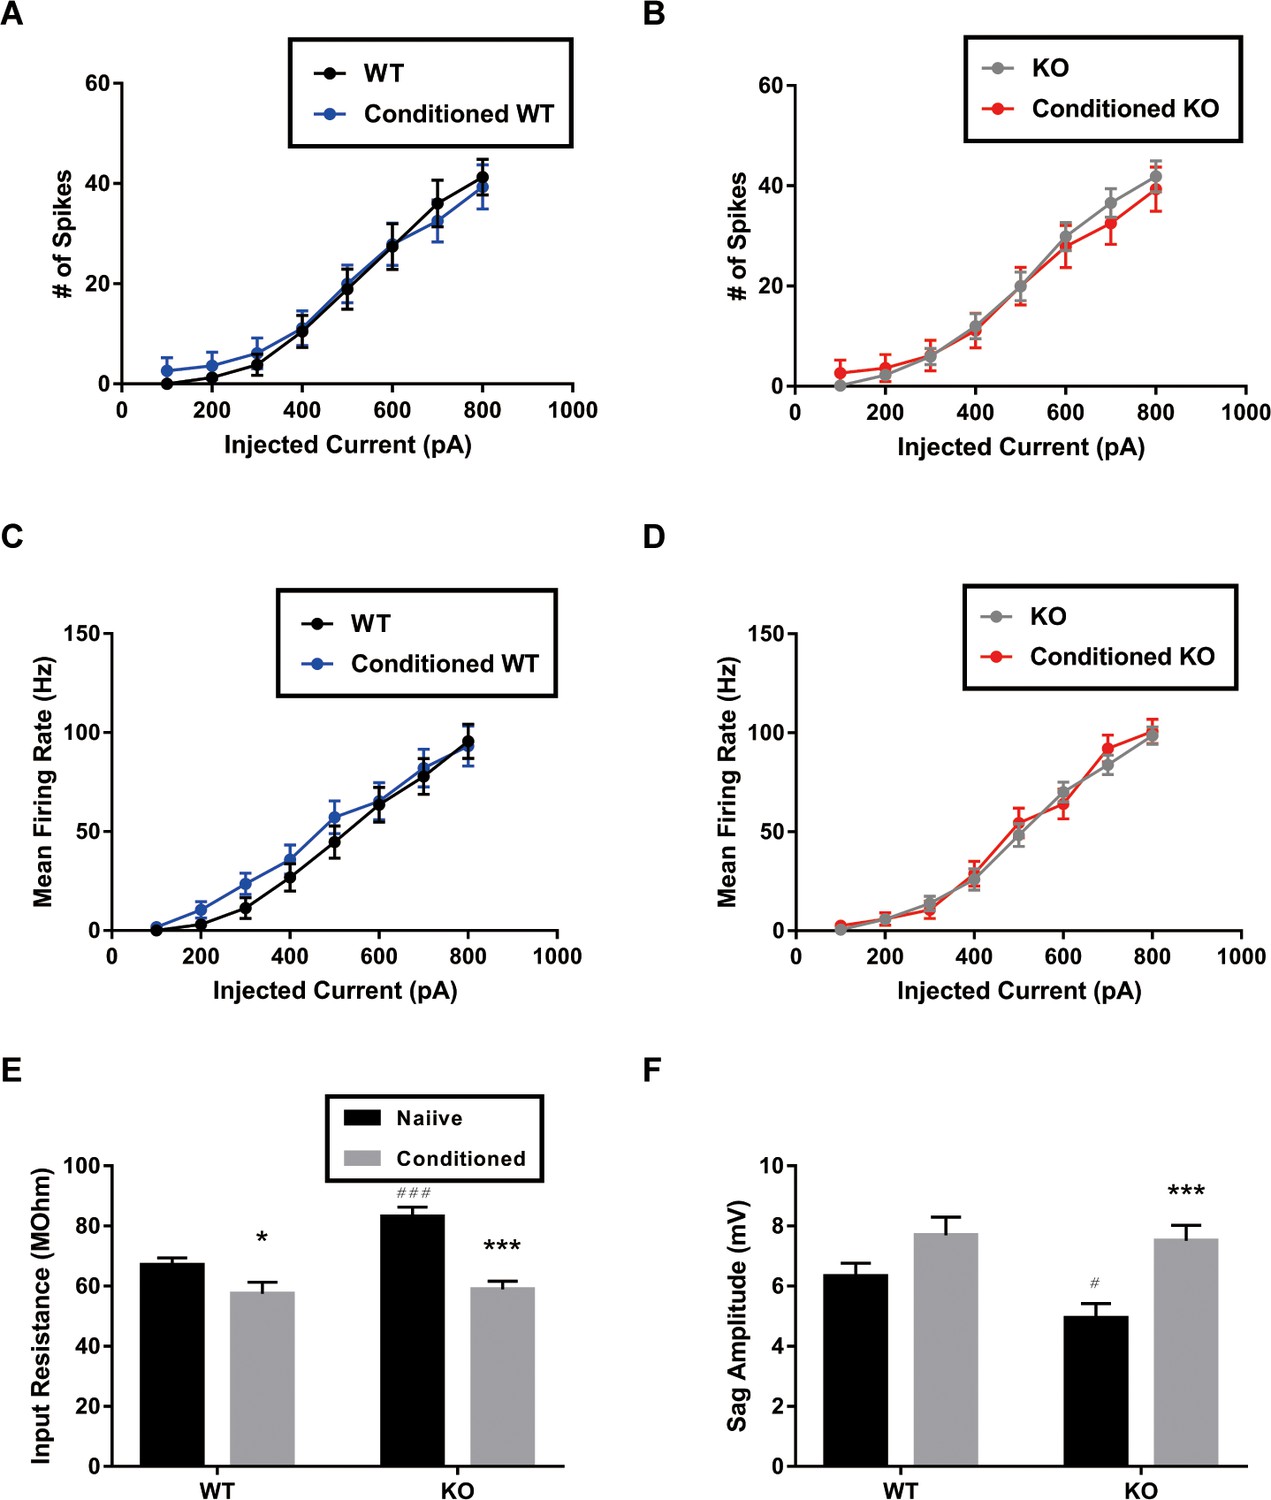
Whole cell current-clamp recordings for measuring intrinsic excitability of Purkinje cell (PC) in wild-type (WT) and STAT3PKO mice, (n = 24, 22, 29, 22 cells; WT, Conditioned WT, KO, and Conditioned KO groups, respectively).
(A) Measurement for number of spikes when PCs in WT mice were injected a series of increasing current steps at 100 pA intervals, before and after fear conditioning (genotype × injected current interaction: F(7,352)=0.0655, p=0.999; genotype effect: F(1,352)=0.688, p=0.407; injected current effect: F(7,352)=48.1, p<0.0001; WT and conditioned WT groups, respectively; two-way ANOVA with Bonferroni correction). (B) Measurement for number of spikes when PCs in KO mice were injected a series of increasing current steps at 100 pA intervals, before and after fear conditioning (genotype × injected current interaction: F(7,392)=0.129, p=0.996; genotype effect: F(1,392)=3.50, p=0.0619; injected current effect: F(7,392)=69.1, p<0.0001; KO and conditioned KO groups, respectively; two-way ANOVA with Bonferroni correction). (C) Measurement for mean firing rate when PCs in WT mice were injected a series of increasing current steps at 100 pA intervals, before and after fear conditioning (genotype × injected current interaction: F(7,360)=0.2741, p=0.963; genotype effect: F(1,360)=2.55, p=0.110; injected current effect: F(7,360)=45.7, p<0.0001; WT and conditioned WT groups, respectively; two-way ANOVA with Bonferroni correction). (D) Measurement for mean firing rate when PCs in KO mice were injected a series of increasing current steps at 100 pA intervals, before and after fear conditioning (genotype × injected current interaction: F(7,400)=0.504, p=0.831; genotype effect: F(1,400)=0.0226, p=0.880; injected current effect: F(7,400)=125, p<0.0001; KO and conditioned KO groups, respectively; two-way ANOVA with Bonferroni correction). (E) Measurement for input resistance at −500 pA in WT and STATPKO mice, before and after fear conditioning (p<0.05, WT vs. Conditioned WT, two-tailed Student’s t-test; p<0.001, WT vs. KO, two-tailed Student’s t-test; p<0.001, KO vs. Conditioned KO, two-tailed Student’s t-test). (F) Measurement for Sag amplitude in WT and STATPKO mice, before and after fear conditioning (p=0.0735, WT vs. Conditioned WT, two-tailed Student’s t-test; p<0.05, WT vs. KO, two-tailed Student’s t-test; p<0.001, KO vs. Conditioned KO, two-tailed Student’s t-test). Data are presented as mean ± SEM, and *p<0.05, **p<0.01, ***p<0.001, compared with naïve group; #p<0.05, ###p<0.001, compared with naïve WT group.
Figure 6 with 2 supplements

Increased neural activity of fear-related regions in the STAT3PKO mice.
(A) Representative image of the c-fos staining on the nucleus of paraventricular thalamus. Scale bar = 250 μm. Scale bar of the enlarged image = 50 μm. (B) Quantification of relative fluorescence intensity for c-fos signals, before and after fear conditioning on the paraventricular nucleus of the thalamus (Control; wild-type [WT] and STAT3PKO, Conditioned; WT and STAT3PKO, respectively, n = 8 slices of three mice per experimental group, genotype × fear interaction: F(1,28)=56.73, p<0.0001; genotype effect: F(1,28)=59.65, p<0.0001; fear effect: F(1,28)=175.7, p<0.0001; two-way ANOVA with Bonferroni correction). (C) Representative image of the c-fos staining on the amygdala. Scale bar = 250 μm. Scale bar of the enlarged image = 50 μm. (D) Quantification of relative fluorescence intensity for c-fos signals, before and after fear conditioning on the amygdala (Control; WT and STAT3PKO, Conditioned; WT and STAT3PKO, respectively, n = 8 slices of three mice per experimental group, genotype × fear interaction: F(1,28)=8.054, p=0.0084; genotype effect: F(1,28)=8.601, p=0.0066; fear effect: F(1,28)=124.7, p<0.0001; two-way ANOVA with Bonferroni correction). (E) Representative image of the c-fos staining on the prelimbic cortex. Scale bar = 250 μm. Scale bar of the enlarged image = 50 μm. (F) Quantification of relative fluorescence intensity for c-fos signals, before and after fear conditioning on the prelimbic cortex (Control; WT and STAT3PKO, Conditioned; WT and STAT3PKO, respectively, n = 8 slices of three mice per experimental group, genotype × fear interaction: F(1,28)=20.15, p=0.0001; genotype effect: F(1,28)=19.21, p=0.0001; fear effect: F(1,28)=155.4, p<0.0001; two-way ANOVA with Bonferroni correction). Data are presented as mean ± SEM, and **p<0.01, ***p<0.001. ###p<0.001, compared with naïve WT group. The asterisk indicates the significance of difference between WT and STAT3PKO according to the presence or absence of fear conditioning, and the # sign indicates the significance of difference within the WT or STAT3PKO group according to the presence or absence of fear conditioning.
Figure 6—figure supplement 1
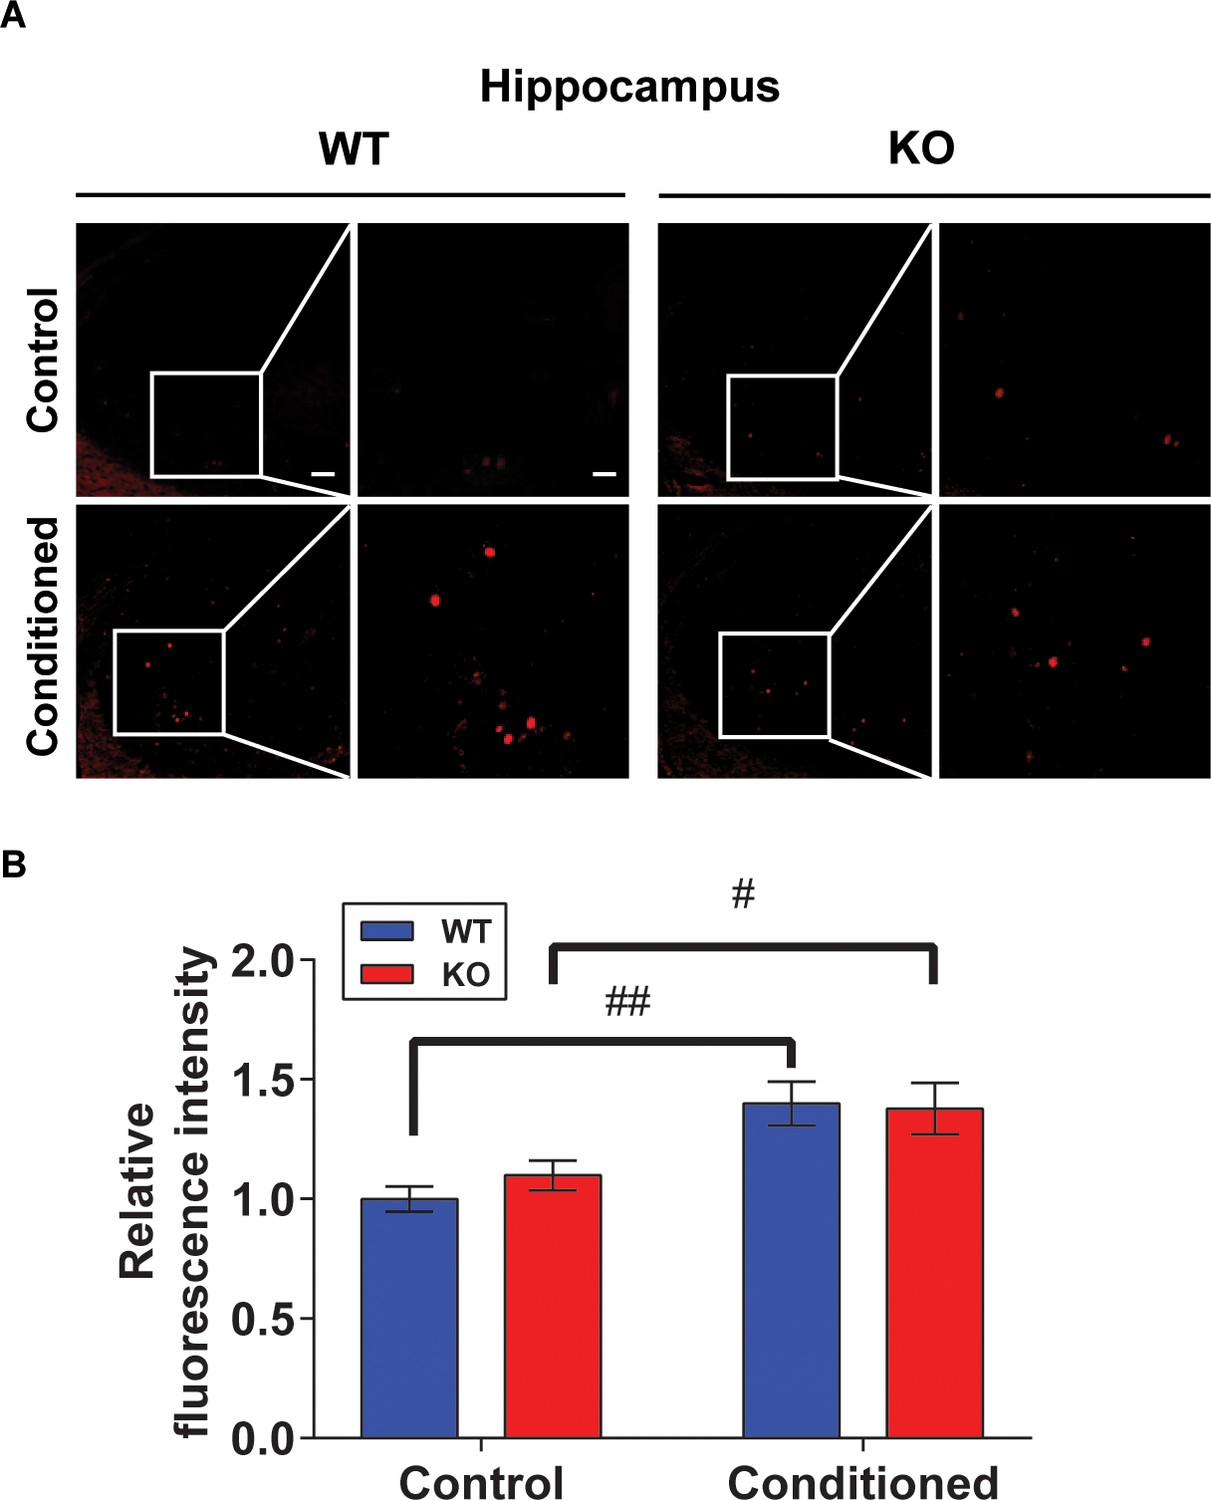
c-fos expression images and measurement on hippocampus.
(A) Representative image of the c-fos staining on hippocampus. Scale bar = 250 μm. Scale bar of the enlarged image = 50 μm. (B) Quantification of relative fluorescence intensity for c-fos signals, before and after fear conditioning on hippocampus (Control; wild-type [WT] and STAT3PKO, Conditioned; WT and STAT3PKO, respectively, n = 8 slices of three mice per experimental group, genotype × fear interaction: F(1,28)=0.5364, p=0.4700; genotype effect: F(1,28)=0.2289, p=0.6360; fear effect: F(1,28)=17.33, p=0.0003; two-way ANOVA with Bonferroni correction). Data are presented as mean ± SEM, #p<0.05, ##p<0.01, compared with naïve WT group, and the # sign indicates the significance of difference within the WT or STAT3PKO group according to the presence or absence of fear conditioning.
Figure 6—figure supplement 2
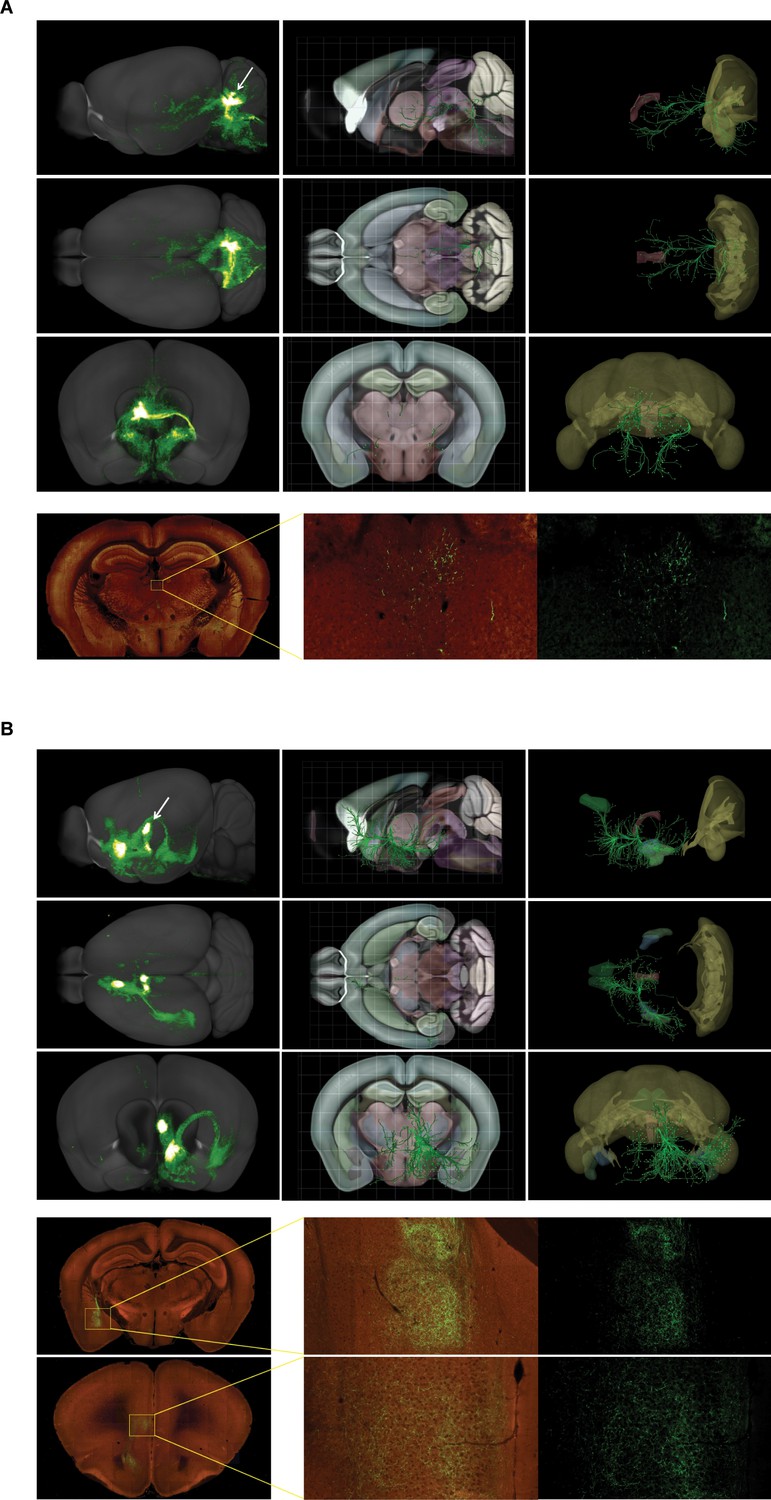
Three-dimensional reconstruction images of structural connections from Allen brain atlas database.
(A) Virtual tractography between the cerebellum and the thalamus. (B) Virtual tractography between the thalamus and the amygdala, and between the thalamus and the prelimbic cortex.
Figure 7
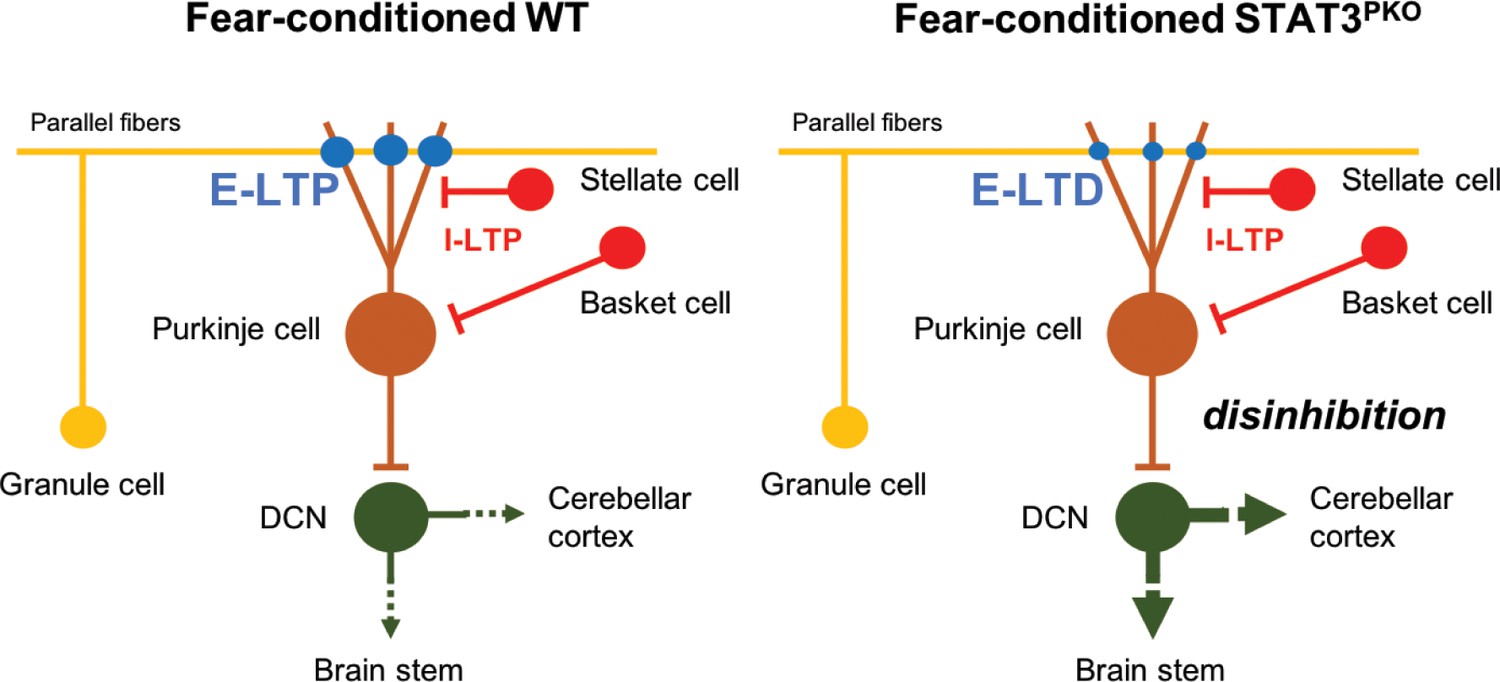
Model of current hypothesis: Purkinje cell (PC) output regulation in fear-conditioned wild-type (WT) and fear-conditioned STAT3PKO mice.
In fear conditioning, long-term potentiation (LTP) occurs at both excitatory and inhibitory synapses (E: excitatory, I: inhibitory). In fear-conditioned STAT3PKO mice, reduced PC output led by long-term depression (LTD) at excitatory synapses disinhibits the activity of deep cerebellar nuclei (DCN) to the closed-loop circuitry of the cerebellum or to other fear-related regions while processing fear memory storage.
Tables
Key resources table
| Reagent type (species) or resource | Designation | Source or reference | Identifiers | Additional information |
|---|---|---|---|---|
| Gene (M. musculus) | Stat3 | GeneCards | ||
| Strain, strain background (M. musculus, male) | C57BL/6J | Jackson Laboratory | ||
| Genetic reagent (M. musculus, male) | Pcp2-Cre | Jackson Laboratory | #004146; RRID:IMSR_ JAX:004146 | Tg(Pcp2-cre)2Mpin |
| Genetic reagent (M. musculus, male) | Stat3fl/fl | Takeda et al., 1998 | ||
| Biological sample (M. musculus) | Primary hippocampal neurons | Jackson Laboratory | Freshly isolated from M. musculus | |
| Antibody | Anti-STAT3 (Rabbit, monoclonal) | Cell Signaling Technology | Cat. # 8768; RRID:AB_2722529 | IHC (1:200) |
| Antibody | Anti-STAT3 (Rabbit, monoclonal) | Cell Signaling Technology | Cat. # 4904; RRID:AB_331269 | WB: (1:1000) |
| Antibody | c-fos (Rabbit, monoclonal) | Cell Signaling Technology | Cat. # 2250; RRID:AB_2247211 | IF (1:200) |
| Antibody | Anti-GluA1 (Rabbit, polyclonal) | Abcam | Cat. # ab31232; RRID:AB_2113447 | WB (1:1000) |
| Antibody | Anti-CaMKII (Rabbit, monoclonal) | Abcam | Cat. # ab52476; RRID:AB_868641 | WB (1:1,000) |
| Antibody | Anti-PSD95 (Mouse, monoclonal) | Abcam | Cat. # ab2723; RRID:AB_303248 | WB (1:1000) |
| Antibody | Anti-GluA2 (Rabbit, polyclonal) | Synaptic Systems | 182 103; RRID:AB_2113732 | WB (1:1000) |
| Antibody | Anti-phospho-STAT3 (Rabbit, monoclonal) | Cell Signaling Technology | Cat. # 9145; RRID:AB_2491009 | WB (1:1000) |
| Antibody | Anti-α-tubulin (Mouse, monoclonal) | Santa Cruz | Cat. # sc8035; RRID:AB_628408 | WB (1:1000) |
| Antibody | Goat anti-mouse IgG | Enzo Life Science | Cat. # ADI-SAB-100-J; RRID:AB_11179634 | WB (1:10000) |
| Antibody | Goat anti-rabbit IgG | Enzo Life Science | Cat. # ADI-SAB-300-J; RRID:AB_11179983 | WB (1:10000) |
| Antibody | Cy3 donkey anti-rabbit IgG | BioLegend | Cat. # 406402; RRID:AB_893532 | IF (1:200) |
| Antibody | Biotinylated goat anti-rabbit IgG | Vector Laboratories | Cat. # BA-1000; RRID:AB_2313606 | IF (1:200) |
| Sequence-based reagent | Stat3 | Qiagen | PCR primer | QT00148750 |
| Sequence-based reagent | Hes-1 | Qiagen | PCR primer | QT00313537 |
| Sequence-based reagent | Rest | Qiagen | PCR primer | QT00116053 |
| Sequence-based reagent | Gria1 | Qiagen | PCR primer | QT01062544 |
| Sequence-based reagent | Gria2 | Qiagen | PCR primer | QT00140000 |
| Sequence-based reagent | CamK2a_F | This paper | PCR primer | ACGGAAGAGTA CCAGCTCTTCGAGG |
| Sequence-based reagent | CamK2a_R | This paper | PCR primer | CCTGGCCAGCC AGCACCTTCAC |
| Sequence-based reagent | CamK2b_F | This paper | PCR primer | GTCGTCCACAG AGACCTCAAG |
| Sequence-based reagent | CamK2b_R | This paper | PCR primer | CCAGATATCCA CTGGTTTGC |
| Commercial assay or kit | SMARTer Stranded Total RNA-Seq Kit v2-Pico Input | Takara | ||
| Chemical compound, drug | Oregon Green BAPTA 488 fluorescence dye | Molecular Probes | ||
| Chemical compound, drug | Stattic | Sigma-Aldrich | ||
| Software, algorithm | PatchMaster software | HEKA Elektronik | ||
| Software, algorithm | Mini Analysis Program | Synaptosoft | ||
| Software, algorithm | GraphPad Prism | GraphPad Software Inc | ||
| Software, algorithm | EthoVision XT 8.5 | Noldus |
Additional files
-
Supplementary file 1
List of up/down genes from analysis of Kyoto Encyclopedia of Genes and Genomes (KEGG) pathway has been applied to RNA-seq differential expression analyses.
- https://cdn.elifesciences.org/articles/63291/elife-63291-supp1-v1.docx
-
Transparent reporting form
- https://cdn.elifesciences.org/articles/63291/elife-63291-transrepform-v1.docx
Download links
A two-part list of links to download the article, or parts of the article, in various formats.
Downloads (link to download the article as PDF)
Open citations (links to open the citations from this article in various online reference manager services)
Cite this article (links to download the citations from this article in formats compatible with various reference manager tools)
Ablation of STAT3 in Purkinje cells reorganizes cerebellar synaptic plasticity in long-term fear memory network
eLife 10:e63291.
https://doi.org/10.7554/eLife.63291


