Bronchus-associated macrophages efficiently capture and present soluble inhaled antigens and are capable of local Th2 cell activation
- Cardiovascular Research Institute, University of California, San Francisco, United States
- Sandler Asthma Basic Research Center, University of California, San Francisco, United States
- Biomedical Sciences Graduate Program, University of California, San Francisco, United States
- Department of Anatomy, University of California, San Francisco, United States
Figures
Figure 1
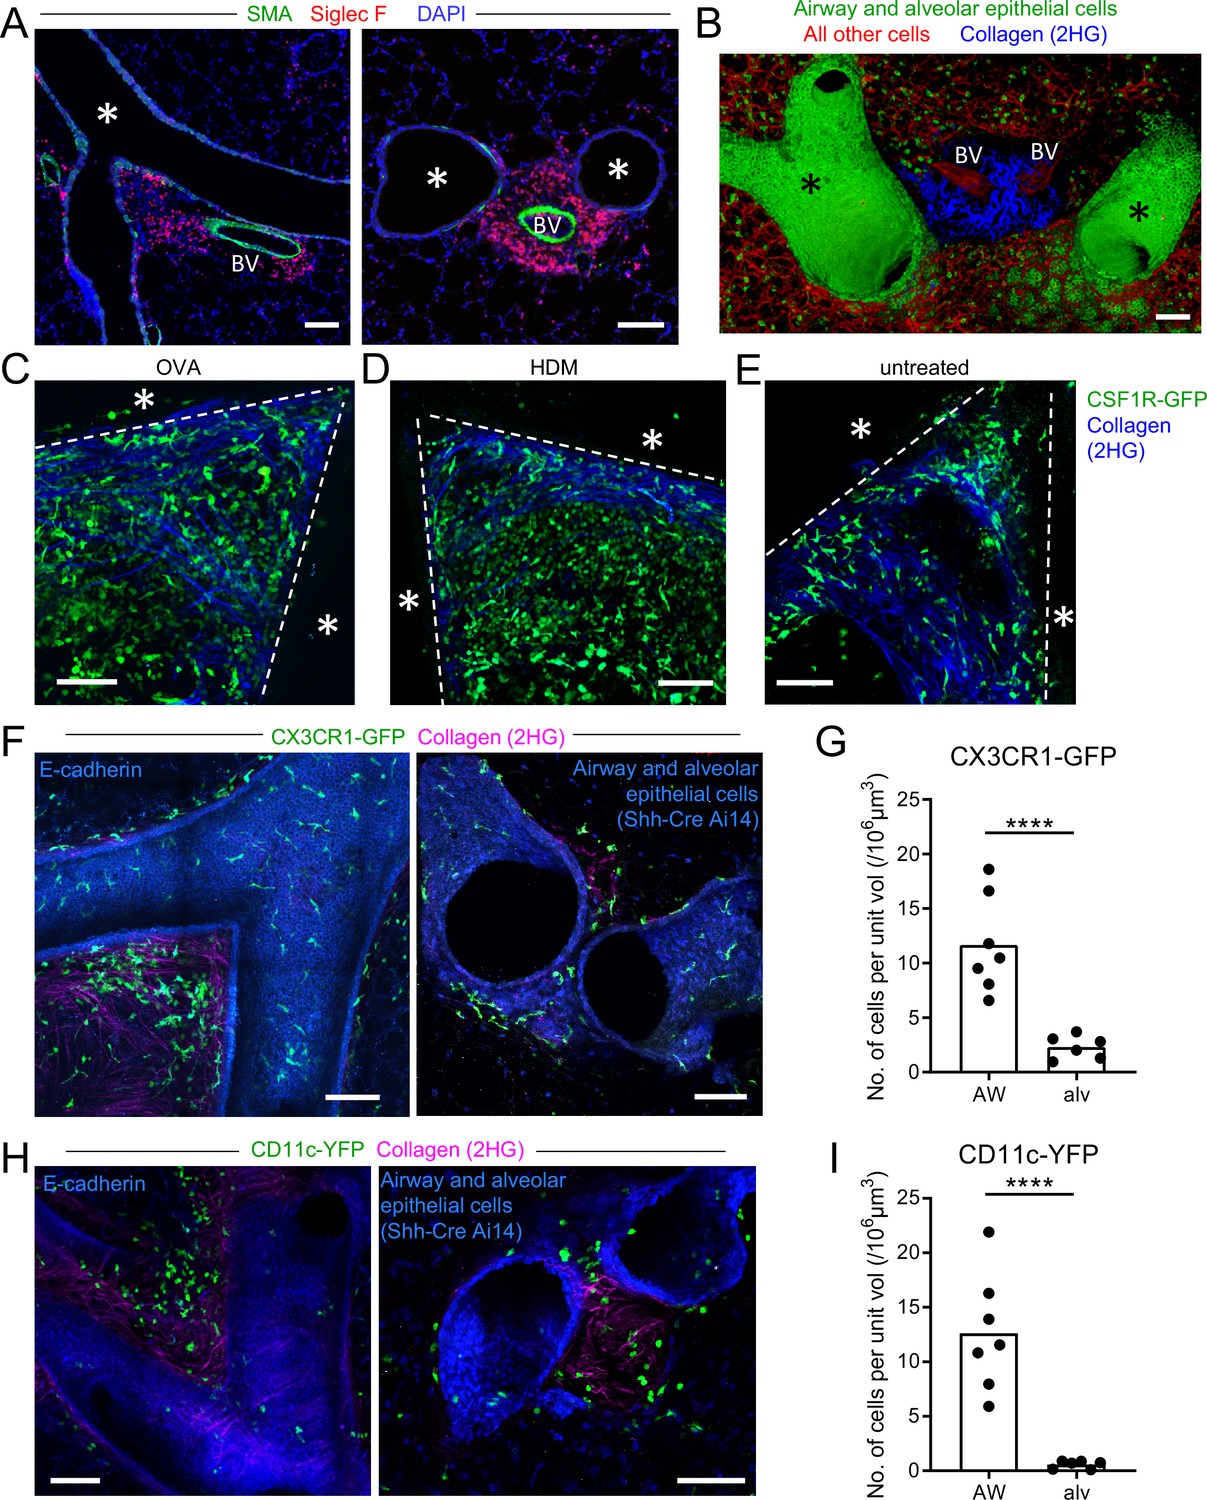
Myeloid cells are strategically positioned for surveillance of the airways.
(A) Representative immunofluorescence staining of thin cryostat sections of the lung from wild-type mice sensitized and challenged with OVA in a classical OVA model of allergic airway disease. Sections were stained with an antibody to smooth muscle actin (SMA, green) to differentiate between airways and blood vessels, and with an antibody to Siglec F (red) to visualize tissue eosinophils (Siglec-Fbright) and AMs (Siglec-Fint). Sections were stained with DAPI (blue) to visualize all nuclei. Airways (*) and blood vessels (BV) are labeled. (B) Representative 3D fluorescence opacity rendering of branching airways (*) and blood vessels (BV). The image is from a 516 μm z-stack collected by two-photon microscopy of a precision-cut thick vibratome slice of the lung from a naïve Shh-Cre ROSA26-mTmG mouse. Bronchial airway and alveolar epithelial cells express membrane-bound GFP (green), whereas all other cells express tdTomato (red). Collagen (blue) was visualized by second harmonic generation (2HG). (C, D, E) Representative two-photon microscopy images of precision-cut thick vibratome slices of the lungs of MacGreen (CSF1R-GFP, green) µMT mice that were treated with OVA (C) or HDM (D) allergic airway disease models, or were untreated (E). Maximum Intensity Projections (MIPs) representing z-stacks of 165 μm (C), 122.5 μm (D), and 127.5 μm (E) are shown. The bronchial airways were visualized by transmitted illumination and the approximate boundaries are denoted by dashed lines, with the airway lumen denoted by *. Collagen (blue) was visualized by 2HG. (F) Representative two-photon microscopy images of thick lung slices from mice expressing CX3CR1-GFP (green) together with E-cadherin-mCFP (left, blue) or Shh-Cre Ai14 (right, blue) to label airway epithelial cells. Collagen (magenta) was visualized by 2HG. MIPs representing z-stacks of 210 μm (left) and 142 μm (right) are shown. (G) Quantification of the density of CX3CR1-GFPbright cells located in tissue regions near the bronchial airways (AW) or alveoli (alv). (H) Representative two-photon microscopy images of thick lung slices from mice expressing CD11c-YFP (green) together with E-cadherin-mCFP (left, blue) or Shh-Cre Ai14 (right, blue) to label airway epithelial cells. Collagen (magenta) was visualized by 2HG. MIPs representing z-stacks of 231 μm (left) and 285 μm (right) are shown. (I) Quantification of the density of CD11c-YFP+ cells in tissue regions near the bronchial airways (AW) or alveoli (alv). Data are representative of 3 experiments (A), 4 experiments (B), 3 experiments (C), 2 experiments (D) >5 experiments (E), and ≥3 experiments (F, H). Images in (B–H) are stitched from tiled images. Each data point in (G, I) represents the quantification of cell density in one region of interest collected from six tiled images (AW) and five tiled images (alv) from five different lung lobes from four mice across three experiments. ****p<0.0001 (t-test). Scale bars, 100 μm.
Figure 2 with 3 supplements
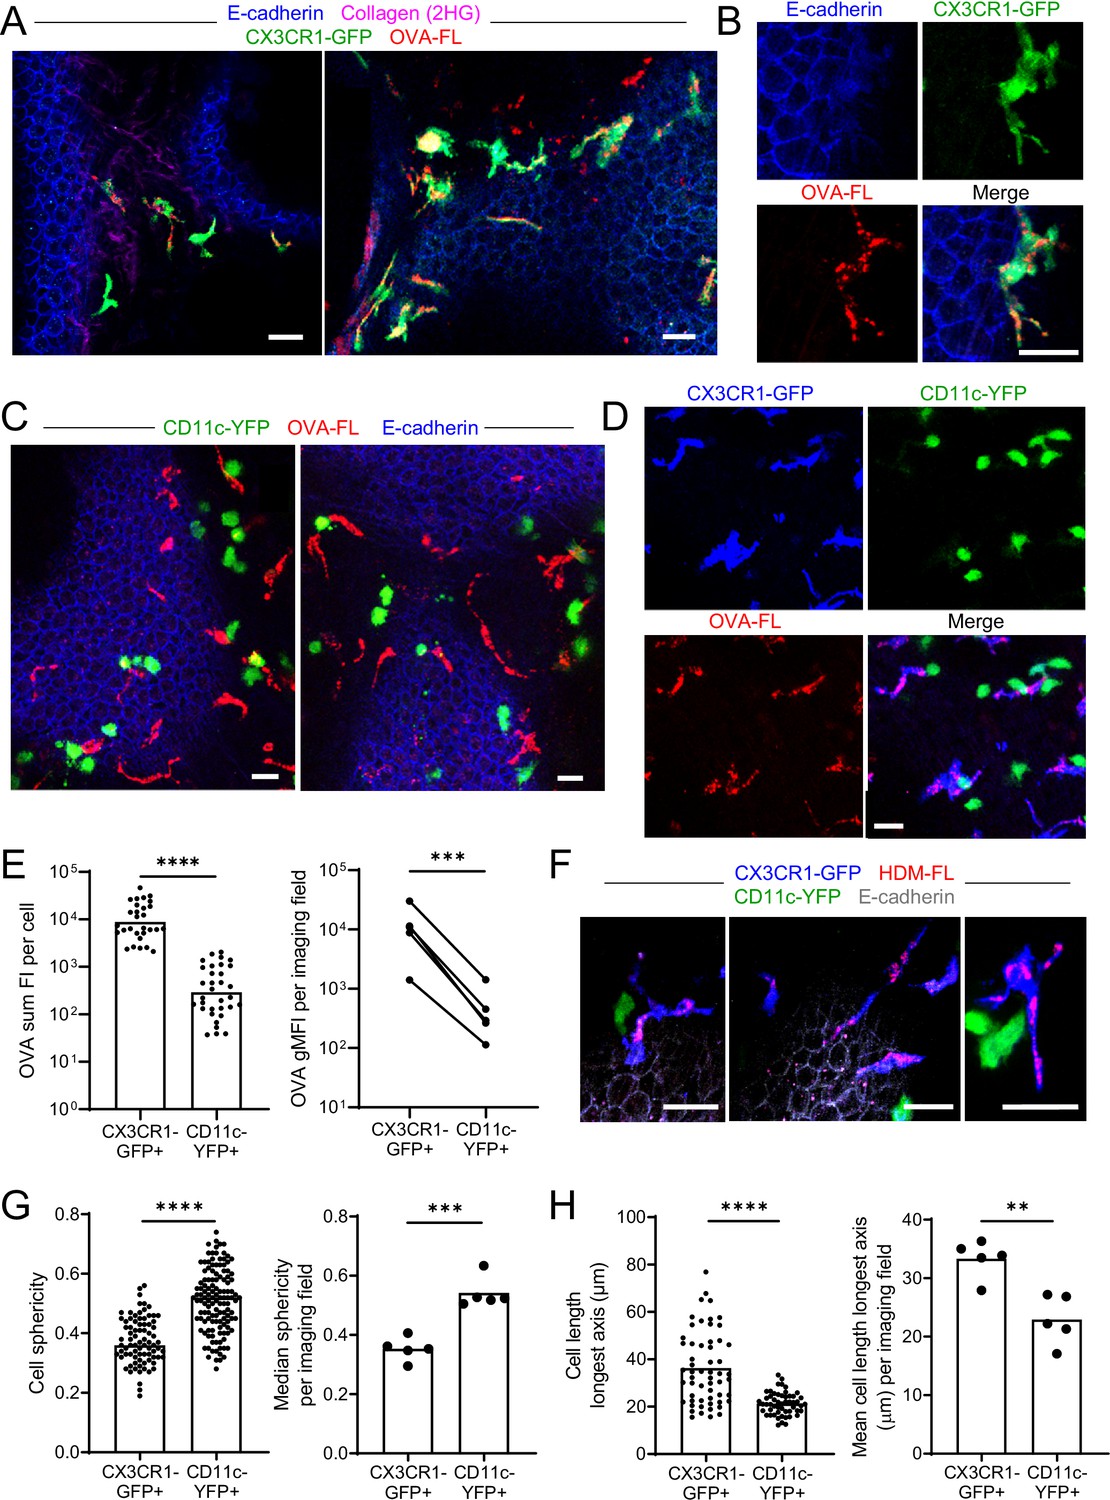
Antigen administered via the airways is captured by CX3CR1-GFPbright IMs.
(A–E) Fluorescent OVA (OVA-FL, red) was administered by intranasal droplet to naïve mice 45 min-2 hr prior to lung isolation. Precision-cut, thick vibratome sections were then imaged by two-photon microscopy. Shown are representative images of regions near the bronchial airways from mice expressing CX3CR1-GFP (green) and E-cadherin-mCFP (blue) (A, B), CD11c-YFP (green) and E-cadherin-mCFP (blue) (C) and CX3CR1-GFP (blue) and CD11c-YFP (green) (D). In (B) and (D), single color and merged color images of the regions are shown. Collagen (magenta) was visualized in (A) by 2HG. MIPs representing z-stacks of 6 μm (A, left), 21 μm (A, right), 9 μm (B), 24 μm (C, left), 22 μm (C, right), and 24 μm (D) are shown. (E) Quantification of OVA-FL uptake by CX3CR1-GFP+ versus CD11c-YFP+ cells; shown are the sum of the fluorescence intensity (FI) per cell (left) for a representative imaging field, and geometric mean fluorescence intensity (gMFI) per imaging field (right). (F) Fluorescent HDM extract (HDM-FL, red) was instilled intranasally to naïve mice expressing CX3CR1-GFP (blue), CD11c-YFP (green), and E-cadherin-mCFP (gray). MIPs representing z-stacks of 12–13 μm are shown. (G, H) Analysis of the shapes of CX3CR1-GFP+ and CD11c-YFP+ cells in naïve mice by quantifying sphericity (G) and the length of the longest cell axis (H). Data are shown for individual cells as well as the median (G) or mean (H) of cells in each imaging field analyzed. Data are representative of five experiments (A–B, D); two experiments (C,F); or were analyzed from five experiments (E, right), or four experiments (G–H). ** p<0.01, *** p<0.001, **** p<0.0001 (t-test). Scale bars, 20 μm.
Figure 2—figure supplement 1
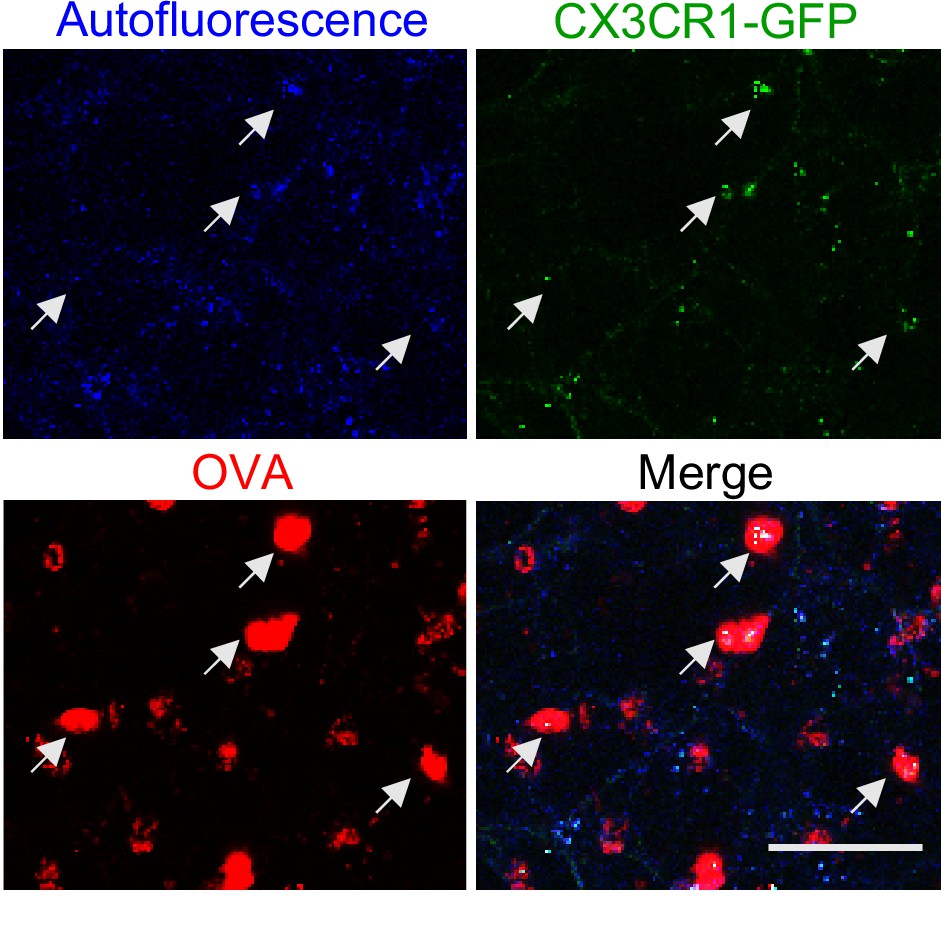
AMs in CX3CR1-GFP mice appear distinct from BAMs.
Representative alveolar region in a lung slice from a mouse expressing CX3CR1-GFP (green) that was imaged by two-photon microscopy 2 hr after the intranasal administration of fluorescent antigen (OVA, red). Single color and merged MIP images depicting an 80 μm z-stack are shown. AMs (white arrows) are visible with a round morphology and capture large amounts of fluorescent OVA, yet exhibit only punctate autofluorescence in the GFP channel at our imaging settings. Data are representative of >5 experiments. Scale bar, 50 μm.
Figure 2—figure supplement 2
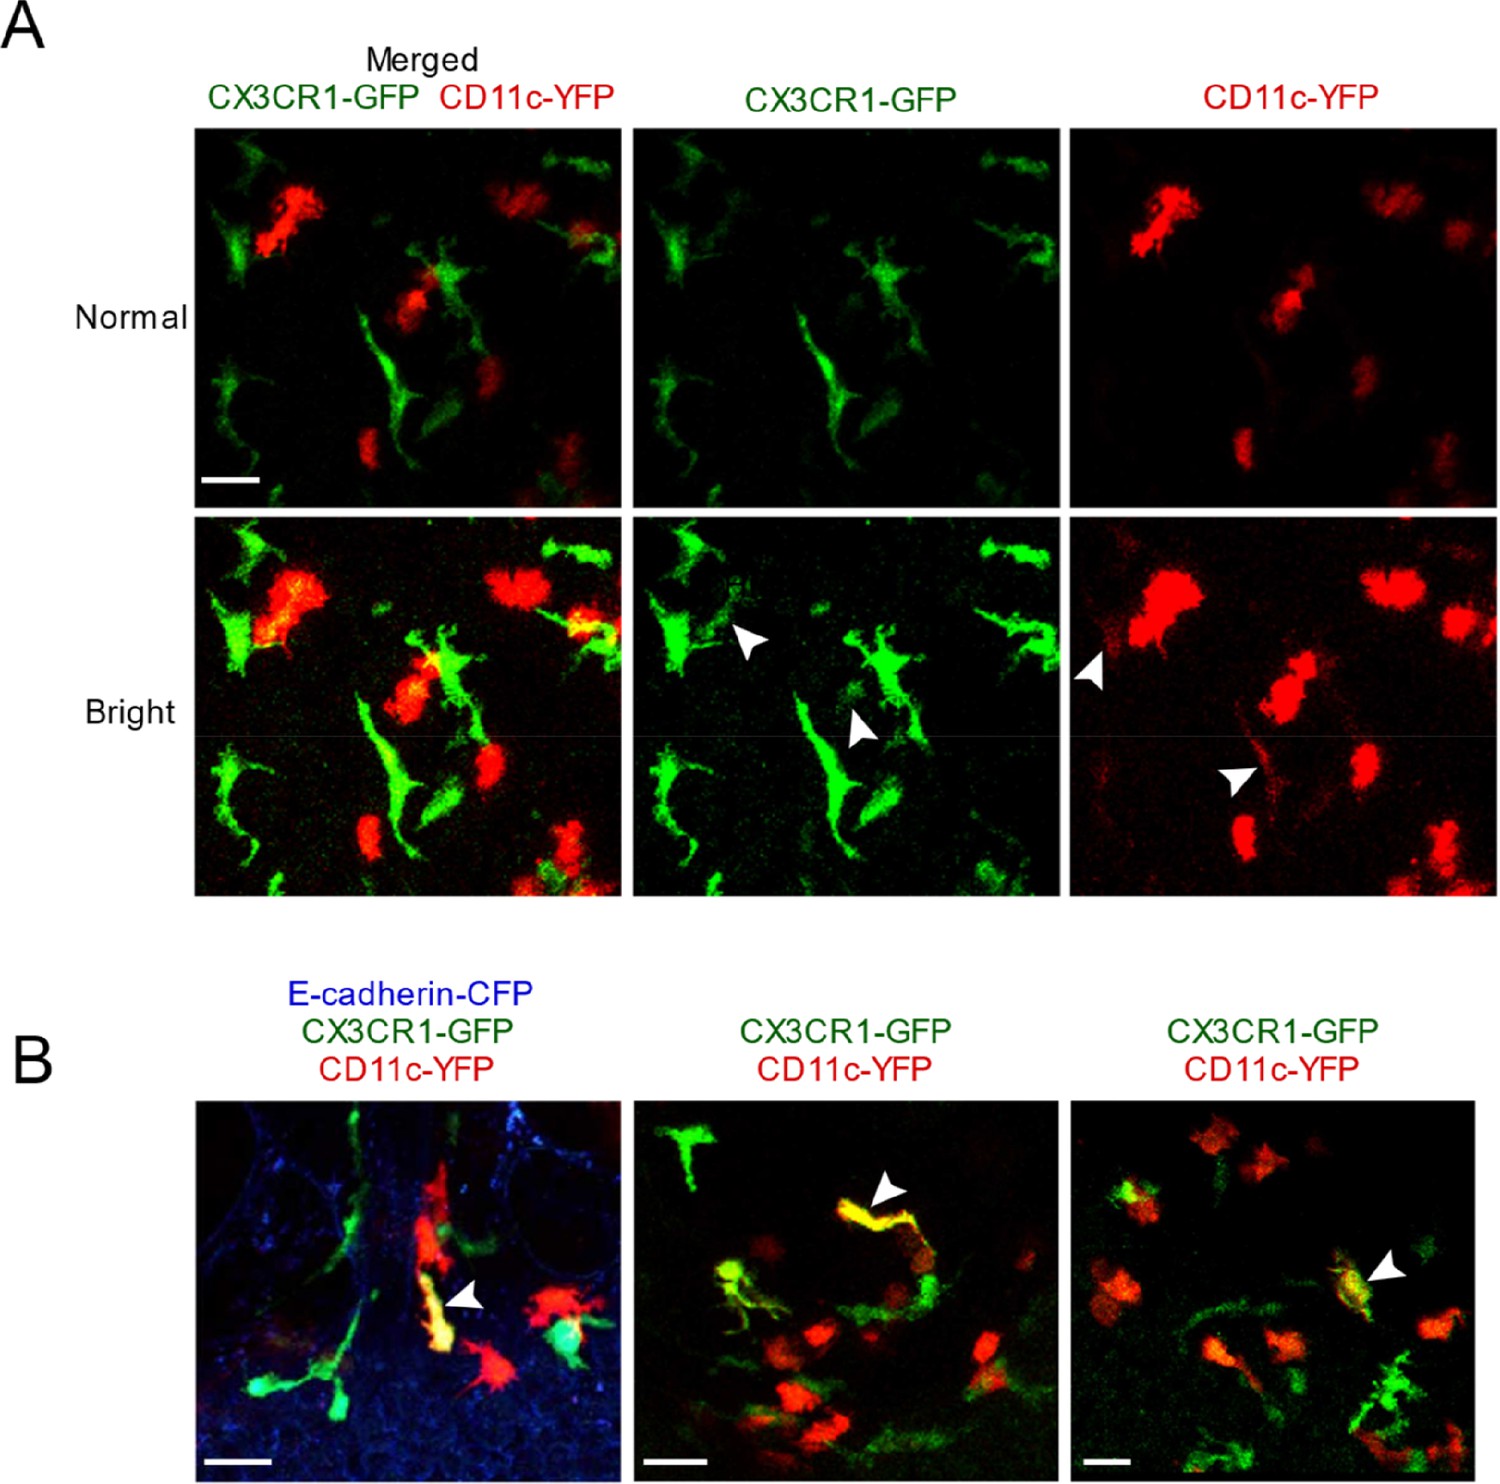
Characterization of the relative intensity of CX3CR1-GFP versus CD11c-YFP fluorescence.
(A) Two different contrast adjustments are depicted of the same original image, shown as merged versus single color images. In the ‘normal’ settings (top row), the cells look exclusively CX3CR1-GFP+ (green) or CD11c-YFP+ (red), but when the contrast is increased (‘bright’ setting, second row) then dim CX3CR1-GFP expression is observed in some bright CD11c-YFP+ cells, and vice versa (white arrowheads). The MIP represents a 53 μm z-stack collected by two-photon microscopy of a precision-cut thick vibratome section from a naïve mouse. (B) Three images are shown depicting rare cells that have bright expression of both CX3CR1-GFP (green) and CD11c-YFP (red) reporters, and thus appear yellow (white arrowheads). The MIPs represent 60 μm (left) and 34 μm (middle, right) z-stacks collected by two-photon microscopy of precision-cut thick vibratome sections. Images are from independent experiments. Scale bars, 20 μm.
Figure 2—figure supplement 3
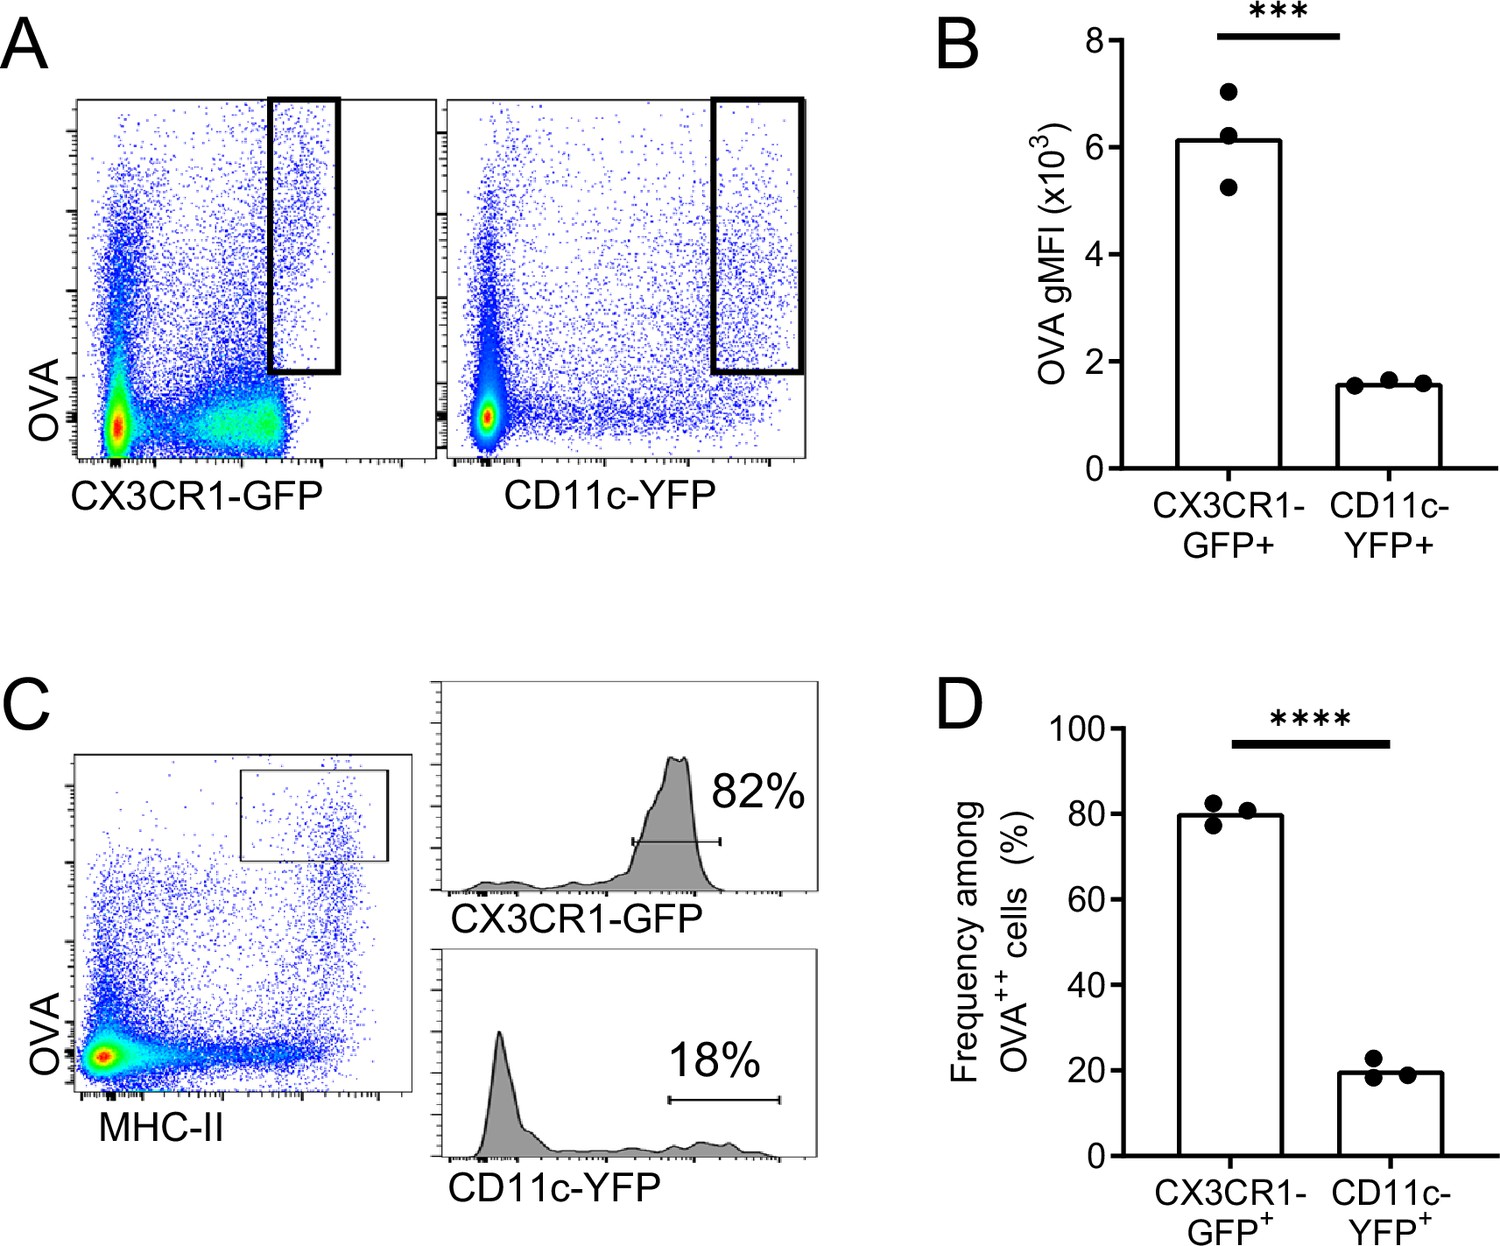
OVA-capturing BAMs do not express the CD11c-YFP reporter.
Fluorescent OVA was administered by intranasal droplet to naïve mice 2–3 hr before lung isolation and enzymatic digestion. (A, B) Representative flow cytometric analysis (A) and quantification (B) of the intensity of OVA uptake in CX3CR1-GFPbright versus CD11c-YFPbright cells. Each data point represents one mouse (naïve). (C) Representative flow cytometric analyses of CX3CR1-GFP (upper histogram) versus CD11c-YFP (lower histogram) expression on OVAbright (OVA++) APCs. Cells were pre-gated to exclude AMs, B cells, and neutrophils. (D) Quantification of the frequency of CX3CR1-GFPbright versus CD11c-YFPbright cells among OVA++ cells. Note that the GFP and YFP reporters were analyzed in separate mice. Only the cells capturing the most OVA, and the cells with bright GFP or YFP expression were gated, corresponding to the cells visualized by microscopy. Each data point represents one mouse, and data are representative of three experiments. *** p<0.001, **** p<0.0001 (t-test).
Figure 3 with 2 supplements
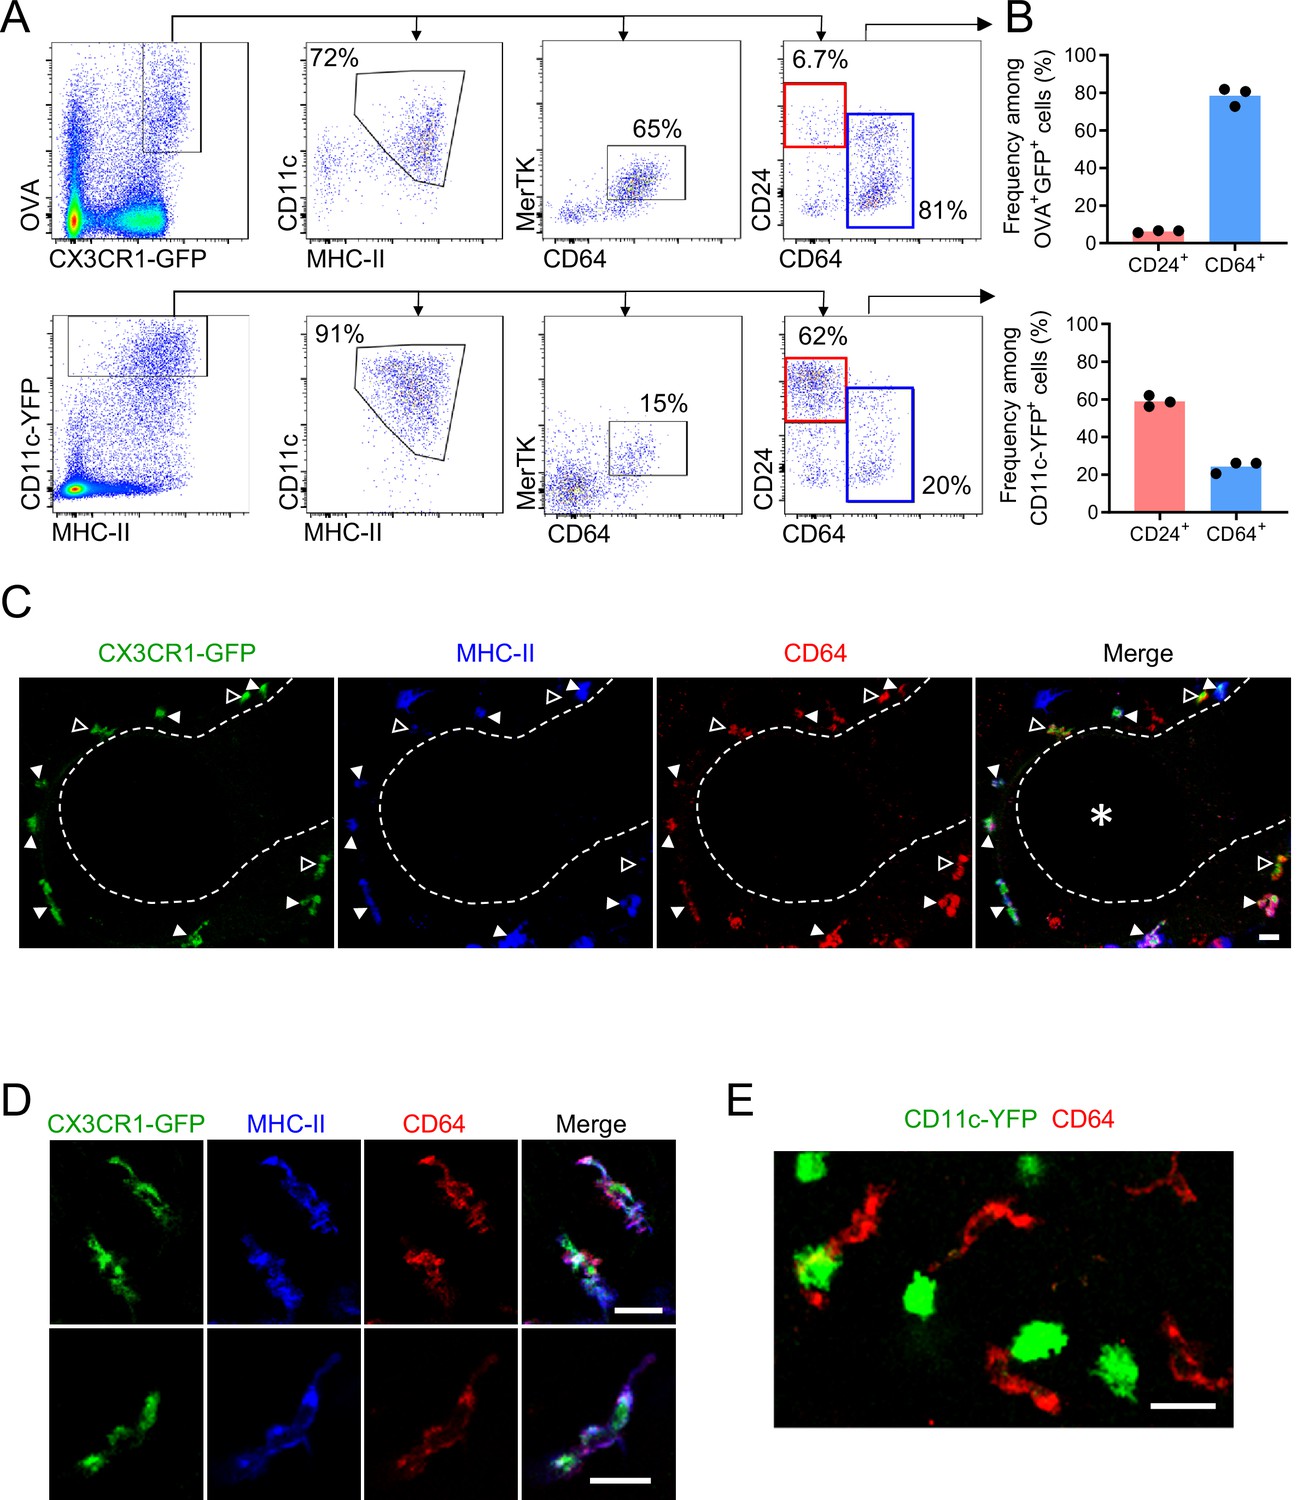
Antigen-capturing CX3CR1-GFPbright cells are Bronchus-Associated Macrophages (BAMs).
(A) Representative flow cytometric analysis of CX3CR1-GFPbright OVAbright cells (top) versus CD11c-YFPbright cells (bottom). Cells were pre-gated to exclude B cells, neutrophils, eosinophils, and AMs (CD19– Ly6G– Siglec-F–). (B) Quantification of the frequency of CD24+ CD64– (“CD24+”) or CD64+ CD24–/lo (“CD64+”) cells among CX3CR1-GFPbright OVAbright cells (top) or CD11c-YFPbright cells (bottom) that were gated as in (A). (C–D) Representative two-photon microscopy of MHC-II (blue) and CD64 (red) antibody staining in precision-cut vibratome lung sections from CX3CR1-GFP (green) mice, showing a region containing an airway as a 3D fluorescence opacity rendering of a 54 μm z-stack (C) as well as single z-plane images of cells to confirm colocalization of molecules (D); note C and D are from different imaging fields. In (C and D), single color and merged images are shown. In (C), the bronchial airway was visualized by transmitted illumination and the approximate boundaries are denoted by dashed lines, with the airway lumen denoted by * in the merged image. In (C), most CX3CR1-GFPbright CD64+ cells are MHC-IIhi (solid arrowheads), yet some cells are MHC-IIlo (open arrowheads). (E) Representative two-photon microscopy of CD64 antibody staining (red) in vibratome lung sections from CD11c-YFP (green) mice, showing a MIP of a 15 μm z-stack. Mice in all panels were unimmunized. Each data point represents one mouse (B). Data in all panels are representative of ≥2 experiments. Scale bars, 20 μm.
Figure 3—figure supplement 1
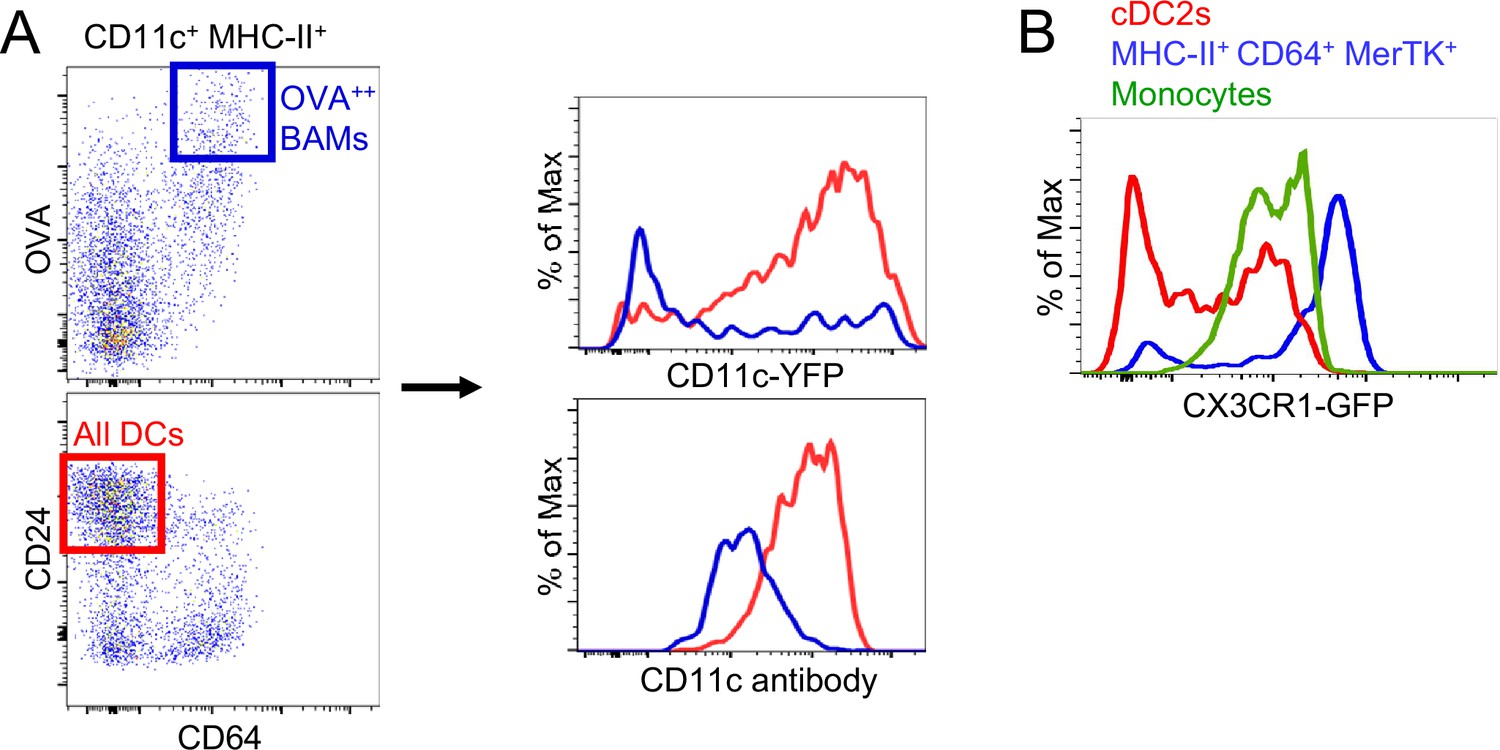
CD11c antibody labeling, CD11c-YFP and CX3CR1-GFP expression on CD64+ IMs.
(A) Representative flow cytometric analysis of CD11c-YFP reporter expression (upper histogram) versus CD11c antibody surface staining (bottom histogram) in the same sample, comparing OVAbright (OVA++) BAMs (blue) to DCs (red) gated as shown (left). (B) Representative flow cytometric analysis comparing the fluorescence intensity of the CX3CR1-GFP reporter in cDC2s (red), MHC-II+ CD64+ MerTK+ cells (blue), and monocytes (green). Data are representative of two experiments (A) and four experiments (B).
Figure 3—figure supplement 2
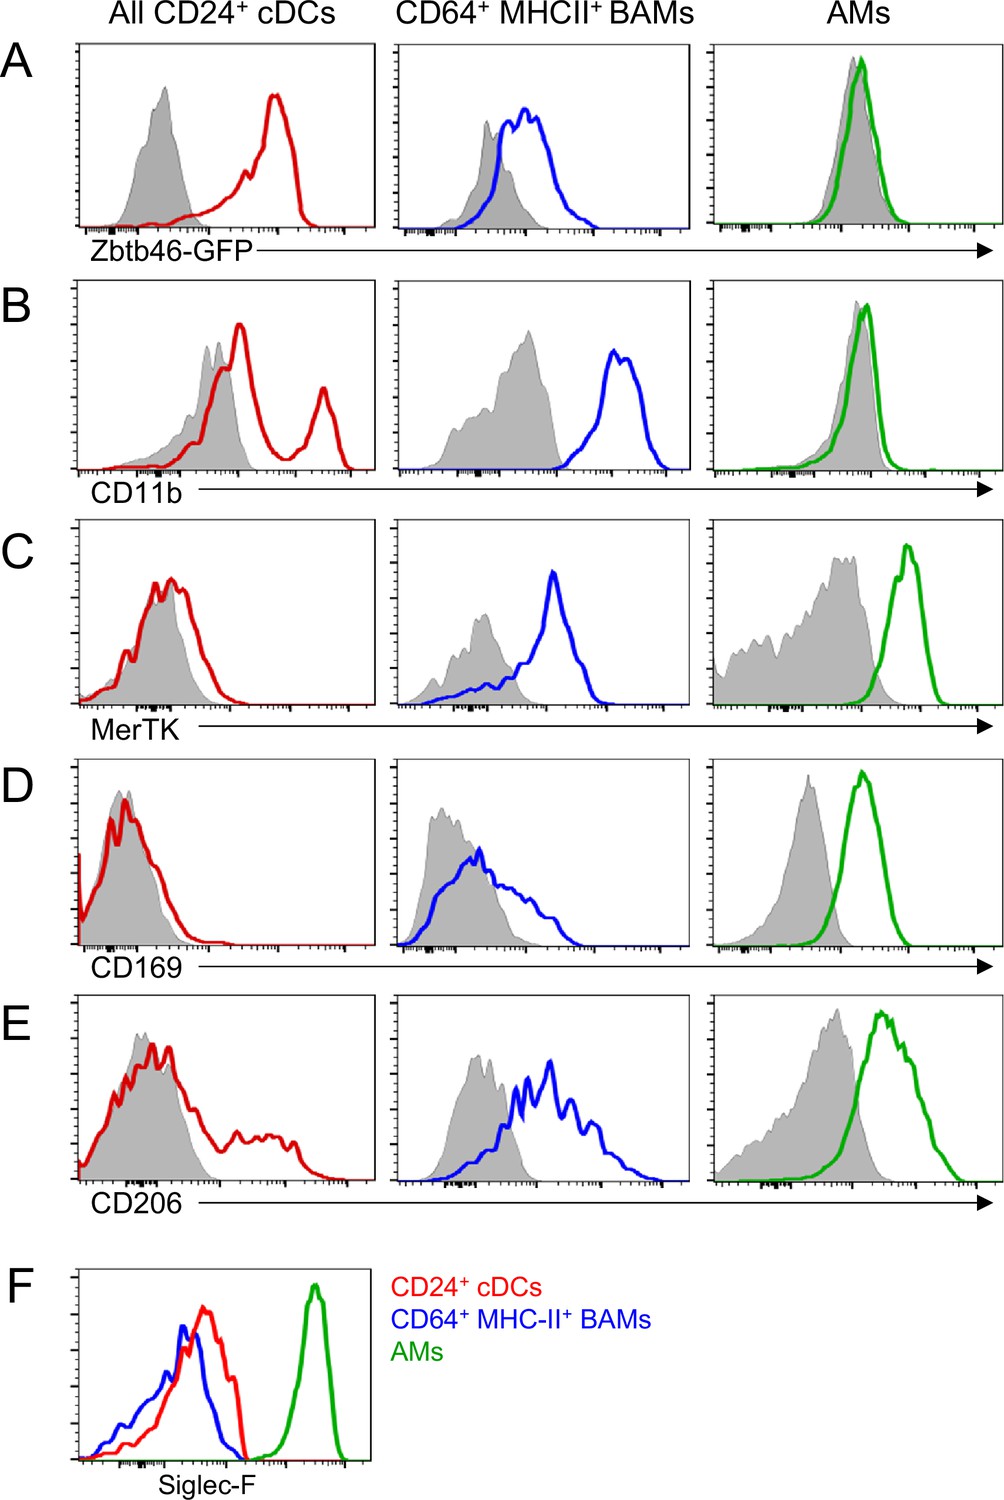
Phenotypic comparison of cDCs, BAMs and AMs.
Representative flow cytometric analysis of marker expression on all CD24+ DCs (red), CD64+ MHC-II+ BAMs (blue) and AMs (green). cDCs and BAMs were gated as CD19– Ly6G– Siglec-F– CD11c+ MHC-II+ then CD24+ (cDCs) versus CD64+ (BAMs) as in (Figure 3A). AMs were gated as CD19– CD11c+ Siglec-F+. (A) GFP expression on cells from the lung of a Zbtb46-GFP mouse. Background signal in a GFP-negative control mouse is shown in gray. (B–E) Antibody surface staining for CD11b (B), MerTK (C), CD169 (D), and CD206 (E) on each cell population in a wild-type mouse. Background signals in Fluorescence Minus One (FMO) controls are shown in gray. (F) Antibody surface staining for Siglec-F on each indicated cell population in a wild-type mouse. Data are representative of ≥2 experiments.
Figure 4 with 1 supplement
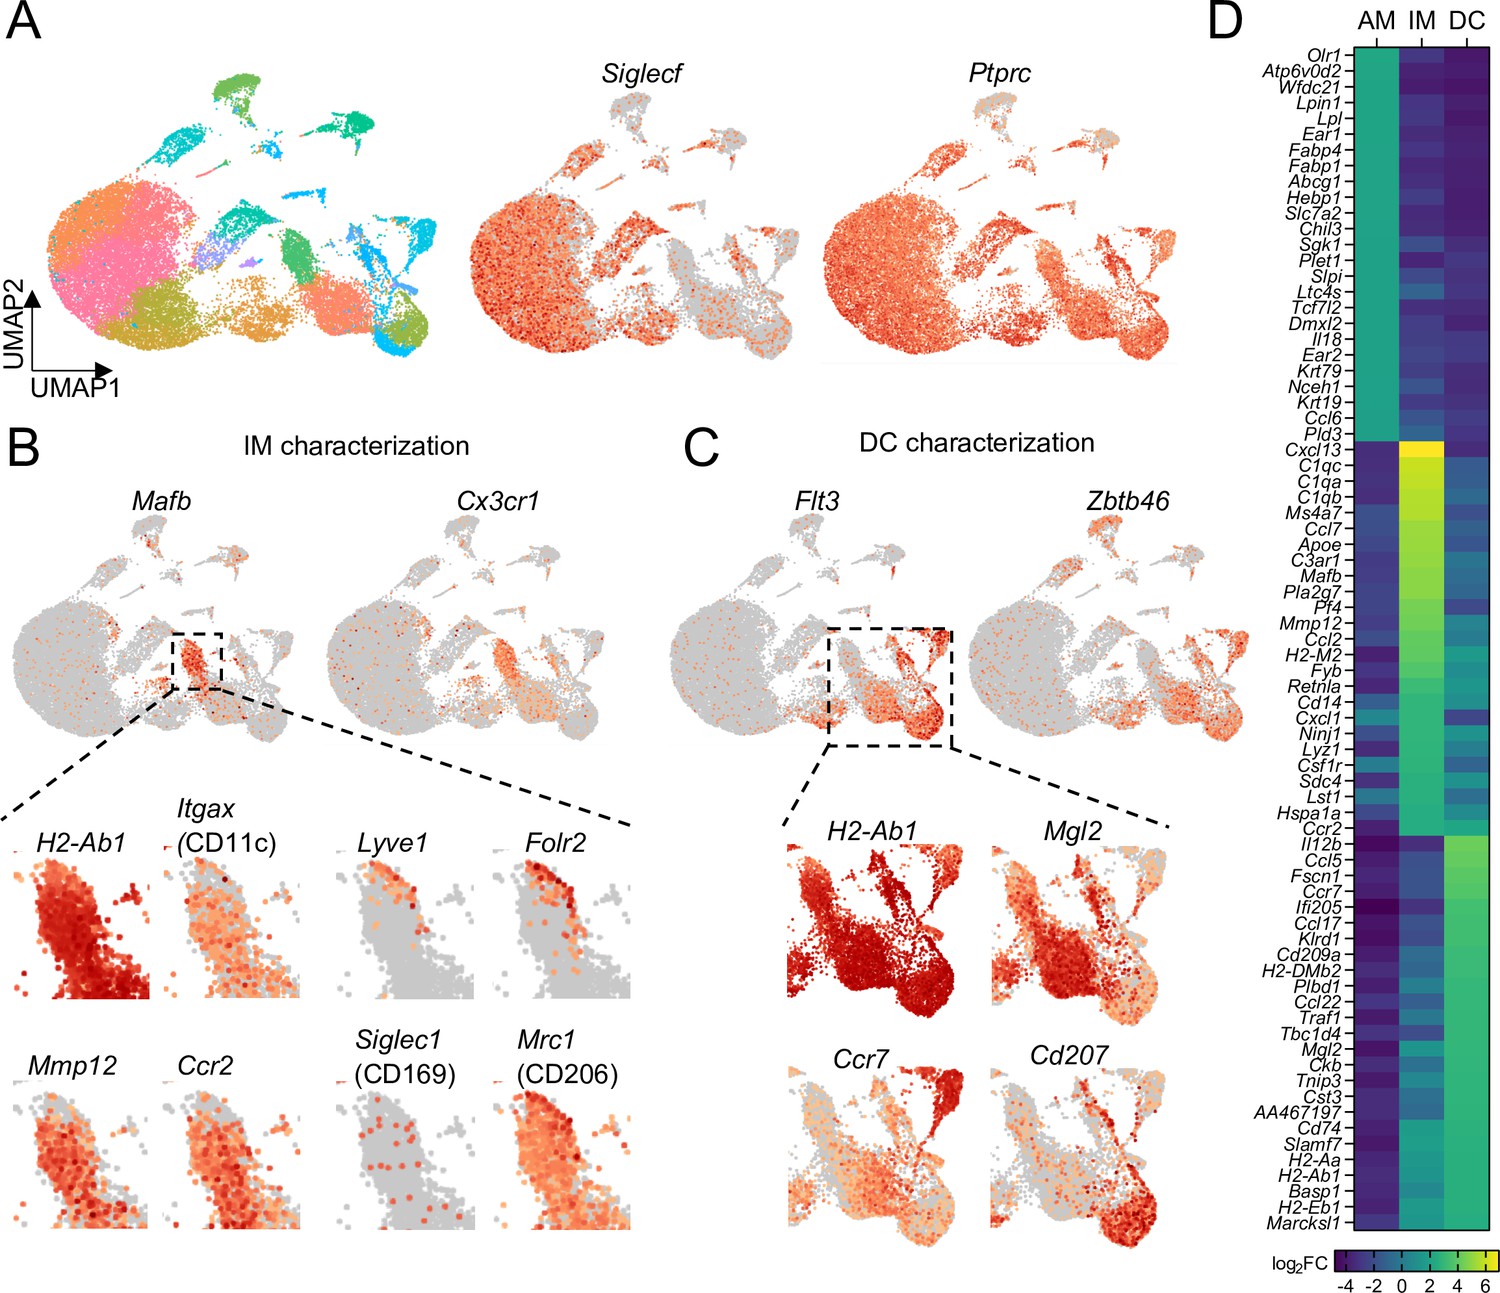
Comparison of transcriptional profiles of AMs, IMs, and DCs by scRNA-seq.
(A) UMAP plot depicting automated graph-based clustering of CD11c-enriched cells aggregated from lungs of four naïve wild-type mice. The abundance of Siglecf and Ptprc (CD45) transcripts are shown in middle and right plots. (B) Transcriptional profile of IMs identified as the cluster of cells most highly expressing Mafb and Cx3cr1. Genes of interest that were previously reported to be expressed in IMs are shown in the bottom panels. (C) Transcriptional profile of DCs identified as the clusters of cells most highly expressing Flt3 and Zbtb46. Specific transcripts for each of the sub-clusters are shown in the bottom panels. (D) Heat map showing the top 25 most upregulated, differentially-expressed genes from each of the AMs, IMs, and DCs populations gated according to Figure 4—figure supplement 1.
Figure 4—figure supplement 1
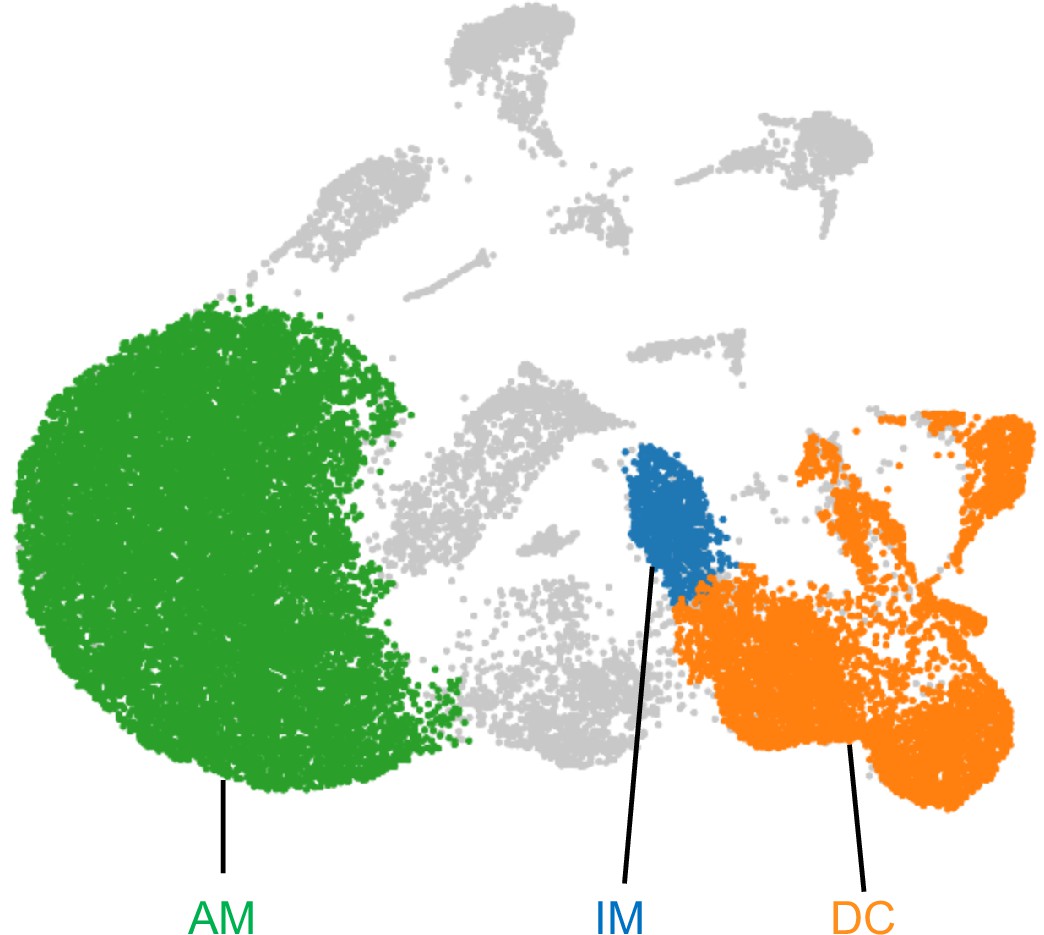
Gating for AMs, IMs, and DCs for scRNA-seq.
Based on the expression levels of the cell type specific genes: Siglecf, Mafb, Cx3cr1, Flt3 and Zbtb46, clusters containing AMs (green), IMs (blue) and DCs (orange) were gated using polygonal selection in Loupe Browser. These gated populations were analyzed for differentially expressed genes to define the upregulated genes in Figure 4D.
Figure 5
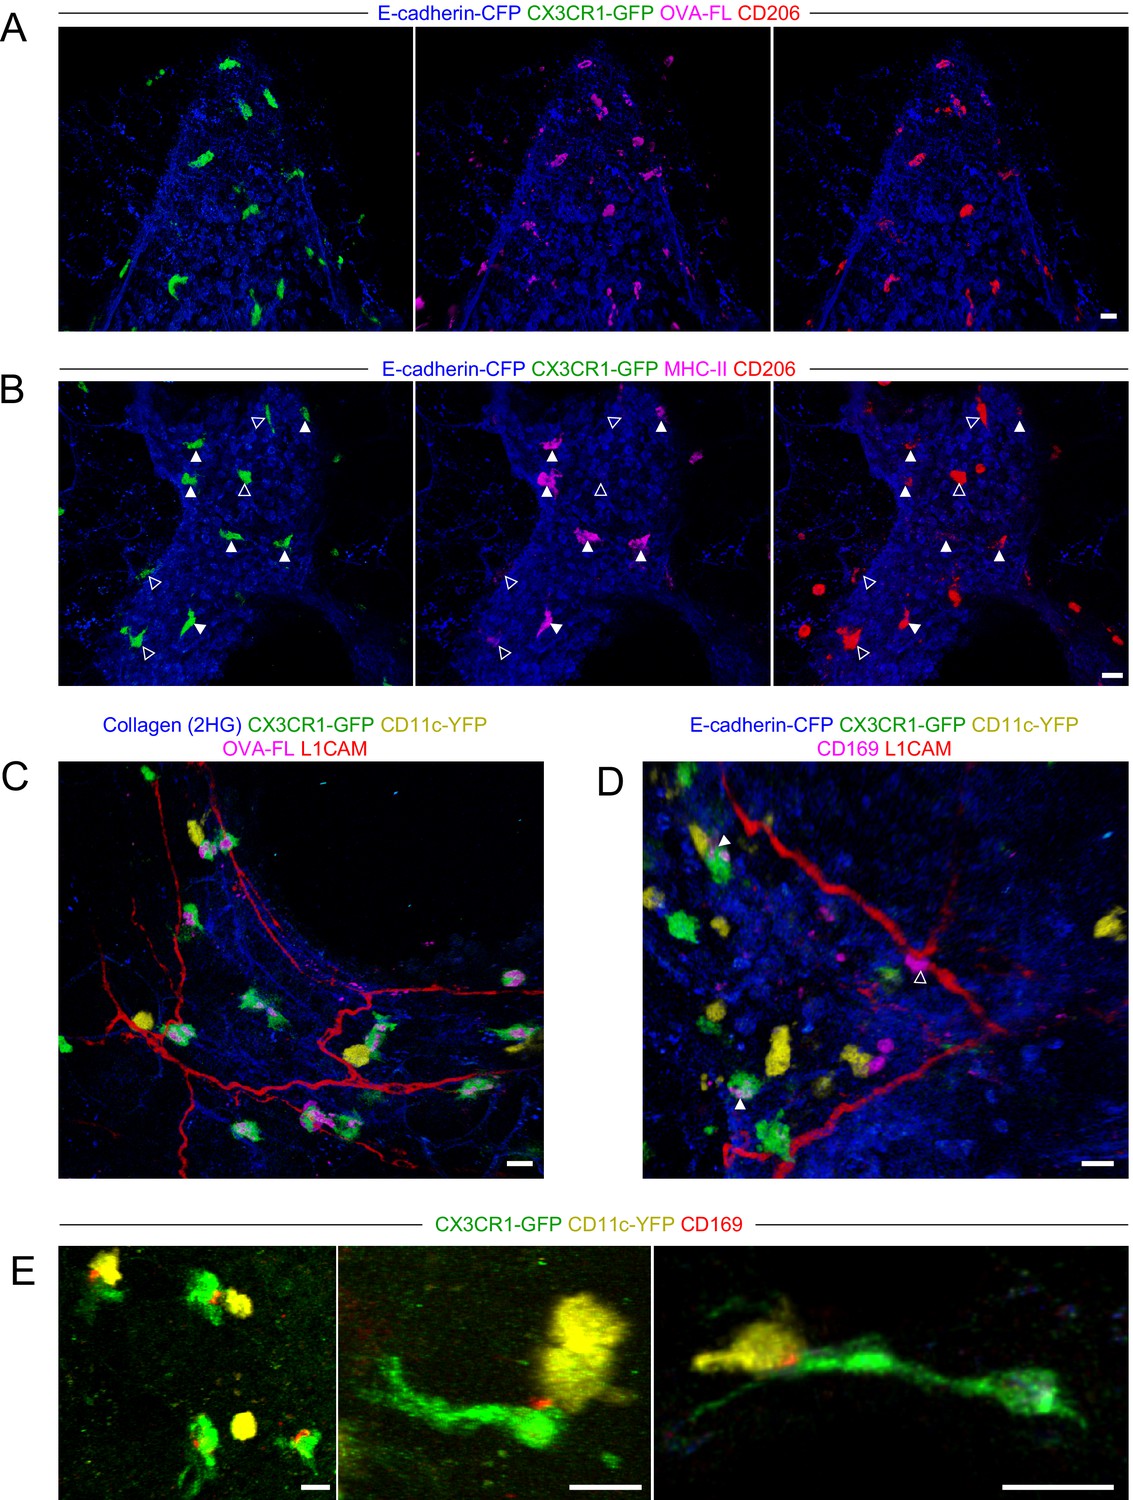
Characterization of BAM marker expression and positioning with respect to nerves.
Lungs were isolated from naïve mice expressing E-cadherin-CFP (blue), CX3CR1-GFP (green), and/or CD11c-YFP (yellow), as indicated. Some mice received fluorescent OVA (OVA-FL) 2 hr prior to imaging. Precision-cut lung slices were labeled with the indicated antibodies (see Methods for details) and then imaged by two-photon microscopy. Shown are 3D fluorescence opacity renderings of image stacks of regions adjacent to airways. (A, B) Comparison of CD206 staining (red) to OVA-FL uptake (magenta, A) and MHC-II staining (magenta, B). Separate two-color images (each color with E-cadherin-CFP) are shown for best visualization of the different fluorophores. In (B), CX3CR1-GFPbright MHC-IIhi cells are indicated by solid arrowheads and CX3CR1-GFPbright MHC-IIlo cells are indicated by open arrowheads. (C, D) Visualization of nerves with L1CAM staining (red) together with OVA-FL uptake (magenta, C) and CD169 staining (magenta, D). Merged color images are shown to enable clear visualization of spatial localization of cells with respect to nerves. In (D), punctate CD169 staining on BAMs is indicated by solid arrowheads, whereas a CX3CR1-GFPneg cell with uniform, bright CD169 staining adjacent to the nerve is shown with an open arrowhead. (E) Examples of punctate CD169 staining (red) on BAMs, often at the interface between BAMs and DCs. Images were derived from z-stacks of 182 µm (A), 102 µm (B), 127 µm (C), 219 µm (D), 165 µm (E, left), 124 µm (E, middle), and 7.5 µm (E, right). Scale bars, 20 µm.
Figure 6
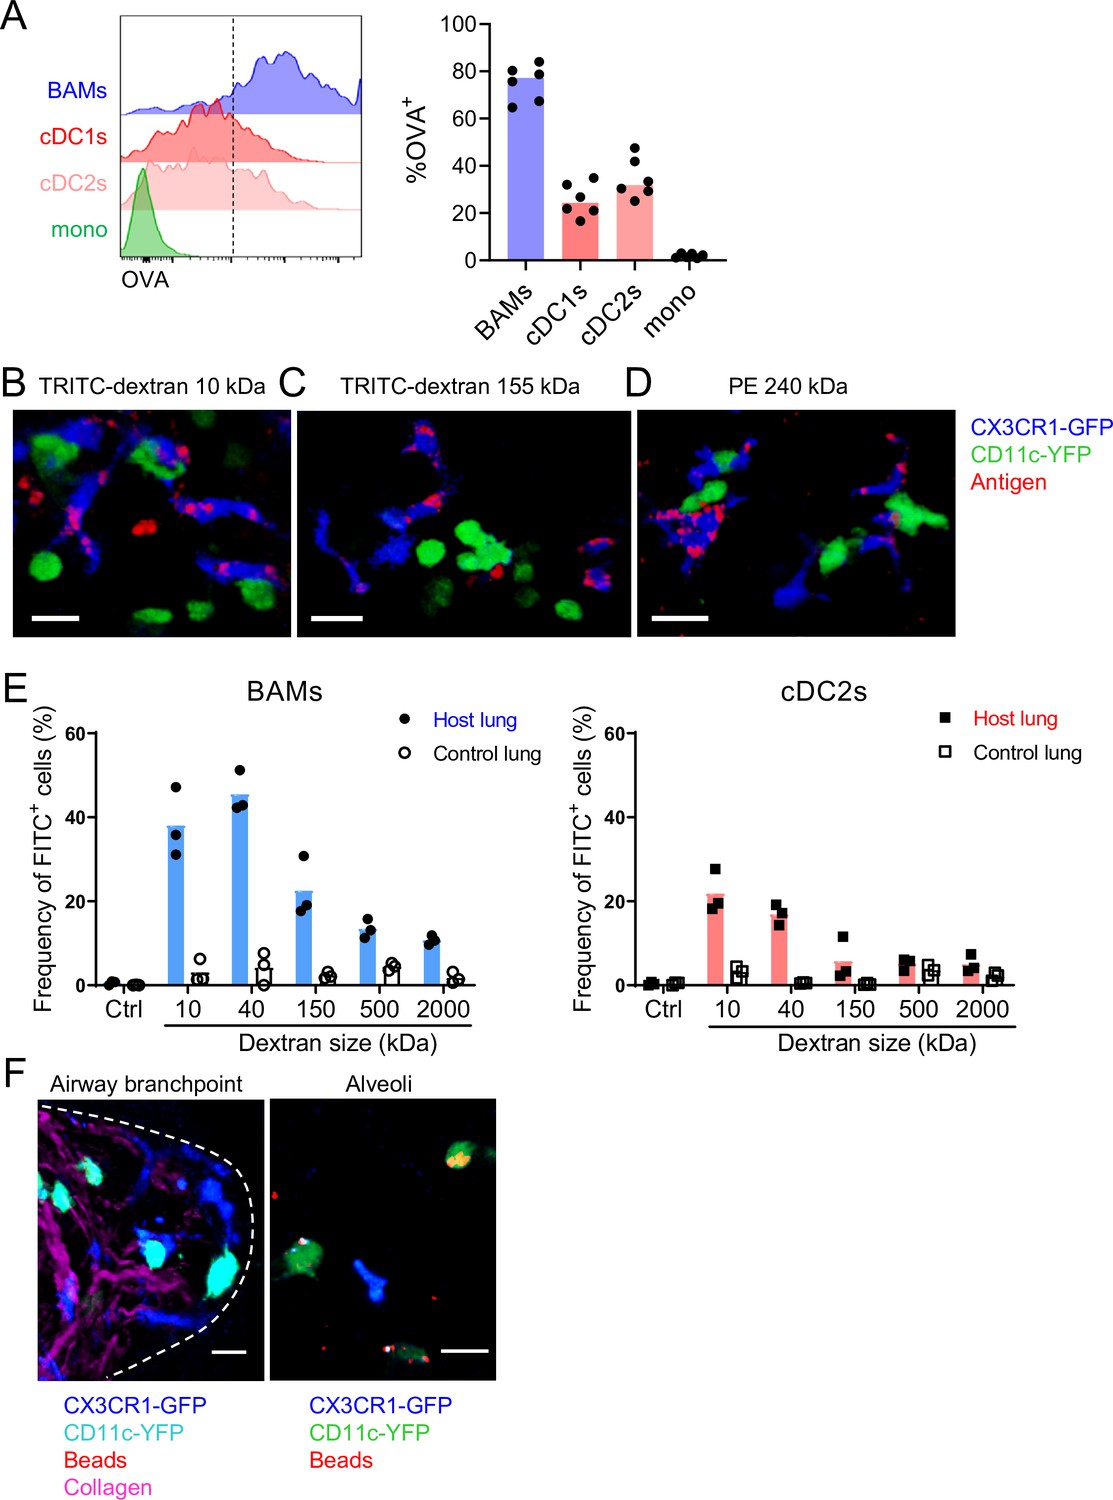
Characteristics of molecules captured by BAMs versus cDCs.
(A) Fluorescent OVA was administered by intranasal droplet to naïve mice 2 hr before lung isolation and enzymatic digestion. Representative flow cytometry (left) and quantification (right) of the frequency of OVA+ cells within each indicated cell subset. Cells were pre-gated to exclude B cells, neutrophils, eosinophils, and AMs (CD19– Ly6G– Siglec-F–). CD11c+ MHC-II+ cells were resolved into CD24+ cDCs versus CD64+ BAMs as in Figure 4A, and then the remaining cells that were not CD11c+ MHC-II+ cells were gated as CD11b+ to define monocytes (mono). cDC1s were gated as CD11b– CD103+ and cDC2s were gated as CD11b+ CD103– subsets of cDCs. Mice were either CX3CR1-GFP or CD11c-YFP mice. In CX3CR1-GFP mice, monocytes appeared as two subsets with low to intermediate GFP expression, consistent with classical and non-classical monocytes, respectively (data not shown). (B, C, D) The indicated fluorescent antigens (red) were administered by intranasal droplet to naïve CX3CR1-GFP (blue) X CD11c-YFP (green) mice 2–4 hr before lung isolation and the preparation of precision-cut thick lung sections. Representative images depict cells that captured the indicated fluorescent molecules in 3D fluorescence opacity renderings of 73 μm (B), 16 μm (C), and 51 μm (D) z-stacks collected by two-photon microscopy. DX, dextran; scale bars, 20 μm. (E) FITC-dextran of a range of sizes was administered by intranasal droplet to naïve mice, and then 2–3 hr later the lungs were isolated and enzymatically digested. The frequencies of FITC+ BAMs (left) and FITC+ cDC2s (right) were enumerated by flow cytometry as shown. To control for the possibility of FITC-dextran uptake during lung digestion and dissociation, the lungs from congenic mice that did not receive FITC-dextran were co-digested (‘control lung’) with the lungs of mice that had received FITC-dextran (‘host lung’). (F) Fluorescent beads (red) were administered to naïve mice expressing CX3CR1-GFP (blue) and CD11c-YFP (cyan, left or green, right). Representative two-photon microscopy images of an airway branchpoint (left) and alveoli (right) are shown. Images are MIPs of 107 μm (left) and 45 μm (right) z-stacks. Beads were primarily captured by AMs which appear dimly fluorescent in the YFP channel (note that the image of the alveoli [right] is adjusted to show the dimmer signal). Collagen (magenta) was visualized by 2HG. Each data point represents one mouse (A, E). Data are representative of two experiments (A–D). Similar results to (F) were observed in other experiments with smaller and larger beads. Scale bars, 20 μm.
Figure 7
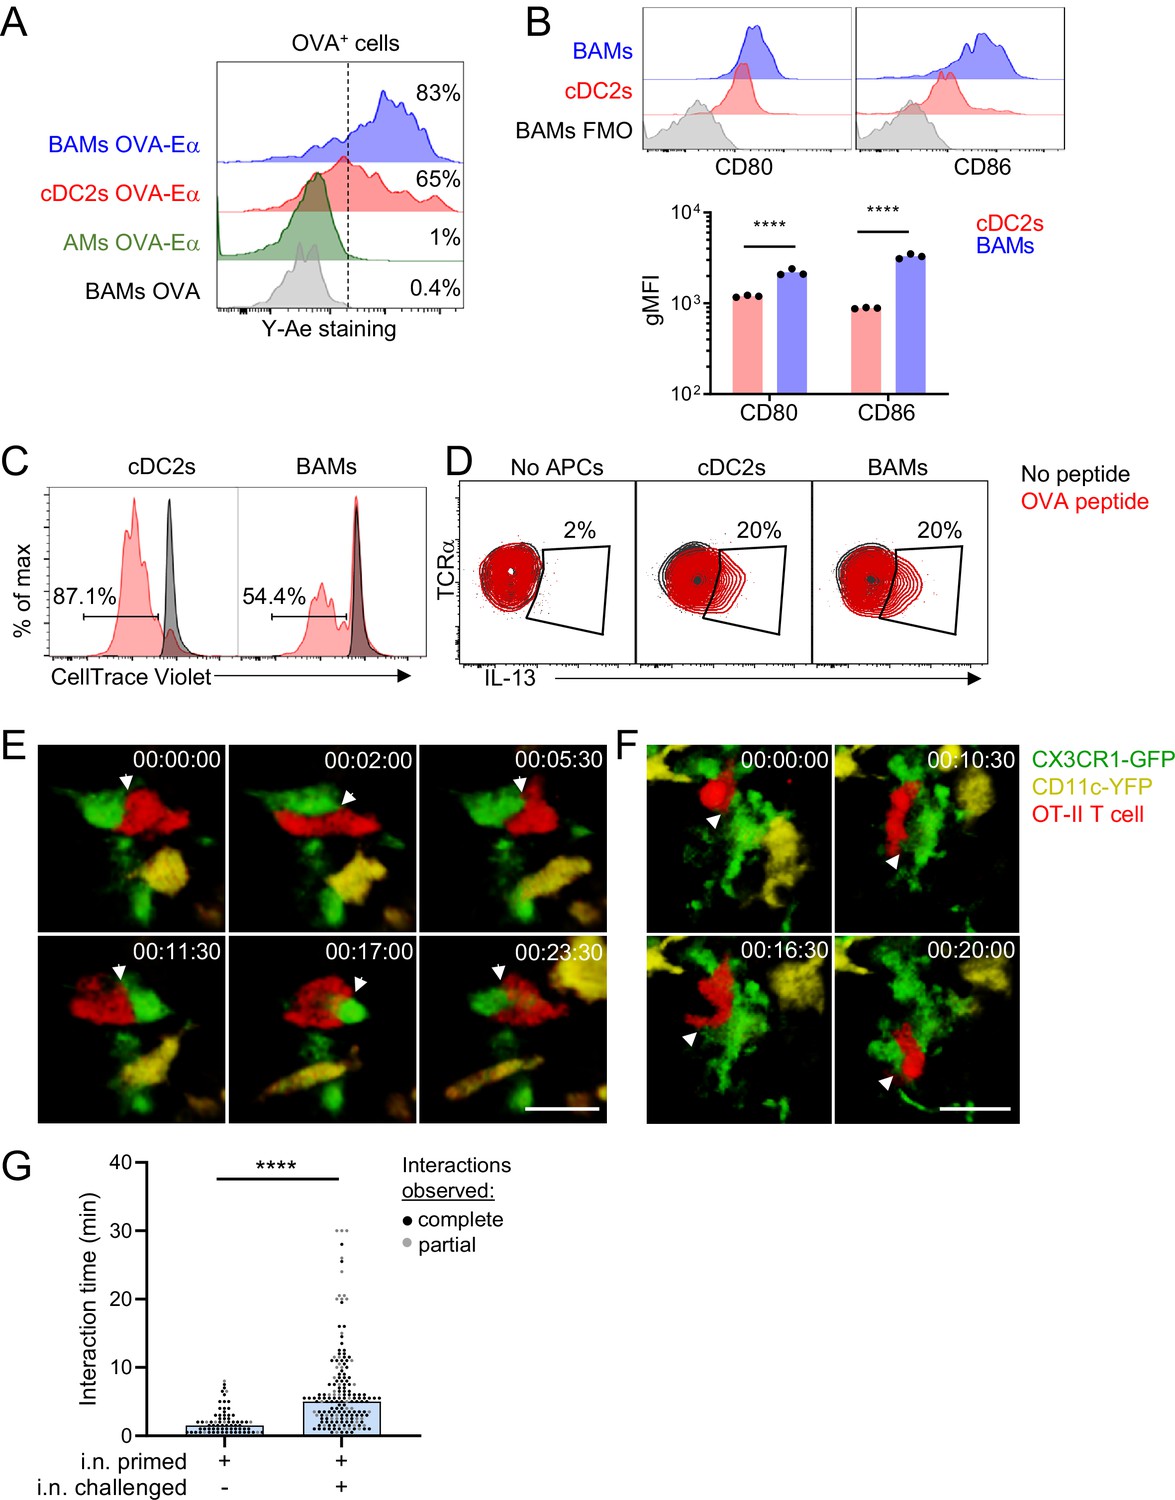
BAMs act as APCs and interact with CD4 effector T cells in the lung.
(A) Representative flow cytometric analysis of Y-Ae antibody staining to detect the presentation of MHC-II:Eα peptide complexes. OVA conjugated to Eα peptide was administered intranasally together with OVA-Alexa647 to fluorescently label antigen-capturing cells, and then after 17–18 hr to allow time for antigen processing and presentation, the lungs were isolated, followed by enzymatic digestion and analysis of Alexa647+ BAMs (blue), cDC2s (red) and AMs (green). Control mice received OVA without the Eα peptide (gray). (B) Representative flow cytometry (top) and quantification (bottom) of the surface expression of the co-stimulatory molecules CD80 and CD86 on BAMs (blue) and cDC2s (red) in the lungs of naïve mice in the steady state. FMO (gray), fluorescence minus one control. (C) Flow cytometric analysis of the proliferation of naïve OT-II T cells that were co-cultured for 2.5 days with sorted cDC2s or BAMs in the presence (red) or absence (black) of OVA peptide. Proliferation was assessed by dilution of CellTrace Violet. (D) Flow cytometric analysis of IL-13 production in Th2-polarized OT-II T cells that were cultured overnight with sorted cDC2s or BAMs, or no APCs as a control, in the presence (red) or absence (black) of OVA peptide, together with Brefeldin A. (E–G) Time-lapse images (E, F) and quantification (G) of CD4 T cell interactions with CX3CR1-GFP+ BAMs. OT-II T cells (red) expressing tdTomato (E) or CFP (F) were adoptively transferred to mice expressing CX3CR1-GFP (green) and CD11c-YFP (yellow) that had been sensitized with OVA and low-dose LPS intranasally, and then challenged with OVA alone intranasally 9–10 days later. Precision-cut thick vibratome sections of the lung were prepared for imaging 4–6 hr after OVA challenge, and two-photon microscopy z-stacks of 15 μm (E) and 22 μm (F) are shown. (G) Quantification of interaction times in which CX3CR1-GFP+ BAMs were in direct contact with OT-II T cells. Each data point represents a BAM-T cell interaction event. Due to the limitations of imaging in a specific volume over a fixed period of time, only some cellular interactions could be tracked for their entire duration from start to finish (complete, black dots), whereas other interactions could only be tracked for a portion of the total interaction time (partial, gray dots) and therefore are underestimates. Elapsed time is indicated as hh:mm:ss. Each data point represents one mouse (B). Data are representative of three experiments (A, D), two experiments (B, C), and five experiments (E–F). Data in (G) are pooled from three time-lapse imaging sessions from three separate experiments. ****p<0.0001 (Mann-Whitney test). Scale bars, 20 μm.
Figure 8 with 1 supplement
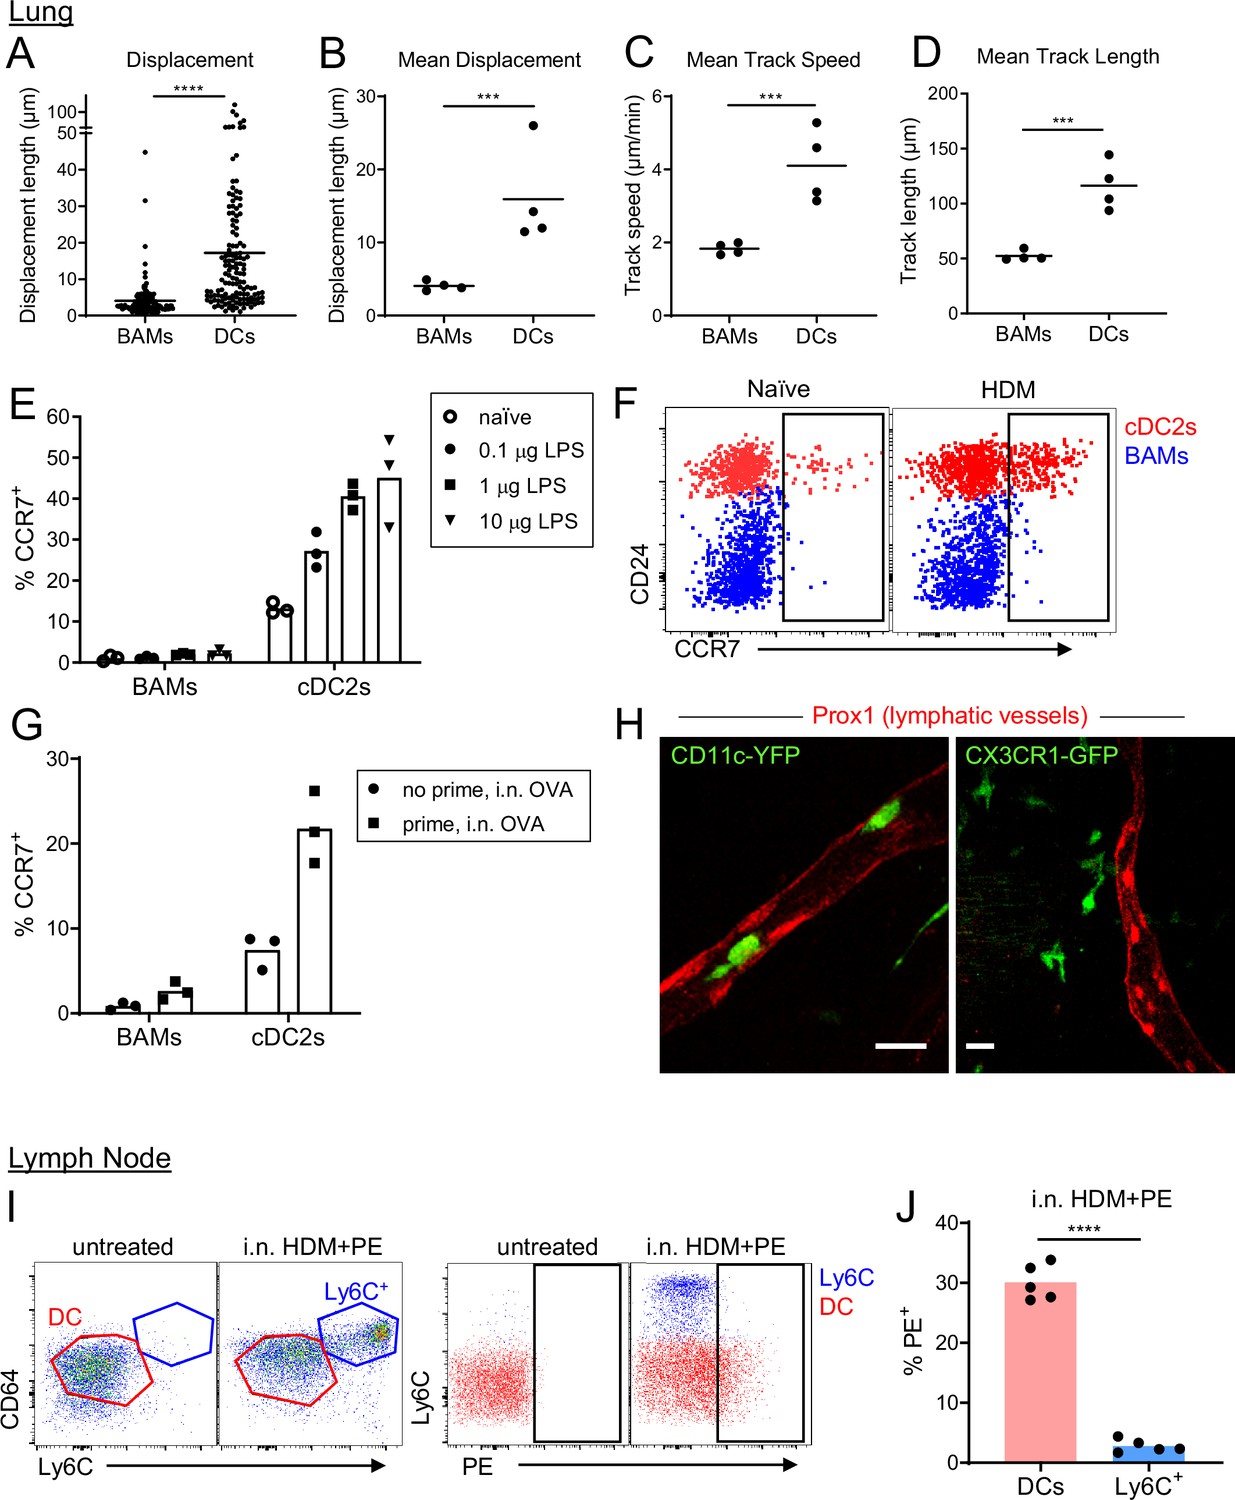
BAMs remain lung resident whereas DCs migrate to the draining lymph node.
(A–D) Motility measurements derived from time-lapse imaging of CX3CR1-GFP+ BAMs and CD11c-YFP+ DCs by two-photon microscopy of precision-cut thick lung sections from naïve mice. (E) Flow cytometric analysis of the frequency of CCR7+ cells among BAMs and cDC2s in the lung 4 hr after the indicated concentrations of LPS were administered intranasally. (F) Representative flow cytometry showing CCR7 expression on BAMs (blue) and cDC2s (red) in the lung 6 hr after intranasal HDM administration. (G) The frequency of CCR7+ cells among BAMs and cDC2s in the lung in mice that were naïve (‘no prime’) or had been primed 10 d earlier with intranasal OVA and 100 ng LPS (‘prime’), and were challenged once with intranasal OVA (i.n. OVA) without adjuvant. Lungs were excised 6 h after OVA challenge, enzymatically digested, and analyzed by flow cytometry. (H) Representative two-photon microscopy images of CD11c-YFP+ DCs (green) or CX3CR1-GFP+ BAMs (green) and lymphatic vessels (Prox1-tdTomato, red). Mice were administered intranasal LPS 2–4 hr before lung isolation, and then precision-cut thick lung slices were imaged for several hours. Images are MIPs of 41 μm (left) and 32 μm (right) z-stacks. (I) Representative flow cytometry gating in the lung-draining mediastinal lymph node in mice that were untreated or had been given HDM and PE intranasally 1 d earlier. Left, gating of cDCs (DC, red) and monocyte-derived cells (Ly6C+, blue). Cells were pregated as CD19– CD11c+ MHC-II+ CD11b+. Right, gating of PE+ cells. (J) Quantification of the frequency of PE+ cells among DCs and monocyte-derived cells (Ly6C+) gated as in (I) 1 d after HDM and PE were administered intranasally. Each data point represents an individual cell, pooled from four time-lapse image sequences (A); the average of all cells from one time-lapse image sequence (B, C, and D); or one mouse (E, G, J). Data are from 2 experiments (A–D) or are representative of two experiments (E, F, I, J). Similar results to the primed mice shown in (G) were observed 1 d after OVA challenge, and similar results for CD11c-YFP cells shown in (H) were observed with HDM treatment. *** p<0.001, **** p<0.0001 (t-test). Scale bars, 20 μm.
Figure 8—figure supplement 1
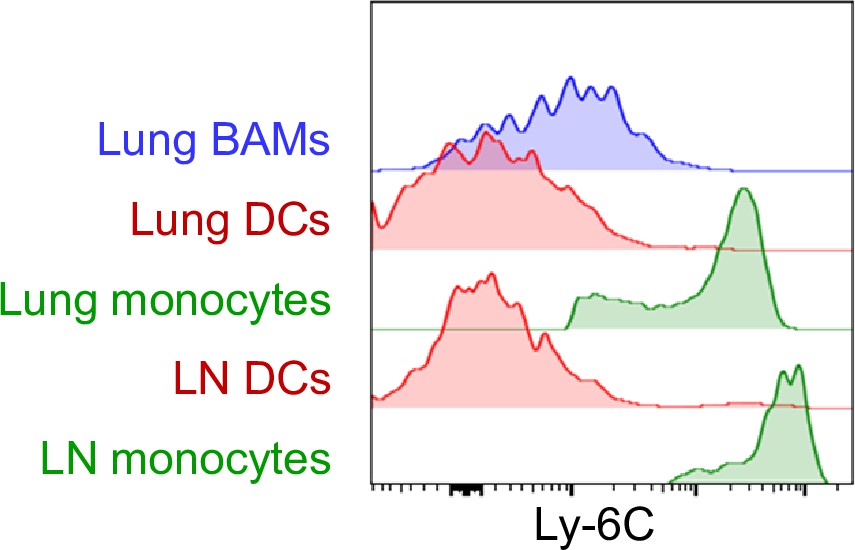
Comparison of Ly-6C surface expression on BAMs, DCs, and monocytes.
Representative flow cytometric analysis, comparing Ly-6C surface expression on DCs (red) and monocytes (green) from the lung and right posterior mediastinal lymph node (LN) as well as lung CD64+ MHC-II+ BAMs (blue). Cells were from naïve mice except LN monocytes, which were analyzed 1 d after HDM was administered intranasally. Data are representative of two experiments.
Videos
Video 1
Collagen-rich region at branchpoint.
The video is a 3D rendering of the image depicted in Figure 1B, showing branching airways and blood vessels (BV) in the lung of a naïve Shh-Cre ROSA26-mTmG mouse. The image was stitched from tiled images collected by two-photon microscopy of a precision-cut thick vibratome section. Bronchial airway and alveolar epithelial cells express membrane-bound GFP (green), whereas all other cells express tdTomato (red). Collagen (blue) was visualized by second harmonic generation.
Video 2
CX3CR1-GFPbright IMs are positioned under the bronchial airway epithelium and are enriched at collagen-rich regions near branchpoints.
The video is a 3D rendering of the image depicted in Figure 1F (left panel), showing branching airways and blood vessels (BV) in the lung of a naïve mouse expressing CX3CR1-GFP (green) to visualize IMs, together with E-cadherin-mCFP (blue) to visualize epithelial cells. Collagen (magenta) was visualized by second harmonic generation. The image was stitched from tiled images collected by two-photon microscopy of a precision-cut thick vibratome section. The video begins by showing the lumen of the airways with opacity rendering and then the image rotates to show CX3CR1-GFPbright IMs positioned underneath the airway epithelium. Finally, a zoomed in view of CX3CR1-GFPbright IMs in the collagen-rich region at the branchpoint is shown.
Video 3
CD11c-YFPbright DCs are positioned near the bronchial airway epithelium and are enriched at collagen-rich regions near branchpoints.
The video is a 3D rendering of the image depicted in Figure 1H (right panel), showing branching airways in the lung of a naïve mouse expressing CD11c-YFP (green) to visualize DCs, together with Shh-Cre and the Ai14 (tdTomato) reporter to show airway and alveolar epithelial cells (blue). Collagen (magenta) was visualized by second harmonic generation. The image was stitched from tiled images collected by two-photon microscopy of a precision-cut thick vibratome section.
Video 4
Antigen-capturing BAMs interact with DCs.
The video is a time-lapse image sequence showing the interactions of CX3CR1-GFPbright BAMs (green) with CD11c-YFPbright DCs (yellow). The BAMs appear to have captured 10 kDa TRITC-dextran (red), which was administered to the mouse by intranasal droplet approximately 2 hr prior to lung isolation. The image sequence is rendered from a 32 μm z-stack collected by two-photon microscopy of a cultured precision-cut vibratome section of the lung. Elapsed time is shown as hh:mm:ss.
Video 5
CD4 T cell interaction with a BAM (example 1).
The video is a time-lapse image sequence corresponding to Figure 6E, showing the interactions of an OVA-specific OT-II CD4 T cell (red) with a CX3CR1-GFPbright BAM (green) in the proximity of CD11c-YFPbright DCs (yellow). The OT-II T cell was visualized by the expression of CD4-Cre and the Ai14 reporter leading to tdTomato expression. The image sequence is rendered from a 15 μm z-stack, collected by two-photon microscopy of a cultured precision-cut vibratome section of the lung isolated 4 hr after intranasal OVA challenge. Elapsed time is shown as hh:mm:ss.
Video 6
CD4 T cell interaction with a BAM (example 2).
The video is a time-lapse image sequence corresponding to Figure 6F, showing the interactions of an OVA-specific OT-II CD4 T cell (red) with a CX3CR1-GFPbright BAM (green) in the proximity of CD11c-YFPbright DCs (yellow). The OT-II T cell was visualized by the expression of a β-actin-CFP transgene. The image sequence is rendered from a 22 μm z-stack, collected by two-photon microscopy of a cultured precision-cut vibratome section of the lung isolated 6 hr after intranasal OVA challenge. Elapsed time is shown as hh:mm:ss.
Video 7
Different motility characteristics of BAMs vs DCs.
The video is a time-lapse image sequence showing the dynamics of CX3CR1-GFPbright BAMs (green) versus CD11c-YFPbright DCs (red) in a collagen-rich region proximal to an airway. Collagen (blue) was visualized by second harmonic generation. The MIP represents a 27 μm z-stack collected by two-photon microscopy of a precision-cut vibratome section of the lung of a naïve mouse. Elapsed time is shown as hh:mm:ss.
Video 8
Some DCs enter lymphatics.
The video is a time-lapse image sequence showing CD11c-YFPbright DCs (green) migrating within a Prox1-tdTomato+ lymphatic vessel (red). One DC can be seen that is entering the lymphatic vessel. Collagen (blue) was visualized by second harmonic generation. The image sequence was rendered from a 58 μm z-stack collected by two-photon microscopy. The mouse was administered intranasal LPS 2 hr before lung isolation, and then various precision-cut thick lung slices were imaged over a period of several hours prior to this recording. Elapsed time is shown as hh:mm:ss.
Video 9
BAMs do not enter lymphatics.
The video is a time-lapse image sequence corresponding to Figure 7H, right panel. CX3CR1-GFPbright BAMs (green) can be observed proximal to a Prox1-tdTomato+ lymphatic vessel (red), but do not enter the lymphatic. Collagen (blue) was visualized by second harmonic generation. The image sequence was rendered from a 32 μm z-stack collected by two-photon microscopy. The mouse was administered intranasal LPS 3.5 hr before lung isolation and then various precision-cut lung slices were imaged over the next few hours prior to this recording. Elapsed time is shown as hh:mm:ss.
Additional files
-
Supplementary file 1
Table of antibodies and reagents used for flow cytometry and microscopy.
- https://cdn.elifesciences.org/articles/63296/elife-63296-supp1-v2.docx
-
Supplementary file 2
Table of emission filters for 2-photon microscopy.
- https://cdn.elifesciences.org/articles/63296/elife-63296-supp2-v2.docx
-
Supplementary file 3
Table of excitation wavelengths for 2-photon microscopy.
- https://cdn.elifesciences.org/articles/63296/elife-63296-supp3-v2.docx
-
Supplementary file 4
Table of exact p values.
- https://cdn.elifesciences.org/articles/63296/elife-63296-supp4-v2.xlsx
-
Transparent reporting form
- https://cdn.elifesciences.org/articles/63296/elife-63296-transrepform1-v2.docx
Download links
A two-part list of links to download the article, or parts of the article, in various formats.
Downloads (link to download the article as PDF)
Open citations (links to open the citations from this article in various online reference manager services)
Cite this article (links to download the citations from this article in formats compatible with various reference manager tools)
Bronchus-associated macrophages efficiently capture and present soluble inhaled antigens and are capable of local Th2 cell activation
eLife 11:e63296.
https://doi.org/10.7554/eLife.63296


