LINE-1 retrotransposons facilitate horizontal gene transfer into poxviruses
- Department of Medial Microbiology and Immunology, School of Medicine, University of California, Davis, United States
- Center for Biodefense and Emerging Infectious Diseases, University of Texas Medical Branch, United States
- Genome Center, University of California, Davis, United States
Figures
Figure 1 with 5 supplements
Detection of experimental horizontal gene transfer (HGT) in vaccinia virus.
(A) VACV lacking E3L and K3L cannot replicate in wild-type RK13 cells, but can replicate in cells stably transfected with mCherry-E3L. Virus that acquired E3L can replicate in wild-type RK13 cells (right). (B) Schematic of the mCherry-E3L vector that was stably transfected into RK13 cells. (C) Schematic of the general genetic architecture of horizontally transferred genes identified in VACV isolates. (D) HGT integration sites in the VACV genome. The VACV genome is represented in blue. Genes highlighted above the genome were described to have likely originated from HGT (Hughes and Friedman, 2005; Bratke and McLysaght, 2008). Features shown below the genome are: integration sites into genes (black boxes, blue lines) or into intergenic regions (red lines). The orientation of the transferred genes is indicated by the arrow, colors of arrows indicate the orientation of mCherry-E3L relative to target genes (blue: same direction; red: opposite direction; black arrow: intergenic). (E) Maps of mCherry-E3L integration sites in HGT1–20. Arrows indicate the direction of transcription for VACV and mCherry-E3L. Intergenic regions are depicted in yellow. The position of an integrated U2 small nuclear RNA and the associated poly(A) tract is shown for HGT20 by dashed lines.
Figure 1—figure supplement 1

Stable expression of mCherry-E3L in RK13 cells.
(A) Map of the expression cassette in the pmCherry-E3L plasmid used to stably transfect RK13 cells. The positions of oligonucleotides used to amplify the parts of the expression cassette are indicated by arrows. (B) Fluorescent micrograph of stably transfected RK13-mCherry-E3L cells. (C) PCR specific for mCherry-E3L did not amplify a product from RK13 cells (lane 1), but amplified comparably sized products from the plasmid pmCherry-E3L (lane 2) and genomic DNA of the RK13-mCherry-E3L cell line (lane 3). A smaller band was amplified from HGT3 DNA due to the spliced-out intron (lane 4). M = molecular weight marker.
-
Figure 1—figure supplement 1—source data 1
PCR for mCherry-E3L.
- https://cdn.elifesciences.org/articles/63327/elife-63327-fig1-figsupp1-data1-v2.pdf
Figure 1—figure supplement 2

Sequences of the pmCherry-E3L plasmid, VACV genomic sequences surrounding the integration sites and the integrated genes in HGT1–20.
The 5′ and 3′ UTR of the mCherry-E3L gene are shown in light green. Dark red indicates the rabbit β-globin intron. A synthetic early/late poxvirus promoter sequence is marked in gray. mCherry is shown in red. E3L is highlighted in yellow. poly(A) tracts are shown in turquoise. VACV genomic sequences surrounding the integration sites in HGT1 through 20 are shown in lower case letters. Blue shades highlight untemplated nucleotides 5′ of the 5′ UTR. Target site duplications at the mCherry-E3L integration sites are indicated in pink. For HGT20, dark green indicates a fragment of a U2 small nuclear RNA encoding sequence. For HGT1–20, sequences from Sanger sequencing of PCR products are shown. Note that the poly(A) tracts were not completely sequenced and might contain sequencing errors due to problems with sequencing of long mononucleotide stretches and possible heterogeneity in the population.
Figure 1—figure supplement 3
Map of pmCherry-E3L.
Insertion start sites and polyadenylation sites of transgenes in horizontal gene transfer (HGT) viruses #1 to #20 are indicated.
Figure 1—figure supplement 4
HGT15 contains one mCherry-E3L copy in each inverted terminal repeat (ITR).
(A) To determine whether mCherry-E3L was present in both ITRs or only in one, primers were designed to span the integration site and the unique region outside of the ITR. (B) Both primer sets yielded larger PCR products for HGT15 than for the parental VC-R2, indicating that mCherry-E3L was present in both ITRs.
-
Figure 1—figure supplement 4—source data 1
PCR with primers spanning the mCherry-E3L integration site in HGT15 in comparison to VC-R2.
- https://cdn.elifesciences.org/articles/63327/elife-63327-fig1-figsupp4-data1-v2.pdf
Figure 1—figure supplement 5
Integration site and composition of the U2-mCherry/E3L fusion in HGT20.
Figure 2

Length distribution and composition of target site duplications (TSDs) surrounding integration sites.
(A) Length distribution of TSDs. (B) WebLogo of the consensus sequence and individual sequences of TSDs. Ten nucleotides 5′ and 3′ of the TSDs, as well as six nucleotides of the TSDs adjacent to the putative first and second long interspersed nuclear element-1 (LINE-1) endonuclease cleavage sites, respectively, are shown.
Figure 3 with 1 supplement
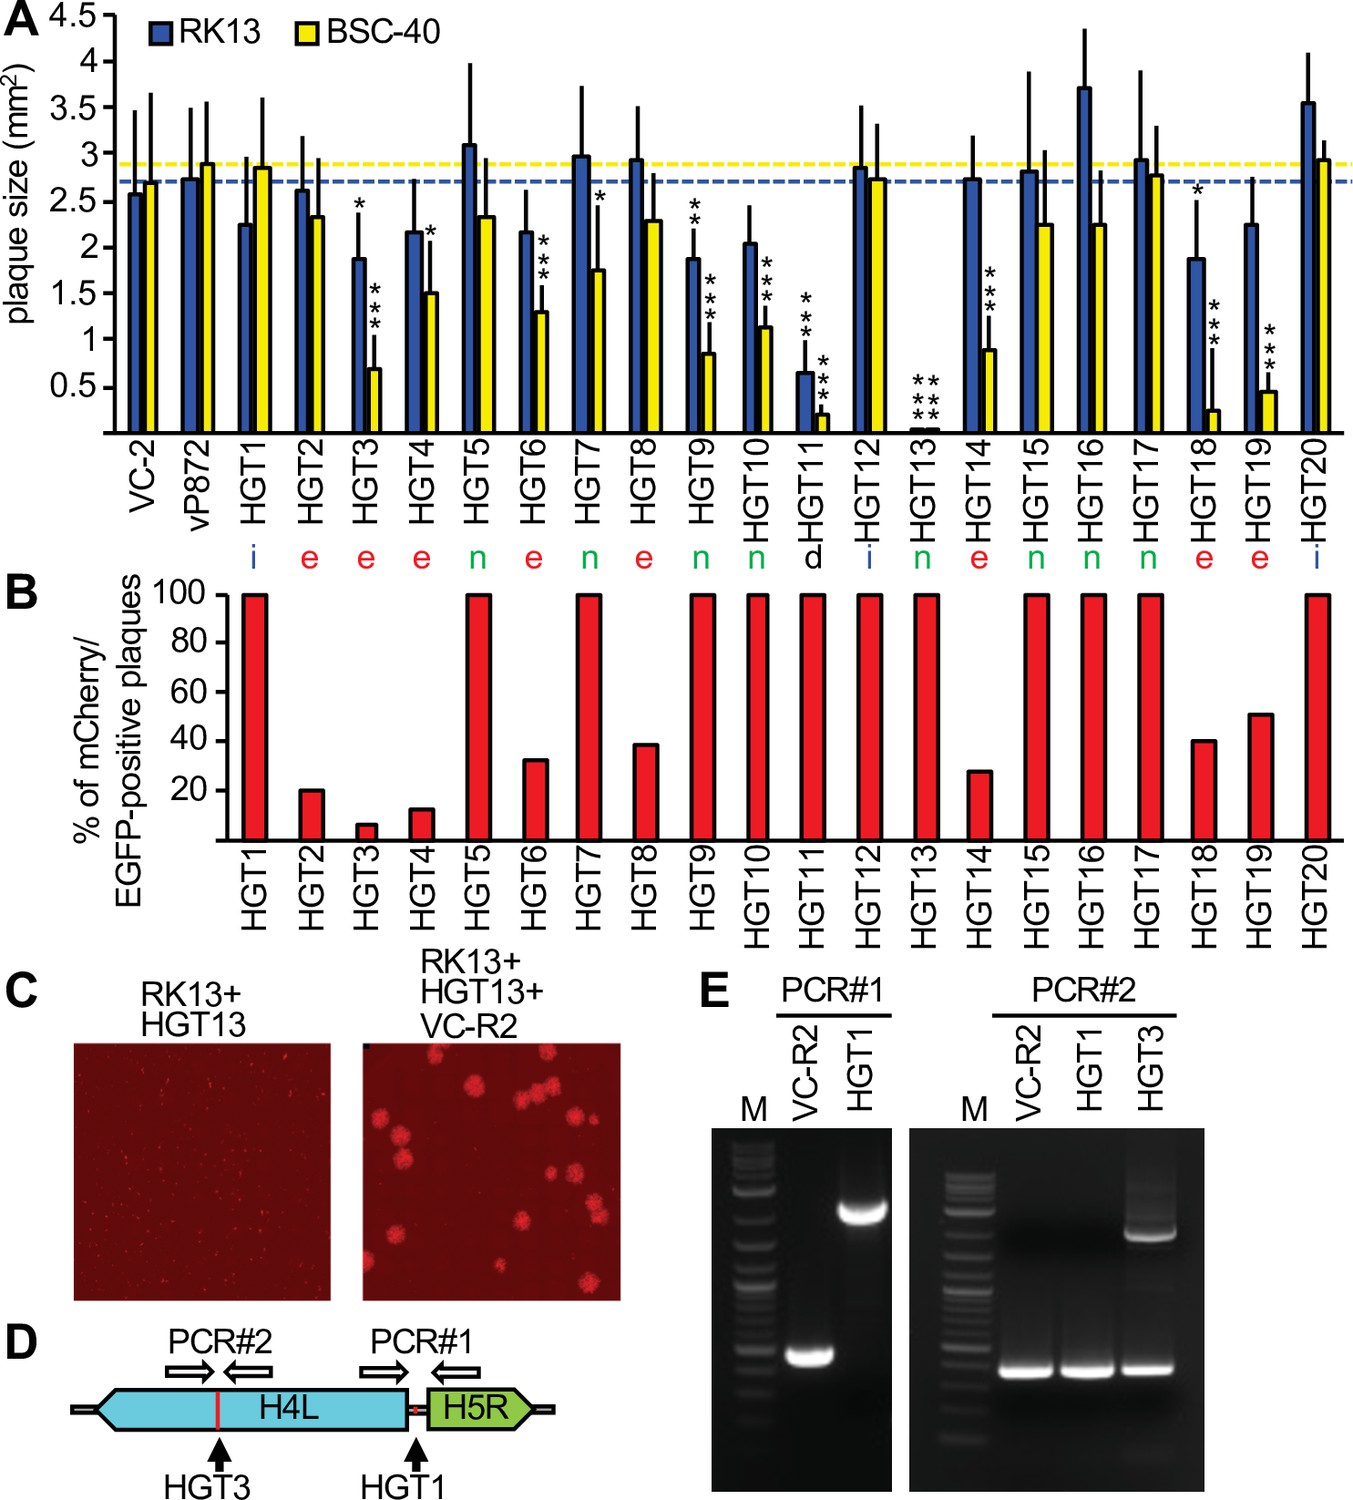
Complementation of viruses after mCherry-E3L integration into essential genes.
(A) Plaque sizes formed by horizontal gene transfer (HGT) virus isolates in RK13 and BSC-40 cells 3 days after infection. Location of integration (intergenic spaces [i], essential [e], nonessential [n], and a deletion [d]) are indicated below each bar. Dotted lines indicate plaque sizes caused by vP872. Between 30 and 387 plaques were measured for each virus (see Figure 3—source data 1 for details). Mean standard deviations and adjusted p-values calculated with Dunn's test of multiple comparisons are indicated. Asterisks denote significant differences between vP872 and HGT isolates (*p < 0.05; **p < 0.005; ***p < 0.0005). (B) Percentage of foci that were mCherry-positive 3 days after infecting RK13 + E3 + K3 cells with the indicated HGT viruses. (C) Complementation of HGT13 by VC-R2. RK13 cells were infected with either HGT13 alone (left) or coinfected with HGT13 and VC-R2 (right). Foci were visualized 3 days after infection at the same magnification. (D) Location of PCR primers for amplifying integration sites in HGT1 and HGT3. (E) PCR amplification for integration site identified for HGT1 (PCR#1, left) and HGT3 (PCR#1, right).
-
Figure 3—source data 1
Plaque size data from RK13 and BSC-40 cells.
- https://cdn.elifesciences.org/articles/63327/elife-63327-fig3-data1-v2.xlsx
-
Figure 3—source data 2
p values of plaque size differences between vP872 and horizontal gene transfer (HGT) isolates in RK13 cells.
- https://cdn.elifesciences.org/articles/63327/elife-63327-fig3-data2-v2.xlsx
-
Figure 3—source data 3
p values of plaque size differences between vP872 and horizontal gene transfer (HGT) isolates in BSC-40 cells.
- https://cdn.elifesciences.org/articles/63327/elife-63327-fig3-data3-v2.xlsx
-
Figure 3—source data 4
Number of plaques expressing either mCherry and EGFP, or only EGFP.
- https://cdn.elifesciences.org/articles/63327/elife-63327-fig3-data4-v2.xlsx
-
Figure 3—source data 5
PCR amplification for integration site identified for HGT1 (PCR#1, left) and HGT3 (PCR#1, right).
- https://cdn.elifesciences.org/articles/63327/elife-63327-fig3-data5-v2.pdf
Figure 3—figure supplement 1
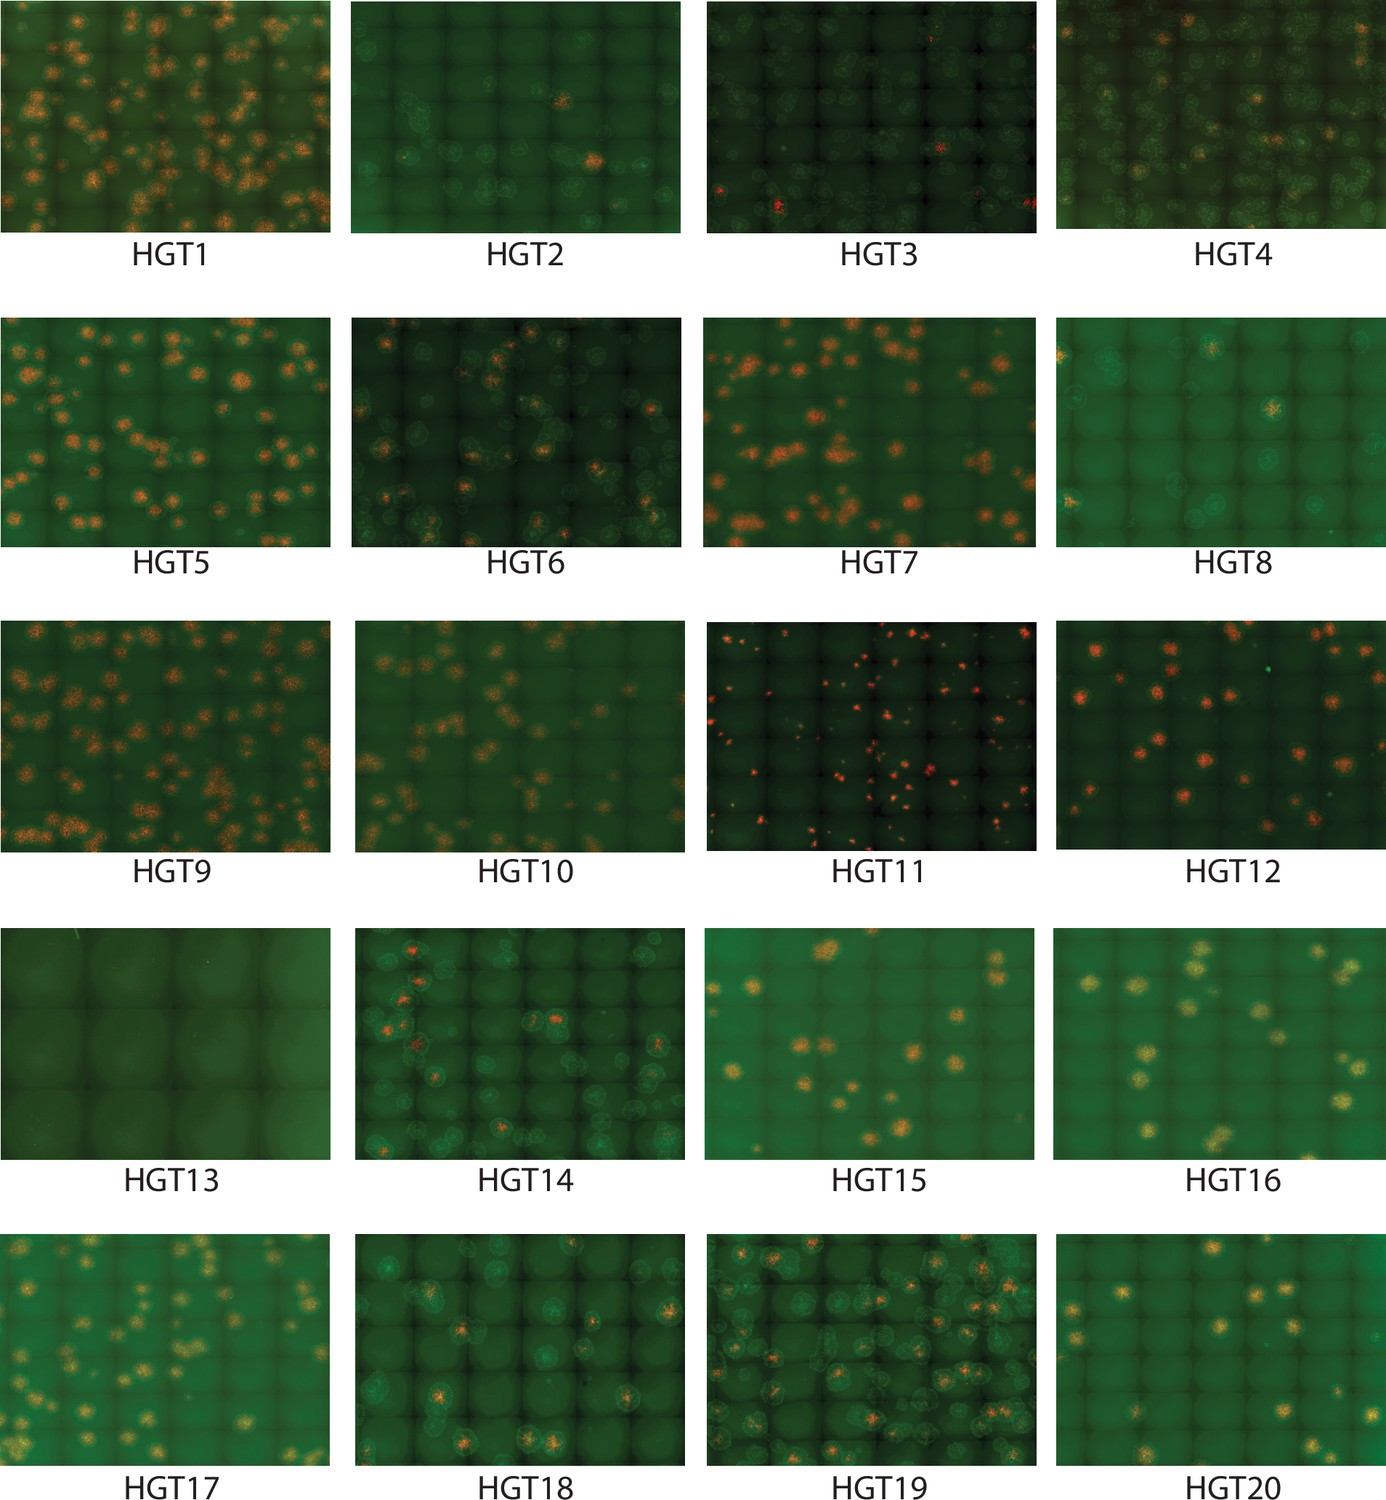
mCherry- and/or EGFP-positive foci formed by HGT1–20 on RK13 + E3 + K3 cells.
VC-R2 permissive RK13 + E3 + K3 cells were infected with plaque-purified horizontal gene transfer (HGT) virus isolates at 100 pfu/well. 48 hr after infection, red and green fluorescent images were taken and overlayed in FiJi.
Figure 4
Fitness increase of HGT3 after serial passaging.
(A) The percentage of mCherry-positive foci formed on RK13 + E3 + K3 cells by three serially passaged replicates of HGT3. Percentages were determined for the indicated passages (P). (B) Increase in double-positive mCherry and EGFP expressing foci of replicate 3 during serial passaging. (C) RK13 and (D) BSC-40 cells were infected with serially passaged HGT3 in duplicate (multiplicity of infection [MOI] = 0.01) for 48 hr and viruses were titered on RK13 + E3 + K3 cells. Error bars indicate standard deviations.
-
Figure 4—source data 1
Number of plaques expressing either mCherry and EGFP, or only EGFP after serial passaging.
- https://cdn.elifesciences.org/articles/63327/elife-63327-fig4-data1-v2.xlsx
-
Figure 4—source data 2
Titers of passaged virus populations in RK13 cells.
- https://cdn.elifesciences.org/articles/63327/elife-63327-fig4-data2-v2.xlsx
-
Figure 4—source data 3
Titers of passaged virus populations in BSC-40 cells.
- https://cdn.elifesciences.org/articles/63327/elife-63327-fig4-data3-v2.xlsx
Figure 5 with 1 supplement
Recombination of complementing viruses after serial passaging.
(A) PCR strategy to detect gene arrays with outward-facing primers. (B) Representative PCR products amplified with outward-facing primers for VC-R2 and three independent HGT3 passages. (C) Recombination of complementing viruses resulted in tandem arrays of the H4L locus as determined by long-read sequencing.
-
Figure 5—source data 1
PCR products amplified with outward-facing primers for VC-R2 and three independent HGT3 passages.
- https://cdn.elifesciences.org/articles/63327/elife-63327-fig5-data1-v2.pdf
Figure 5—figure supplement 1
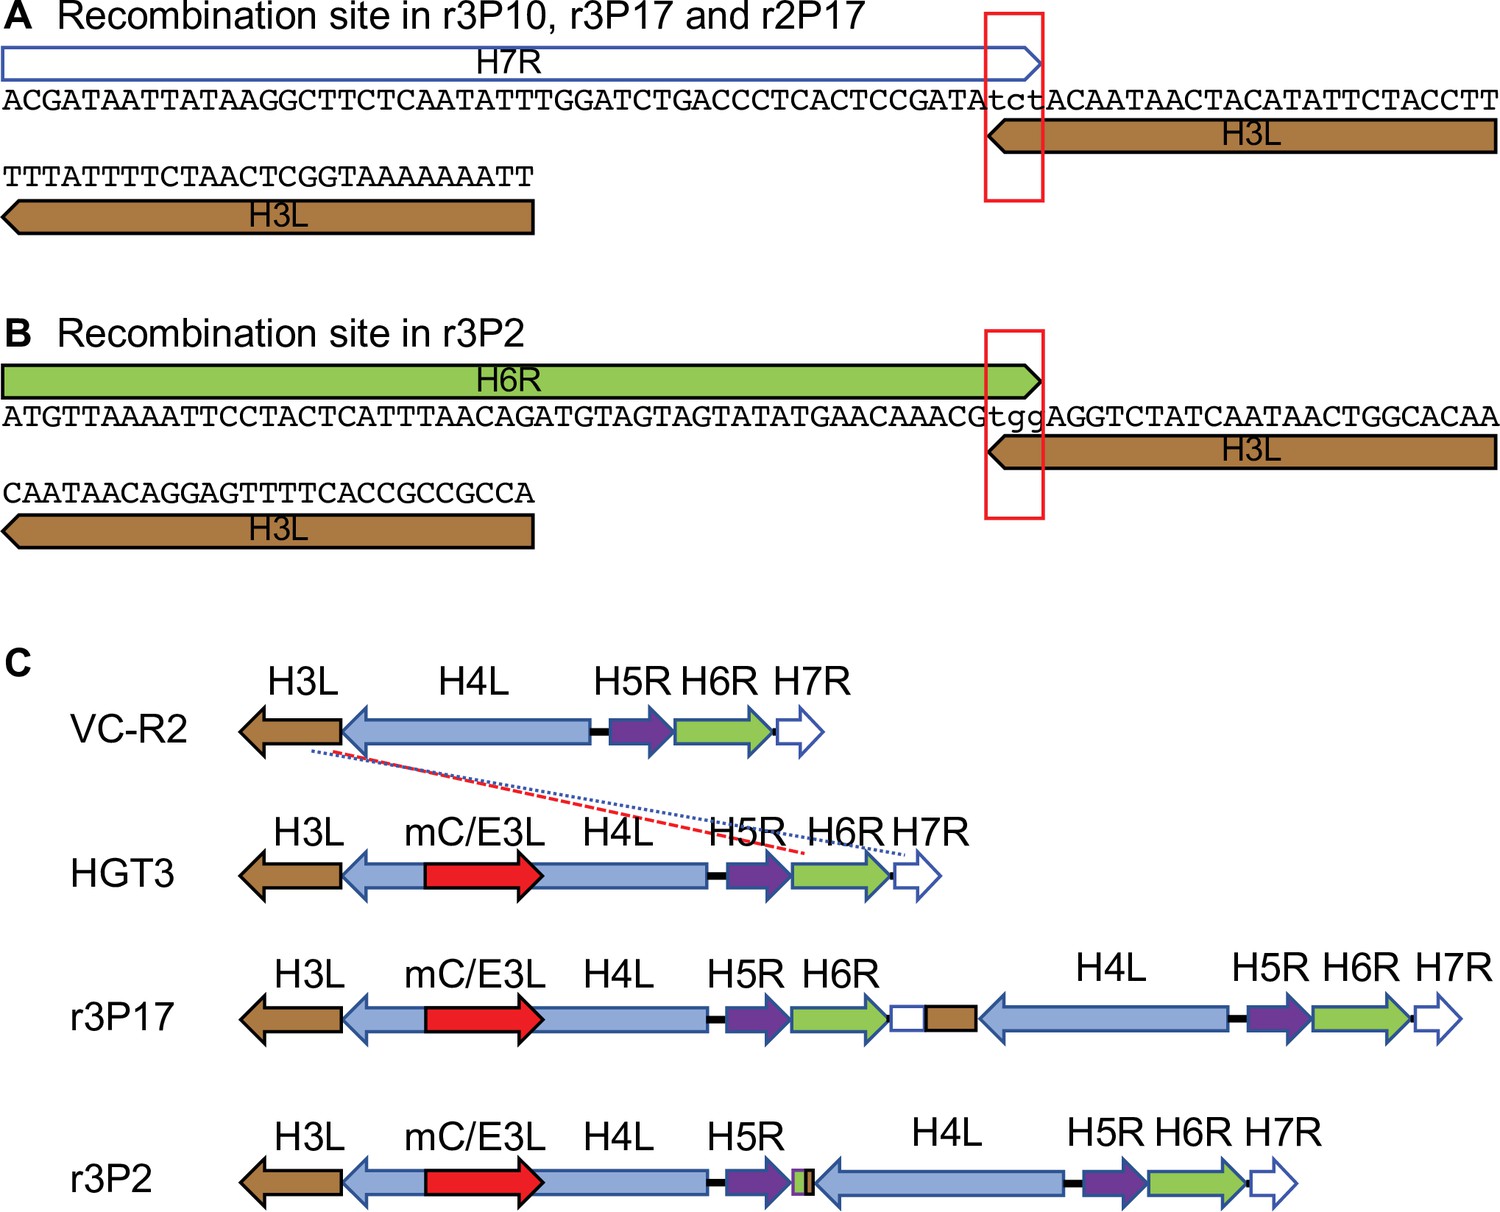
Recombination sites in passaged HGT3.
(A) Recombination site in HGT3 between H7R and H3L identified in passage 10 of replicate 3 and passage 17 of replicate 2 by PCR and Sanger sequencing, as well as in passage 17 of replicate 3 by PacBio sequencing. The red rectangle shows three shared nucleotides between the genes at the breakpoint. (B) Recombination site in HGT3 between H6R and H3L identified in passage 2 of replicate 3 by PCR and Sanger sequencing. The red rectangle shows three shared nucleotides between the genes at the breakpoint. (C) Schematic representation of recombined loci in parental VC-R2 and HGT3, and recombined loci in r3P17 (blue dotted line) and r3P2 (red dashed line).
Figure 6
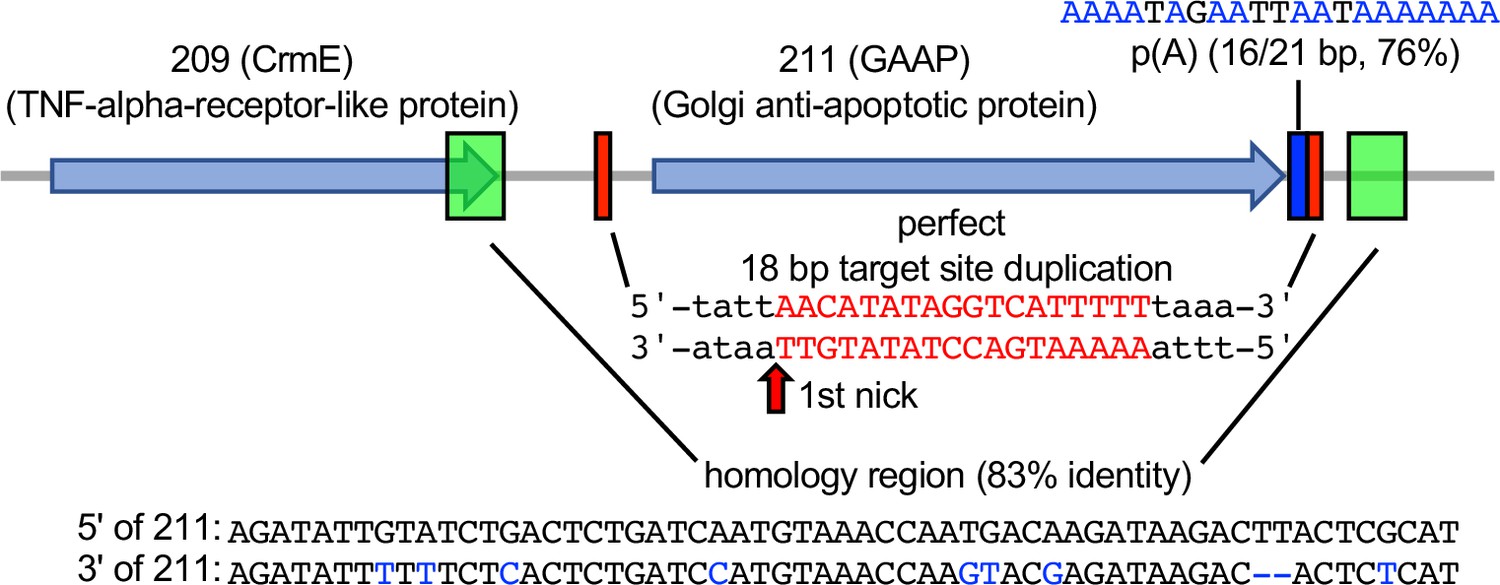
Signatures of retrotransposon-mediated horizontal gene transfer (HGT) adjacent to cowpox virus gene 211.
The 211 gene encodes Golgi anti-apoptotic protein (GAAP). Red boxes mark a perfect 18-bp putative target site duplication (TSD). p(A) indicates a polyadenylate stretch (16/21 bp) adjacent to the TSD. Green boxes show a duplicated 59 bp stretch with 83% sequence identity (homology region).
Figure 7
Cascade virus evolution after horizontal gene transfer into an essential gene.
After retrotransposon-mediated horizontal gene integration into an essential locus (1) the virus initially depends on a helper virus to complement the essential gene (2), which is followed by recombination and results in a single virus with increased fitness.
Tables
Table 1
Integration sites of mCherry-E3L in horizontal gene transfer (HGT) viruses and importance of disrupted genes for virus replication.
| Isolate # | Integration site | Essential vs. nonessential |
|---|---|---|
| HGT1 | Intergenic between H4L and H5R | Presumably nonessential |
| HGT2 | I8R | Essential (Gross and Shuman, 1996) |
| HGT3 | H4L | Essential (Kane and Shuman, 1992) |
| HGT4 | G1L | Essential (Hedengren-Olcott et al., 2004) |
| HGT5 | I4L | Nonessential (Child et al., 1990; Gammon et al., 2010) |
| HGT6 | D1R | Essential (Hassett et al., 1997) |
| HGT7 | A40R | Nonessential (Wilcock et al., 1999) |
| HGT8 | A9L | Essential (Yeh et al., 2000) |
| HGT9 and HGT10 | D9R | Nonessential (Parrish and Moss, 2006) |
| HGT11 | B4R | Nonessential (Burles et al., 2014) |
| HGT12 | Intergenic between A49R and A50R | Presumably nonessential |
| HGT13 | F13L | Nonessential (Blasco and Moss, 1991) |
| HGT14 | H4L | Essential (Kane and Shuman, 1992) |
| HGT15 | C19L/B25R | Nonessential (Perkus et al., 1991) |
| HGT16 | A26L | Nonessential (Howard et al., 2008; Chang et al., 2019) |
| HGT17 | G6R | Nonessential (Senkevich et al., 2008) |
| HGT18 | D6R | Essential (Broyles and Fesler, 1990) |
| HGT19 | D11L | Essential (Seto et al., 1987) |
| HGT20 | Intergenic between N2L and M1L | Presumably nonessential |
Additional files
-
Supplementary file 1
Target site duplications identified in horizontal gene transfer (HGT) viruses.
- https://cdn.elifesciences.org/articles/63327/elife-63327-supp1-v2.docx
-
Supplementary file 2
Oligonucleotides used to amplify the integration sites of mCherry-E3L in horizontal gene transfer (HGT) viruses.
- https://cdn.elifesciences.org/articles/63327/elife-63327-supp2-v2.docx
-
Transparent reporting form
- https://cdn.elifesciences.org/articles/63327/elife-63327-transrepform1-v2.docx
Download links
A two-part list of links to download the article, or parts of the article, in various formats.
Downloads (link to download the article as PDF)
Open citations (links to open the citations from this article in various online reference manager services)
Cite this article (links to download the citations from this article in formats compatible with various reference manager tools)
LINE-1 retrotransposons facilitate horizontal gene transfer into poxviruses
eLife 11:e63327.
https://doi.org/10.7554/eLife.63327


