Coherent theta activity in the medial and orbital frontal cortices encodes reward value
- Department of Neuroscience, American University, United States
Figures
Figure 1 with 1 supplement
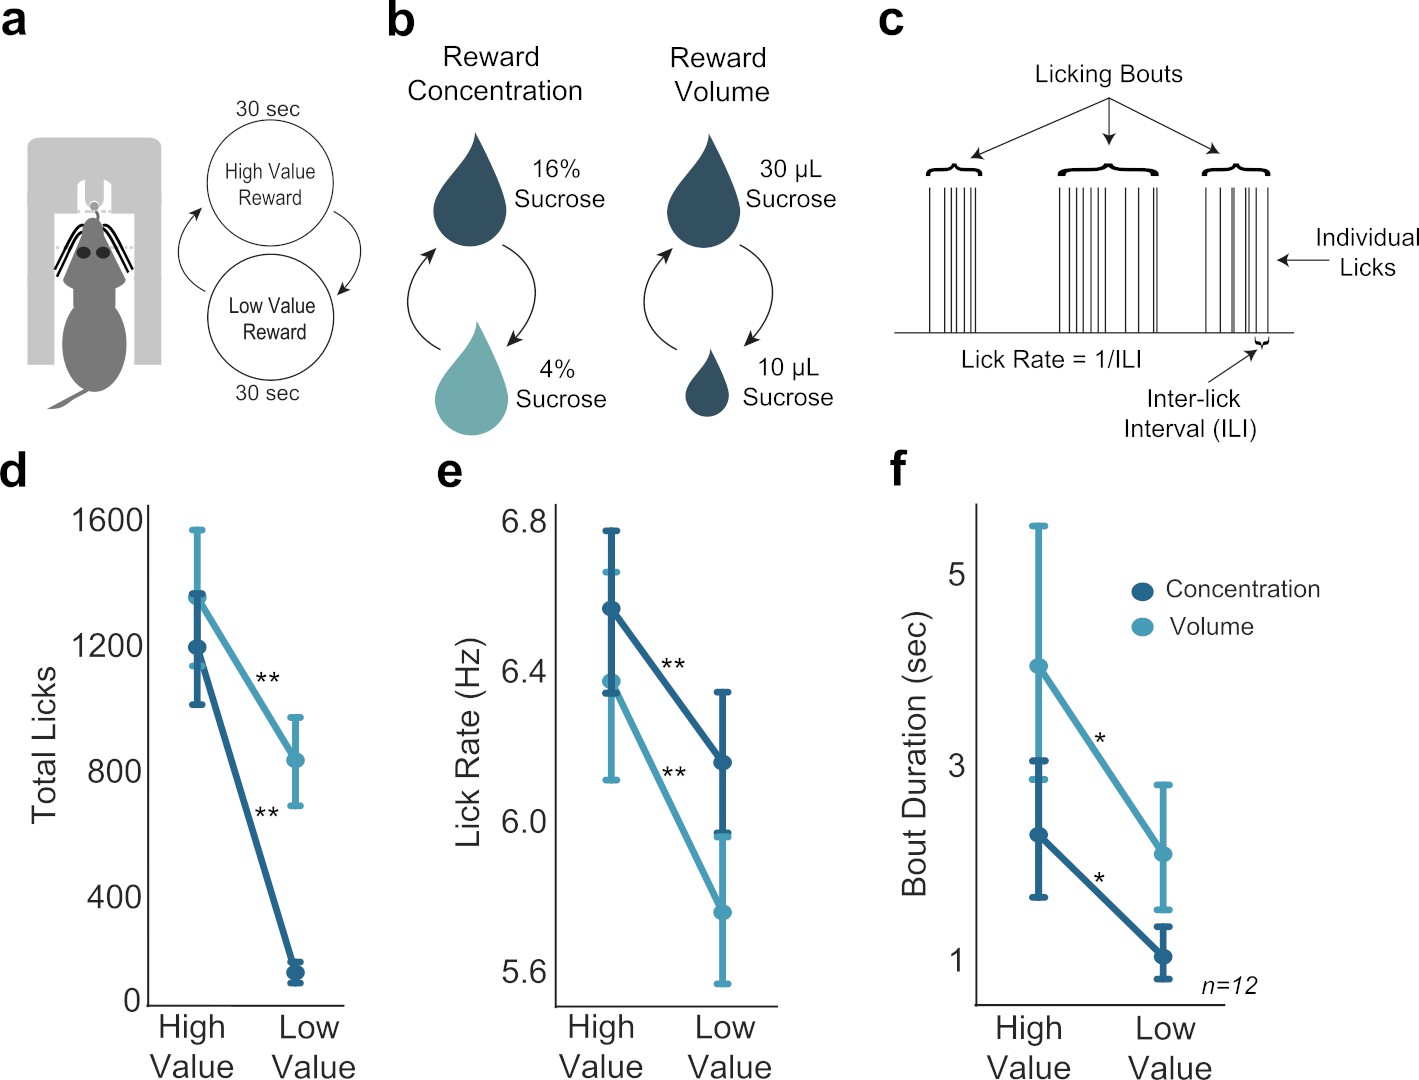
Consummatory behavior tracked shifts in sucrose concentration and fluid volume.
(a) In the shifting values licking task, rats received access to one of two values of reward, with rewards alternating every 30 s. (b) Manipulation of reward value by changing either concentration or volume. (c) Types of behavioral licking measurements recorded in all licking tasks. (d,e,f) Rats licked more (d), faster (e), and over longer bouts (f) for the high concentration and large volume rewards. Single asterisk (*) denotes p < 0.05; double asterisk (**) denotes p < 0.001. Error bars represent 95% confidence intervals.
Figure 1—figure supplement 1

Electrode localization.
Locations of all electrodes plotted in the horizontal plane. (a) Medial frontal cortex (MFC) (n = 10 rats; 160 electrodes) electrode arrays were localized around area 32 (A32D) and M2 (FrA) from 1 to 3 mm ventral from the brain’s surface. (b) Orbital frontal cortex (OFC) (n = 6 rats; 96 electrodes) electrode arrays were localized around agranular insular (AI) and lateral orbital (LO) areas of OFC from 4.7 to 5.1 mm ventral from the brain’s surface. Reconstructions were plotted over atlas figures from Paxinos and Watson’s The Rat Brain in Stereotaxic Coordinates, 7th edition (2013).
Figure 2
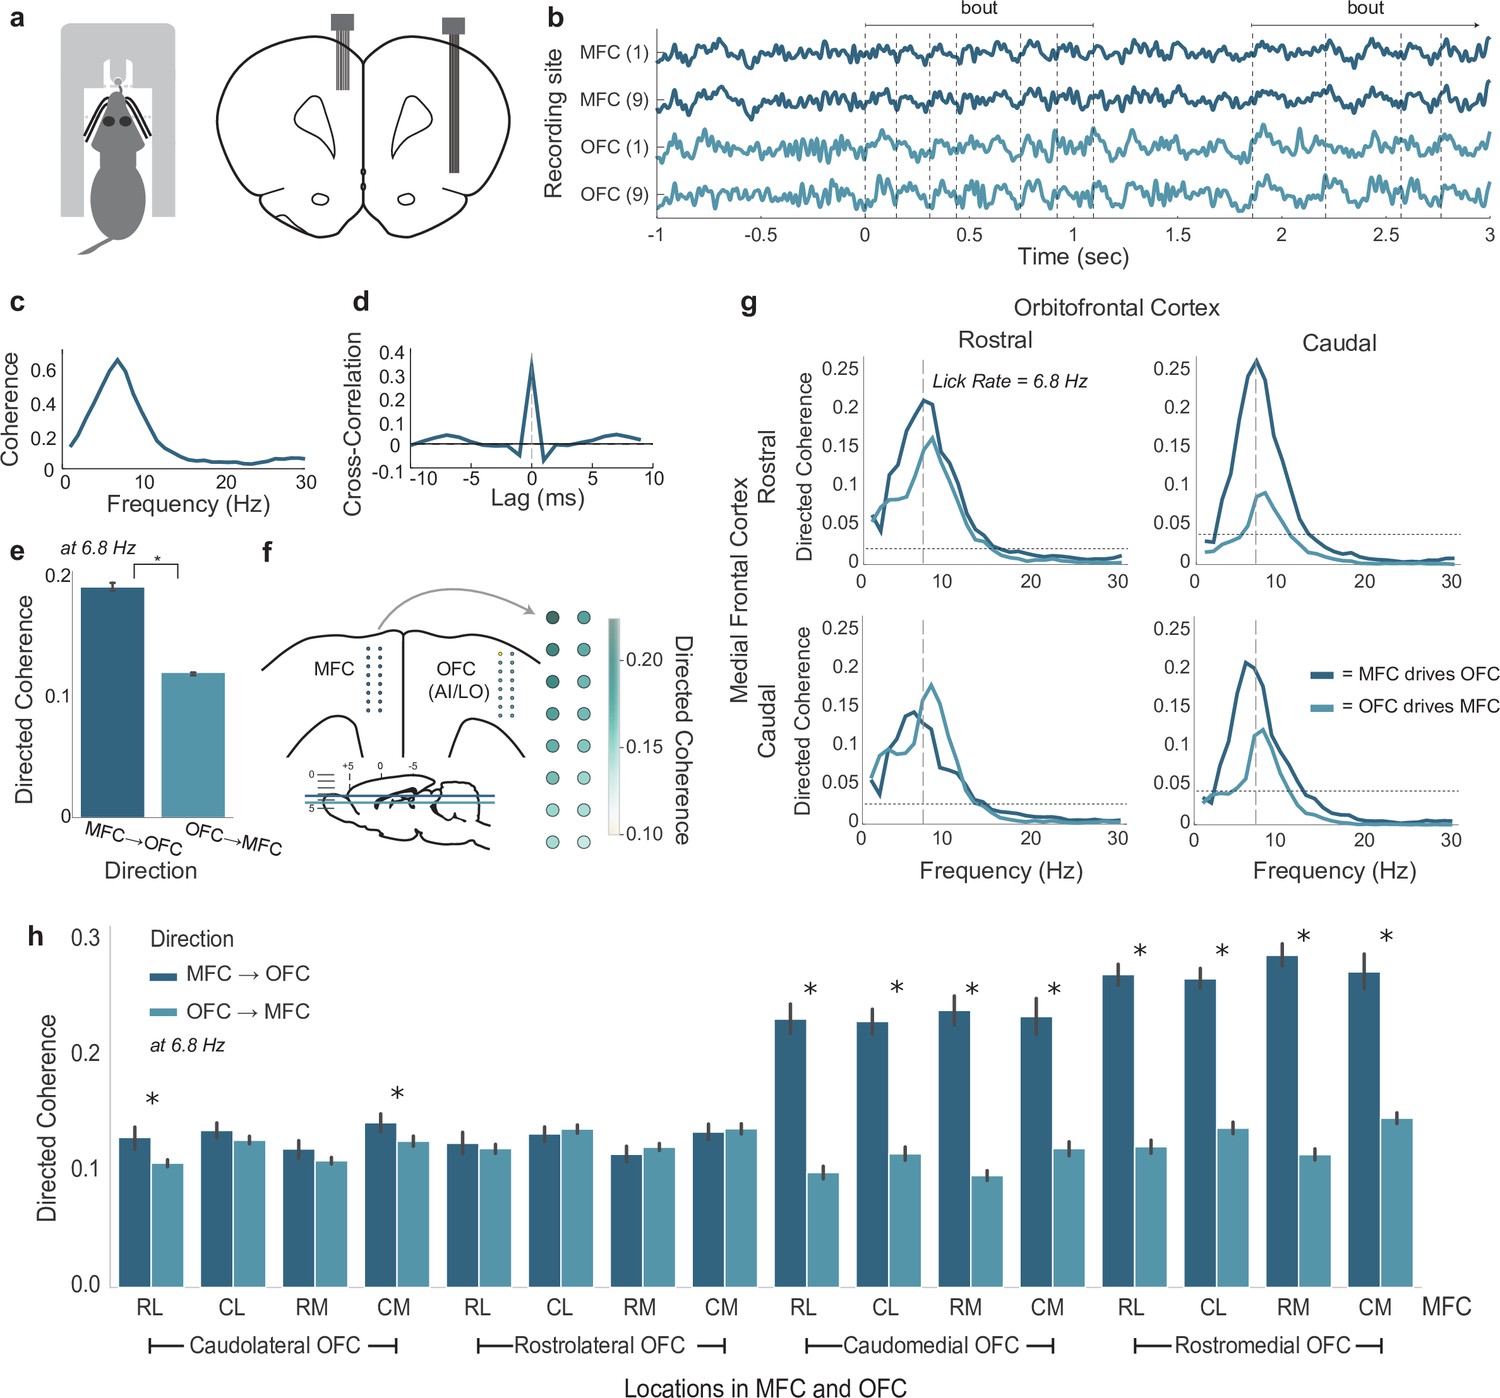
Coherent licking-related theta-band activity in the medial frontal (MFC) and orbital frontal (OFC) cortices.
(a) Depiction of rat performing the shifting values licking task (left) and placement of recording arrays in the MFC and lateral frontal cortex (right). (b) Traces of simultaneous local field potential (LFP) recordings from rostral (1) and caudal (9) recording sites on arrays implanted in MFC and OFC. Two licking bouts are noted and the times of licks are shown as dashed vertical lines. (c) Standard (non-directional) coherence between a pair of LFPs from MFC and OFC showed a peak near the licking frequency (~7 Hz). (d) Cross-correlation (time domain) showed a central peak with lag near 0 ms. (e) Directed coherence at the licking frequency for MFC→OFC and OFC→MFC over all pairs of LFPs recorded in four rats. Asterisk denotes p < 10–6 for effect of direction on coherence. (f) Anatomical map of directed coherence values over one of the arrays. (g) Directed coherence over frequencies up to 30 Hz, plotted for rostral and caudal sites in the MFC and OFC (panel b). (h) Group summary of directed coherence over all pairs of recordings. Asterisks (*) denotes p < 0.05. Error bars represent 95% confidence intervals.
Figure 3
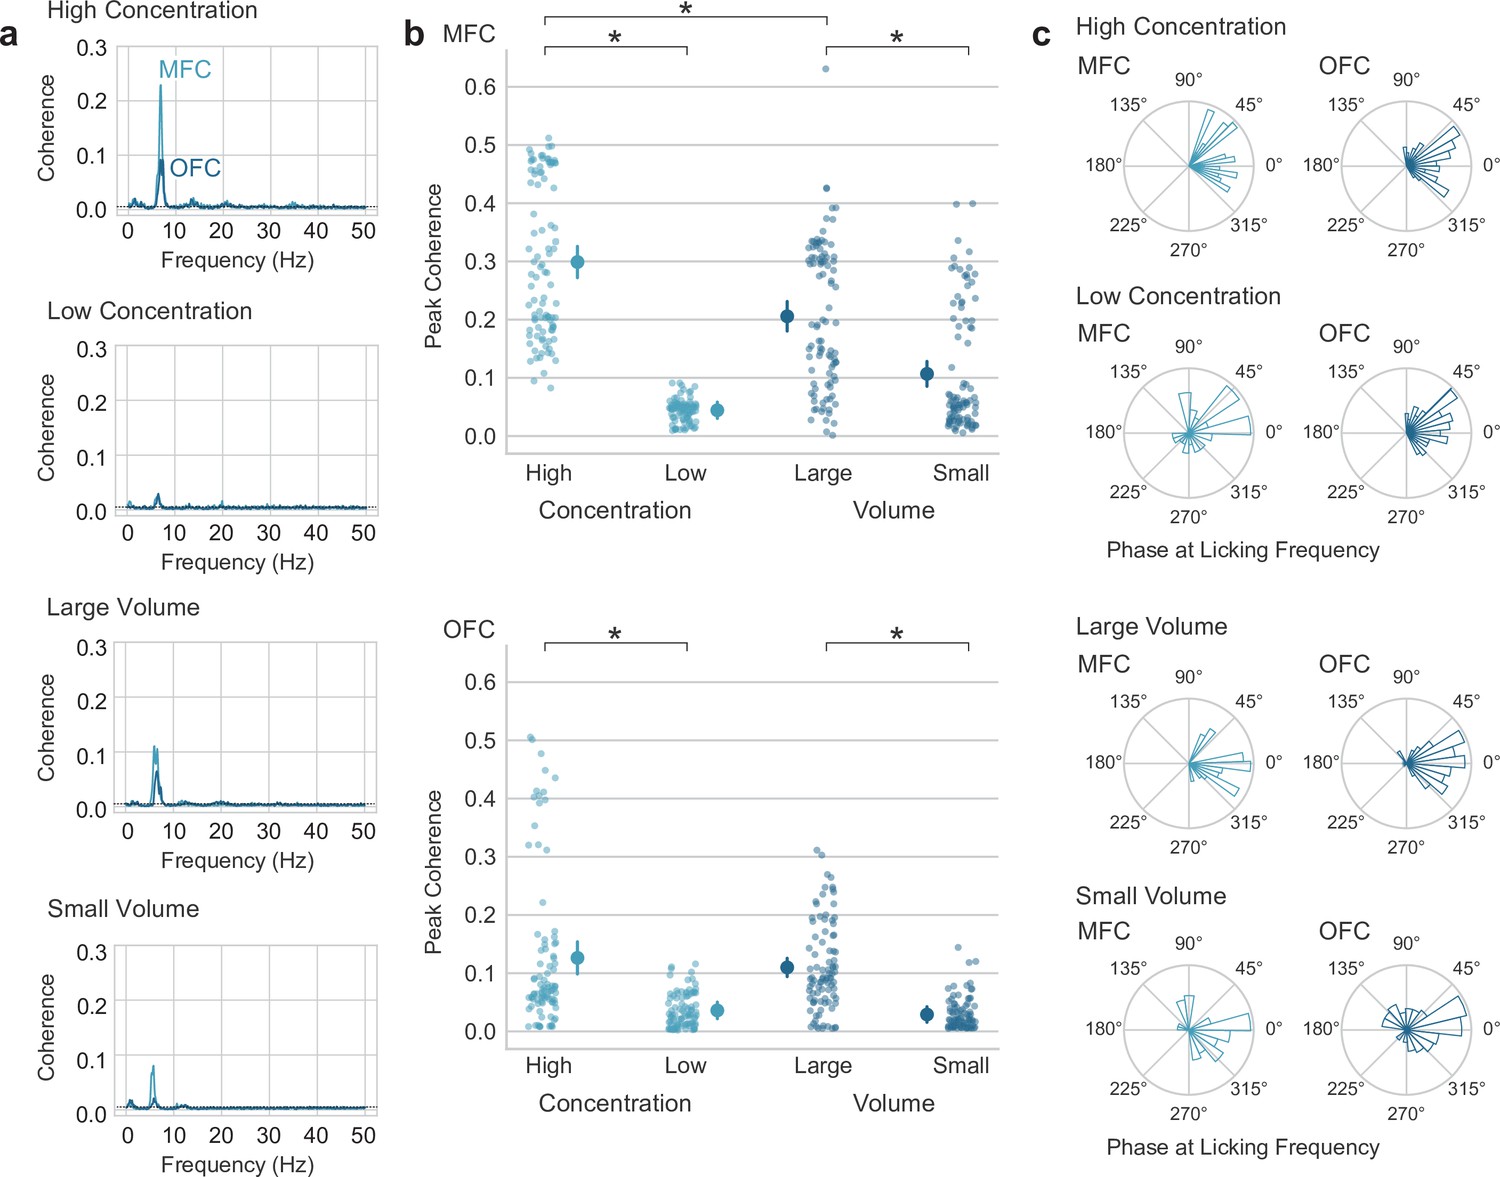
Lick entrainment in the medial frontal (MFC) and orbital frontal (OFC) cortices is sensitive to reward value.
(a) Average lick-field coherence for local field potentials (LFPs) in MFC and OFC and licks for high and low concentration sucrose solutions and large and small fluid volumes. (b) Peak coherence in the range of theta (4–12 Hz) for LFPs from MFC and OFC and licks for high and low concentration sucrose solutions and large and small fluid volumes. Asterisks (*) denotes p < 0.05. Error bars represent 95% confidence intervals. (c) Phase angles of LFPs at the licking frequency. Most LFPs were coherent with licks at phases between 45 and 315 degrees.
Figure 4 with 1 supplement
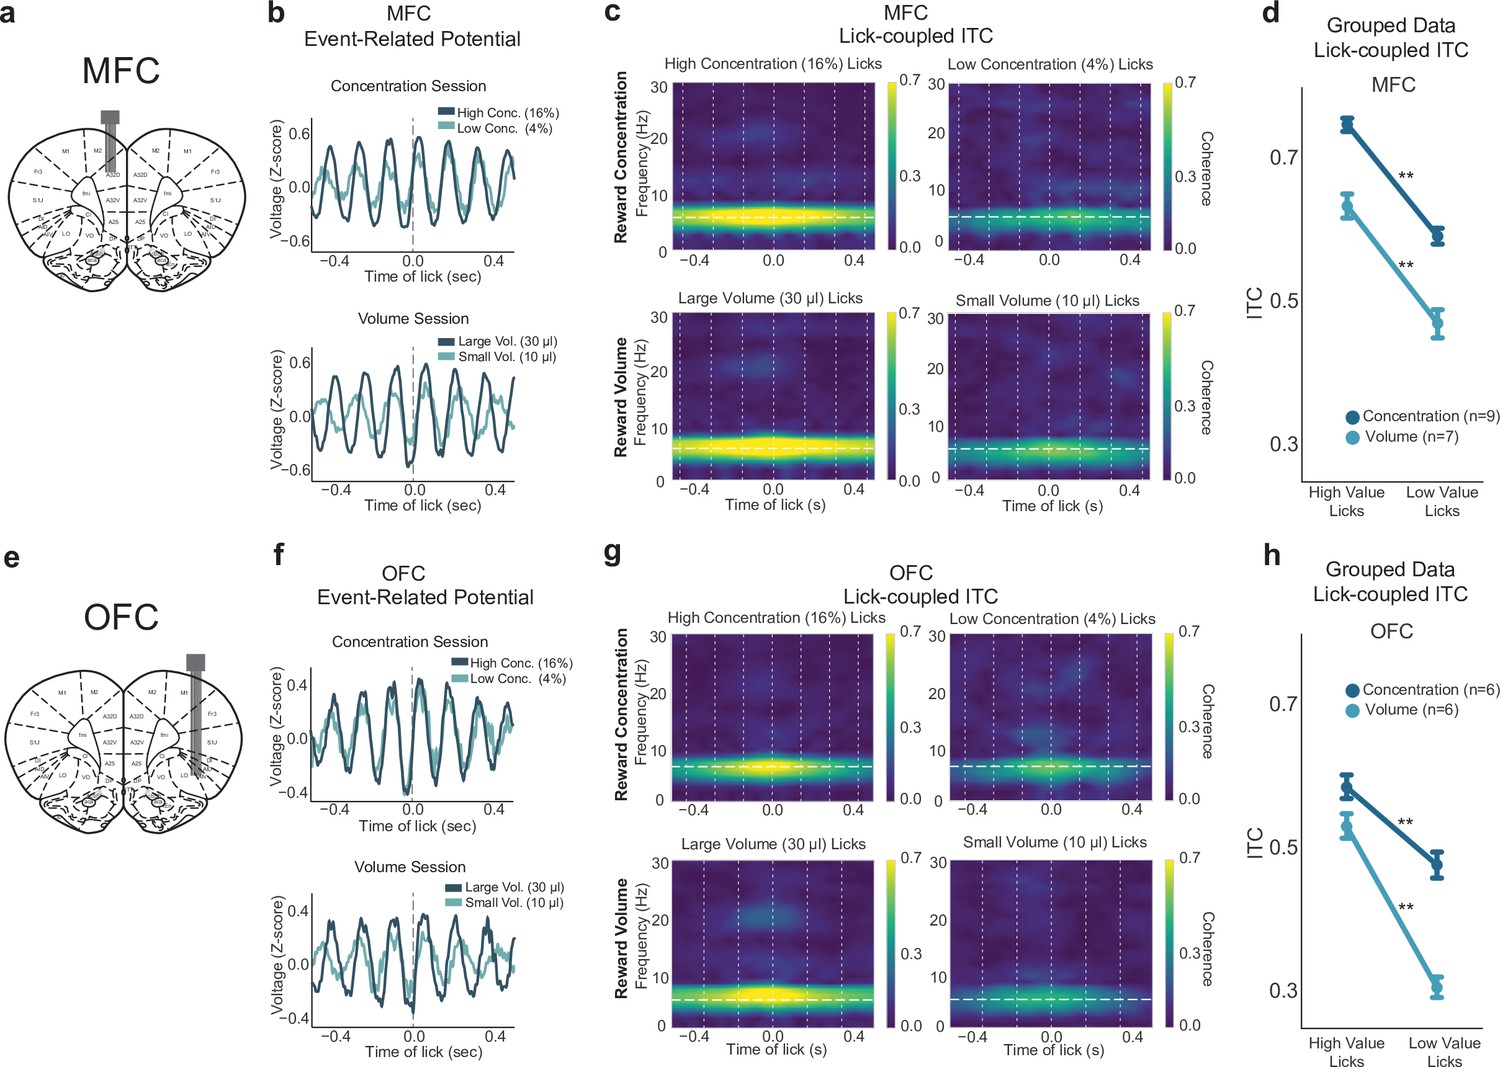
Lick-entrained neural activity in medial frontal cortex (MFC) and orbital frontal cortex (OFC) tracked shifts in sucrose concentration and fluid volume.
(a,e) Rats were implanted with a 2 × 8 electrode array in either MFC (a) or OFC (e); representative coronal sections are shown. (b,f) Event-related potentials during concentration and volume manipulation sessions in the shifting values licking task for MFC (b) and OFC (f). (c,g) Spectral inter-trial coherence (ITC) time-frequency plots revealed strong phase locking during licks for the high concentration and large volume (left sides) rewards in both MFC (c) and OFC (g). Plots are from one electrode from one individual animal. ITC is consistently strongest around 4–8 Hz. (d,h) Grouped data from all rats in both concentration and volume sessions in MFC (d) and OFC (h) showed strongest ITC during licks for the high-value reward. Double asterisk (**) denotes p < 0.001. Error bars represent 95% confidence intervals.
Figure 4—figure supplement 1

Electrophysiological measures used to assess local field potential (LFP) activity.
(a) Event-related potentials (ERPs) were recorded around licks (time 0) after LFP activity was filtered and z-scored. Peak-to-peak analysis was performed on the ERP centered around each lick with a +1 inter-lick interval (ILI) window to calculate the amplitude size (red limits = maximum minus the minimum amplitude of the ERP). (b,c) Spectral measures of power (b) and phase (c). Grouped statistics were based on the mean maximum event-related spectral power (ERSP) and inter-trial phase coherence (ITC) value from 2 to 12 Hz and around +1 ILI (gray window). Vertical lines denote the rat’s average ILIs. Horizontal line denotes the rat’s median lick rate. (d) Maximum ITC values over frequencies from 0 to 100 Hz from all 16 MFC electrodes from one example rat. (e) Maximum ERSP measures over frequencies from 0 to 100 Hz in all 16 MFC electrodes from one example rat.
Figure 5 with 1 supplement
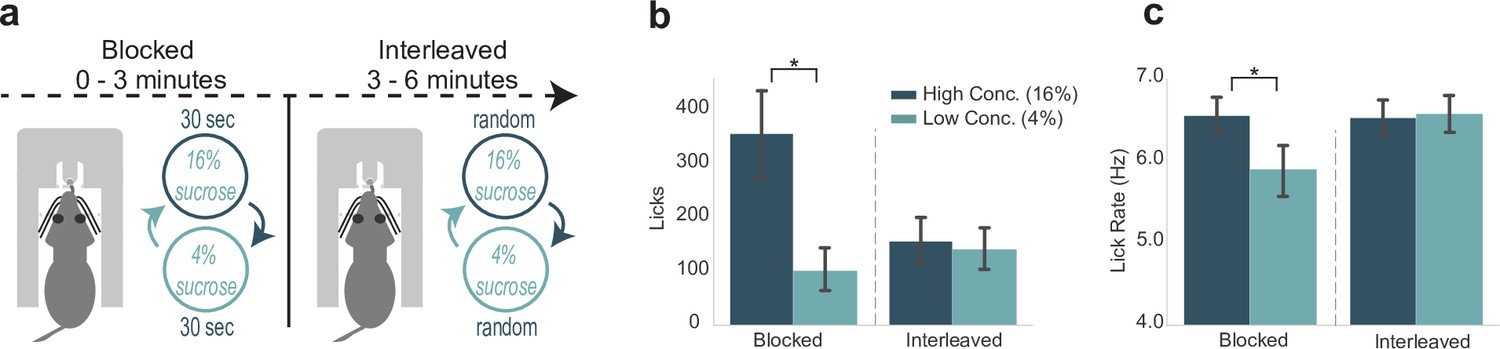
Engagement in and the vigor of licking varied with reward expectation.
(a) Rats participated in a modification of the shifting values licking task, called the blocked-interleaved task, in which they received alternating access to high and low concentrations of liquid sucrose for 3 min and then received interleaved (and thus unpredictable) presentations of the two levels of sucrose for the rest of the session. (b) Total licks emitted, a measure of task engagement, for both high and low concentration rewards during the blocked and interleaved portion of the task. Rats licked less for both rewards when rewards were randomly interleaved. (c) Lick rate, a measure of response vigor, was similar for both rewards in the interleaved, but not blocked, portion of the task. Asterisk denotes p < 0.05. Error bars represent 95% confidence intervals.
Figure 5—figure supplement 1
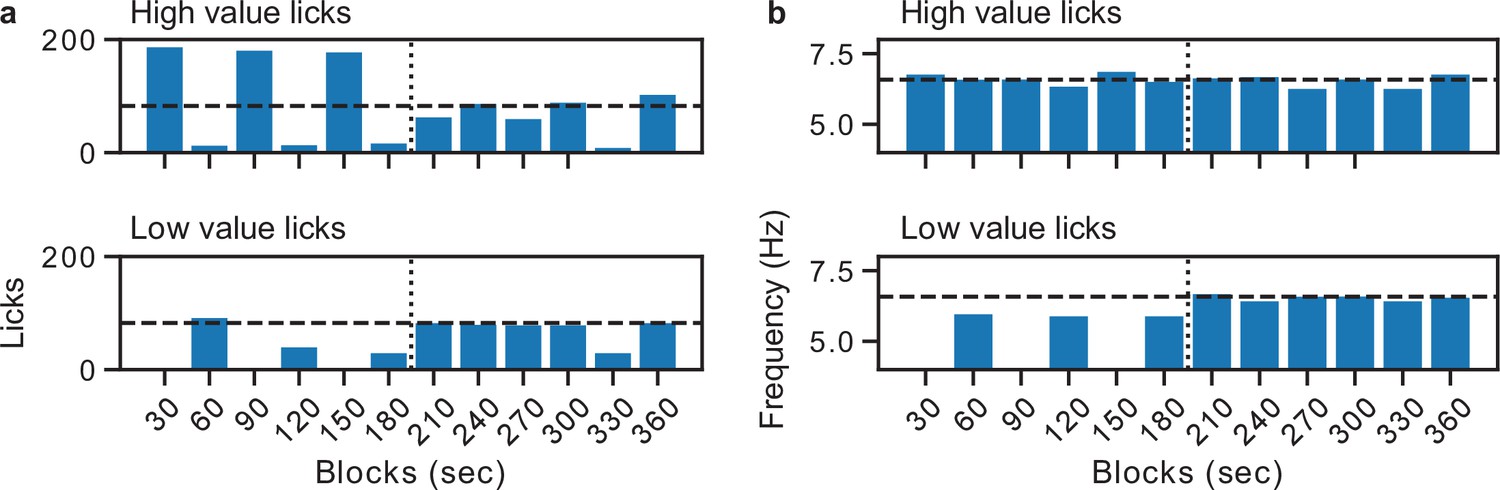
Transitions in licking behavior in the blocked-interleaved experiment.
Sessions were split into sequential 30 s windows and the various measures of licking behavior were plotted. An example from one of the rats is shown here. The plots in panel a depict high- and low-value licks per block, and the dashed line is the mean number of high-value licks over all blocks. The plots in panel b show licking frequency for the high- and low-value fluids, and the dashed line is the median licking rate for the high-value fluid over all blocks. There was a clear breakpoint in licks emitted and the licking frequency at the transition from blocked to interleaved presentations of the rewards (vertical dashed line). Licking frequency was lower when rats licked for the lower value fluid when it was presented in the blocked part of the test sessions, and then increased to the same frequency as when they licked for the higher value fluid in the interleaved part of the test sessions. Total licks were higher for the higher value fluid when it was presented in blocks compared to the interleaved part of the session. Licks for the lower value fluid increased starting from the onset of the interleaved part of the session.
Figure 6
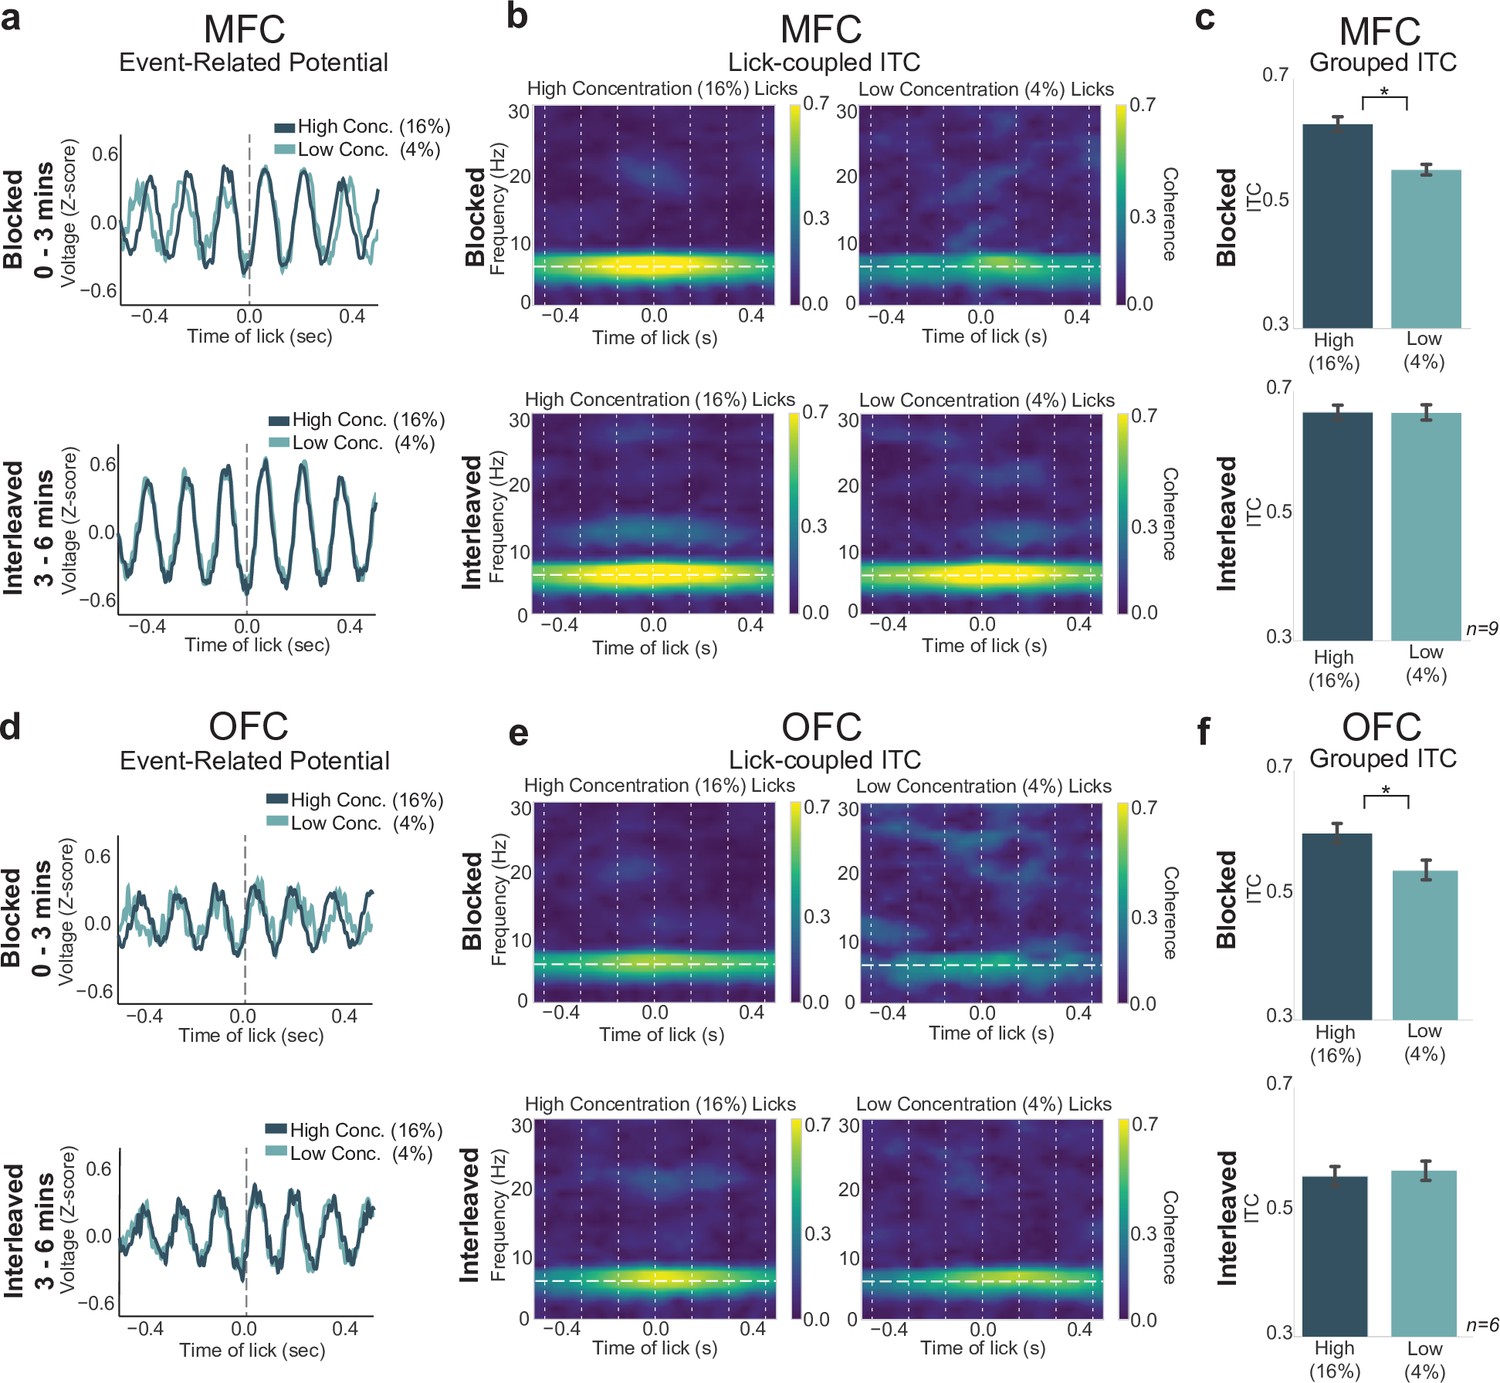
Lick-entrained neural activity varied with reward expectation.
(a,d) Event-related potentials (ERPs) for licks of both rewards in medial frontal cortex (MFC) (a) and orbital frontal cortex (OFC) (d) remain unchanged during the interleaved portion of the task. (b,e) Spectral inter-trial coherence (ITC) plots revealed stronger 4–8 Hz phase locking during licks for the high concentration reward in the blocked portion (top), but phase locking during licks for high and low concentration rewards in the interleaved portion were indistinguishable from each other. (c,f) Grouped data revealed no difference in ITC values during high or low concentration licks in the interleaved phase. Asterisk denotes p < 0.05. Error bars represent 95% confidence intervals.
Figure 7
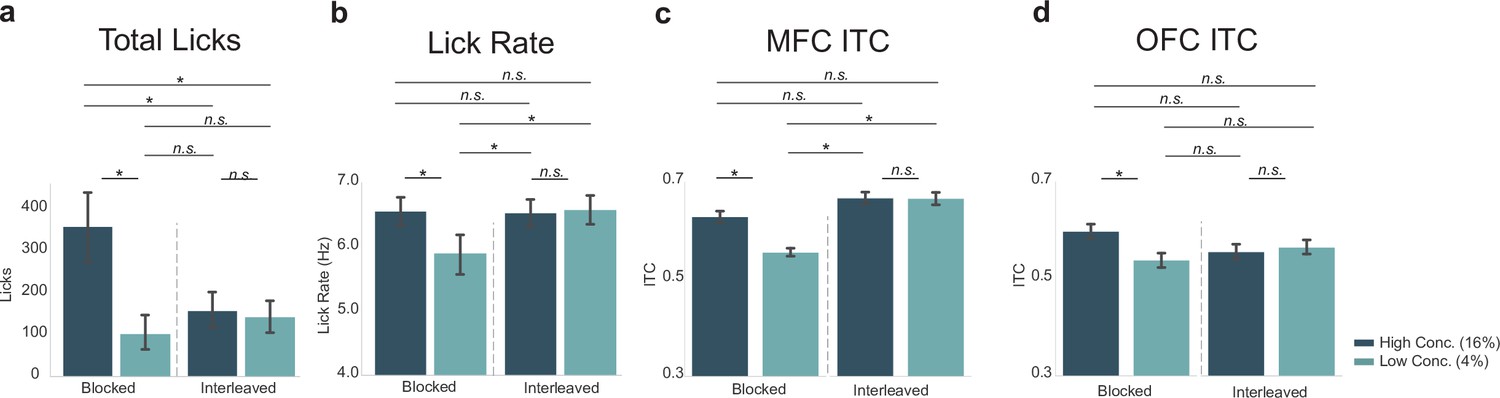
Neural activity in medial frontal cortex (MFC), but not orbital frontal cortex (OFC), varied with the lick rate (vigor) and not task engagement (total licks).
Post hoc contrasts of statistically significant effects revealed by two-way ANOVA. Direct comparison of behavioral measures (a – total licks; b – lick rate) with MFC inter-trial coherences (ITCs) (c) and OFC ITCs (d) showed a similar pattern (and identical post hoc statistical contrasts) between lick rate (b) and MFC ITCs (c). The pattern of post hoc contrasts for OFC ITCs (d) did not match either total licks or lick rate. Asterisk denotes p < 0.05. Error bars represent 95% confidence intervals.
Figure 8
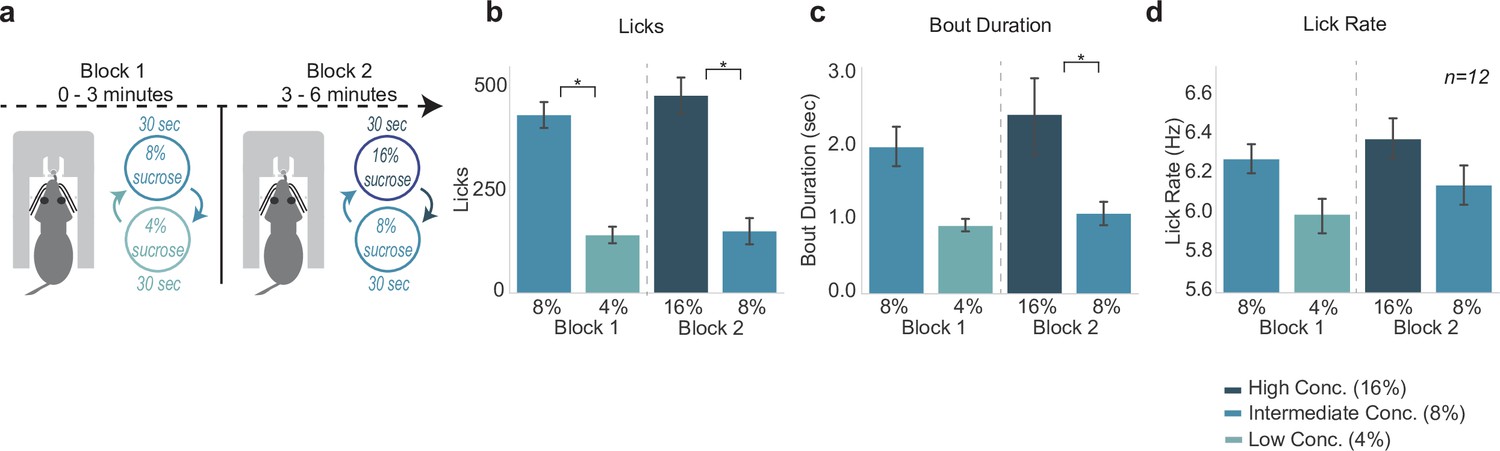
Consummatory behavior tracked relative differences in reward value.
(a) The three reward task is a variation of shifting values licking task but with a third reward introduced. In the first block of the task, rats experience the intermediate (8%) reward and low (4%) reward. In block 2, rats experience the high (16%) reward paired with the intermediate (8%) reward. (b) Rats licked more for the sweeter reward in each block. (c) Rats showed greater bout durations for the sweeter reward. (d) Lick rate showed a similar pattern to licks and bout duration, but was not statistically significant. Asterisk denotes p < 0.05. Error bars represent 95% confidence intervals.
Figure 9
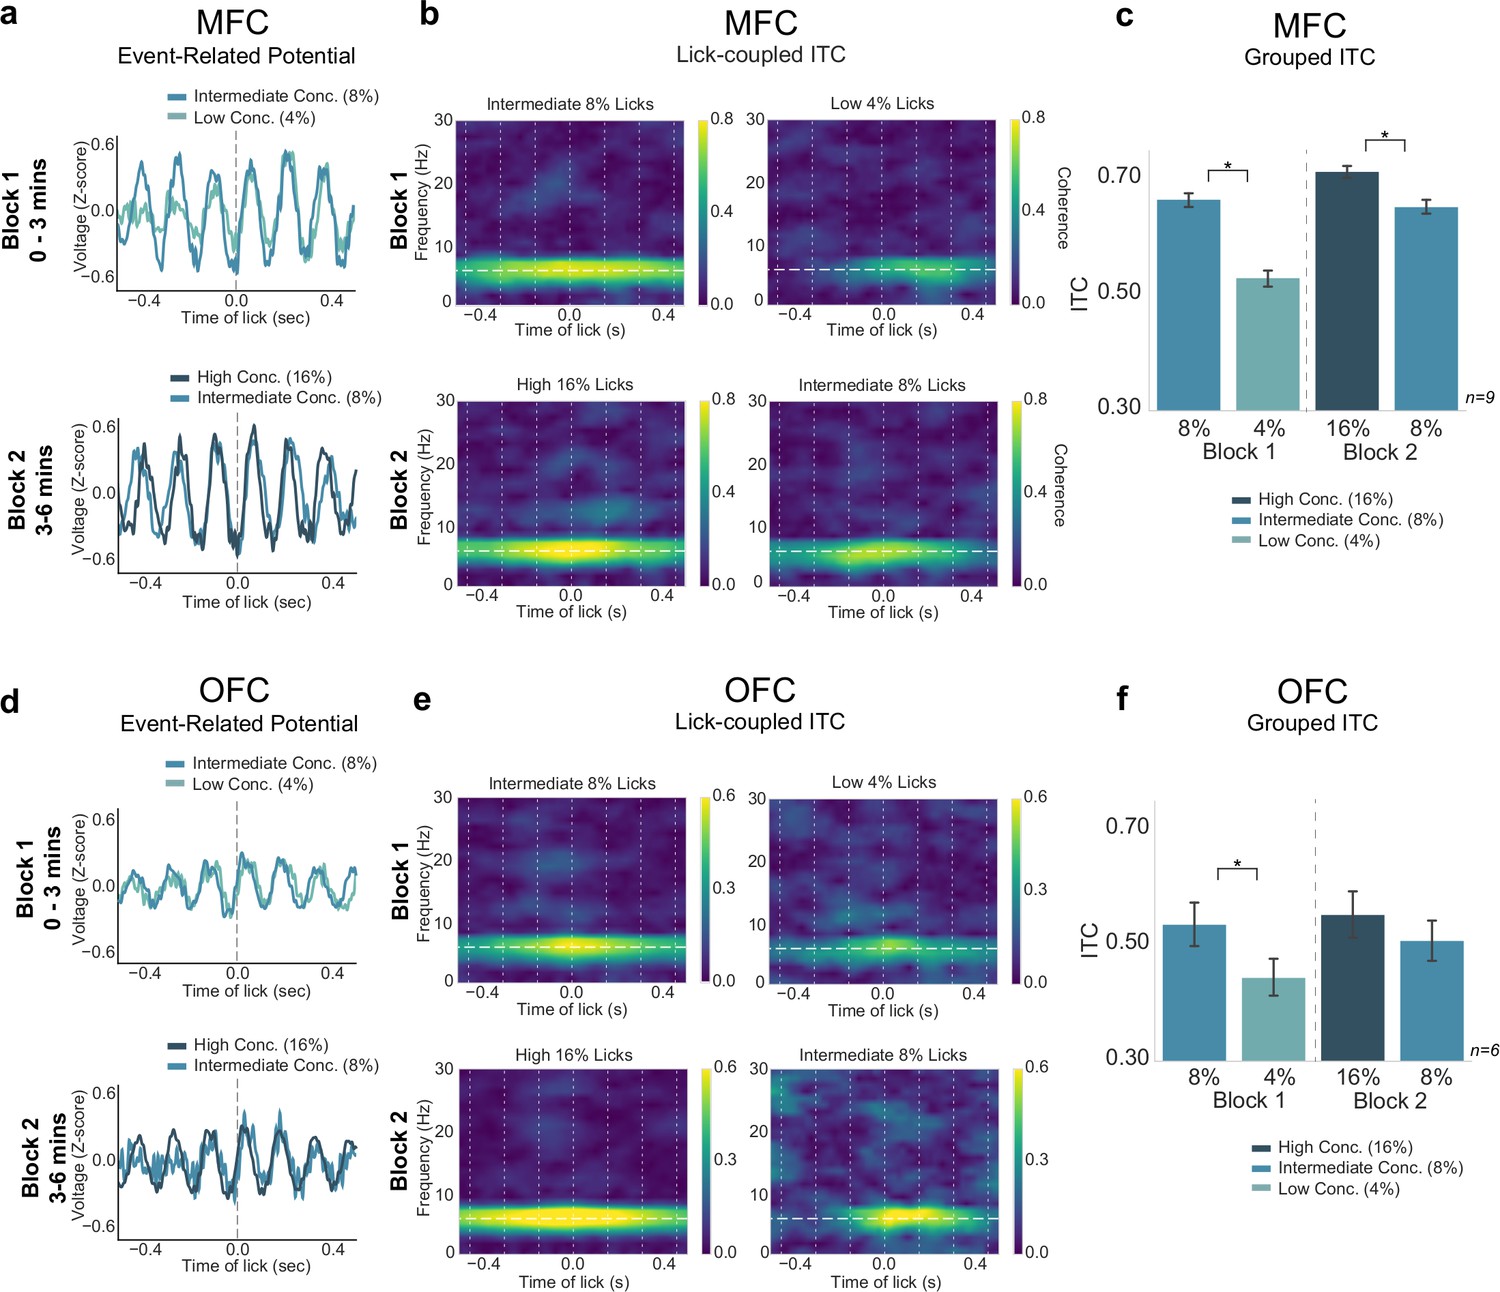
Neural activity in medial frontal cortex (MFC), but not orbital frontal cortex (OFC), tracked absolute differences in reward value.
(a,d) Event-related potentials (ERPs) for each block of the task from MFC (a) and OFC (d). (b,e) Inter-trial coherence (ITC) values in MFC (b) and OFC (e) showed strongest 4–8 Hz phase locking for the ‘high-value’ reward in each block. (c,f) Group data revealed significantly greater ITC values for the high-value reward in each block for MFC ITCs (c), and a similar pattern was found in OFC (f) but only block 1 rewards were significantly different. Asterisk denotes p < 0.05. Error bars represent 95% confidence intervals.
Figure 10 with 2 supplements
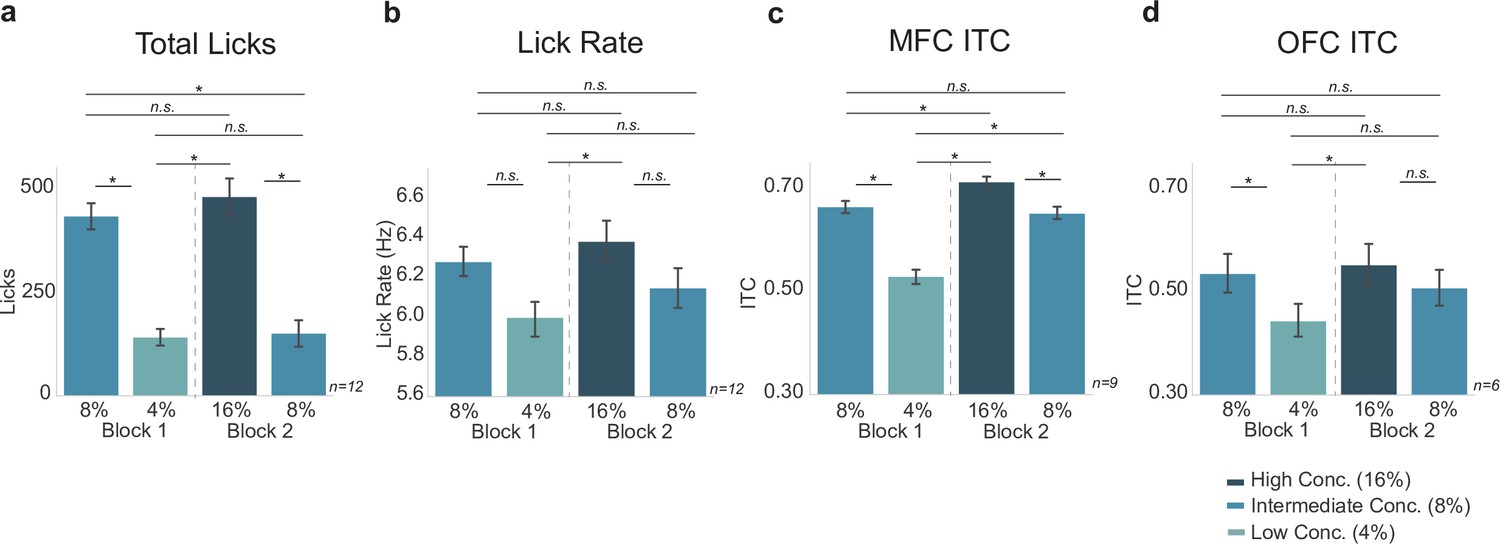
Neural activity in medial frontal cortex (MFC), but not orbital frontal cortex (OFC), varied with effects of absolute reward value on lick rate (vigor) and task engagement (total licks).
(a,b) Behavioral measures replotted with significance bars for each combination reward. MFC inter-trial coherences (ITCs) (c) did not show the exact same pattern as lick rate, which is different from Figure 5. OFC ITCs (d) did not look like total licks or lick rate. Asterisk denotes p < 0.05. Error bars represent 95% confidence intervals.
Figure 10—figure supplement 1

Hypothesis for relative versus absolute encoding of reward value.
(a) If rewards are processed in an absolute manner, we expected to see a graded expression (in lick counts, lick rate, bout duration, or inter-trial coherence [ITC] values) of reward value where the high (16%) concentration reward expression is greatest, followed by equal expression of the intermediate (8%) reward and then low expression of the low (4%) concentration reward. (b) If rewards are processed in a relative manner, we expected to see a comparative process of rewards, where the ‘high value’ (8% in block 1 or 16% in block 2) are processed similarly, and the focus is on the comparison within each block or context. (c) An alternative hypothesis which incorporates a combination of relative and absolute processing of reward value, with partially mixed results of each process in a and b.
Figure 10—figure supplement 2
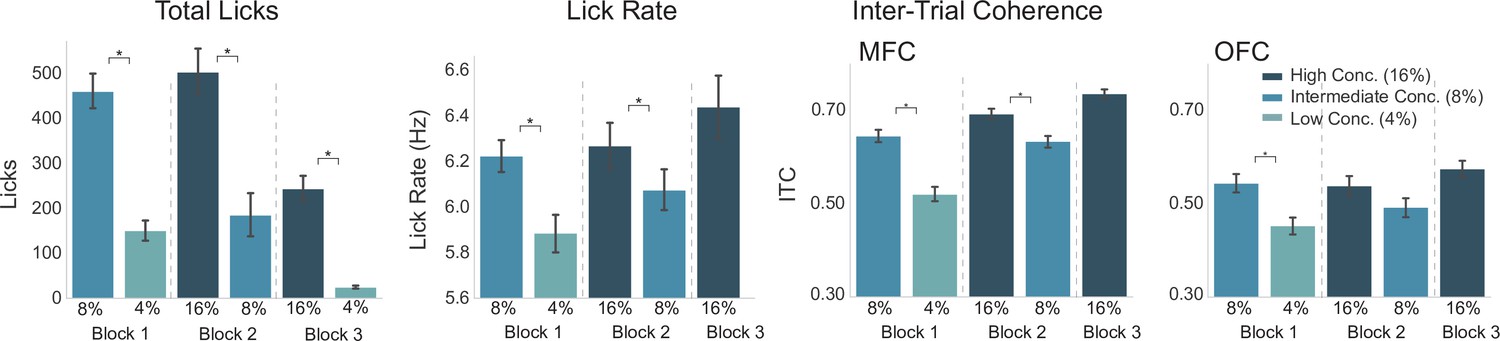
Third block of testing in the three reward task.
In the third block of the three reward task, rats received access to 16% and 4% sucrose. In this block, licks for 16% sucrose can be compared against licks for both 4% and 8%, and likewise the licks for 8% sucrose can be compared against licks for 4% and 16%. The goal was to attempt to examine if medial frontal cortex (MFC) or orbital frontal cortex (OFC) indeed tracked value in an absolute manner. Overall, rats greatly decreased the number of licks emitted for the 4% sucrose during block 3 and therefore we could not examine their subsequent electrophysiological findings. However, almost all rats (n = 8 in MFC, and n = 5 in OFC) emitted at least the minimum criteria of licks for 16% sucrose. Behaviorally, rats emitted more licks for the high-value (16%) sucrose in block 3 as opposed to licks for the low-value (4%) sucrose in block 3 (p < 0.005), although there was no difference in total licks emitted for block 3 high-value versus block 2 intermediate value. There was a significant decrease in the block 3 high-value licks as opposed to block 2 high-value licks (p < 0.001). Lick rate was also re-analyzed including block 3 high-value licks, but lick rate for low-value (4%) licks could not be analyzed due to a low number of licks not passing criteria. Lick rate for block 3 high-value licks were not significantly different from block 2 high-value licks (p = 0.99), nor from block 2 intermediate licks (p = 0.83). Statistics for MFC: block 3 high-value inter-trial coherences (ITCs) (95% CI: 0.716, 0.757) were not significantly different from block 2 high-value ITCs (p = 0.113) (95% CI: 0.671, 0.715). Block 3 high-value ITCs were significantly increased from both intermediate (8%) value ITCs in block 1 (95% CI: 0.619, 0.672) and block 2 (95% CI: 0.610, 0.658) (p < 0.001 for both). These findings support the hypothesis of MFC possibly encoding reward value in an absolute manner. Statistics for OFC: block 3 high-value ITCs (95% CI: 0.540, 0.611) were not significantly different from block 2 high-value ITCs (p = 0.789) (95% CI: 0.497, 0.580). Block 3 high-value ITCs were significantly increased from block 2 intermediate-value ITCs (p = 0.025) (95% CI for intermediate block 2: 0.450, 0.535), but block 3 high-value ITCs were not significantly different from block 1 intermediate ITCs (block 1 intermediate 95% CI: 0.505, 0.584). The other comparisons (block 2 intermediate versus block 2 high value) were not significant (p = 0.339).
Tables
Key resources table
| Reagent type (species) or resource | Designation | Source or reference | Identifiers | Additional information |
|---|---|---|---|---|
| Strain, strain background (Rattus norvegicus) | Sprague-Dawley, Long-Evans | Charles River, Envigo | NA | Rat (male) |
| Other | Precision Syringe Pump Controller | https://doi.org/10.1523/ENEURO.0240-19.2019 | SCR_021493 | |
| Software, algorithm | Med-PC | MedAssociates | SCR_012156 | |
| Software, algorithm | GNU Octave | https://www.gnu.org/software/octave/ | SCR_014398 | |
| Software, algorithm | R Project for Statistical Computing | https://www.r-project.org/ | SCR_001905 | |
| Software, algorithm | NeuroExplorer | https://www.neuroexplorer.com/ | SCR_001818 | |
| Software, algorithm | MatPlotLib | https://matplotlib.org/ | SCR_008624 | |
| Software, algorithm | IPython | https://ipython.org/ | SCR_001658 | |
| Software, algorithm | Jupyter | https://jupyter.org/ | SCR_018416 | |
| Software, algorithm | Seaborn | https://seaborn.pydata.org/ | SCR_018132 | |
| Software, algorithm | MATLAB | Mathworks | SCR_001622 | |
| Software, algorithm | EEGLab | https://sccn.ucsd.edu/eeglab/index.php | SCR_007292 |
Additional files
Download links
A two-part list of links to download the article, or parts of the article, in various formats.
Downloads (link to download the article as PDF)
Open citations (links to open the citations from this article in various online reference manager services)
Cite this article (links to download the citations from this article in formats compatible with various reference manager tools)
Coherent theta activity in the medial and orbital frontal cortices encodes reward value
eLife 10:e63372.
https://doi.org/10.7554/eLife.63372


