Nup98-dependent transcriptional memory is established independently of transcription
- Department of Cell and Developmental Biology, Penn Epigenetics Institute, Perelman School of Medicine, University of Pennsylvania, United States
Figures
Figure 1 with 2 supplements

Absolute quantification of E74 induction and transcriptional memory.
(A) Overview of ecdysone/20E treatment. Cells were treated with 5 μM 20E, then washed with fresh media and recovered for 24 hr. Memory response was assessed by incubating cells with 5 μM 20E after recovery period. (B). Absolute number of E74 mRNAs per cell as a function of time after the addition of 20E during either the first or second induction in control (dsWhite) and Nup98 knockdown (dsNup98) S2 cells. Samples were collected every 30 min. Error bars represent standard deviation of the mean of three experiments. (C). Schematic of smFISH labeling of sites of nascent transcription and spliced transcripts in either the nucleus or cytoplasm. (D). Representative images of E74 smFISH labeling in single cells during the first and second induction, displayed with the ImageJ ‘red fire’ look-up table. (E). Violin plots of E74 puncta per cell. Mean and median indicated by black and red horizontal lines.
Figure 1—figure supplement 1
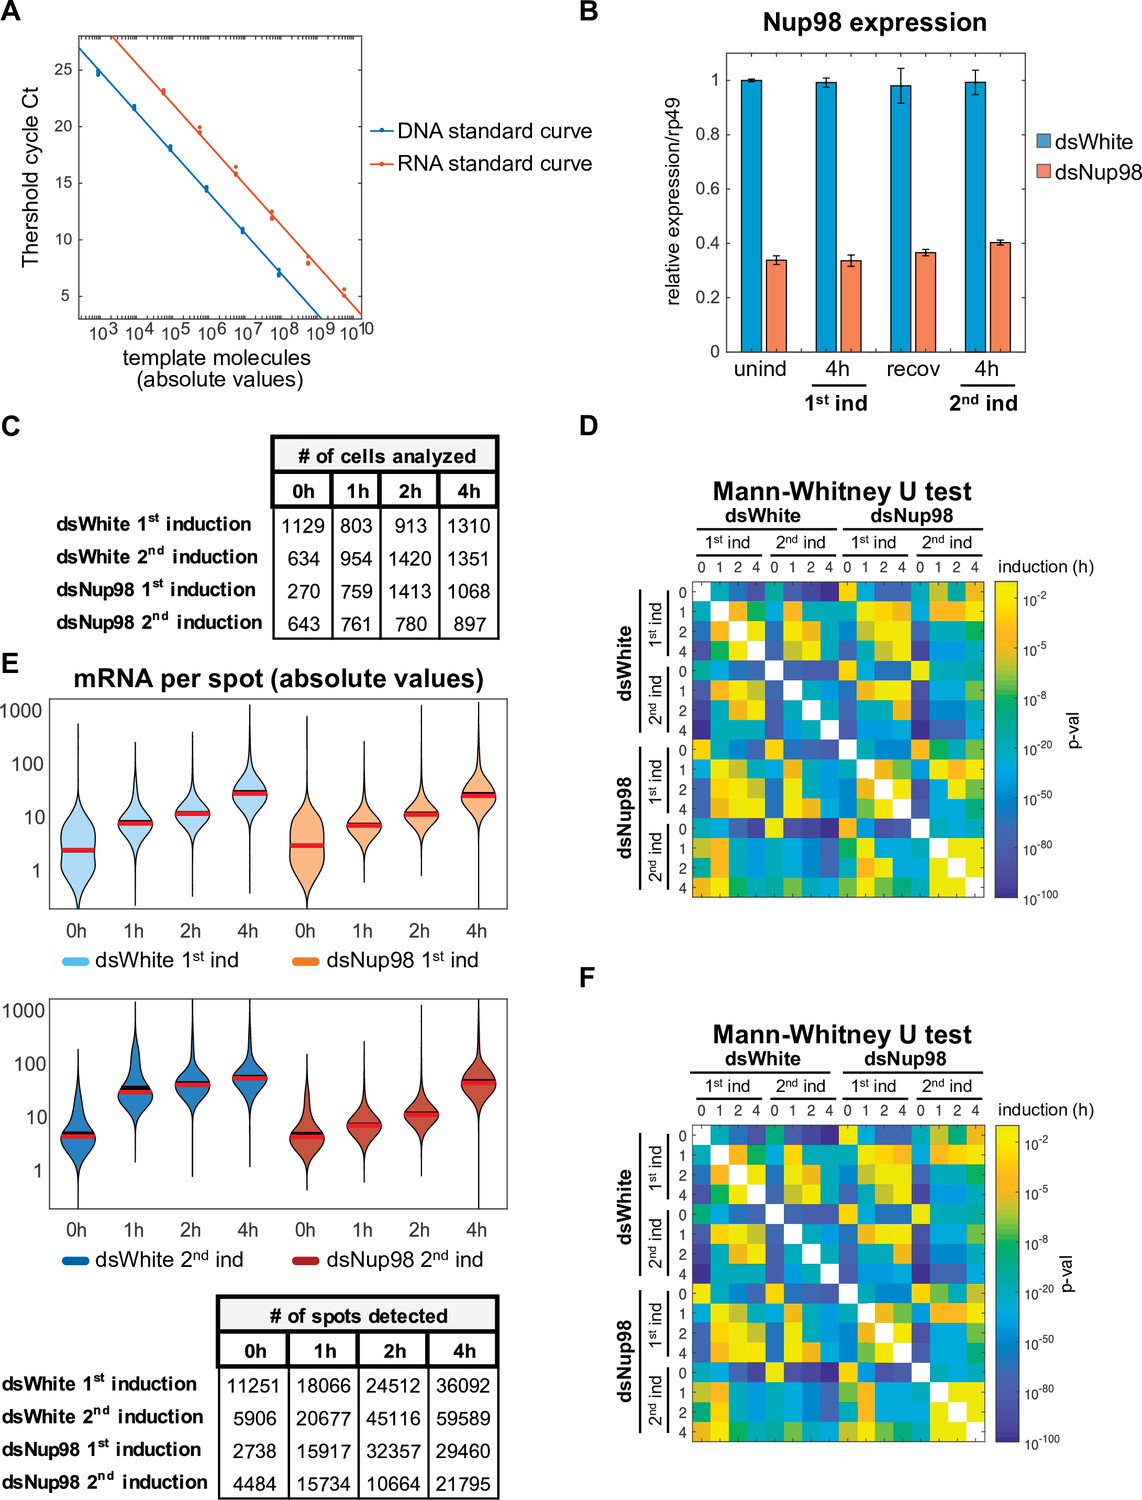
Absolute quantification of E74 expression.
(A) Calibration of qPCR using known numbers of input DNA or in vitro transcribed RNA molecules. Ct (cycle threshold) refers to the number of cycles required for the fluorescent signal to cross the threshold at which all samples are compared. Note that the protocol is accurate across more than 6 orders of magnitude. (B). Nup98 expression was assessed relative to rp49 by qPCR following the experimental conditions detailed in Figure 1B. Error bars represent standard deviation. (C). Number of cells analyzed in Figure 1D. (D). p-Values for all possible pairwise comparisons of spot count distributions shown in Figure 1E were determined using the non-parametric Mann-Whitney U test. (E). Quantification of numbers of mRNA per spot detected by smFISH. Mean intensities of cytoplasmic puncta under uninduced conditions were used to normalize intensities of puncta under induction. Mean and median indicated by black and red horizontal lines respectively. (F). p-Values for all possible pairwise comparisons of mRNA per spot distributions shown in panel E were determined using the non-parametric Mann-Whitney U test.
Figure 1—figure supplement 2
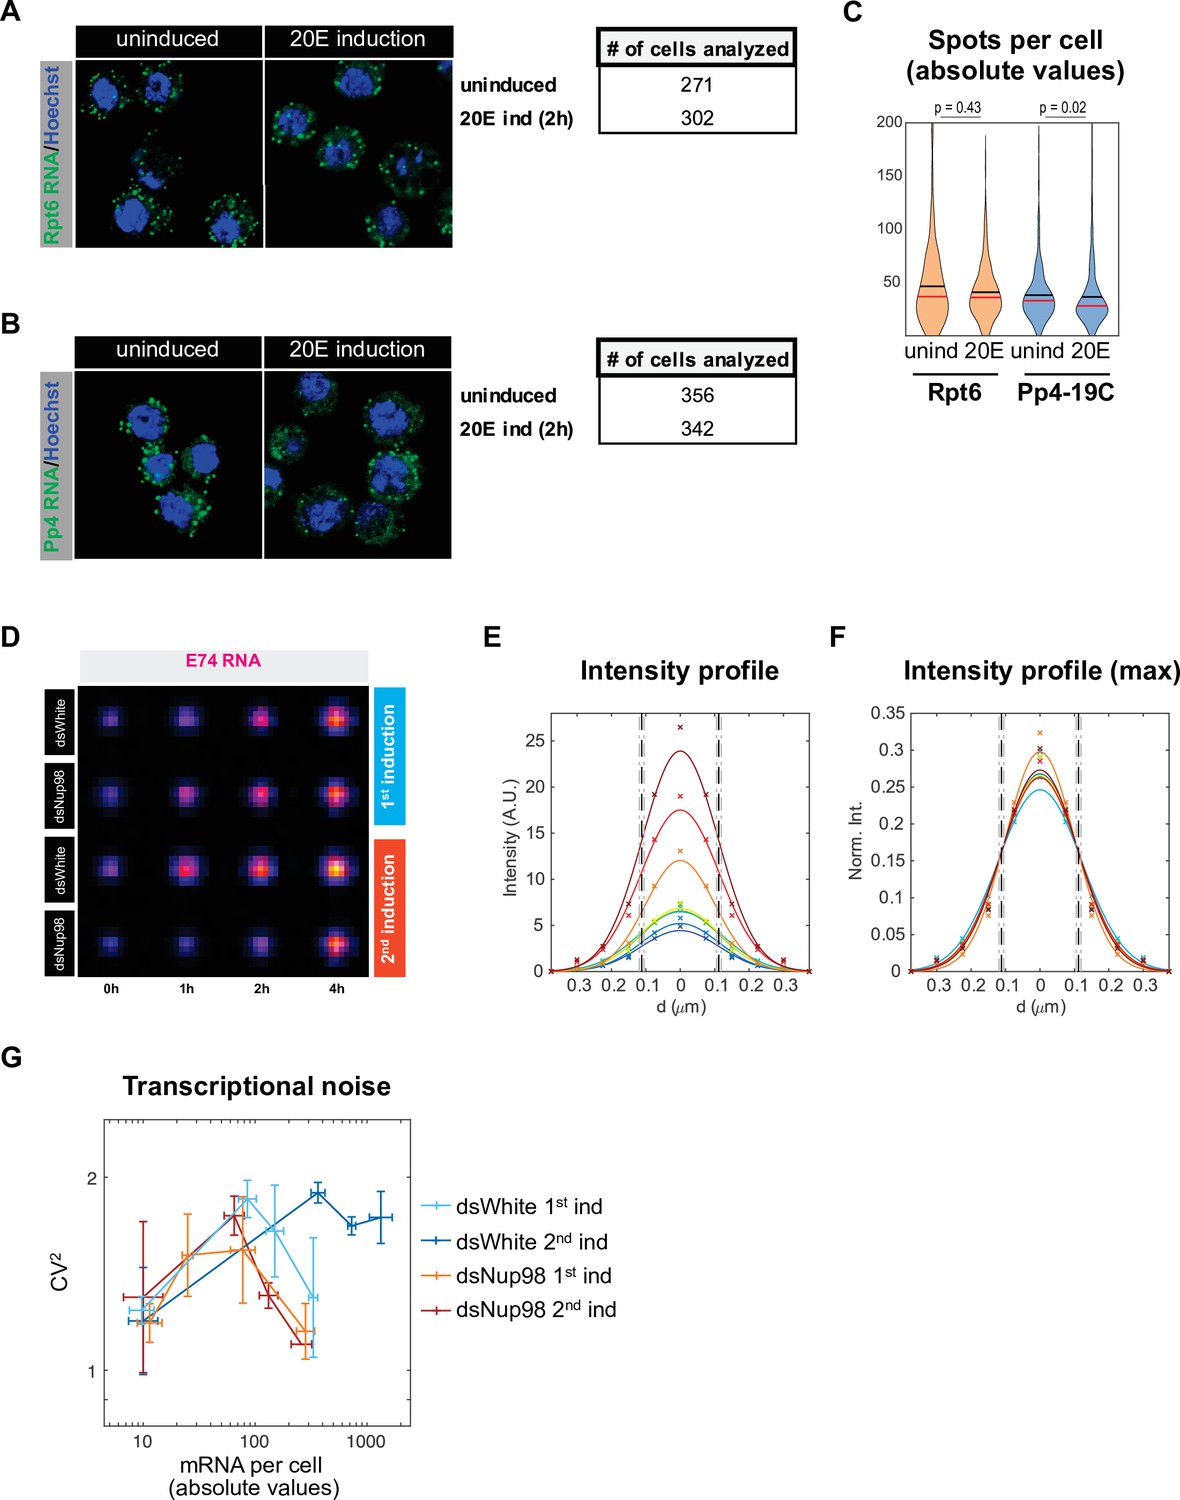
Analysis of E74 smFISH resolution.
(A-C) Representative images (A,B) and violin plots (C) for Rpt6 expression (A) and Pp4-19C expression (B) in uninduced and 20E induction. Mean and median indicated by black and red horizontal lines respectively. Mann-Whitney U test was used to compare similarities between uninduced and induced samples. (D–F). E74 smFISH spots are diffraction limited. (D): average images of all spots for each of 16 conditions displayed with the ‘red fire’ look-up table. (E, F) Cross-section of the eight images for control (dsWhite) are plotted with mean pixel values demarcated by symbols and fitted Gaussians as solid lines for either raw mean pixel values (E) or normalized such that the total area under each Gaussian equals unity (F). Vertical lines represent mean (dashed) and standard deviation (dot-dashed) of the full width at half maximum (FWHM, 110 ± 5 nm), essentially equivalent to the radius of a diffraction-limited object predicted from the Abbe limit (emission wavelength / numeric aperture = 105 m) independent of spot intensity. (G). Transcriptional noise, plotted as coefficient of variation CV (or standard deviation/mean) squared, as a function of mean number of mRNA molecules per cell, was assessed in control and Nup98 knockdown conditions in the first and second inductions. Error bars represent the standard deviation of the mean.
Figure 2 with 1 supplement
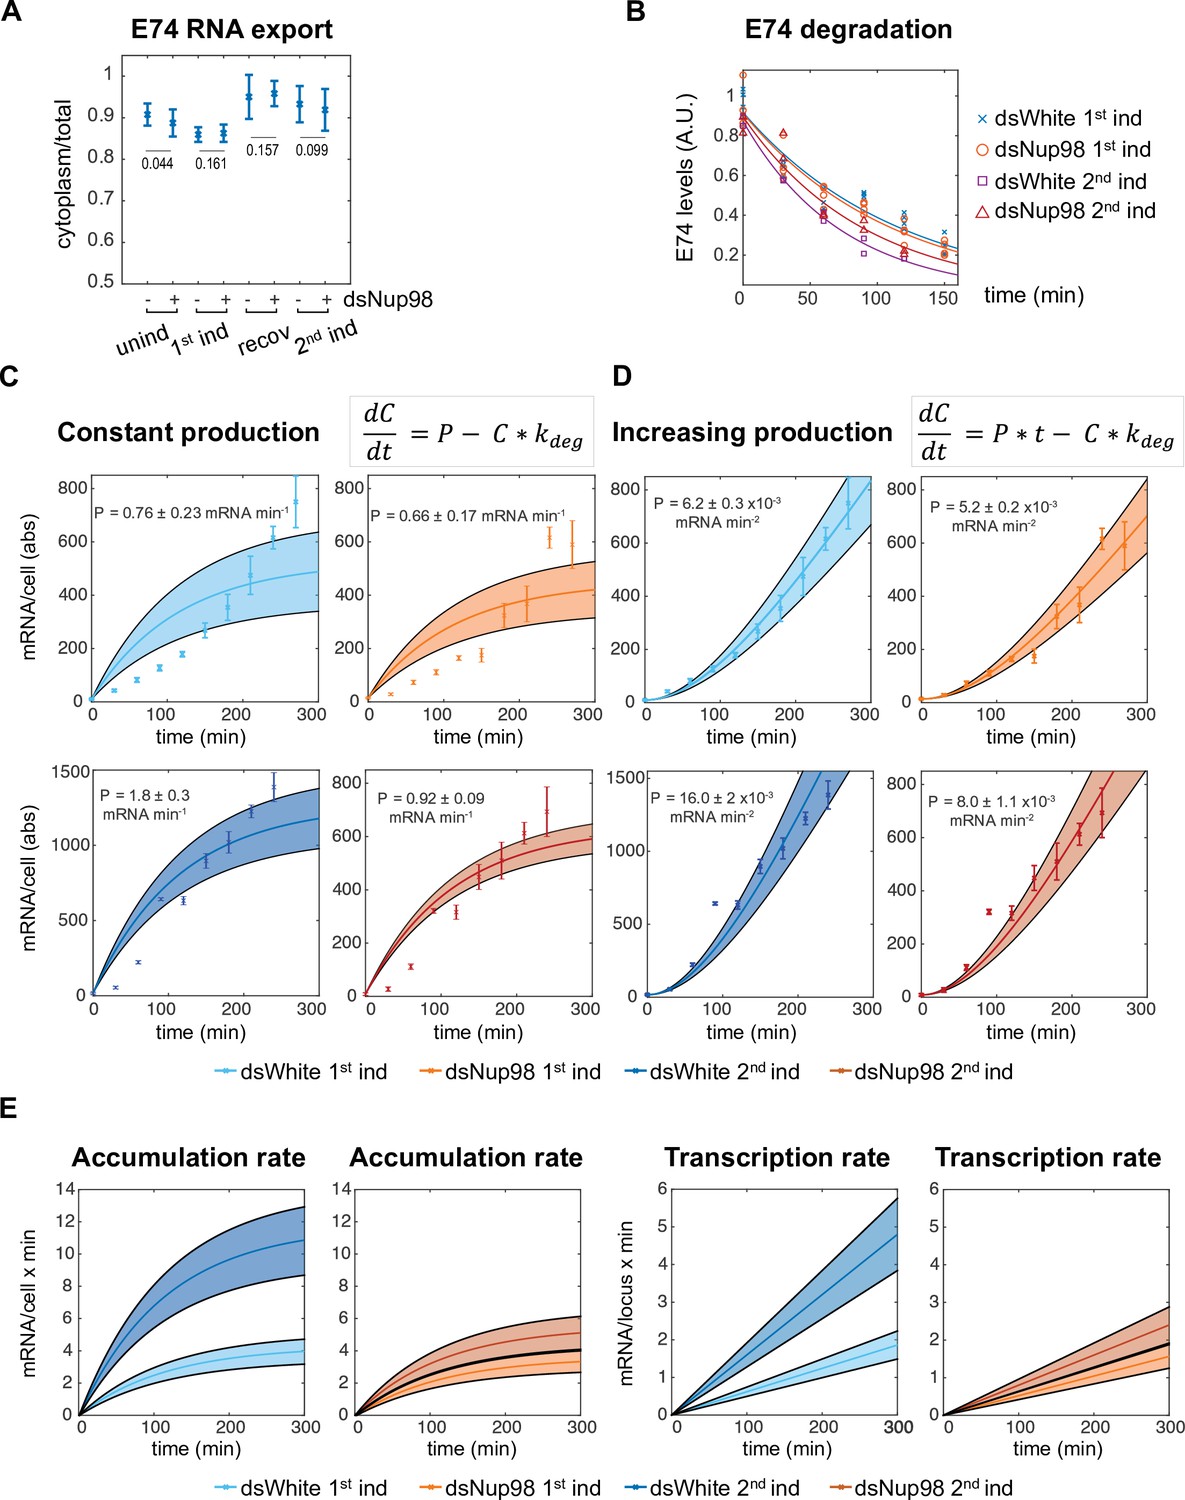
Altering Nup98 levels modulates transcription, not mRNA export or degradation.
(A) Fraction of E74 mRNA found in cytoplasm, as assessed by smFISH, with Nup98 knockdown (+) or control knockdown (-) prior to the first induction (unind), after 4 hr (1st ind), 24 hr after hormone removal (recov), and 4 hr after 2nd induction. Error bars represent standard deviation of the mean. Welch’s t-test was used to calculate p-values. (B). Degradation rates of E74 mRNA assessed by qPCR. Cells from 1st induction or 2nd induction (as depicted in Figure 1A) were washed and collected every 30 min after the addition of 1 μM flavopiridol at zero minutes. Experiment was repeated three times and mRNA lifetimes were determined by fit to exponential curves. p-Values, determined by Welch’s t-test, have values > 0.2 for all pairs of fits. (C–D). E74 transcription rates increase during 20E exposure. Data points with error bars obtained by qPCR as shown in Figure 1B. Shaded bands indicate 95% confidence intervals for the fit rates P for the models indicated. Top row: first induction; second row: second induction. (C) Best fit of data to model of constant transcription rate P. (D): Best fit of data to model of time-dependent increasing E74 transcription rate. (E). Comparison of the rates of mRNA accumulation (left) and underlying transcription rates (right) between first and second induction in control and dsNup98 cells.
Figure 2—figure supplement 1
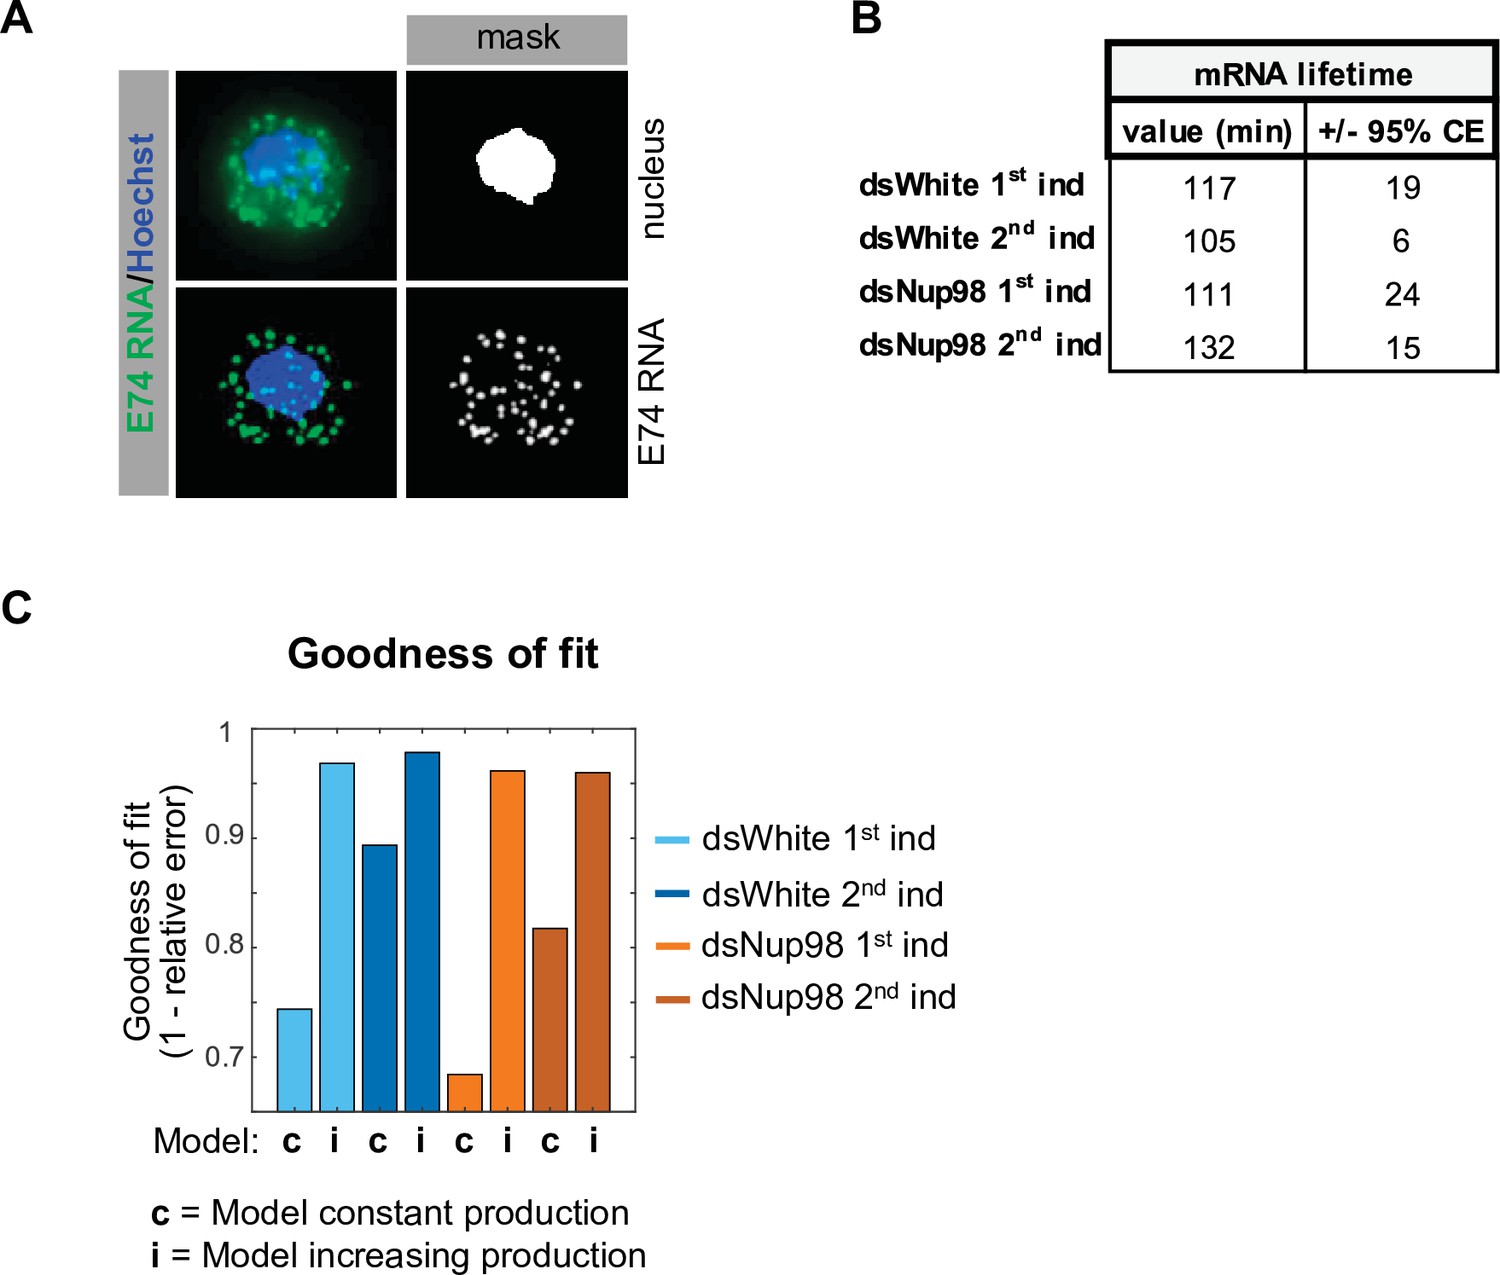
Examination of mRNA detection, export, and lifetime.
(A) Illustration of procedure to calculate mRNA export. Hoechst staining (blue in upper left) was used to generate a mask representing nuclear volume. Centroids for individual puncta were assessed to find the number of puncta assigned to nuclear and non-nuclear volumes. (B). mRNA lifetime values derived from Figure 2B (comparing to dsNup98 second induction, p-values from two sample t-test are 0.2 and 0.2 for dsWhite first and second induction and 0.39 for dsNup98 first induction). (C). A model of constant production fails to describe E74 accumulation. Goodness-of-fit was calculated as one minus the relative error, where the relative error is the mean of the absolute value of deviation of the simulated value minus the mean of the measurement at each time point divided by the mean of the measurement.
Figure 3 with 2 supplements
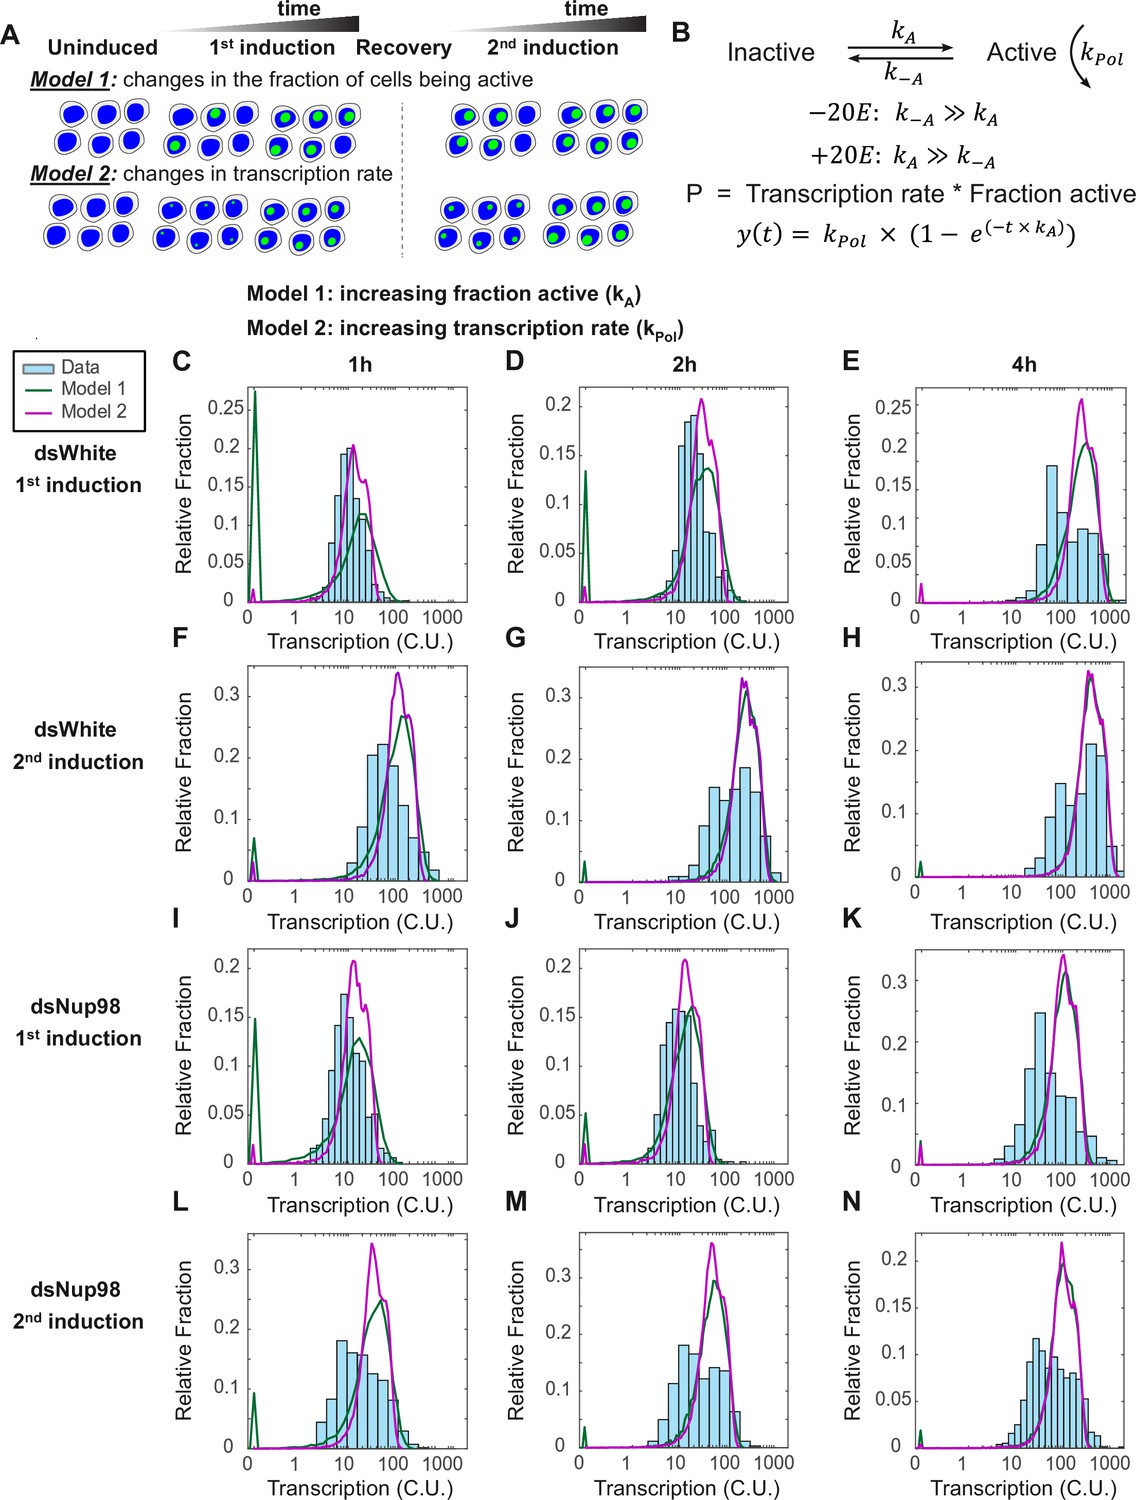
The two-state promoter model does not describe single-cell measurements of transcription.
(A) A model utilizing two promoter states (active and inactive) contains two mechanisms that can account for the increase in the transcription rates observed by qPCR. Model 1: loci are slowly recruited into a transcriptionally active state upon first induction and more rapidly upon second induction. Once active, loci produce new mRNAs at a constant rate equivalent to the rate at which new RNA Pol II molecules enter productive elongation. Model 2: all cells are rapidly recruited into an active state, and the rate of transcription increases over time, slowly upon first induction and quickly upon second induction. (B). Model describing the rate of recruitment into the active state kA, into the inactive state k-A, and the rate of recruiting RNA Pol II molecules into productive elongation kPol. The presence of 20E permits kA to be larger than k-A. The production rate as a function of time is given by the RNA Pol II recruitment rate multiplied by the fraction of active loci. In Model 1, kA increases and kPol is constant during 20E exposure, whereas in Model 2, kPol increases and kA is constant. (C–N). Histograms (cyan) show distribution of measured total instantaneous transcriptional activity in normalized units (C.U.), obtained from smFISH of E74 as shown in Figure 1. Lines represent predicted values generated by simulation using best-fitting parameters for Model 1 (green) and Model 2 (magenta) under conditions of control (C–H) or Nup98 knockdown conditions (I–N) during the first (C,F,I,L), second (D,G,J,M), or fourth (E,H,K,N) hour of the first (C–E, I–K) or second (F–H, L–N) inductions.
Figure 3—figure supplement 1
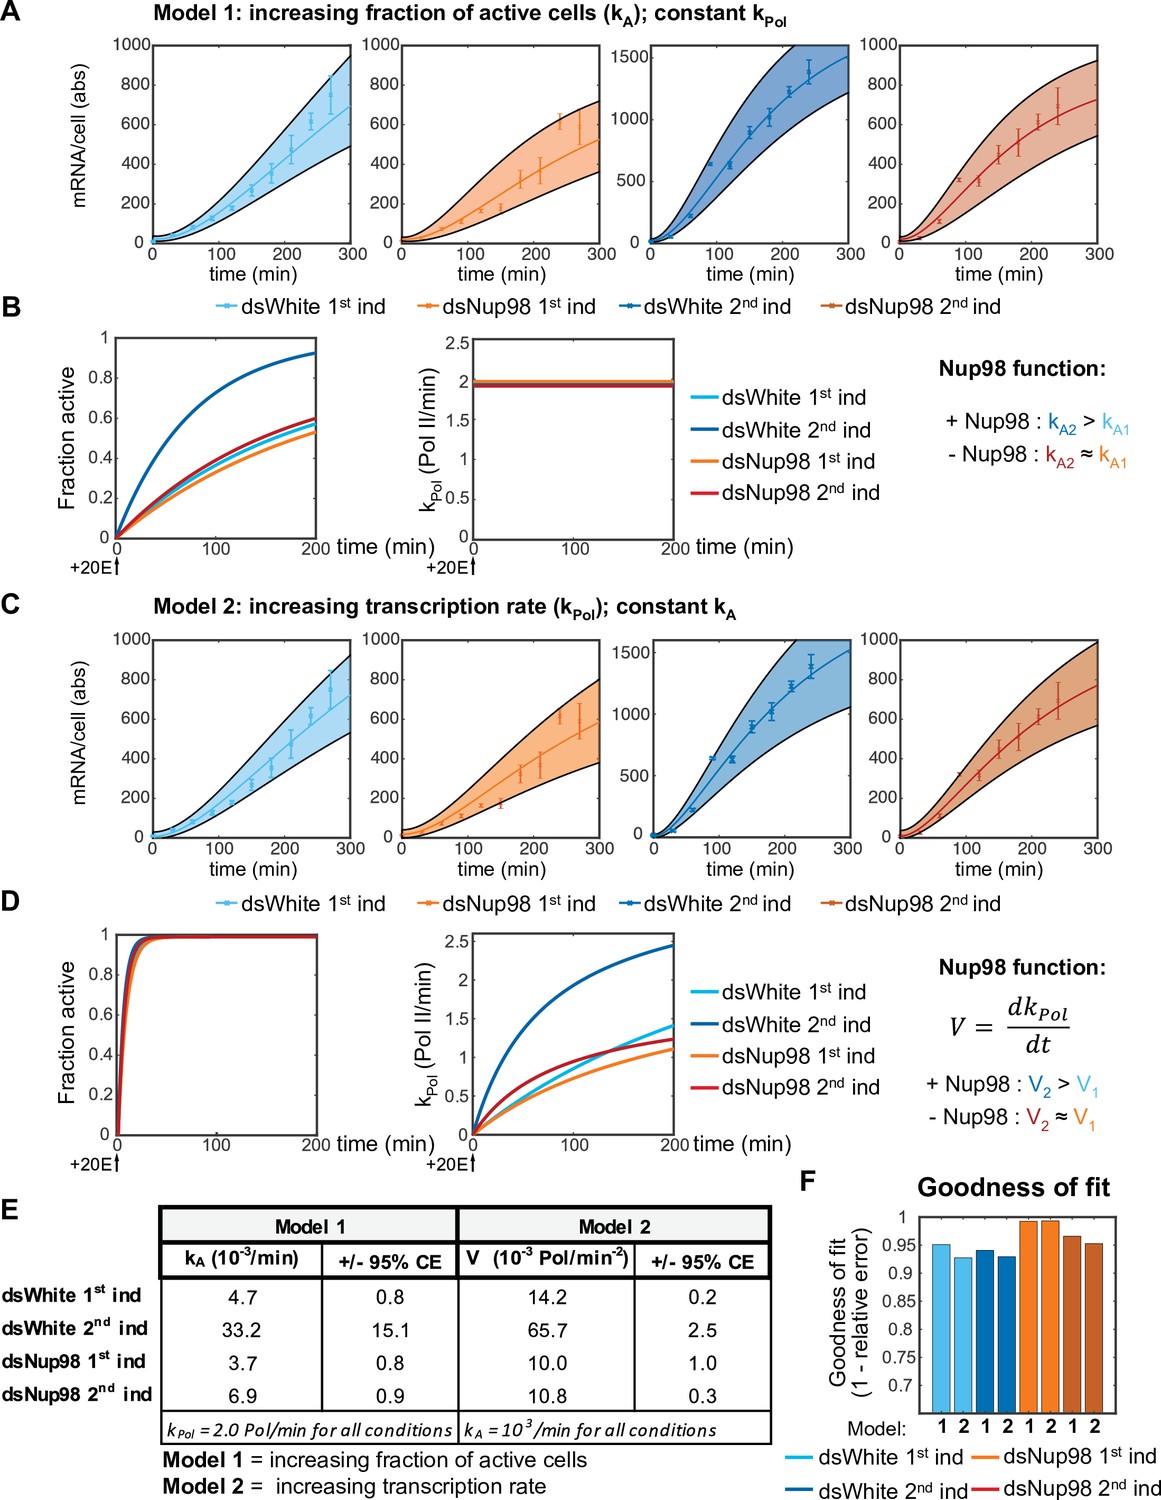
Modeling promoter state switching and increasing transcription rates using population-averaged qPCR data.
(A). Best fit and 95% confident intervals of Model one to qPCR data. (B). Under Model 1, normal levels of Nup98 are required to ensure kA2 > kA1, yielding a faster recruitment of loci into the active state (left) upon second induction, whereas kPol is constant under all conditions (2.0±0.2 RNA Pol min–1). (C). Fit of Model two to data. (D). Under Model 2, kA is large and essentially identical between conditions (left), ensuring near-simultaneous activation of all loci (left). The role of Nup98 is to ensure a rapid increase in kPol upon second induction. (E). Best-fitting values and 95% confidence intervals for a Model 1 (constant kPol) and Model 2 (increase in kPol as a function of time). (F). Goodness-of-fit values for each of the two mechanisms of increasing the transcription rate under an assumption that k-A = 0. Values calculated as described in the legend to Figure 2—figure supplement 1C.
Figure 3—figure supplement 2
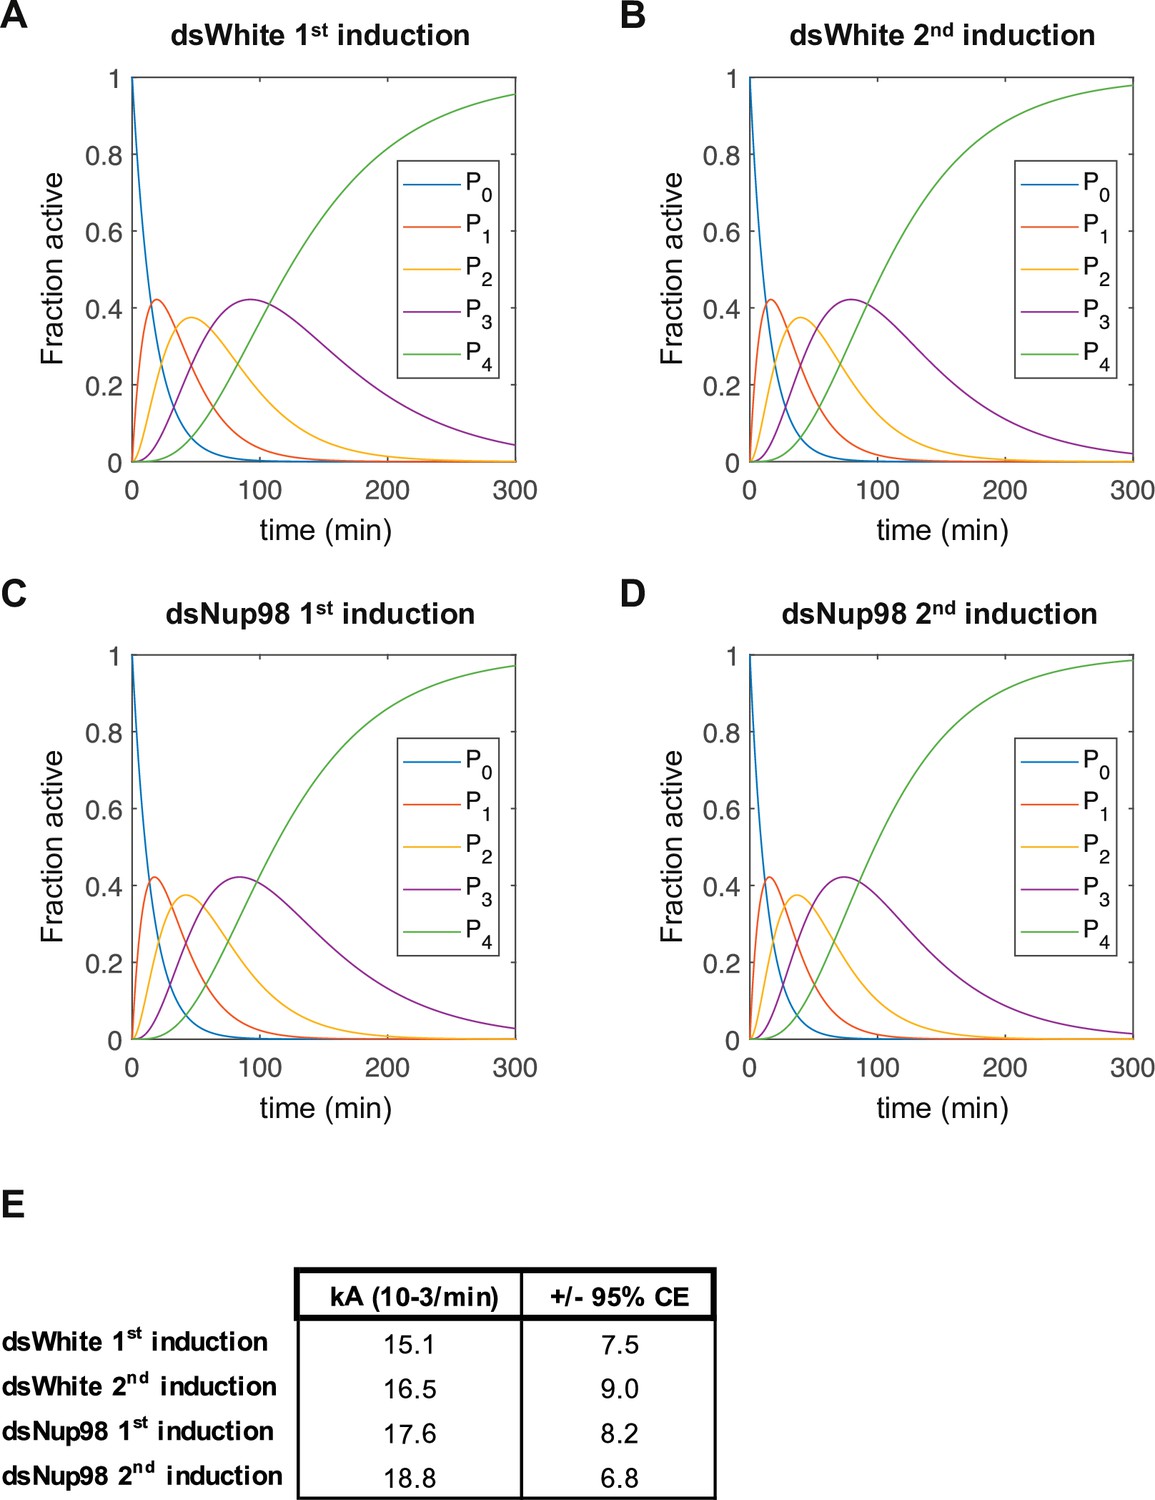
Estimated population distributions of cells with 0–4 nascent transcription sites as a function of time.
(A-D) Estimated fraction of cells with inactive (P0) or 1,2,3, or 4 active transcription sites (P1–P4) under the first or second induction in control or Nup98 knock-down conditions, as indicated. Curves are generated using the rate of entering the active state derived from fitting data from each individual condition separately and with the same method as for fitting all conditions simultaneously, described in Figure 4—figure supplement 1 and accompanying text and methods. (E). Obtained kA values for fitting each of these conditions.
Figure 4 with 1 supplement
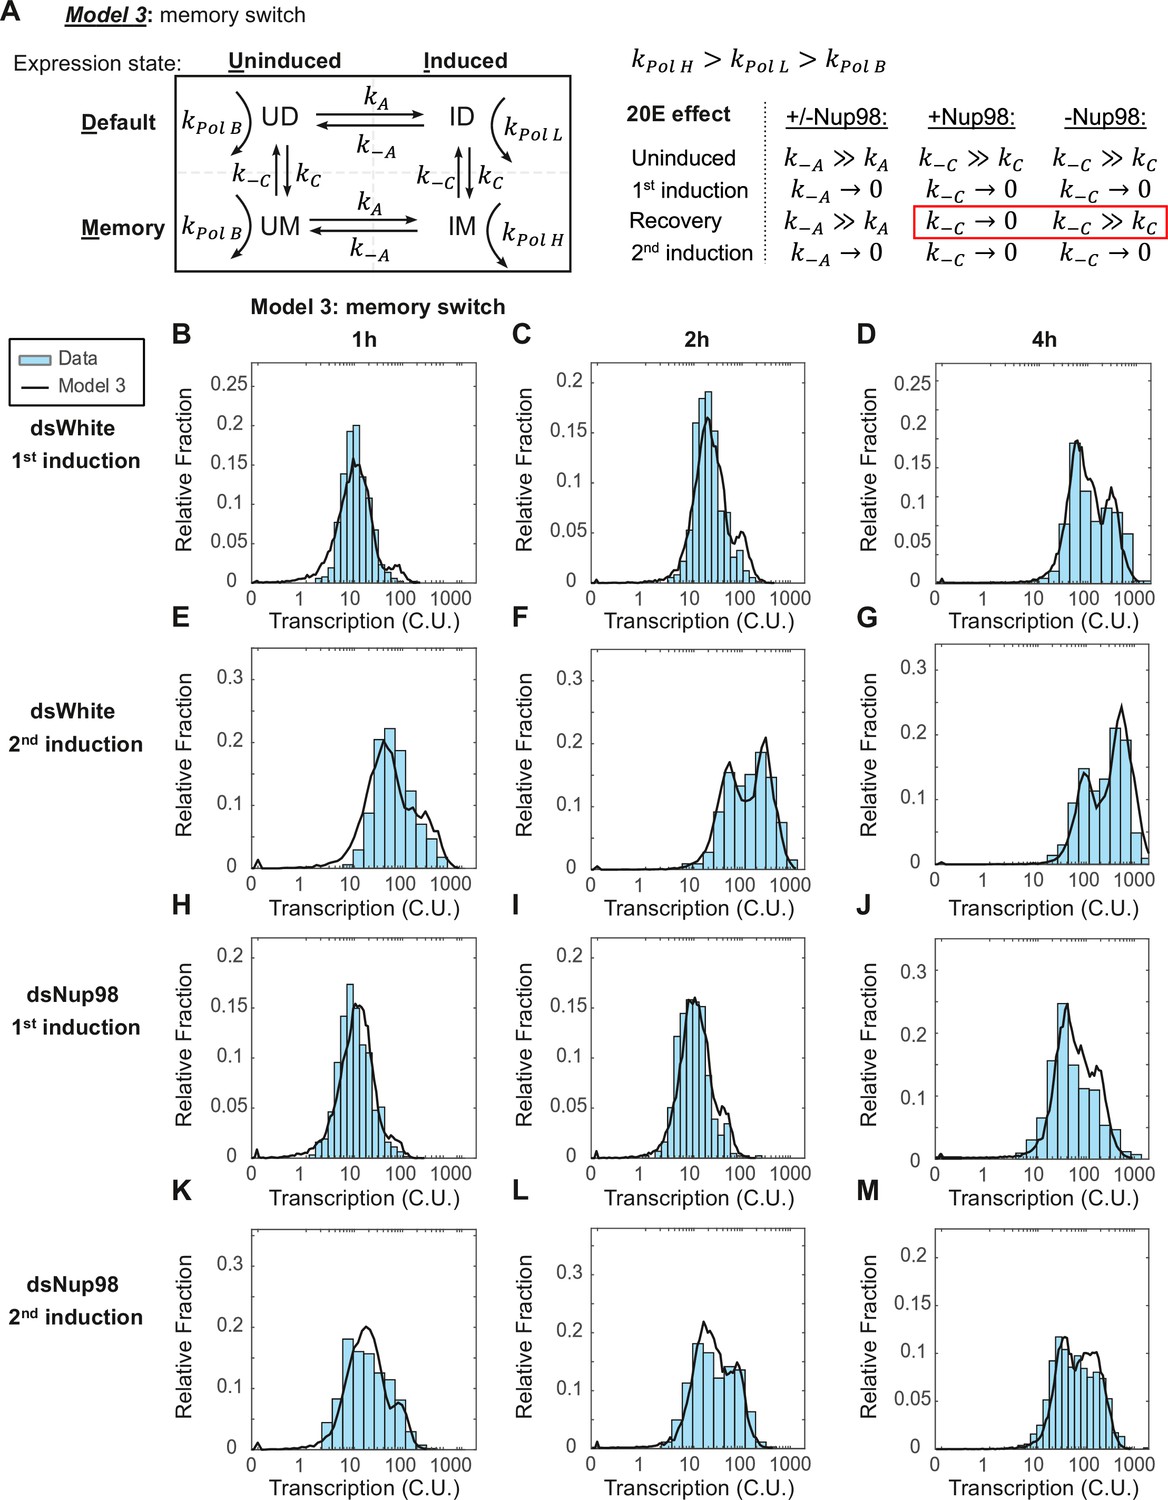
The memory switch model describes the distribution of transcriptional activity.
(A) Promoters can occupy one of four states: Uninduced and Induced (U and I), related to current presence of hormone; and Default and Memory (D and M), associated with prior hormone exposure. The Uninduced state is associated with a basal RNA Pol II rate kPolB, whereas the Induced state shows two independent RNA Pol II rates kPolL and kPolH associated with Default and Memory states, respectively. 20E has two roles: one, to activate transcription by ensuring kA >> k-A, as in earlier models; and two, to increase the rate of conversion from Default to Memory by ensuring kC >> k-C. The role of Nup98 is to maintain kC >> k-C upon withdrawal of 20E. (B–M). Histograms (cyan) show distribution of measured total instantaneous transcriptional activity in normalized units (C.U.), obtained from smFISH of E74 as shown in Figure 1. Lines represent predicted values generated by simulation using best-fitting parameters under the memory switch model.
Figure 4—figure supplement 1
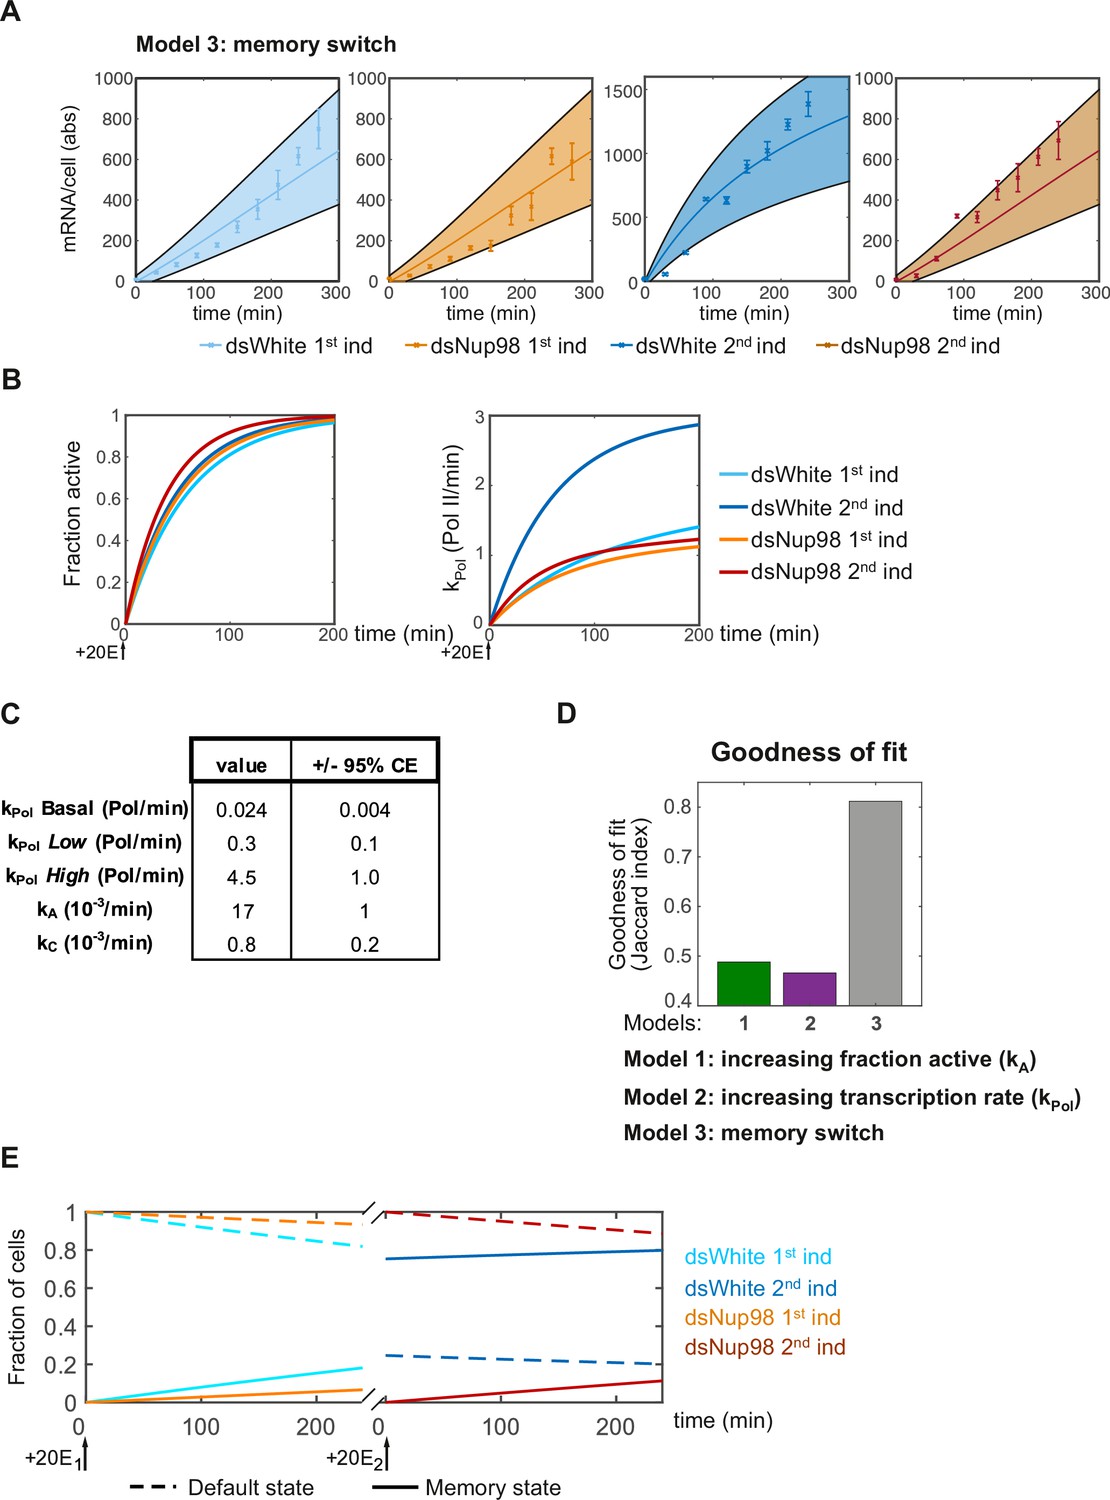
Fitting qPCR data to a four-state model of promoter memory.
(A). Fitting of qPCR data to four-state model under each of four experimental conditions. (B). The rate of recruitment of loci into the active state is similar between all conditions (left). Rapid mRNA accumulation upon second induction in control cells results from the rapid increase in average mRNA production rates. (C). Best fit parameters with 95% confidence intervals. (D). Goodness-of-fit values for Models 1, 2 and the memory switch model. Goodness-of-fit is significantly improved for the memory model compared to either alternate model. (E). Memory model of E74 expression. Fraction of loci in either the default state (dashed lines) or memory state (solid lines) as a function of time. In the presence of Nup98, loci continuously transition into the memory state starting immediately upon 20E exposure.
Figure 5 with 1 supplement
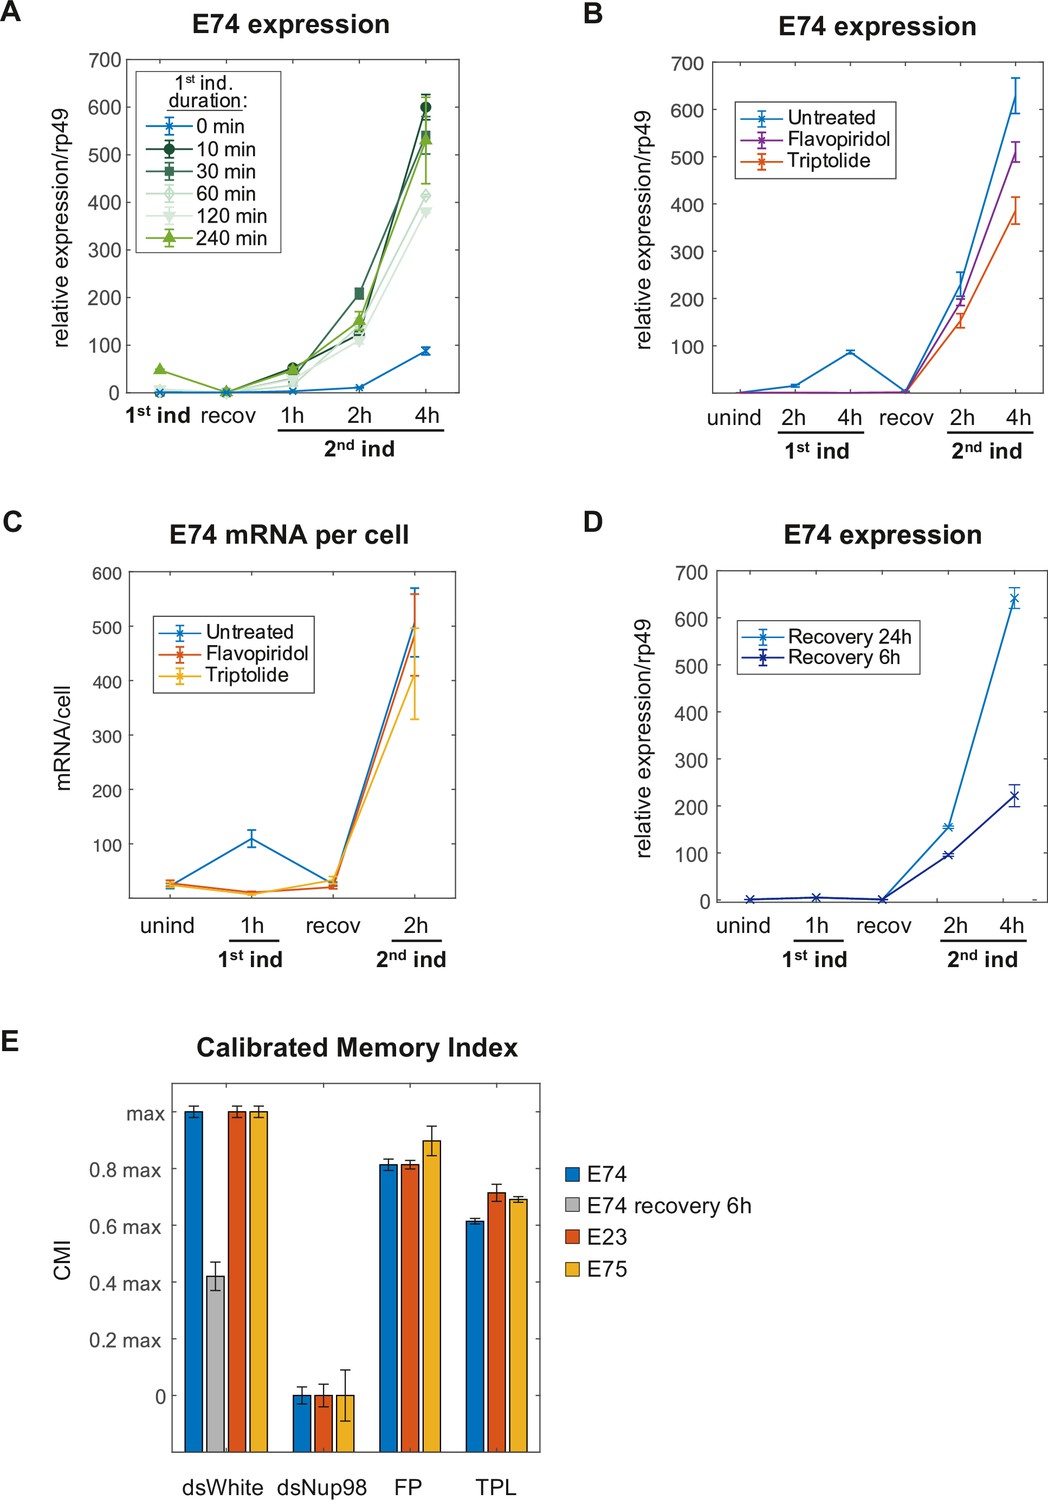
Induction of the memory state requires neither transcription nor prolonged 20E exposure.
(A) E74 mRNAs measured by qPCR and normalized relative to rp49 with varying duration of 20E exposure during first induction. The data represent the mean of three independent experiments and the error bars the standard deviation of the mean. (B). Flavopiridol or Triptolide inhibitors were added 30 min prior 20E first induction at 1 μM and 5 μM, respectively. After 4 hr of induction, both, the hormone and the transcriptional inhibitors were washed-out and cells recovered for 24 hr. 20E re-induced cells were collected and, E74 expression was measured by qPCR from three independent experiments. Fold change values were normalized using rp49 and error bars represent the standard deviation of the mean. (C). Cells were treated with Flavopiridol or Triptolide as described in B and E74 mRNAs were monitored by smFISH. Error bars represent standard deviation of the mean. (D). E74 mRNAs levels were measured by qPCR and normalized against rp49 using two different recovery times (6 hr and 24 hr). The data represent the mean of three independent experiments ± standard deviation. (E). Calibrated Memory Index (CMI) of E74, E23, and E75 genes.
Figure 5—figure supplement 1
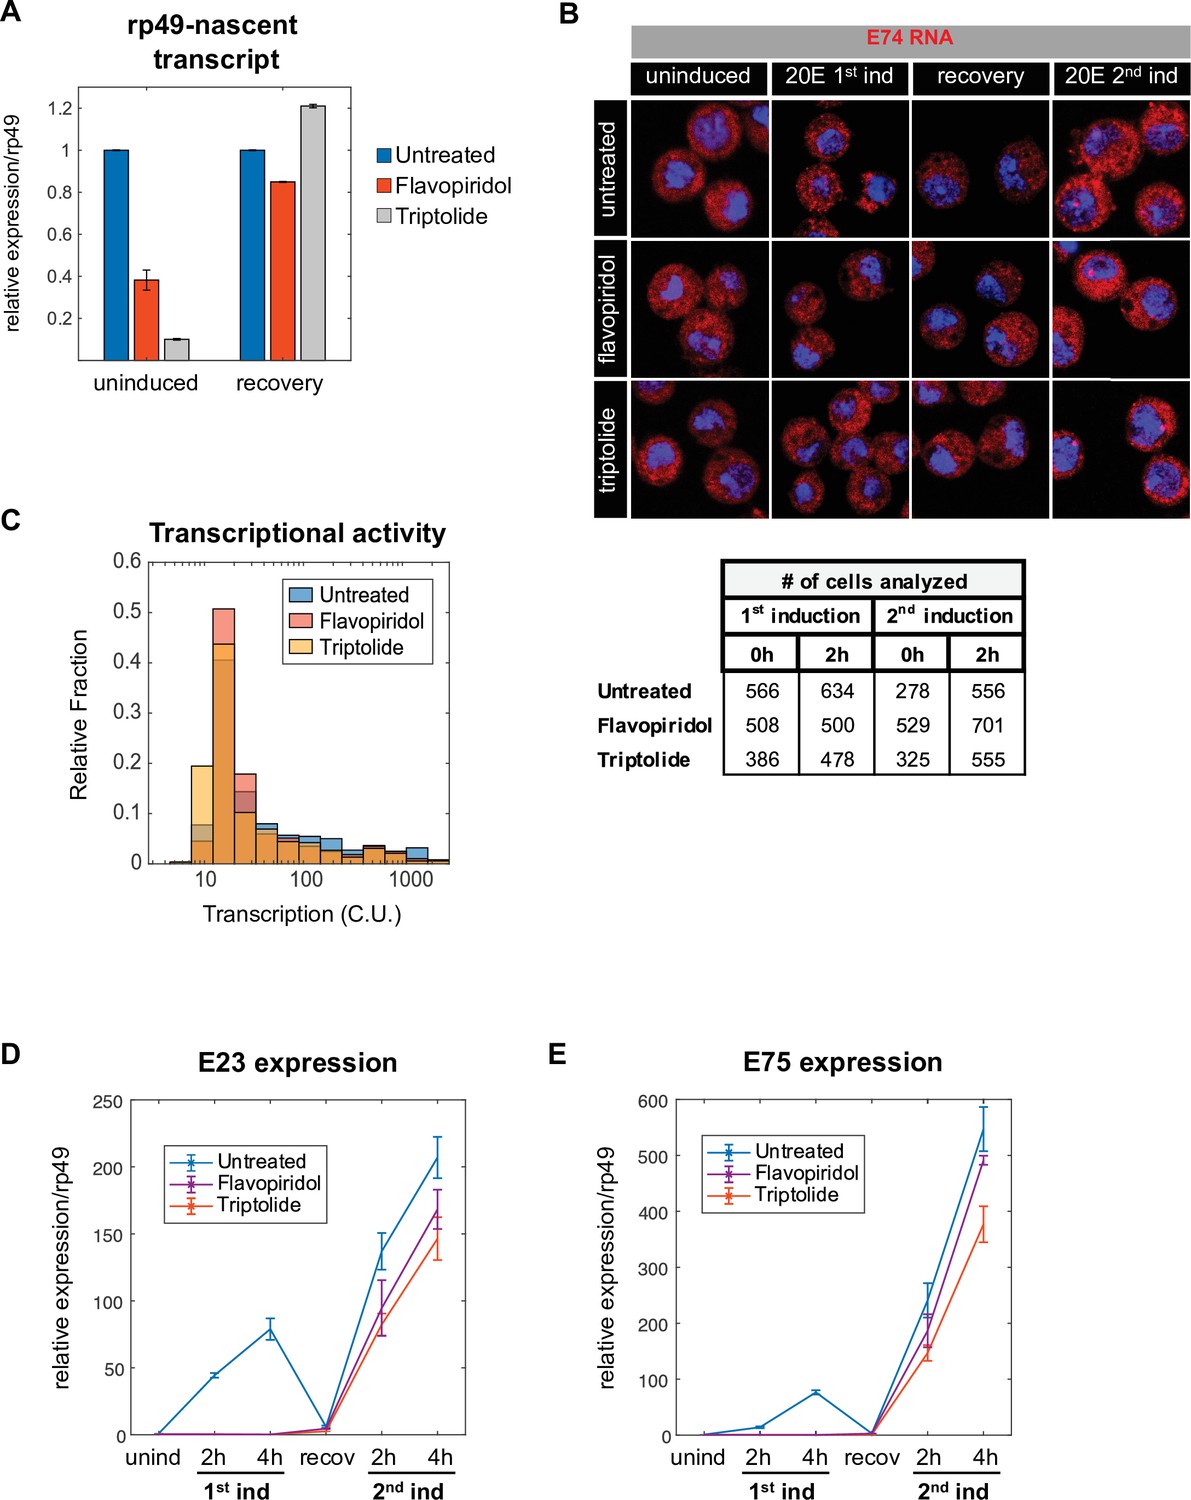
Establishment of the memory state is independent of transcription.
(A) Flavopiridol or Triptolide inhibitors were added 30 min prior to 20E induction and the nascent transcript of housekeeping gene rp49 was used to monitor the efficiency of transcriptional blockage. After 4 hr of induction, the hormone and inhibitor were washed out and cells allowed to recover for 24 hr. qPCR was normalized against spliced rp49 transcript. The data represent the mean of three independent experiments and the error bars the standard deviation of the mean. (B). Representative images of E74 gene in cells treated with Flavopiridol or Triptolide, and analyzed in Figure 5C. (C). Histograms showing the distribution of measured total instantaneous transcriptional activity in normalized units (C.U.) obtained from smFISH of E74 after 2 hr of second induction in untreated, Flavopiridol and Triptolide-treated cells. (D–E). Expression analysis of ecdysone-induced genes: E23 (D) and E75 (E) in cells treated as described in Figure 5B. The data represent the mean of three independent experiments ± standard deviation.
Figure 6
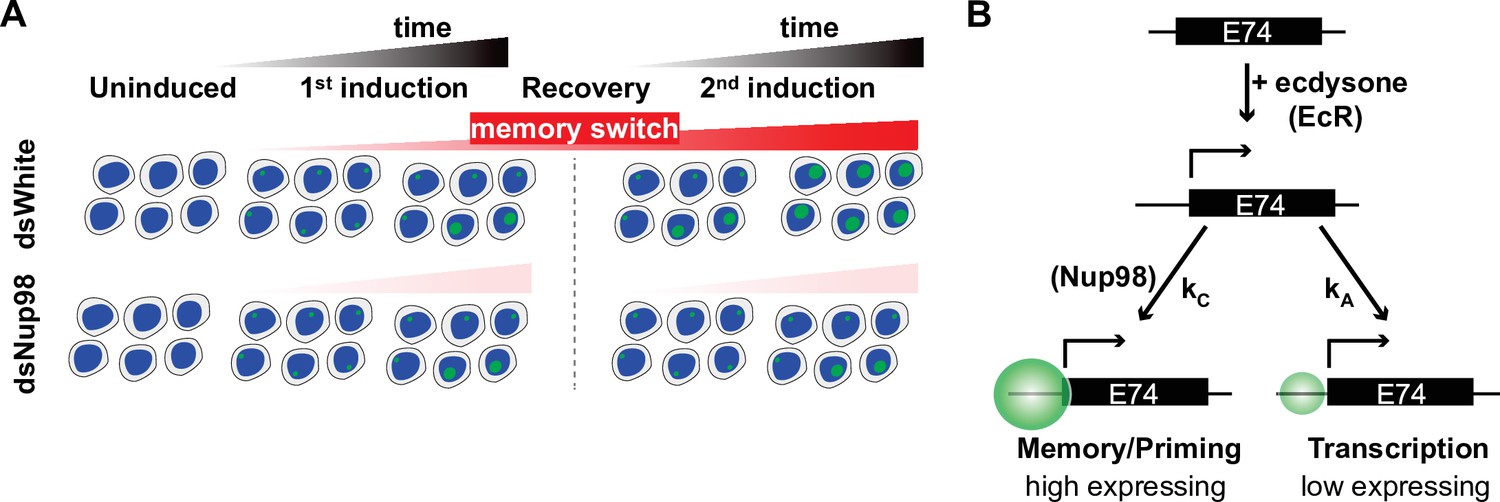
Memory switch model.
(A) Two events are triggered independently by exposure to 20E: loci rapidly enter a low-expressing state and at the same time slowly switch from the default state to memory. Memory is characterized by high transcription rate in the presence of hormone, and importantly, cells continue to accumulate loci in the memory state after the hormone is withdrawn. When cells are exposed to 20E a second time, the converted memory loci transit into the high-expressing state, resulting in a more robust second induction. (B). Implication of the memory switch model: upon hormone exposure, loci engage in two separate activities, controlled by independent rate constants – entry into the active state (controlled by kA) and transition into the memory state (controlled by kC). In the memory switch model, normal levels of Nup98 are required for loci to accumulate and remain in the memory state (kC>>k-C), such that depletion of Nup98 abrogates the maintenance of the memory state upon removal of hormone.
Author response image 1
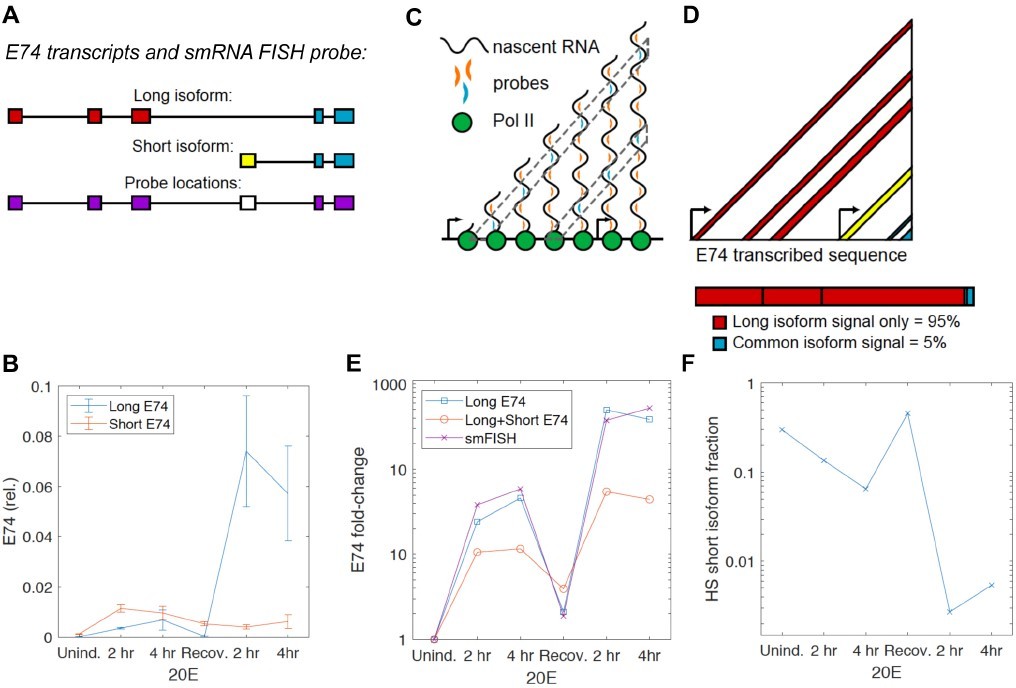
Utilized smRNA FISH probe detects mainly the long isoform of E74.
Tables
Key resources table
| Reagent type (species) or resource | Designation | Source or reference | Identifiers | Additional information |
|---|---|---|---|---|
| Gene (Drosophila melanogaster) | Early gene 23 (E23) | Flybase | FBgn0020445 | |
| Gene (Drosophila melanogaster) | Ecdysone-induced protein 74EF(E74) | Flybase | FBgn0000567 | |
| Gene (Drosophila melanogaster) | Ecdysone-induced protein 75B(E75) | Flybase | FBgn0000568 | |
| Cell line (D. melanogaster) | S2-DRSC | Drosophila Genomics Resource Center (DGRC) | RRID: CVCL_Z992 | |
| Chemical compound, drug | 20-hydroxyecdysone (20E) | Sigma-Aldrich | Cat#: H5142 | |
| Chemical compound | Flavopiridol hydrochloride | Tocris Bioscience | Cat#: 3,094 | |
| Chemical compound | Triptolide | Sigma-Aldrich | Cat#: T3652 | |
| Chemical compound | Fugene HD | Promega | Cat#: E2311 | |
| Chemical compound | Trizol | Ambion | Cat#: 15596018 | |
| Commercial kit | Megascript T7 kit | Ambion | Cat#: AM1334 | |
| Commercial kit | Purelink RNA mini kit columns (; 12183018 A) | Ambion | Cat#: 12183018 A | |
| Commercial kit | QuantiTect RT-PCR | Qiagen | Cat#: 205,311 | |
| Commercial kit | PowerSYBR Green PCR Master Mix | Applied Biosystems | Cat#: 4367659 | |
| Chemical compound | Atto-565 | Sigma-Aldrich | Cat#: 72,464 | |
| Chemical compound | ProLong Gold mountant media | ThermoFisher | Cat#: P36930 | |
| MATLAB | MathWorks | https://www.mathworks.com/ |
Additional files
-
Supplementary file 1
List of primers used in this study.
- https://cdn.elifesciences.org/articles/63404/elife-63404-supp1-v1.xlsx
-
Transparent reporting form
- https://cdn.elifesciences.org/articles/63404/elife-63404-transrepform1-v1.pdf
Download links
A two-part list of links to download the article, or parts of the article, in various formats.
Downloads (link to download the article as PDF)
Open citations (links to open the citations from this article in various online reference manager services)
Cite this article (links to download the citations from this article in formats compatible with various reference manager tools)
Nup98-dependent transcriptional memory is established independently of transcription
eLife 11:e63404.
https://doi.org/10.7554/eLife.63404


