Pore mutation N617D in the skeletal muscle DHPR blocks Ca2+ influx due to atypical high-affinity Ca2+ binding
- Department of Pharmacology, Medical University of Innsbruck, Austria
- Institute of General, Inorganic and Theoretical Chemistry, University of Innsbruck, Austria
Figures
Figure 1
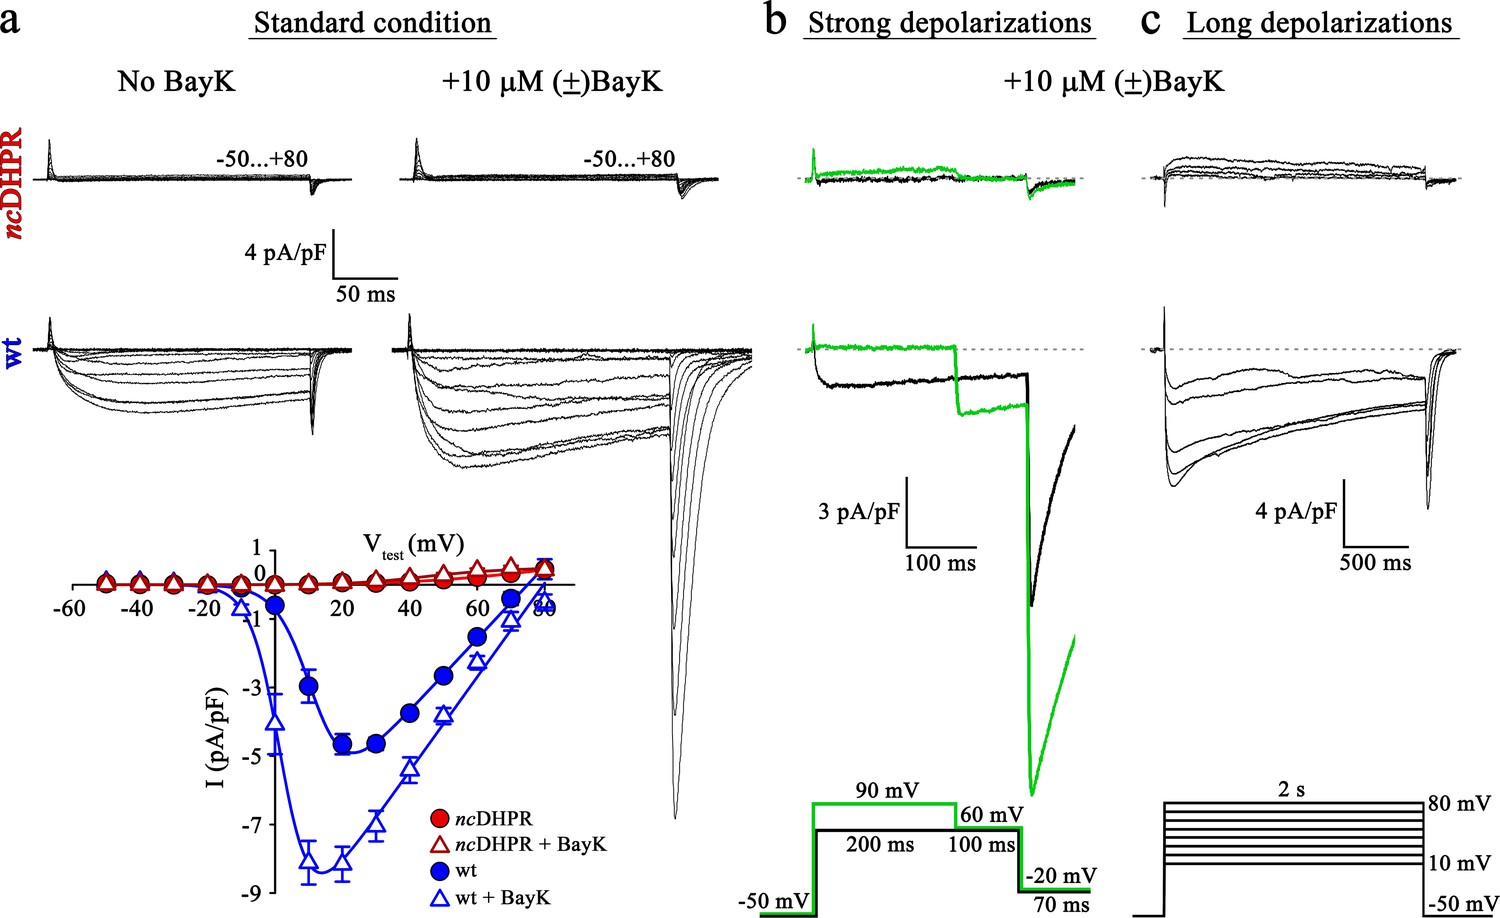
Mutant DHPR(N617D) remains Ca2+ impermeant despite strong or long depolarizations in the presence of DHP agonist Bay K.
(a) Representative whole-cell Ca2+ current recordings elicited by 200 ms depolarizations from −50 to +80 mV from ncDHPR (top) and wt (center) myotubes before (left) and after (right) perfusion with 10 µM of the DHP agonist (±)Bay K 8644. Scale bars, 50 ms (horizontal), 4 pA/pF (vertical). Plots of current-voltage relationship (bottom) indicates lack of DHPR inward Ca2+ currents in the absence (Imax = −0.02 ± 0.01 pA/pF; n = 8) and presence (Imax = −0.02 ± 0.01 pA/pF; n = 5) of (±)Bay K through ncDHPR myotubes, in contrast to significant (p<0.001) augmentation of Ca2+ currents in wt myotubes upon administration of (±)Bay K (No Bay K: Imax = −5.04 ± 0.27 pA/pF; n = 9; with Bay K: Imax = −8.82 ± 0.56 pA/pF; n = 6). (b) 200 ms strong depolarization to +90 mV followed by 100 ms to +60 mV and finally repolarization to −20 mV for 70 ms (bottom, green lines) in the presence of 10 µM (±)Bay K, were unable to evoke inward Ca2+ currents through DHPR(N617D) (top, with +90 mV prepulse: Imax = −0.02 ± 0.02 pA/pF; without +90 mV prepulse: Imax = 0.01 ± 0.02 pA/pF; n = 10). Contrary, wt DHPR displayed significant (p<0.01) depolarization-induced potentiation of inward current at +60 mV (with +90 mV prepulse: Imax = −2.97 ± 0.54 pA/pF; without +90 mV prepulse: Imax = −1.62 ± 0.37 pA/pF; n = 5) (center). Upon subsequent repolarization from +60 mV to −20 mV, the tail current was also considerably larger (p<0.01) after the +90 mV pre-conditioning pulse (Itail = −19.36 ± 3.59 pA/pF; n = 5) (center, green trace) than after the +60 mV pulse (Itail = −10.78 ± 1.99 pA/pF; n = 5) (center, black trace). Statistical significance was calculated using paired t-test. Scale bars, 100 ms (horizontal), 3 pA/pF (vertical). (c) Likewise, 2 s long depolarizations from +10 mV to +80 mV in 10 mV increments (bottom) in the presence of 10 µM (±)Bay K, were unable to induce Ca2+ influx through DHPR(N617D) (top, Imax = −0.05 ± 0.02 pA/pF; n = 5). The same voltage protocol evoked robust inward Ca2+ currents through wt DHPR (center, Imax = −7.69 ± 0.56 pA/pF; n = 5). Scale bars, 500 ms (horizontal), 4 pA/pF (vertical). Data are presented as mean ± SEM; p determined by unpaired Student’s t-test.
-
Figure 1—source data 1
Data for IV graph.
- https://cdn.elifesciences.org/articles/63435/elife-63435-fig1-data1-v3.xlsx
Figure 2
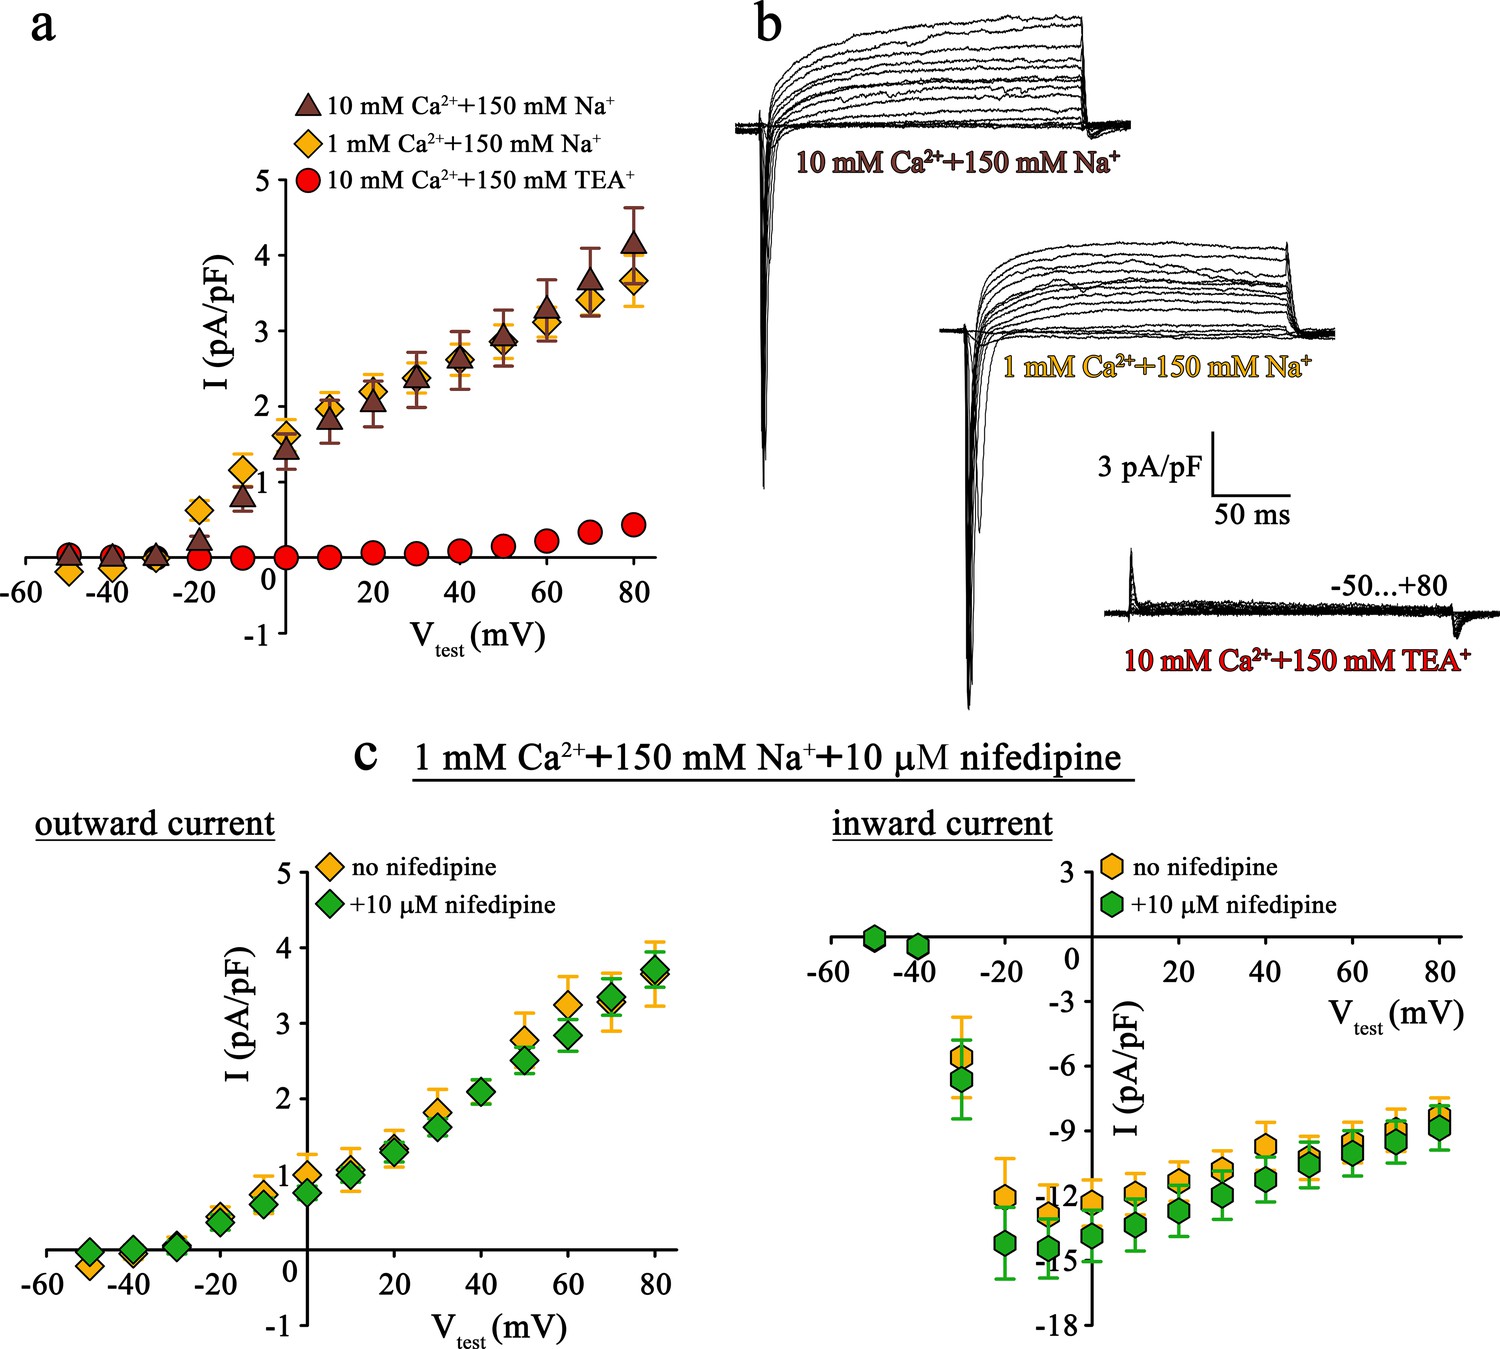
Mutant DHPR(N617D) does not conduct inward Na+ currents in the presence of near physiological [Na+].
(a) Plots of current-voltage relationship for DHPR-mediated Na+ currents recorded from ncDHPR myotubes indicate the absence of slow-activating, non-inactivating inward Na+ currents in the presence of near physiological 150 mM external Na+ with either 10 mM (n = 8) or 1 mM external Ca2+ (n = 9). Control recordings were performed in standard bath solution (150 mM TEA+, 10 mM Ca2+) (n = 8). (b) Representative current recordings from ncDHPR myotubes in response to 200 ms depolarizing test pulses between −50 to +80 mV in the presence of 10 mM Ca2+ with either 150 mM Na+ (top) or 150 mM TEA+ (bottom), or 1 mM Ca2+ with 150 mM Na+ (center) in the bath solution. Scale bars, 50 ms (horizontal), 3 pA/pF (vertical). (c) Plots of current-voltage relationship for ncDHPR myotubes at 150 mM external Na+ and 1 mM external Ca2+ indicate no difference (p>0.05) in outward and inward currents in the presence (n = 10) and absence (n = 6) of 10 µM of the 1,4-DHP antagonist nifedipine.
-
Figure 2—source data 1
Data for IV graphs.
- https://cdn.elifesciences.org/articles/63435/elife-63435-fig2-data1-v3.xlsx
Figure 3
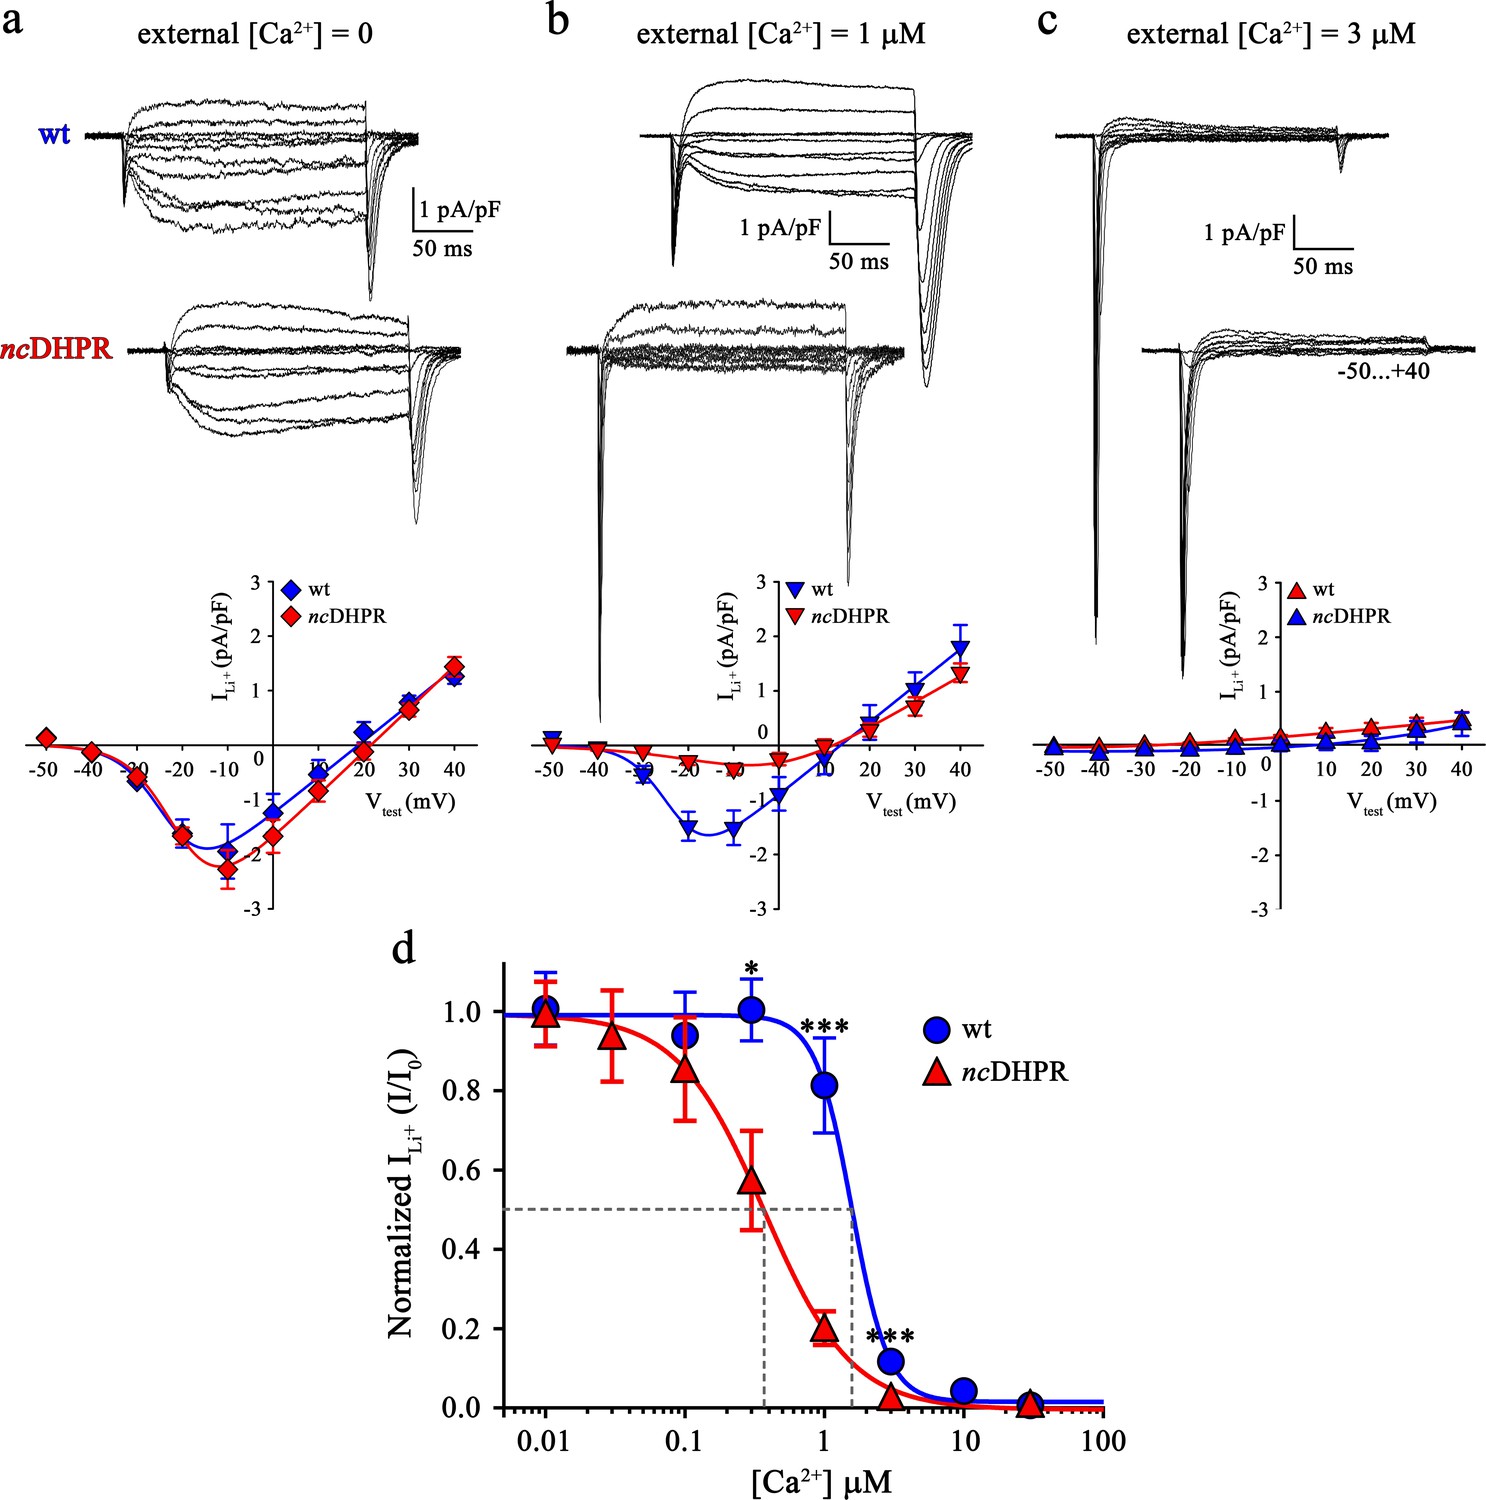
Binding of Ca2+ ions with nanomolar affinity within the pore of mutant DHPR(N617D) precludes Ca2+ permeation.
Representative whole-cell Li+ current recordings from wt and ncDHPR myotubes in response to 200 ms depolarizations from −50 to +40 mV in the presence of 100 mM external Li+ and either 0 (a), 1 µM (b) or 3 µM (c) free external Ca2+. Scale bars, 50 ms (horizontal), 1 pA/pF (vertical). Plots of current-voltage relationship are depicted at the bottom of the corresponding representative Li+ current traces. Inward Li+ currents with no blocking ion (free [Ca2+]=0) were indistinguishable (p>0.05) between ncDHPR (Imax = −2.32 ± 0.35 pA/pF; n = 16) and wt (Imax = −2.07 ± 0.47 pA/pF; n = 9) myotubes (a, bottom). However, at higher external [Ca2+] of 1 µM (b) and 3 µM (c), inward Li+ currents were significantly (p<0.001) smaller in ncDHPR (Imax = −0.47 ± 0.10 pA/pF, n = 8; Imax = −0.06 ± 0.02 pA/pF; n = 7, respectively) compared to wt myotubes (Imax = −1.68 ± 0.25 pA/pF, n = 6; Imax = −0.24 ± 0.04 pA/pF; n = 6, respectively). (d) Four-parameter fitted concentration-response curves of Ca2+ block of inward Li+ currents for wt and mutant ncDHPR. Averaged I/I0 peak currents are plotted as a function of free external Ca2+ concentrations (up to 30 µM) and each data point is an average of 5–16 myotubes (Table 1). There is a significant (p<0.01) shift in IC50 (grey dotted lines) between wt (IC50 = 1.57 µM) and ncDHPR (IC50 = 0.37 µM) indicating a 4.2-fold higher Ca2+ pore-binding affinity in the mutant DHPR(N617D) channel. Data are presented as mean ± SEM; p determined by unpaired Student’s t-test.
-
Figure 3—source data 1
Data for dose-response graph.
- https://cdn.elifesciences.org/articles/63435/elife-63435-fig3-data1-v3.xlsx
Figure 4
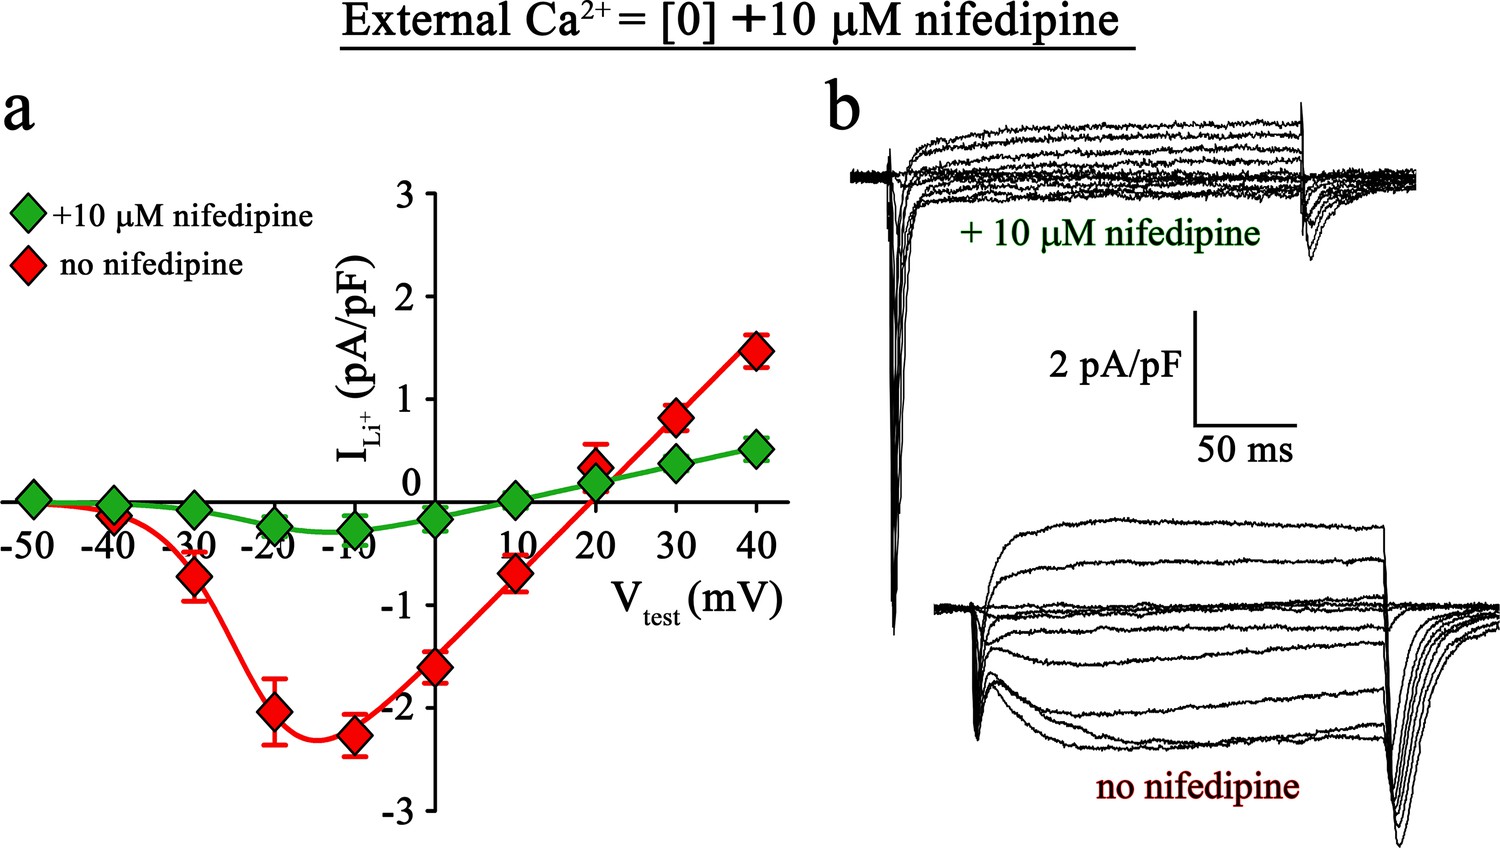
Inward Li+ currents conducted by DHPR(N617D) are sensitive to nifedipine block.
(a) Plots of current-voltage relationship for DHPR-mediated Li+ currents recorded from ncDHPR myotubes in the presence (Imax = −0.35 ± 0.13 pA/pF; n = 16) and absence (Imax = −2.41 ± 0.27 pA/pF; n = 11) of 10 µM of the 1,4-DHP antagonist nifedipine, 100 mM external Li+, and free external Ca2+ = [0]. Maximum inward Li+ currents were significantly (p<0.001) reduced in the presence of nifedipine. (b) Representative whole-cell Li+ current recordings from ncDHPR myotubes in response to 200 ms depolarizations from −50 to +40 mV in the presence (upper) and absence (lower) of 10 µM nifedipine with 100 mM external Li+ and 0 external Ca2+ concentration. Scale bars, 50 ms (horizontal), 2 pA/pF (vertical). Data are presented as mean ± SEM; p determined by unpaired Student’s t-test.
-
Figure 4—source data 1
Data for IV graph.
- https://cdn.elifesciences.org/articles/63435/elife-63435-fig4-data1-v3.xlsx
Figure 5 with 1 supplement

Ca2+ selectivity and conductance mechanisms in the wt and mutant DHPR(N617D) channel pore.
(a, b) De novo conformation prediction of peptide F600 - I624 constituting the selectivity filter and adjacent pore helices P1 and P2 of DHPRα1S repeat II (P1II, P2II) (left) and of peptide F1309 - S1333 forming the opposite repeat IV (P1IV, P2IV) (right), using the program PEP-FOLD 3.5 (Thévenet et al., 2012) on the RPBS web portal. Resulting clusters from 200 independent simulations were sorted by sOPEP energy (Wang et al., 2011) to yield the ‘best model’ prediction. Biasing the model prediction of these peptides by imposing the reference structure of DHPRα1S according to the Protein Data Bank (PDB accession number 5GJV) (Wu et al., 2016) did not lead to major differences compared to unbiased modeling approaches and hence we used unbiased models for the wt (a) and DHPR(N617D) (b) inner channel pore. Depicted best models are graphical overlays of cartoon and balls and sticks input style options. Models depict the hypothetical mechanism of Ca2+ conductance through the wt DHPR (a) and the block of Ca2+ conductance due to atypical high Ca2+ binding affinity (because of introduction of the negative charge D617; boxed in red) in the DHPR(N617D) pore region. Dotted lines indicate binding interactions between Ca2+ ions (blue spheres) and carboxyl oxygens (red balls) of glutamate E292 and aspartate D296 of repeat I, E614, D615, and D617 of repeat II, E1014 of repeat III, as well as E1323 and E1327 of repeat IV. Low affinity Ca2+ binding is indicated with a light blue sphere and high-affinity binding with dark blue spheres. DCS locus is the divalent cation selectivity filter (Cens et al., 2007) and EEEE locus is the Ca2+ selectivity filter. Vertical blue arrows indicate active Ca2+ conductance pathway in wt DHPR (a) and red T-bar indicates block of Ca2+ flux by aberrant high-affinity binding to the DCS locus in the mutant DHPR(N617D) channel pore (b). See Figure 5—figure supplement 1 for additional blocking strategies of DHPR Ca2+ conductance in the evolution of skeletal muscle EC coupling.
Figure 5—figure supplement 1
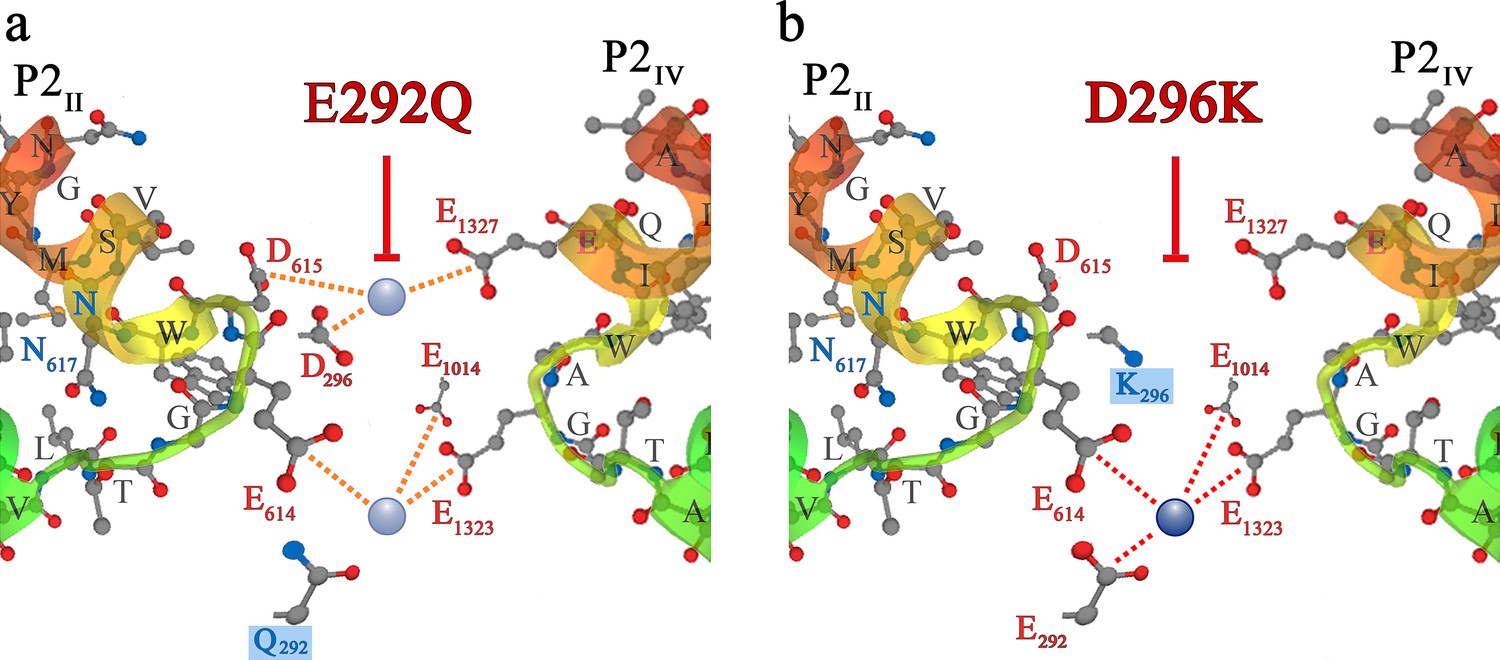
Additional blocking strategies of DHPR Ca2+conductance in the evolution of skeletal muscle EC coupling.
Symbols and nomenclature are identical to Figure 5. (a) Zebrafish slow-muscle specific DHPRα1S carries a distorted EEEE locus, due to substitution of E292 of repeat I by Q. Exchange of E292 with Q292 (boxed in blue) in rabbit DHPRα1S yielded mutant DHPR(E292Q) which lacks Ca2+ conductance (red T-bar) due to alteration of the high-affinity EEEE locus to a low affinity QEEE motif. (b) In phylogenetically advanced teleost species, the DCS locus is distorted due to charge conversion, that is exchange of D with K in repeat I. Substitution of D296 with K296 (boxed in blue) in rabbit DHPRα1S yielded mutant DHPR(D296K), which lacks Ca2+ conductance (red T-bar) due to non-binding of Ca2+ to the DCS locus and thus, lack of the attraction mechanism for t-tubular Ca2+.
Figure 6 with 2 supplements
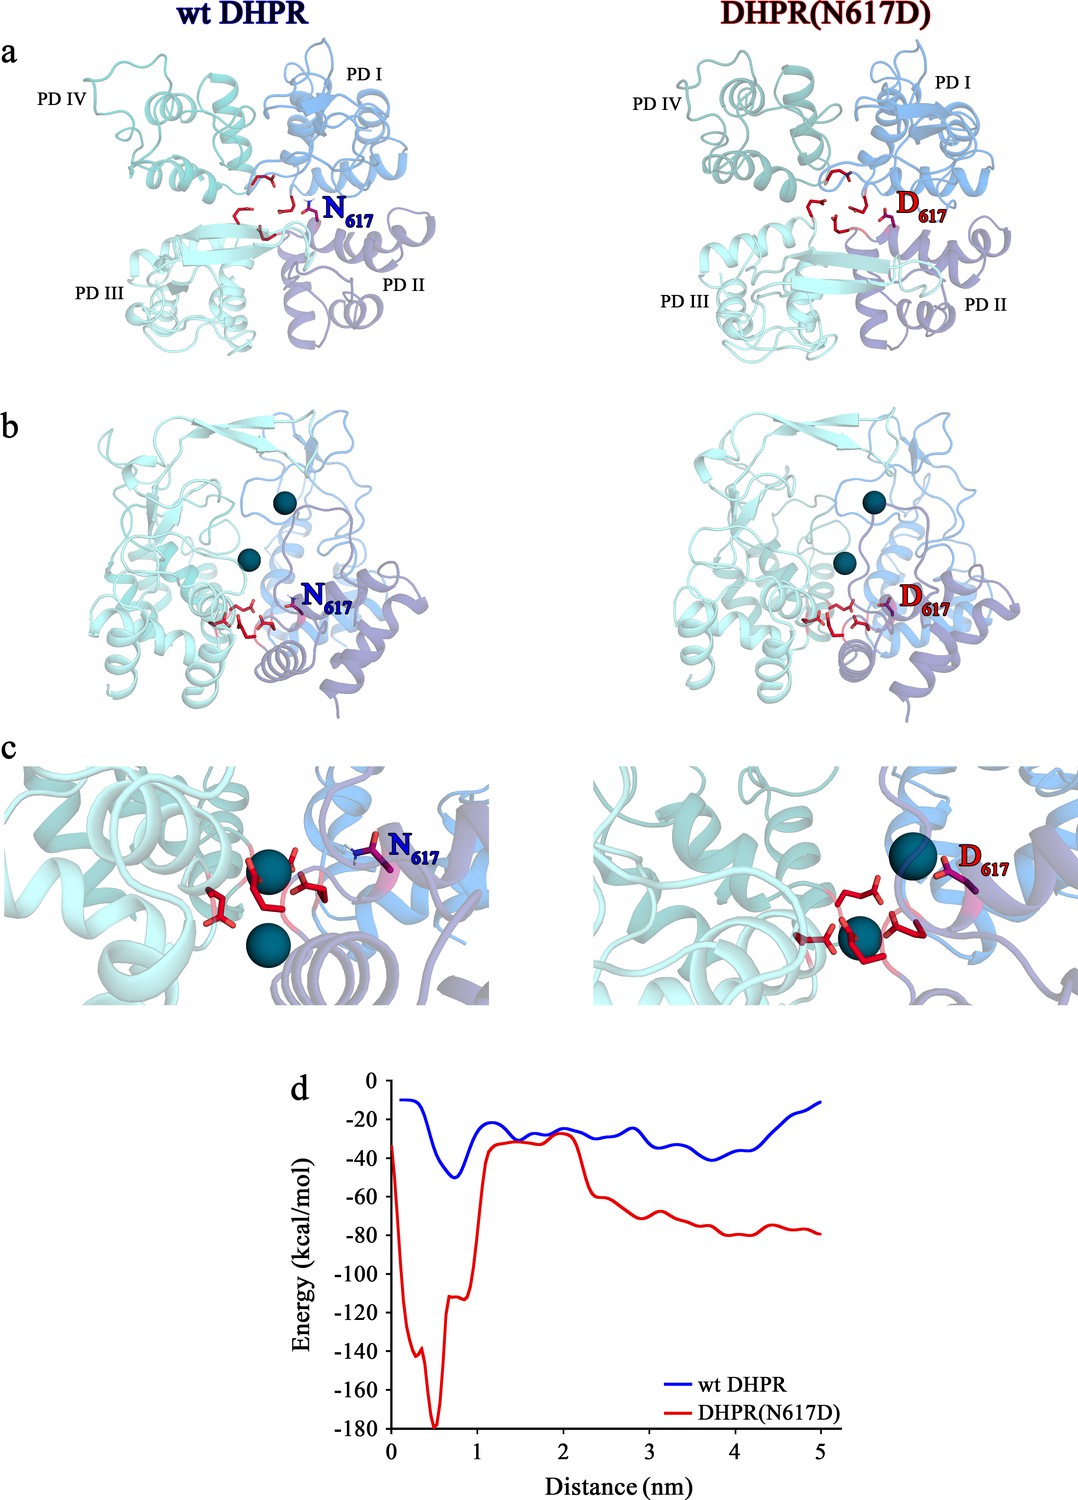
Structure models of selectivity filter regions of wt DHPR (left panels) and mutant DHPR(N617D) channel pores (right panels) showing the movements of Ca2+ ions in simulation studies.
(a) Top view of the pore illustrating the EEEE and DCS loci. The residues of the EEEE locus are displayed in red and the DCS locus is indicated by the position of the residues N617 or D617. (b) Side view of wt DHPR and mutant DHPR(N617D) pores with Ca2+ ions present in the pore before starting the equilibration. The dark blue spheres represent van der Waals radii of the Ca2+ ions. (c) Snap-shots immediately following the equilibration run show that Ca2+ ions already moved towards the DCS and EEEE loci. While the front Ca2+ ion already leaves the selectivity filter of the wt DHPR toward the cytosolic side, Ca2+ ions in the DHPR(N617D) pore are still bound to the DCS and EEEE loci. (d) Free energy estimations from metadynamics simulations capturing the movements of Ca2+ ions through the selectivity filter region. The free energy profile for the passage of Ca2+ ions through wt DHPR selectivity filter is depicted in blue and for mutant DHPR(N617D) in red. The energy barrier of the Ca2+ ion leaving the wt DHPR selectivity filter (15 ± 4 kcal/mol; n = 5) is significantly smaller (p<0.001) compared to DHPR(N617D) (122 ± 20 kcal/mol; n = 5). The process was described by a one-dimensional collective variable that is, the displacement of a Ca2+ ion along the axis of the channel pore. A second Ca2+ was directly present in the simulation domain. Thus, the energy profile corresponds to the energy experienced by the first Ca2+ ion in the presence of the second one. See Figure 6—video 1 and Figure 6—video 2 for illustration of the movement of Ca2+ ions through the selectivity filter region of wt DHPR and DHPR(N617D) channel pores, respectively.
Figure 6—video 1
Movement of Ca2+ ions through the EEEE locus of the wt DHPR pore toward the cytosolic side.
The dark blue spheres represent van der Waals radii of Ca2+ ions. The residues of the EEEE locus are displayed in red.
Figure 6—video 2
Movement of Ca2+ ions through the DCS and EEEE loci of the DHPR(N617D) pore.
Ionic interactions between D617 of the DCS locus and the upper Ca2+ ion are reflected by the slow detachment and thus slow migration of the Ca2+ ion toward the cytosolic side, suggesting occlusion of the pore without the force applied during simulations that pulls the Ca2+ ions through the pore.
Tables
Table 1
Effect of varying free external Ca2+ concentrations on peak inward Li+ currents (Imax) in wt and ncDHPR myotubes.
Imax values of inward ILi+ are represented as mean ± SEM with corresponding number of recordings (n) from wt and ncDHPR myotubes. *p<0.05; ***p<0.001, unpaired Student’s t-test.
| Free [Ca2+] | wt | ncDHPR | ||
|---|---|---|---|---|
| Imax (pA/pF) | n | Imax (pA/pF) | n | |
| 0 | −2.07 ± 0.47 | 9 | −2.32 ± 0.35 | 16 |
| 10 nM | −2.08 ± 0.19 | 6 | −2.30 ± 0.19 | 12 |
| 30 nM | ‒ | ‒ | −2.17 ± 0.27 | 12 |
| 100 nM | −1.94 ± 0.23 | 5 | −1.98 ± 0.30 | 9 |
| 300 nM | −2.08 ± 0.16 | 8 | −1.33 ± 0.29 * | 8 |
| 1 µM | −1.68 ± 0.25 | 6 | −0.47 ± 0.10 *** | 8 |
| 3 µM | −0.24 ± 0.04 | 6 | −0.06 ± 0.02 *** | 7 |
| 10 µM | −0.09 ± 0.05 | 6 | ‒ | ‒ |
| 30 µM | −0.01 ± 0.02 | 5 | −0.02 ± 0.02 | 8 |
Key resources table
| Reagent type (species) or resource | Designation | Source or reference | Identifiers | Additional information |
|---|---|---|---|---|
| Strain, strain background (Mus musculus) | ncDHPR | doi:10.1038/s41467-017-00629-x Dayal et al., 2017 | ||
| Chemical compound, drug | (±)Bay K 8644 | Sigma-Aldrich | Cat#: B112 | 10 µM |
| Chemical compound, drug | Nifedipine | Sigma-Aldrich | Cat#: N7634 | 10 µM |
| Chemical compound, drug | Tetraethylammonium chloride (TEA-Cl) | Sigma-Aldrich | Cat#: T2265 | 145 mM |
| Chemical compound, drug | N-benzyl-p-toluene sulphonamide (BTS) | Santa Cruz Biotechnology, Inc | Cat#: sc-202087 | 100 µM |
| Software, algorithm | MaxChelator simulation program | https://somapp.ucdmc.ucdavis.edu/pharmacology/bers/maxchelator/ | RRID:SCR_018807 | |
| Software, algorithm | ClampFit | Axon Instruments | version 10.7 | |
| Software, algorithm | SigmaPlot | Systat Software, Inc. | RRID:SCR_010285 | version 11.0 |
| Software, algorithm | GraphPad Prism | GraphPad Software, LLC | RRID:SCR_002798 | version 8 |
| Software, algorithm | PEP-FOLD 3.5 | RPBS web portal | Version 3.5 | |
| Software, algorithm | GROMACS | University of Stockholm, University of Upsala | RRID:SCR_014565 | version 2019.2 |
| Software, algorithm | MOE | Chemical Computing Group ULC | RRID:SCR_014882 | version 2020.01 |
| Software, algorithm | AMBER | University of California, San Francisco. | RRID:SCR_014230 | Version 2020 |
| Software, algorithm | PyMOL | Schrödinger, LLC | RRID:SCR_000305 | Version 2.4.0 |
Additional files
-
Supplementary file 1
Composition of external solutions with different free Ca2+concentrations used for recording Ca2+ block of inward ILi+.
The indicated free Ca2+ concentrations in the bath solutions were achieved by adjusting the concentrations of CaCl2 and TEA-Cl, calculated using the MaxChelator simulation program (https://somapp.ucdmc.ucdavis.edu/pharmacology/bers/maxchelator/).
- https://cdn.elifesciences.org/articles/63435/elife-63435-supp1-v3.docx
-
Transparent reporting form
- https://cdn.elifesciences.org/articles/63435/elife-63435-transrepform-v3.pdf
Download links
A two-part list of links to download the article, or parts of the article, in various formats.
Downloads (link to download the article as PDF)
Open citations (links to open the citations from this article in various online reference manager services)
Cite this article (links to download the citations from this article in formats compatible with various reference manager tools)
Pore mutation N617D in the skeletal muscle DHPR blocks Ca2+ influx due to atypical high-affinity Ca2+ binding
eLife 10:e63435.
https://doi.org/10.7554/eLife.63435


