Spatiotemporal recruitment of RhoGTPase protein GRAF inhibits actomyosin ring constriction in Drosophila cellularization
- Biology, Indian Institute of Science Education and Research, India
Figures
Figure 1 with 2 supplements
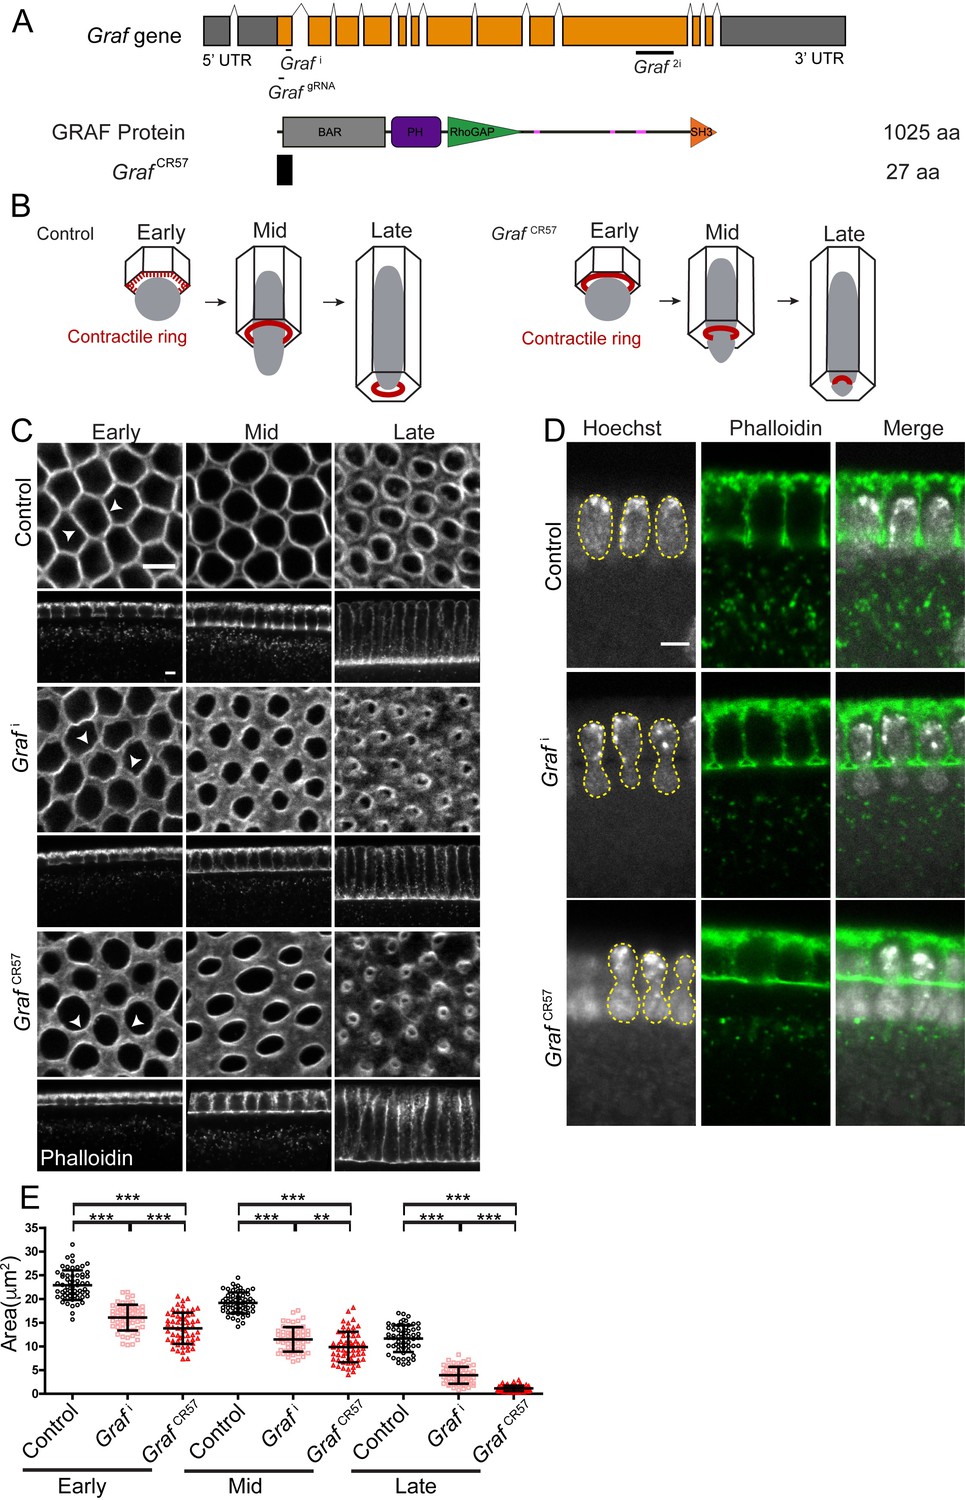
GRAF depletion leads to hyper constriction of contractile rings during cellularization.
(A) GRAF genomic locus is shown with UTR, introns and exons. Grafi, GrafgRNA target the exon 1 region, and Graf2i targets the exon 10 region. GRAF protein (1025aa) contains a BAR, PH, RhoGAP and SH3 domain. GrafCR57 has a stop codon at amino acid 28 and is predicted to form a 27aa peptide. (B) Schematic depiction of cellularization in the Drosophila embryo with plasma membrane (black), nuclei (gray) and contractile ring (red) organization at the base of the furrow. The base of the furrow where the contractile ring assembles is hexagonal at the early stage, circular at the mid stage and constricted at the late stage. GrafCR57 mutant embryos show premature ring formation in the early stage and hyper constriction in mid and late stages with nuclei getting squeezed to show a bottleneck phenotype. (C–E) GRAF depletion leads to hyper constricted contractile rings in cellularization. (C) Phalloidin (gray)-labeled furrow tip sections show polygonal organization (white arrowhead) in control embryos, nanos-Gal4; Graf i shows circular organization, and GrafCR57 shows ring constriction (white arrowhead) in the early cellularization. Control embryos show circular rings, and Graf i and Graf CR57 embryos show constricted rings in mid cellularization. Control embryos show constricted rings, and Graf i and GrafCR57 embryos show hyper constricted rings in late cellularization (C). Graf i, 95.7% (n = 70 embryos), and GrafCR57, 96.8% (n = 31 embryos), show enhanced constriction as compared to controls (n = 54 embryos) in different stages of cellularization. (D) DNA labeled by Hoechst shows the bottleneck appearance during mid cellularization in Graf i (48.1% show bottleneck nuclei, n = 27 embryos in different stages of cellularization) and GrafCR57 (52.94% show bottleneck nuclei, n = 34 embryos in different stages of cellularization) (yellow line marks nuclei morphology). (E) Scatter plot shows area of the ring in the control, Graf i and Graf CR57 during early (3–6 µm furrow length), mid (6–16 µm) and late (16–40 µm) stages of cellularization (n = 60 rings, 10 per embryo, 6 embryos each). Data is represented as mean ± s.d. **p<0.01, ***p<0.001, two-tailed Mann–Whitney test. Scale bars: 5 µm.
-
Figure 1—source data 1
Plotted values for ring area analysis.
- https://cdn.elifesciences.org/articles/63535/elife-63535-fig1-data1-v2.xlsx
Figure 1—figure supplement 1
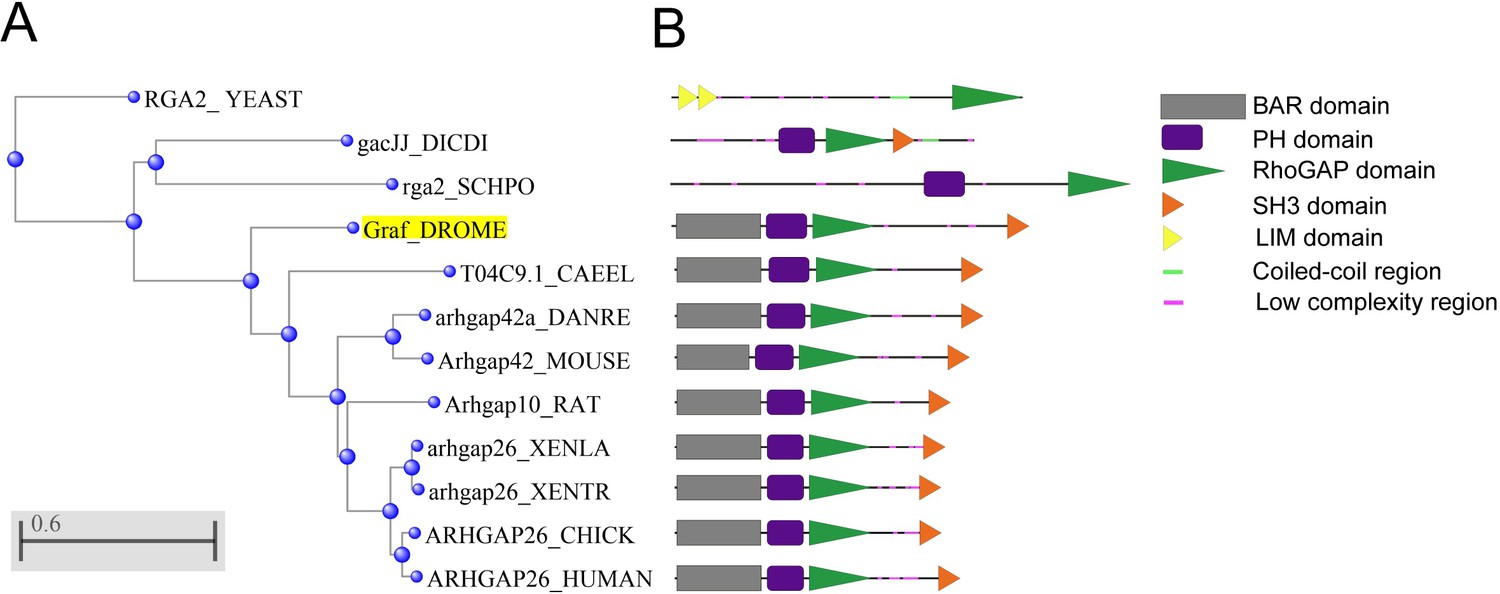
Phylogenetic tree of GRAF across various species.
(A) The amino acid sequences for Drosophila melanogaster GRAF and its orthologs from Schizosaccharomyces cerevisiae (RGA2), Saccharomyces pombe (rga2), Dictyostelium discoideum (gacJJ), Caenorhabditis elegans (T04C9.1), Danio rerio (Arhgap42a), Xenopus laevis (Arhgap26), Xenopus tropicalis (Arhgap26), mouse (Arhgap42) and humans (Arhgap26) amino acid sequence were obtained from UniPort software. These 12 protein sequences were aligned in the NCBI multiple protein blast using the neighbor-joining method. The Drosophila GRAF protein is highlighted in yellow. (B) The domains present in each species are marked in each of the 12 proteins. Multicellular organisms from C. elegans to humans in the list contain a conserved BAR, PH, RhoGAP and SH3 domain from the N terminus to the C terminus. Bar represents the number of substitution events per site.
Figure 1—figure supplement 2

GRAF knockdown phenotypes and the Crispr-Cas9 strategy for generating a GRAF null mutant.
(A) Graf2i and Grafgrna expressing embryos enhanced ring constriction. Phalloidin (gray)-stained control embryos in early cellularization show polygonal organization of the furrow tip, whereas Graf2i and GrafgRNA, nanos-Cas9 show rings. In mid cellularization, control embryos show circular rings and Graf2i and GrafgRNA; nanos-Cas9 expressing embryos show constricted rings. In late cellularization, control embryos (n = 54 embryos) show constricted rings, and Graf2i (95.23% showed enhanced constriction in cellularization, n = 21 embryos) and GrafgRNA; nanos-Cas9 (89.18% showed enhanced constriction in cellularization, n = 37 embryos) embryos hyper constricted rings. (B) Graf null mutant generation using the Crispr-Cas9 strategy. Females containing the nanos-Cas9 transgene were crossed to males containing a transgene that ubiquitously expresses GrafgRNA against exon 1. The F1 generation males containing the nanos-Cas9 and GrafgRNA were crossed with homozygous FM7a virgin females. Exon 1 of the Graf gene will get cleaved by Cas9 during spermatogenesis and be subjected to DNA repair by the non-homologous end joining (NHEJ) pathway. The F2 generation virgin females containing the putative mutant X chromosome and FM7a balancer were crossed individually to FM7a males. Several lines containing homozygous flies that gave reduced progeny were obtained. 18 lines that gave reduced progeny and 3 lines that served as healthy controls were used for confirmation of mutations in exon 1 of Graf. PCR was carried out for exon 1 from genomic DNA of these flies and sent for sequencing. (C) The table shows mutations obtained in exon 1 from DNA sequencing. The 18 lines showing reduced progeny gave small insertions and deletions that led to a frameshift and a stop codon. The three lines that served as healthy controls also gave small insertions or deletions, and the frame of the Graf gene was intact in these lines.
Figure 2 with 1 supplement

GRAF protein is enriched at the furrow in mid cellularization.
(A–C) GRAF localizes at the furrow tips in cellularization. (A) Control embryos (n = 36 embryos) immunostained with GRAF (red) and Dlg (green) show GRAF enrichment at the furrow tip in early and mid cellularization (white arrowhead shows edge enrichment, whereas yellow arrowhead shows curved region with weaker signal). GRAF is decreased from the furrow tip in late cellularization. GrafCR57 (100%, n = 11) embryos show depletion of GRAF antibody in cellularization. (B) Quantification of GRAF antibody fluorescence intensity as cortex to cytosol ratio shows increased staining in mid cellularization as compared to early and late cellularization (n = 25 rings, 5 per embryo, 5 embryos per stage, 25 embryos) (furrow length used for early = 4–6 µm, mid = 7–11 µm, late = 17–31 µm). (C) GrafCR57 (furrow length range: 3–24 µm) shows loss of GRAF antibody staining intensity compared to controls (furrow length range: 5–25 µm) (n = 30 rings, 5 per embryo, 6 embryos). Data is represented as mean ± s.d. ***p<0.001, two-tailed Mann–Whitney test. (D, E) GRAF-GFP (D, green) colocalizes with Sqh-mCherry (D, red) in early and mid cellularization, whereas GRAF-GFP is cytosolic in late cellularization. Yellow arrowhead in sagittal images shows furrow tip enrichment in mid cellularization, whereas it reduces at the tip in late cellularization. These are representative images from one of n = 3 embryos. (E) The yellow bar depicted in the merged image is used for quantification shown in the plots. Scale bars: 5 µm.
-
Figure 2—source data 1
Plotted values for fluorescence intensity analysis.
- https://cdn.elifesciences.org/articles/63535/elife-63535-fig2-data1-v2.xlsx
Figure 2—figure supplement 1
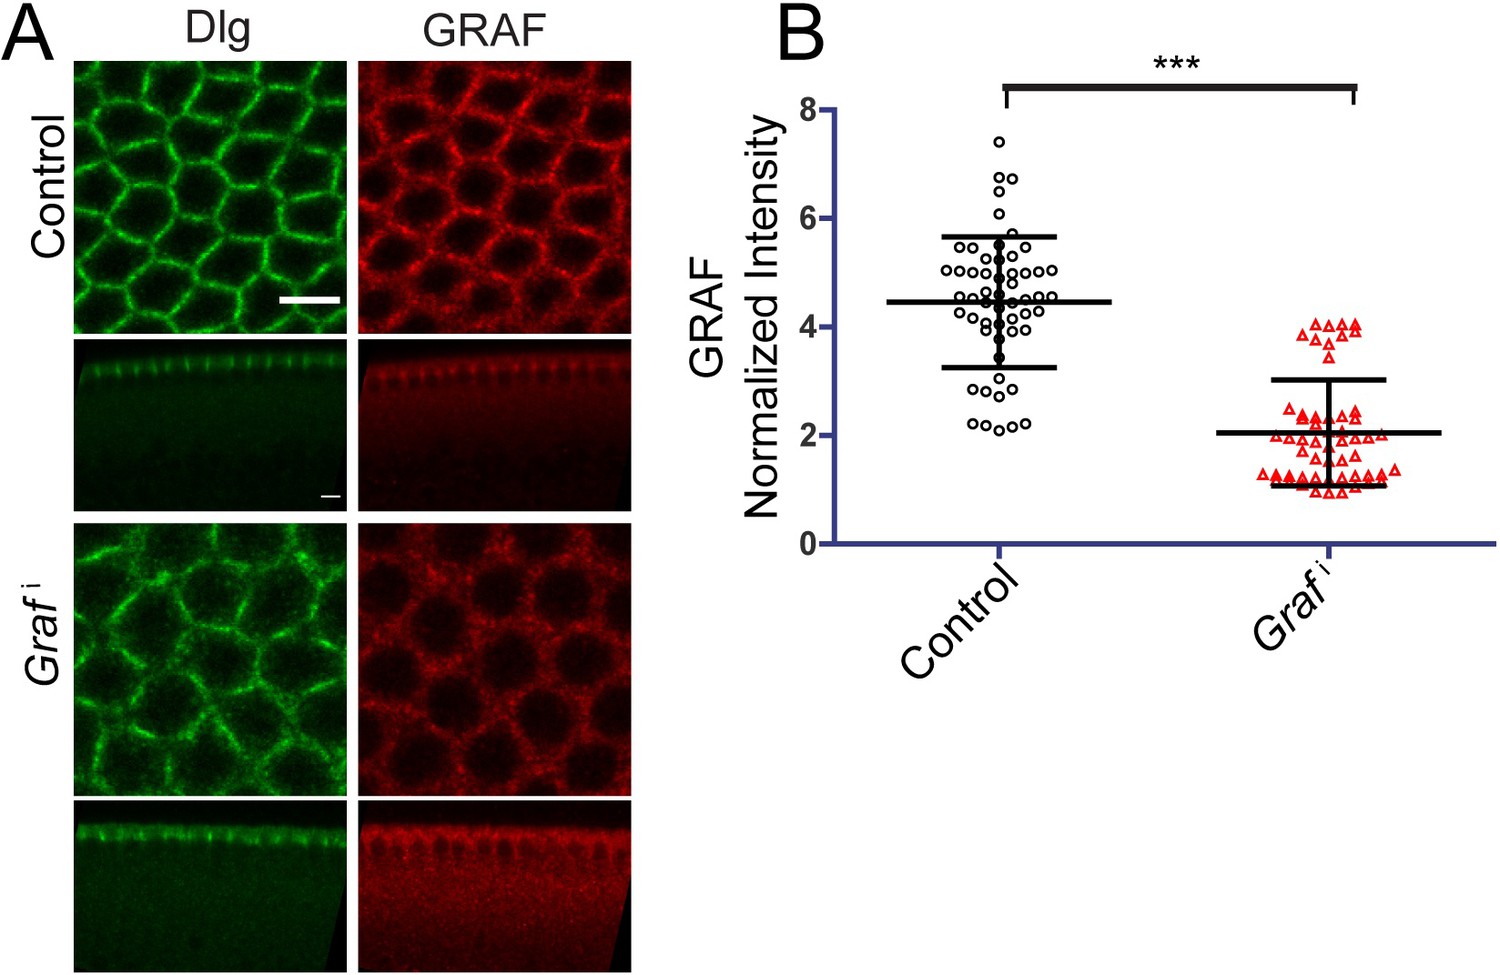
GRAF knockdown shows reduction in GRAF antibody staining in cellularization.
(A) Grafi shows decrease in GRAF antibody staining compared to control embryos (64%, n = 14 embryos). (B) Quantification of GRAF antibody fluorescence intensity as cortex to cytosol ratio shows reduction of intensity in Grafi (furrow length range: 3–20 µm) compared to controls (furrow length range: 3–14 µm) (n = 55 rings, 5 per embryo, 11 embryos each). Data is represented as mean ± s.d. ***p<0.001 (two-tailed Mann–Whitney test). Scale bars: 5 µm.
-
Figure 2—figure supplement 1—source data 1
Plotted values for fluorescence intensity analysis.
- https://cdn.elifesciences.org/articles/63535/elife-63535-fig2-figsupp1-data1-v2.xlsx
Figure 3

Graf mutant embryos show hyper contractility during early and mid cellularization.
Laser ablation was performed using line at the furrow tip during early and mid cellularization. (A, E) Representative images show control and GrafCR57 mutant embryos with the region before, at 0 s (marked with yellow dotted line) and 70 s after ablations (recoil region marked with yellow dotted line) in early and mid cellularization, respectively. (B, F) Quantifications of ring displacement after laser ablation during early and mid phase (control:black line, n = 5 embryos; GrafCR57 mutant:red line, n = 5 embryos each). (C,D,G,H) Scatter plot showing maximum displacement (C, G) of ring and initial recoil velocity (D, H) after laser ablation during early and mid phase (n = 5 embryos each). Data is represented as mean ± s.d.**p<0.01, ***p<0.001, two-tailed Mann–Whitney test.
-
Figure 3—source data 1
Plotted values for displacement and initial recoil velocity.
- https://cdn.elifesciences.org/articles/63535/elife-63535-fig3-data1-v2.xlsx
Figure 4 with 1 supplement
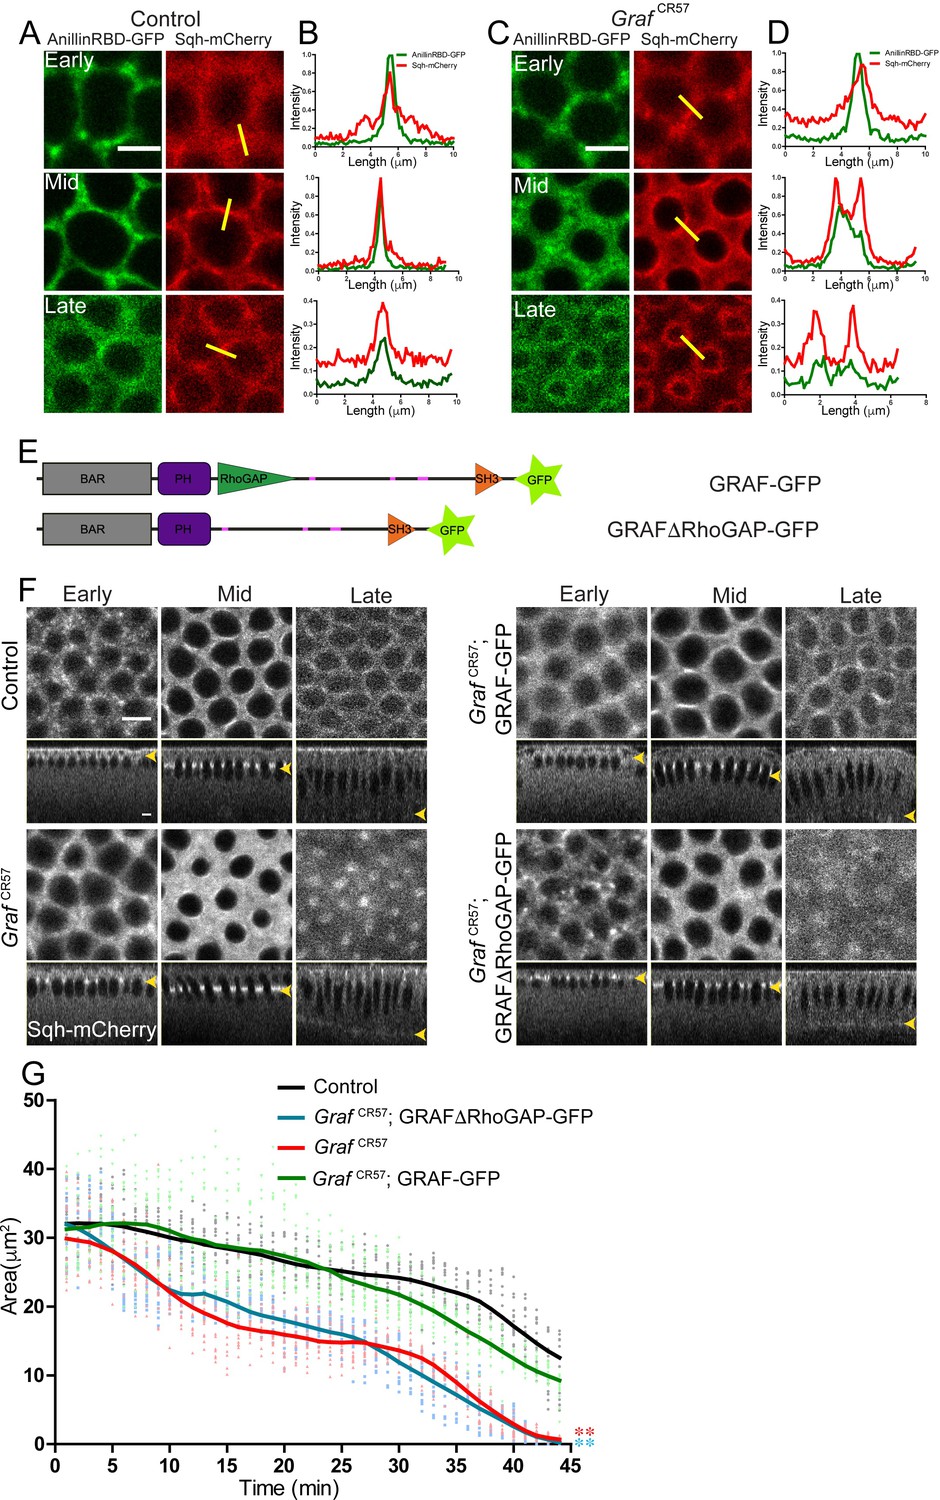
RhoGAP domain of GRAF is essential for ring constriction in cellularization.
(A–D) AnillinRBD-GFP (A, C, green) colocalizes with Sqh-mCherry (red) in early, mid and late cellularization in controls. In GrafCR57; AnillinRBD-GFP, the signal is more spread as compared to in between adjacent rings. Representative images from one of n = 3 embryos of controls and GrafCR57 are shown. (B, D) A yellow bar depicted in the Sqh-mCherry image is used for the estimation of the intensity line profile. (E) Schematic showing full-length GRAF protein with GFP and GRAFΔRhoGAP-GFP proteins. (F) GrafCR57 and GrafCR57;GRAFΔRhoGAP-GFP embryos expressing Sqh-mCherry show hyper constriction compared to controls and Graf CR57; GRAF-GFP (yellow arrowhead highlights furrow tip at all stages). (G) Quantification shows a significantly lower ring area for Graf CR57, Graf CR57;GRAFΔRhoGAP-GFP as compared to controls and Graf CR57; GRAF-GFP expressing Sqh-mCherry (n = 15 rings, 5 rings per embryo, 3 embryos). Data is represented as mean ± s.d. ***p<0.001, one-way ANOVA, repeated measure with Dunnett’s multiple comparison test, the Graf CR57 and GrafCR57;GRAFΔRhoGAP-GFP mutant curves are statistically different when compared to the controls and GrafCR57;GRAF-GFP. Scale bars: 5 µm.
-
Figure 4—source data 1
Plotted values for fluorescence intensity and ring area analysis.
- https://cdn.elifesciences.org/articles/63535/elife-63535-fig4-data1-v2.xlsx
Figure 4—figure supplement 1
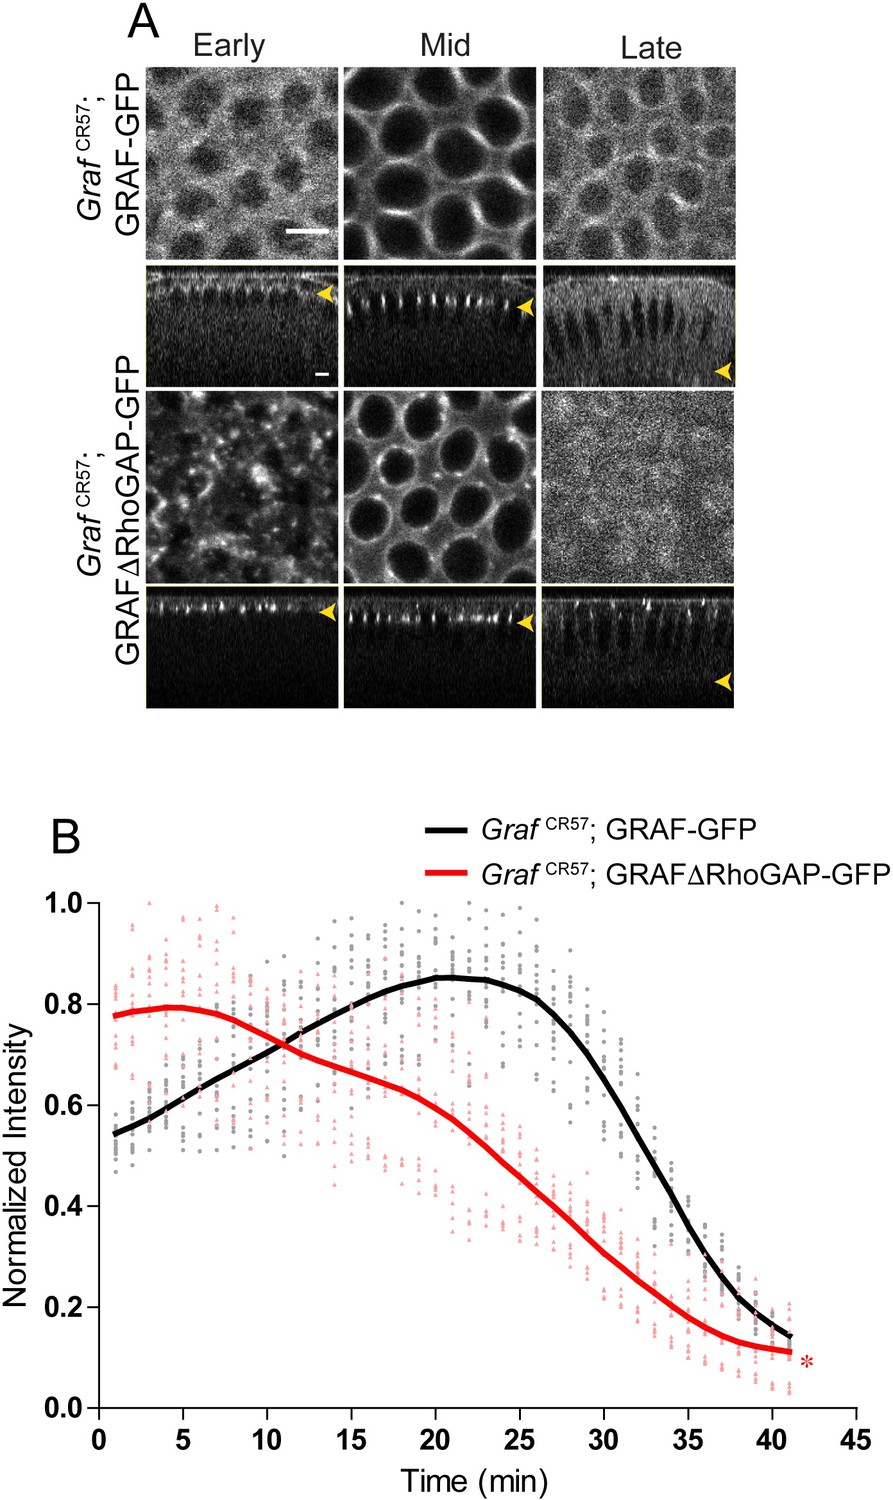
GrafCR57;GRAFΔRhoGAP-GFP recruitment dynamics.
(A) Snapshots from live imaging of GrafCR57;GRAF-GFP and GrafCR57;GRAFΔRhoGAP-GFP show that GrafCR57;GRAFΔRhoGAP-GFP in aggregates in early cellularization followed by a furrow tip recruitment (seen in the form of rings) in mid cellularization and loss at the furrow in late cellularization (yellow arrowhead denotes furrow tip). (B) Quantification of fluorescence intensity relative to the maximum shows higher intensity for GrafCR57;GRAFΔRhoGAP-GFP at early stages as compared to GrafCR57;GRAFΔRhoGAP-GFP (n = 15 rings, 5 rings per embryo, 3 embryos). Data is represented as mean ± s.d. *p<0.05, two-tailed Mann–Whitney test.
-
Figure 4—figure supplement 1—source data 1
Plotted values for fluorescence intensity analysis.
- https://cdn.elifesciences.org/articles/63535/elife-63535-fig4-figsupp1-data1-v2.xlsx
Figure 5

GRAF overexpression shows inhibition of ring constriction in cellularization.
(A–C) Schematic (A) shows Graf gene and the Graf overexpression line, GrafEP09461 containing a P-element (with a UAS site) insertion in 5′UTR in an orientation to drive the downstream Graf gene. (B) GRAF-OE crossed to mat-Gal4 shows an increase in GRAF (100%, n = 19) when stained with GRAF (red) and Dlg (green) (control n = 24 embryos). (C) Quantification shows an increased GRAF antibody fluorescence in GRAF-OE (furrow length range: 7–19 µm) embryos compared to controls (furrow length range: 7–20 µm) (n = 25 rings, 5 per embryo, 5 embryos each). (D) Sqh-mCherry images and (E) area quantification show a significantly higher ring area in GRAF-OE as compared to controls (yellow arrowhead marks the furrow tip) (n = 15 rings, 5 per embryo, 3 embryos)(control values were repeated from Figure 3 for comparison). Data is represented as mean ± s.d. **p<0.01, ***p<0.001, two-tailed Mann–Whitney test. Scale bars: 5 µm.
-
Figure 5—source data 1
Plotted values for fluorescence intensity and ring area analysis.
- https://cdn.elifesciences.org/articles/63535/elife-63535-fig5-data1-v2.xlsx
Figure 6 with 1 supplement
Graf-depleted embryos show increased Myosin II in cellularization, whereas GRAF overexpression shows reduced Myosin II.
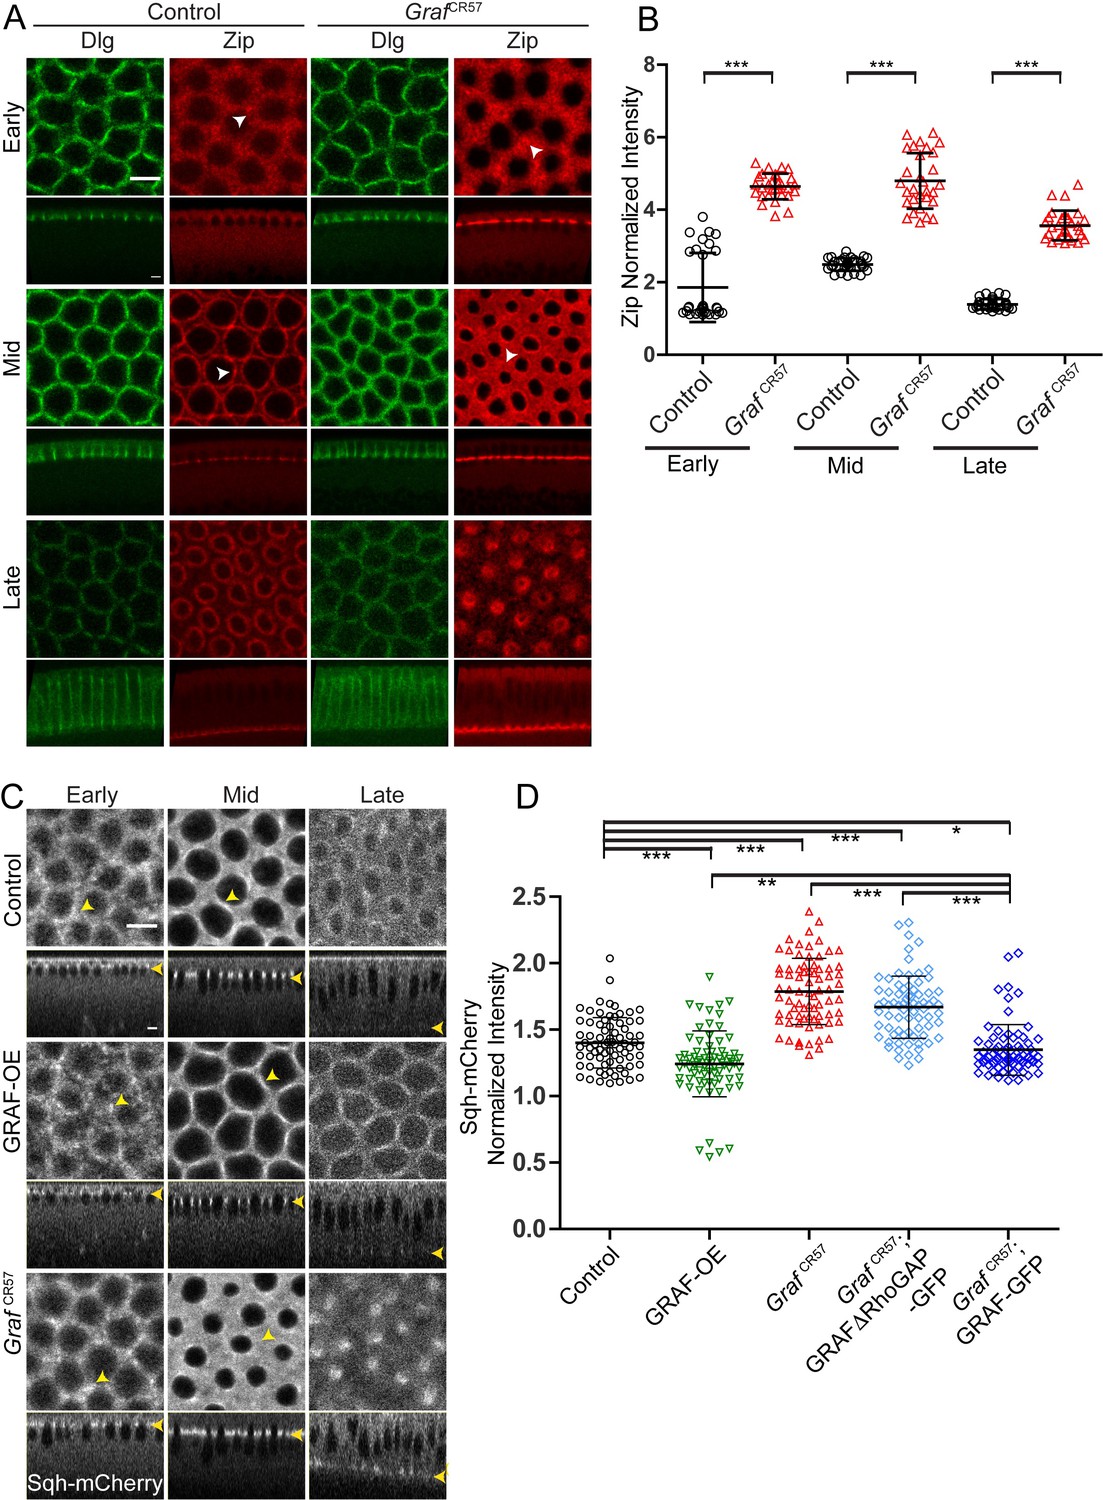
(A–D) Fixed images (A) of control and GrafCR57 embryos (100%, n = 31 embryos) stained with Dlg (green) and Zipper (red) showing higher Zipper intensity in early (white arrowhead shows Zipper foci), mid (white arrowhead shows Zipper enrichment in control and spreading in GrafCR57 mutant) and late cellularization (control n = 16 embryos). (B) Cortex to cytosol ratio of Zipper antibody fluorescence shows a significant increase in GrafCR57 as compared to controls (n = 30 rings, 10 per embryo, 3 embryos each). (C) Control, GRAF-OE and GrafCR57 embryos expressing Sqh-mCherry (gray) are shown in early (yellow arrowhead marks Sqh-mCherry foci), mid (yellow arrowhead marks Sqh-mCherry enrichment) and late cellularization (yellow arrowhead in sagittal sections marks the furrow tip). (D) Quantification of Sqh-mCherry in late cellularization (yellow region marked in Figure 6—figure supplement 1B) in GRAF-OE shows reduction in intensity, whereas Graf CR57 and Graf CR57;GRAFΔRhoGAP-GFP shows higher intensity as compared to controls. Graf CR57; GRAF-GFP shows a rescue in Sqh-mCherry as compared Graf CR57 (n = 75 rings, 5 rings per time point, 5 time points, 3 embryos each). Data is represented as mean ± s.d. *p<0.05, **p<0.01, ***p<0.001, two-tailed Mann–Whitney test. Scale bars: 5 µm.
-
Figure 6—source data 1
Plotted values for fluorescence intensity analysis.
- https://cdn.elifesciences.org/articles/63535/elife-63535-fig6-data1-v2.xlsx
Figure 6—figure supplement 1
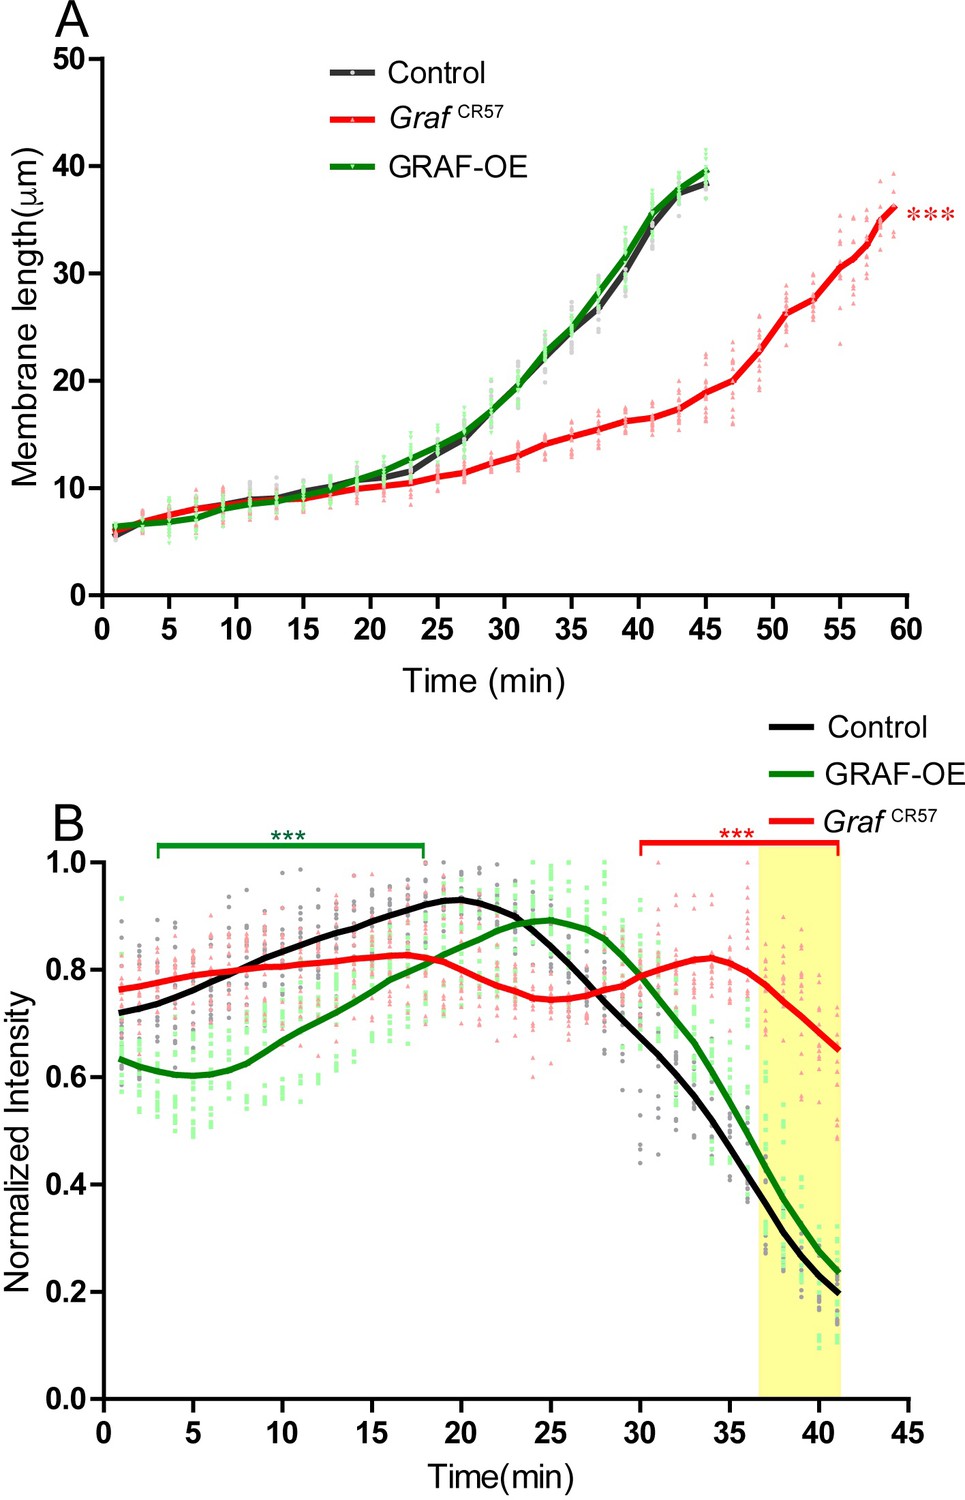
Sqh-mCherry recruitment and furrow length analysis in GrafCR57 and GRAF-OE.
(A) Furrow length quantified from live imaging with Sqh-mCherry for controls, GrafCR57 and GRAF-OE shows a similar trend of the slow and fast phase of ingression in GRAF-OE as compared to controls. The slow phase is extended in GrafCR57, and the final length is achieved at a later time in the fast phase (n = 15 furrow lengths, 5 furrows per embryo, 3 embryos). Data is represented as mean ± s.d. ***p<0.001; one-way ANOVA, repeated measure with Dunnett’s multiple comparison test, the GrafCR57 is statistically different from control and GRAF-OE. (B) Quantification of Sqh-mCherry fluorescence in GRAF-OE embryos (each time point between 3 and 18 min is significantly different from controls and GrafCR57) shows a delay in Sqh-mCherry enrichment at the furrow as compared to controls. GrafCR57 embryos (each time point between 30 to 41 min is significantly different from controls) show sustained Sqh-mCherry in late cellularization as compared to controls (n = 15 rings, 5 per embryo, 3 embryos). Data is represented as mean ± s.d. ***p<0.001. Two-way ANOVA, Bonferroni post-tests where each genotype compared to control, time points 3–18 in GRAF-OE are statistically different from controls and GrafCR57, times points in 30–41 min in GrafCR57 are statistically different from controls and GRAF-OE. The last five time points in the yellow shaded region are used to estimate the ring intensity as a ratio to inter ring regions in different genotypes in Figure 6D.
-
Figure 6—figure supplement 1—source data 1
Plotted values for furrow length and fluorescence intensity analysis.
- https://cdn.elifesciences.org/articles/63535/elife-63535-fig6-figsupp1-data1-v2.xlsx
Figure 7 with 1 supplement
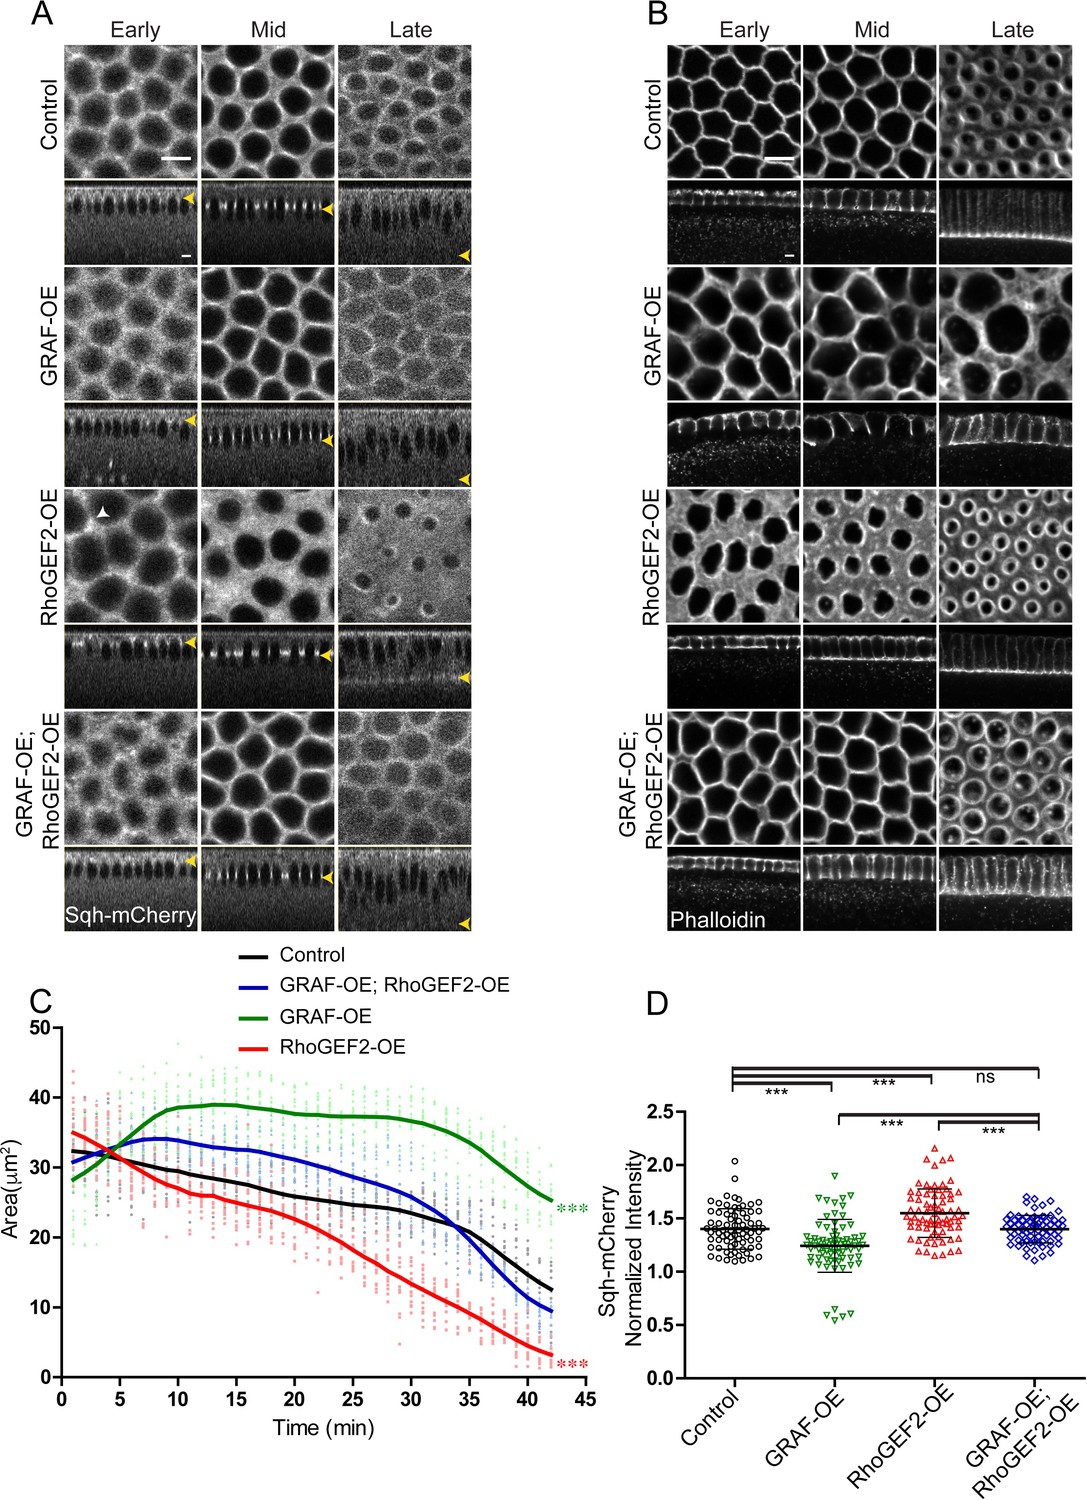
GRAF overexpression-driven loss of ring constriction is suppressed by RhoGEF2 overexpression in cellularization.
(A–B) (A) The increased constriction seen in RhoGEF2-OE embryos is suppressed in GRAF-OE similar to controls when imaged live with Sqh-mCherry (gray) (yellow arrowhead marks furrow tip in sagittal sections, white arrowhead marks Sqh-mCherry foci in RhoGEF2-OE) and (B) when stained with phalloidin (B, GRAF-OE 100% shows loss of constriction, n = 50 embryos, RhoGEF2-OE 96.15% shows enhanced constriction, n = 52 embryos, GRAF-OE; RhoGEF2-OE 57.69% shows constriction comparable to controls, n = 52 embryos). (C) Quantification of contractile ring area from Sqh-mCherry shows decreased area in RhoGEF2-OE, increased area in GRAF-OE and normal area in GRAF-OE; RhoGEF2-OE as compared to controls (n = 15 rings, 5 rings per embryo, 3 embryos) (control values were repeated from Figure 3 and GRAF-OE values were repeated from Figure 4 for comparison). Data is represented as mean ± s.d. ***p<0.001, one-way ANOVA, repeated measure with Dunnett’s multiple comparison test, the GRAF-OE, RhoGEF2-OE is statistically different from controls and GRAF-OE; RhoGEF2-OE. (D) Quantification of Sqh-mCherry in late cellularization in RhoGEF2-OE shows increased intensity as compared to controls, and GRAF-OE; RhoGEF2-OE shows Sqh-mCherry intensity a reduced intensity as compared to RhoGEF2-OE and is similar to controls (control and GRAF-OE values were repeated from Figure 6 for comparison) (n = 75 rings, 5 rings per time point, 5 time points, 3 embryos each). Data is represented as mean ± s.d. ns: non-significant. ***p<0.001, two-tailed Mann–Whitney test. Scale bars: 5 µm.
-
Figure 7—source data 1
Plotted values for ring area and fluorescence intensity analysis.
- https://cdn.elifesciences.org/articles/63535/elife-63535-fig7-data1-v2.xlsx
Figure 7—figure supplement 1

RhoGEF2 overexpression retains GRAF recruitment and membrane furrow length analysis of RhoGEF2 depletion and overexpression.
(A, B) Fixed embryos (A) stained with GRAF and Dlg antibodies show increased staining of GRAF in nanos-Gal4; RhoGEF2 (RhoGEF2-OE) embryos in mid and late cellularization (100% embryos show increased GRAF staining as compared to controls, n = 20 embryos). The furrow tip is organized as a ring in RhoGEF2-OE in early cellularization as compared to controls. (B) Furrow length is quantified from live imaging of controls, RhoGEF2i and RhoGEF2-OE embryos. RhoGEF2i shows a similar dynamics or furrow extension as compared to controls. RhoGEF2-OE shows significantly shorter length compared to controls in the slow phase and the fast phase. The final furrow length at 45 min remains significantly shorter than controls. Data is represented as mean ± s.d. ***p<0.001, one-way ANOVA, repeated measure with Dunnett’s multiple comparison test, Rho-GEF2-OE is statistically different from controls and RhoGEF2i. Scale bars: 5 µm.
-
Figure 7—figure supplement 1—source data 1
Plotted values for furrow length analysis.
- https://cdn.elifesciences.org/articles/63535/elife-63535-fig7-figsupp1-data1-v2.xlsx
Figure 8 with 1 supplement
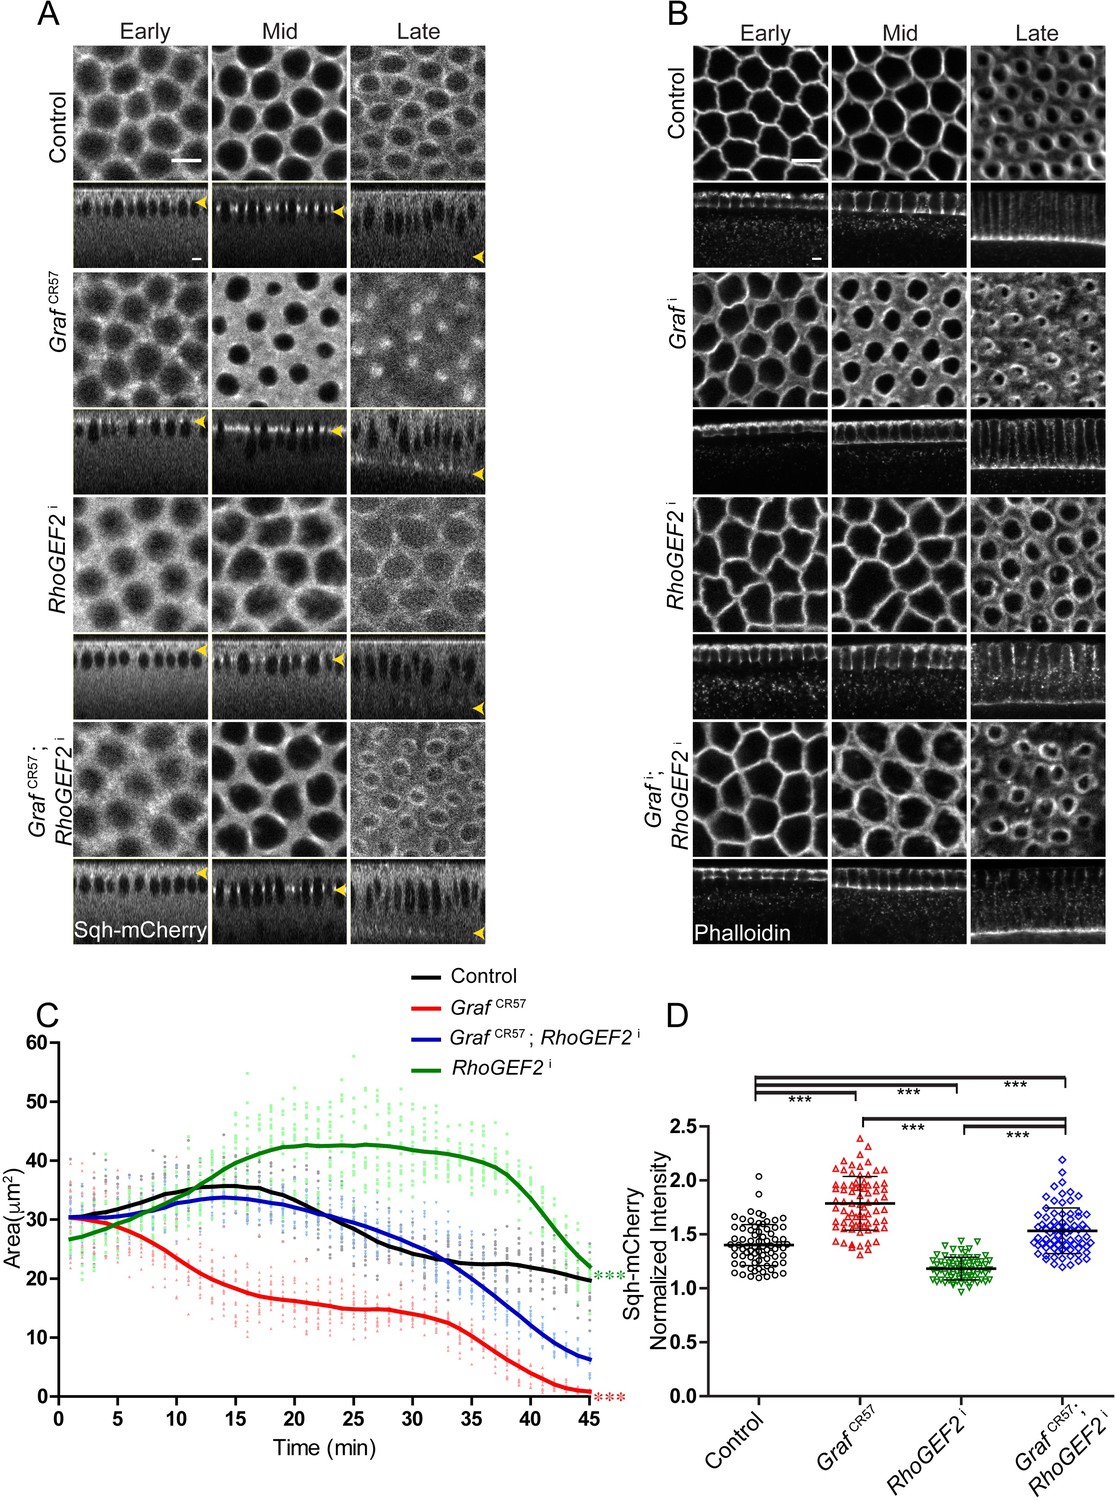
GrafCR57 hyper constriction phenotype is suppressed by RhoGEF2 depletion.
(A–B) GrafCR57 (A) shows hyper constriction, RhoGEF2i shows loss of constriction and GrafCR57; RhoGEF2i combination shows ring sizes comparable to control embryos when imaged live with Sqh-mCherry (gray) (yellow arrowhead denotes furrow tip). (B) Grafi shows hyper constriction, RhoGEF2i shows loss of constriction and Grafi; RhoGEF2i combination shows ring sizes comparable to control embryos when stained with fluorescent phalloidin (B, Grafi 95.71% shows enhanced ring constriction, n = 70, RhoGEF2i 78.5% shows loss of constriction, n = 14, Grafi; RhoGEF2i 57.14%, rings comparable to controls, n = 21). (C) Quantification of contractile ring area from Sqh-mCherry expressing embryos shows decreased area in GrafCR57, increased area in RhoGEF2i and rescued area in GrafCR57; RhoGEF2i (n = 15 rings, 5 rings per embryo, 3 embryos) (control values were repeated from Figure 3 and GrafCR57 values were repeated from Figure 3 for comparison). Data is represented as mean ± s.d. ***p<0.001, one-way ANOVA, repeated measure with Dunnett’s multiple comparison test, the GrafCR57 and RhoGEF2i statistically different from controls and GrafCR57; RhoGEF2i. (D) Sqh-mCherry intensity in late cellularization in RhoGEF2i is decreased as compared to controls. GrafCR57; RhoGEF2i shows a decrease in Sqh-mCherry intensity as compared to Graf CR57 and rescue in comparison with RhoGEF2i (control and GrafCR57 values were repeated from Figure 6 for comparison) (n = 75 rings, 5 rings per time point, 5 time points, 3 embryos each). Data is represented as mean ± s.d. ***p<0.001, two-tailed Mann–Whitney test. Scale bars: 5 µm.
-
Figure 8—source data 1
Plotted values for ring area and fluorescence intensity analysis.
- https://cdn.elifesciences.org/articles/63535/elife-63535-fig8-data1-v2.xlsx
Figure 8—figure supplement 1
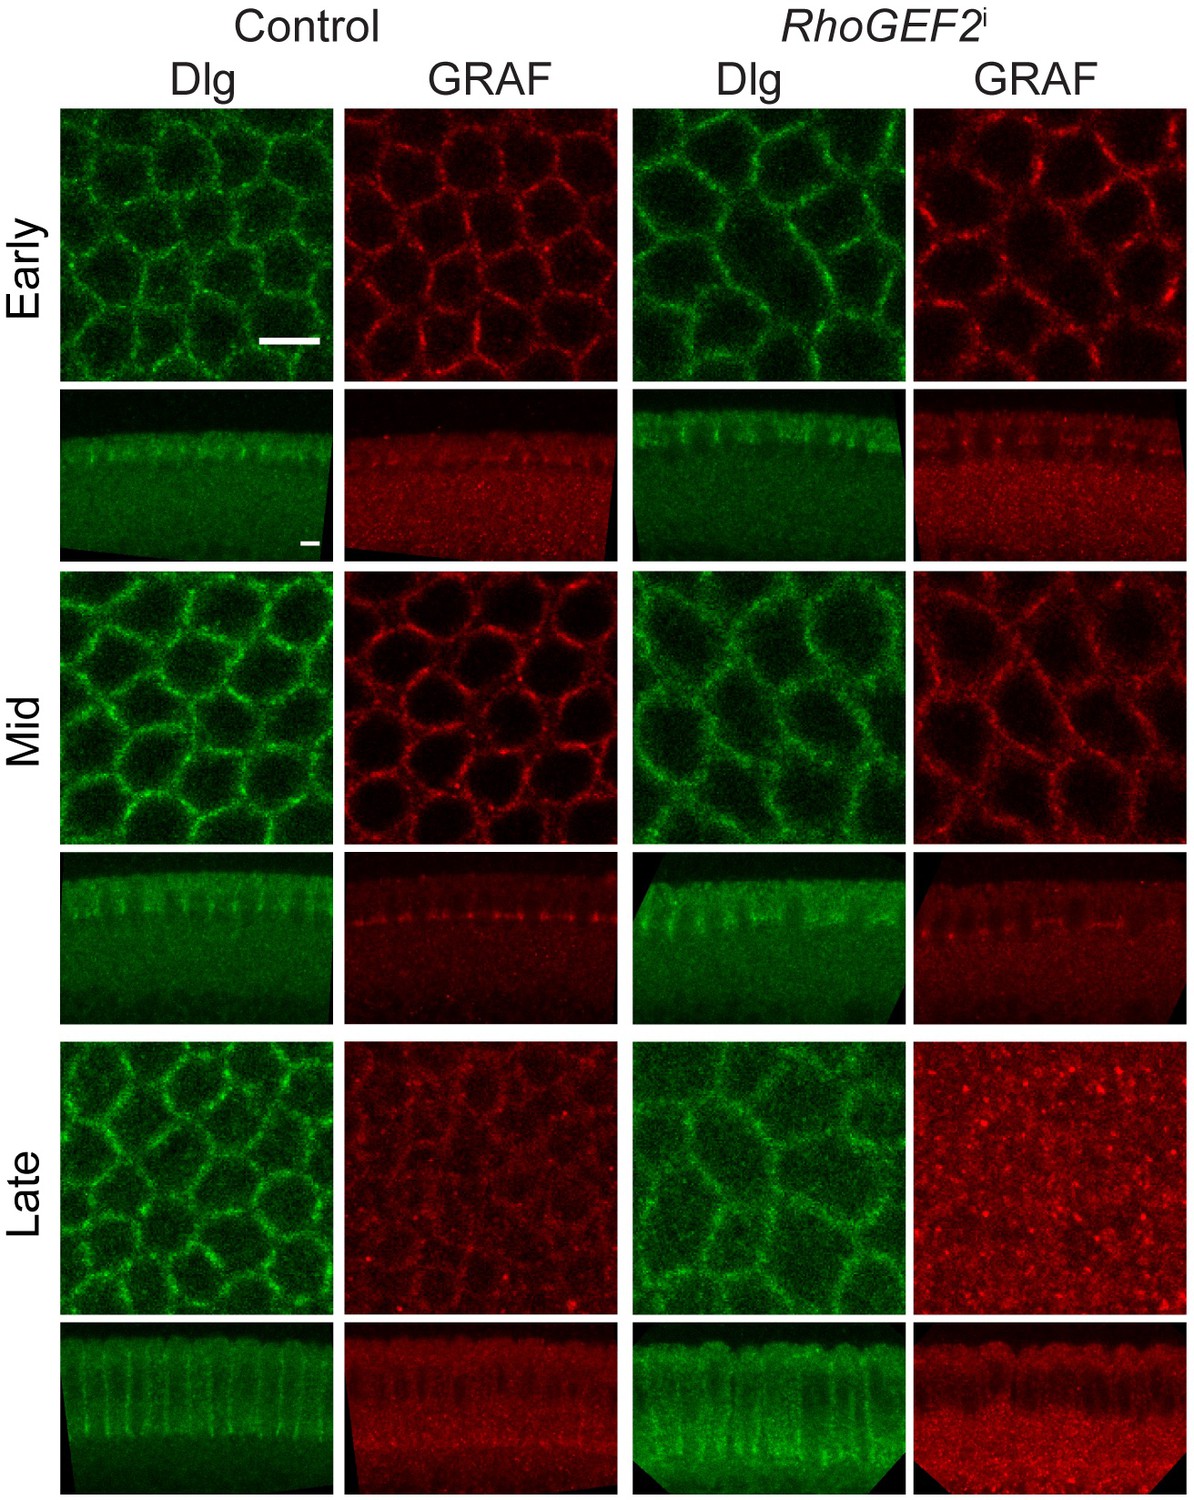
RhoGEF2 depletion retains GRAF recruitment.
Fixed embryos stained with GRAF and Dlg antibodies show similar GRAF staining in nanos-Gal4; RhoGEF2 RNAi expressing embryos knockdown as compared to controls (100% embryos show GRAF staining comparable to controls, n = 14 embryos). The furrow tip is organized as a polygon in RhoGEF2i in mid and late stages as compared to rings in controls. Scale bars: 5 µm.
Figure 9 with 1 supplement
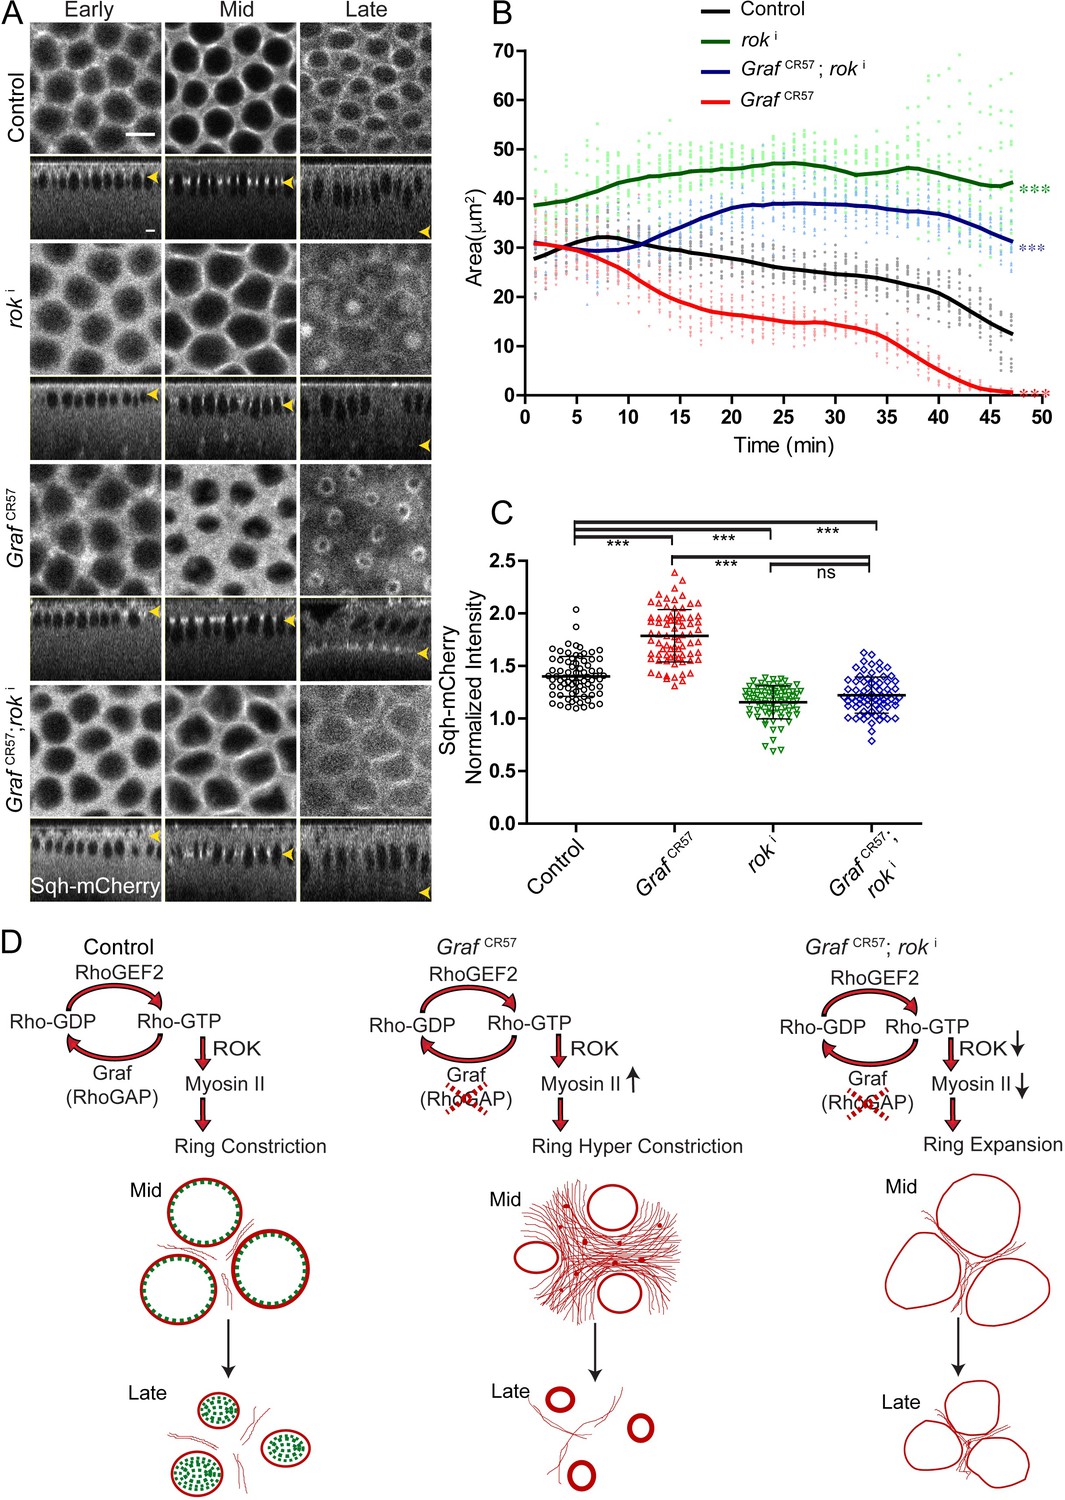
The hyper constriction phenotype of GrafCR57 embryos is suppressed by additional depletion of Rok.
(A) GrafCR57 shows hyper constricted contractile rings, roki shows loss of ring constriction and the GrafCR57; roki combination suppression of the hyper constriction phenotype seen in GrafCR57 when imaged live with Sqh-mCherry (gray) (yellow arrowhead denotes furrow tip). (B) Quantification of contractile ring area from Sqh-mCherry embryos shows decreased area in GrafCR57, increased area in roki and increased area in GrafCR57;roki compared to controls (n = 15 rings, 5 per embryo, 3 embryos) (control values were repeated from Figure 3 and GrafCR57 values were repeated from Figure 3 for comparison). Data is represented as mean ± s.d. ***p<0.001, one-way ANOVA, repeated measure with Dunnett’s multiple comparison test, the GrafCR57, roki and GrafCR57;roki ring area are statistically different from controls. (C) Quantification of Sqh-mCherry intensity in late cellularization in roki and GrafCR57;roki shows decreased intensity in comparison to controls (control and GrafCR57 values were repeated from Figure 6 for comparison) (n = 75 rings, 5 rings per time point, 5 time points, 3 embryos each) (C). Data is represented as mean ± s.d. ns: non-significant. ***p<0.001, two-tailed Mann–Whitney test. Scale bars: 5 µm. (D) Schematic shows that GRAF plays a role in regulating Rho-GTP levels as a RhoGAP. GRAF is uniformly present at the contractile ring during mid stage and becomes cytosolic in late stages to drive the contraction process. Graf depletion shows a hyper constriction phenotype, and Rok depletion suppresses the hyper constriction phenotype seen in Graf mutant embryos. Graf mutant embryos show Myosin II accumulation at the ring in mid and late cellularization and in the inter ring region in mid cellularization.
-
Figure 9—source data 1
Plotted values for ring area and fluorescence intensity analysis.
- https://cdn.elifesciences.org/articles/63535/elife-63535-fig9-data1-v2.xlsx
Figure 9—figure supplement 1
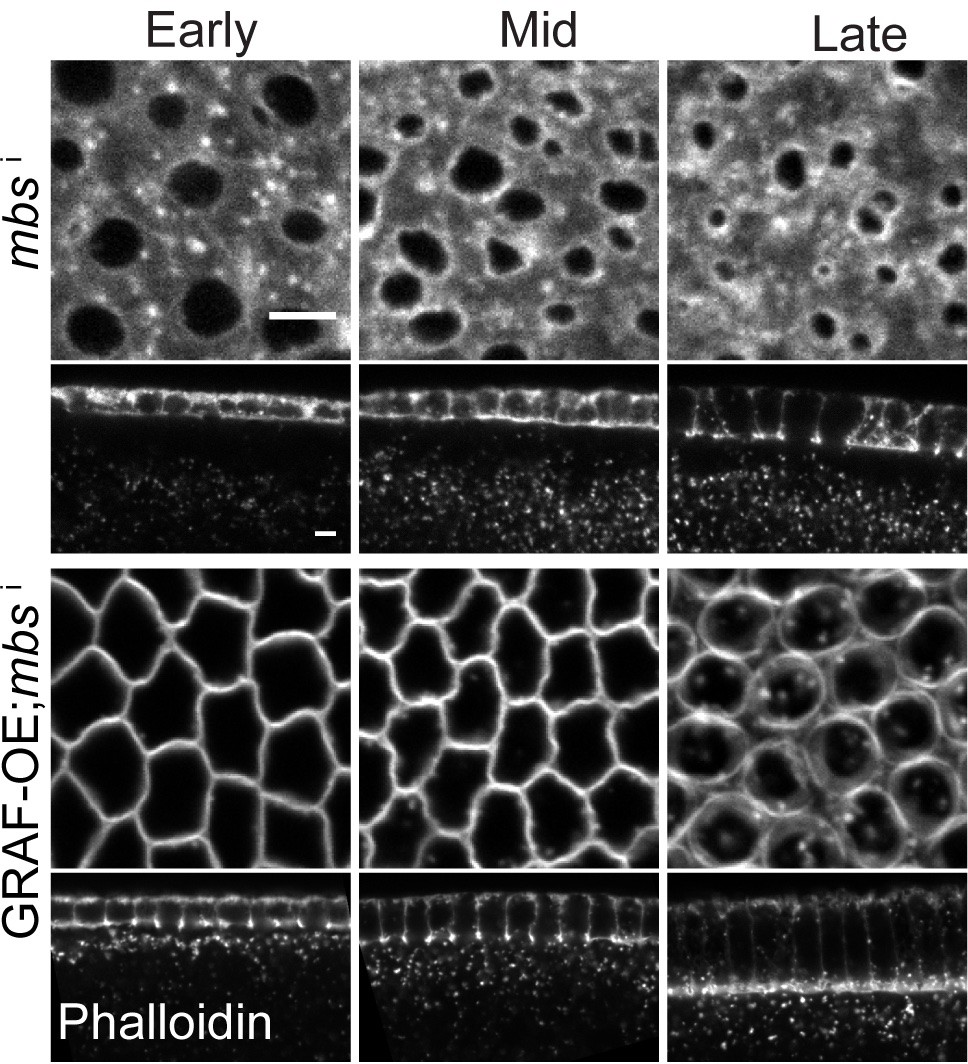
GRAF overexpression suppresses the hyper constriction phenotype in Myosin II binding subunit (MBS)-depleted embryos.
Author response image 1
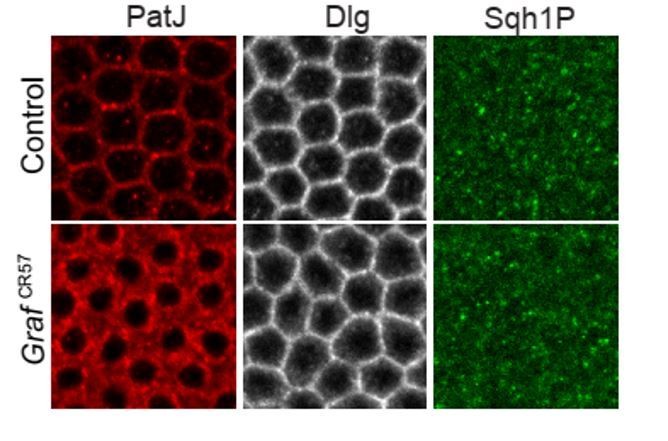
Sqh1P expression pattern during mid cellularization in GrafCR57 mutant.
Sqh1P staining revealed patchy staining with cytoplasmic signal during mid cellularization. There is no specific localization at the furrow tip in contractile rings and no observable change in the Sqh1P pattern in GrafCR57 mutants as compared to controls.
Videos
Video 1
GRAF-GFP and Sqh-mCherry distribution during ring constriction in cellularization.
The video shows living embryos expressing GRAF-GFP (green, above) and Sqh-mCherry (red, below) during cellularization. There is enrichment of GRAF-GFP and Sqh-mCherry at the furrow in mid cellularization. GRAF-GFP becomes cytoplasmic, and Sqh-mCherry remains during late cellularization. Sum projections of five stacks are shown at each time frame of the video. Scale bar = 5 µm.
Video 2
GRAF-GFP and Sqh-mCherry distribution on the furrow in sagittal sections.
Sagittal sections were extracted to show distribution of GRAF-GFP (green, above) and Sqh-mCherry (red, below) during cellularization. Note the loss of GRAF-GFP in late cellularization, whereas Sqh-mCherry is still visible at the furrow tip (white arrows at the 42.26 min time point). GRAF-GFP also labels tube-like structures beneath the furrow in early and mid cellularization. Scale bar = 5 µm.
Video 3
GrafCR57 embryos show contractile ring recoil upon ablations during cellularization.
Live imaging of Sqh-mCherry control (left) and GrafCR57 (right) containing Sqh-mCherry (gray) subjected to laser ablations (time = 0 s) at the regions marked in a yellow line during early (above) and mid (below) cellularization. GrafCR57 shows higher ring recoil as compared to controls. Scale bar = 5 µm.
Video 4
GrafCR57 embryos show enrichment of AnillinRBD-GFP and Sqh-mCherry distribution during ring constriction in cellularization.
The video shows colocalization of AnillinRBD-GFP (green, above, left) and Sqh-mCherry (red, below, left) throughout cellularization. GrafCR57 embryos show enrichment of AnillinRBD-GFP (above, right) and Sqh-mCherry (below, right) between neighboring rings from mid cellularization to late cellularization. Sum projections of five stacks at the furrow tip are used to show each time frame in the video. Scale bar = 5 µm.
Video 5
GrafCR57 embryos expressing Sqh-mCherry show increased ring constriction during cellularization.
Live imaging of Sqh-mCherry control (above) and GrafCR57 (below) containing Sqh-mCherry (gray) at the furrow during cellularization. GrafCR57 shows enhanced constriction as compared to controls. Sum projections of five stacks at the furrow tip are shown at each time frame of the video. Scale bar = 5 µm.
Video 6
GrafCR57; GRAFΔRhoGAP-GFP embryos expressing Sqh-mCherry show enhanced ring constriction during cellularization.
Live embryos expressing GrafCR57; GRAFΔRhoGAP-GFP (green, above) and Sqh-mCherry (red, below) are shown during cellularization. GrafCR57; GRAFΔRhoGAP-GFP shows enhanced constricted ring compared to controls (Video 1). Sum projections of five stacks at the furrow tip are shown at each time frame of the video. Scale bar = 5 µm.
Video 7
GRAF-OE embryos expressing Sqh-mCherry show inhibition of ring constriction during cellularization.
Live imaging of Sqh-mCherry control (above) and Graf-OE (below) embryo expressing Sqh-mCherry (gray) at the furrow is shown. Graf-OE leads to inhibition of ring constriction when compared to controls. Sum projections of five stacks at the furrow tip are shown at each time frame of the video. Scale bar = 5 µm.
Video 8
The hyper constricted ring phenotype in RhoGEF2-OE expressing embryos is suppressed in GRAF-OE; RhoGEF2-OE.
Constriction at the furrow was imaged during cellularization in RhoGEF2-OE (above) and GRAF-OE; RhoGEF2-OE (below) containing Sqh-mCherry (gray). RhoGEF2-OE shows hyper constriction in late cellularization, which is suppressed in the GRAF-OE;RhoGEF2-OE combination. Sum projections of five stacks at the furrow tip are shown at each time frame of the video. Scale bar = 5 µm.
Video 9
Inhibition of ring constriction in RhoGEF2i expressing embryos is suppressed in GrafCR57; RhoGEF2i.
Constriction at the furrow was imaged during cellularization in RhoGEF2i (above) and GrafCR57;RhoGEF2i (below) embryos expressing Sqh-mCherry (gray). RhoGEF2i knockdown embryos showed inhibition of ring constriction, and this phenotype is suppressed by GrafCR57; RhoGEF2i. Sum projections of five stacks at the furrow tip are shown at each time frame of the video. Scale bar = 5 µm.
Video 10
ROKi and GrafCR57; ROKi expressing embryos show inhibition of ring constriction.
ROKi (above) and GrafCR57; ROKi (below) embryos expressing Sqh-mCherry (gray) were imaged live during cellularization. ROKi embryos show inhibition of ring constriction as compared to controls (Video 1). ROKi embryos show accumulation of Sqh-mCherry at the cortex and below the nuclei. The decreased ring constriction seen in ROKi and the hyper constriction phenotype seen in GrafCR57 (Video 5) embryos is suppressed in the GrafCR57; ROKi combination. Sum projections of five stacks at the furrow tip are shown at each time frame of the video. Scale bar = 5 µm.
Tables
Key resources table
| Reagent type (species) or resource | Designation | Source or reference | Identifiers | Additional information |
|---|---|---|---|---|
| Genetic reagent (Drosophila melanogaster) | Canton-S | Bloomington Drosophila Stock Center | BDSC:1 RRID:BDSC_1 | |
| Genetic reagent (Drosophila melanogaster) | nanos-Gal4 | Lab stock (Mavrakis et al., 2009; Mavrakis et al., 2008) | ||
| Genetic reagent (Drosophila melanogaster) | w; mat67-Gal4; mat15-Gal4 | Girish Ratnaparkhi, IISER, Pune, India | ||
| Genetic reagent (Drosophila melanogaster) | w; P{Sqh-mCherry.M}3 | Bloomington Drosophila Stock Center | BDSC:59024 RRID:BDSC_59024 | |
| Genetic reagent (Drosophila melanogaster) | y[1] v[1];P{TRiP.HMC03427}attP40 (GRAFshRNA1) | Bloomington Drosophila Stock Center | BDSC:51853 RRID:BDSC_51853 | |
| Genetic reagent (Drosophila melanogaster) | y[1] v[1]; P{TRiP.GL01207}att P40 (myosin binding subunit, MBS shRNA) | Bloomington Drosophila Stock Center | BDSC:41625 RRID:BDSC_41625 | |
| Genetic reagent (Drosophila melanogaster) | y[1] sc[*] v[1] sev[21]; P{TRiP.HMS01118}a ttP2 (RhoGEF2 shRNA) | Bloomington Drosophila Stock Center | BDSC:34643 RRID:BDSC_34643 | |
| Genetic reagent (Drosophila melanogaster) | y[1] w[*];P{UASpT7.RhoGEF2}5 (RhoGEF2 overexpression) | Bloomington Drosophila Stock Center | BDSC:9386 RRID:BDSC_9386 | |
| Genetic reagent (Drosophila melanogaster) | ubi-GFP::AnillinRBD/TM3 | Thomas Lecuit, IBDM, France, Munjal et al., 2015 | ||
| Genetic reagent (Drosophila melanogaster) | UASp-rok-shRNA (roki) | Tony Harris, University of Toronto, Canada, Zhang et al., 2018 | ||
| Genetic reagent (Drosophila melanogaster) | y[1] w[67]c[23] P{EPgy2}Graf[EY094 61] (GRAF overexpression) | Bloomington Drosophila Stock Center | BDSC:17571 RRID:BDSC_17571 | |
| Genetic reagent (Drosophila melanogaster) | w;mat67 Spider-GFP-Sqh-mcherry/TM3ser | Eric F. Wieschaus, Princeton University, USA, Martin et al., 2009 | ||
| Genetic reagent (Drosophila melanogaster) | y[1] sc[*] v[1] Graf[CR57]/FM7a (GrafCR57) | This study (Richa RIkhy, IISER, Pune, India) | ||
| Genetic reagent (Drosophila melanogaster) | y[1] sc[*] v[1] sev[21]; P{TKO.GS00762}att P40 | Bloomington Drosophila Stock Center | BDSC:76993 RRID:BDSC_76993 | |
| Genetic reagent (Drosophila melanogaster) | P{KK102763}VIE-260B (GRAF shRNA2, Graf2i) | Vienna Drosophila Stock Center, Vienna, Austria | v110812 | |
| Genetic reagent (Drosophila melanogaster) | y[1] sc[*] v[1] sev[21]; P{y[+t7.7] v[+t1.8]=nosCas9.R}attP40 | Bloomington Drosophila Stock Center | BDSC:78781 RRID:BDSC_78781 | |
| Genetic reagent (Drosophila melanogaster) | [w]*;p[UASp-GRAF-EGFPG1] attp40/cyo | This paper (Richa Rikhy, IISER, Pune, India) | ||
| Genetic reagent (Drosophila melanogaster) | [w]*;p[UASp-GRAFΔRhoGAP-GFP] attp40/cyo | This paper (Richa Rikhy, IISER, Pune, India) | ||
| Sequence-based reagent | GRAF_pUASp_Homo_Kpn1_GRAF(start)_FP (1) | This paper (Sigma-Aldrich) | PCR primers | CCGCATAGGCCACTAGTGGATCTGGTACCATGGGCGGCGGCAAAAATGTACG |
| Sequence-based reagent | GRAF(end)_serine linker_GFP(start)_FP (2) | This paper (Sigma-Aldrich) | PCR primers | ACTATGTGGAACATTTGAAGCCGCACCATTCCTCGAGCTCCAGCATGGTGAGCAAGGGCGAGGAGCT |
| Sequence-based reagent | GRAF(end)_serine linker_GFP(start)_RP (3) | This paper (Sigma-Aldrich) | PCR primers | AGCTCCTCGCCCTTGCTCACCATGCTGGAGCTCGAGGAATGGTGCGGCTTCAAATGTTCCACATAGT |
| Sequence-based reagent | GFP_pUASp_Homo_RP (4) | This paper (Sigma-Aldrich) | PCR primers | AACGTTCGAGGTCGACTCTAGAGGATCCTTACTTGTACAGCTCGTCCATGCCGAGAGTGAT |
| Sequence-based reagent | RhoGAP_del_RP (5) | This paper (Sigma-Aldrich) | PCR primers | CCTTCGTGGCGTCCGGCAACTTTGCCTCGCTGACTTTGATTTTGCCG |
| Sequence-based reagent | RhoGAP_del_FP (6) | This paper (Sigma-Aldrich) | PCR primers | CGGCAAAATCAAAGTCAGCGAGGCAAAGTTGCCGGACGCCACGAAGG |
| Sequence-based reagent | GRAF FL AB vecOH FP (7) | This paper (Sigma-Aldrich) | PCR primers | ACGAAAATCTGTATTTCCAAGGCATGGGCGGCGGCAAAAATGT |
| Sequence-based reagent | Vect GRAF FL ABOH RP (8) | This paper (Sigma-Aldrich) | PCR primers | ACATTTTTGCCGCCGCCCATGCCTTGGAAATACAGATTTTCGT |
| Sequence-based reagent | Vect GRAF FL ABOH FP (9) | This paper (Sigma-Aldrich) | PCR primers | AACATTTGAAGCCGCACCATTGGTCTCATCCTCAGTTCGA |
| Sequence-based reagent | GRAF FL AB vecOH RP (10) | This paper (Sigma-Aldrich) | PCR primers | TCGAACTGAGGATGAGACCAATGGTGCGGCTTCAAATGTTCCAC |
| Sequence-based reagent | GRAF mutant scr1 FP (11) | This paper (Sigma-Aldrich) | PCR primers | GTAAATGTTGCAAACACCGCAGTTTTCTCGAAACTCAACC |
| Sequence-based reagent | GRAF mutant scr RP (12) | This paper (Sigma-Aldrich) | PCR primers | TACTACTTACTCTTTGCCGCACTCATAAGATCTTTGACCT |
| Sequence-based reagent | Pot2 212 CtoT FP (13) | This paper (Sigma-Aldrich) | PCR primers | CAATTGGCCATTTTACTTAACGATTTT |
| Sequence-based reagent | Pot2 212 CtoT RP (14) | This paper (Sigma-Aldrich) | PCR primers | AAAATCGTTAAGTAAAATGGCCAATTG |
| Sequence-based reagent | Pot2 420 AtoG FP (15) | This paper (Sigma-Aldrich) | PCR primers | AAGAAAACAAAAAGAAATTTGATAAAA |
| Sequence-based reagent | Pot2 420 AtoG RP (16) | This paper (Sigma-Aldrich) | PCR primers | TTTTATCAAATTTCTTTTTGTTTTCTT |
| Sequence-based reagent | Pot2 468 delT FP (17) | This paper (Sigma-Aldrich) | PCR primers | GCAGGAGCGTTTCCTCAATATGTC |
| Sequence-based reagent | Pot2 468 delT RP (18) | This paper (Sigma-Aldrich) | PCR primers | GACATATTGAGGAAACGCTCCTGC |
| Antibody | Anti-GRAF (rabbit polyclonal) | Bioklone | This study | 1:500; pre-absorbed usingGrafCR57 null mutant embryos |
| Antibody | Anti-Dlg (mouse monoclonal) | DSHB | 4F3, RRID:AB_528203 | IF (1:100) |
| Antibody | Anti-Zipper (rabbit polyclonal) | Thomas Jeffrey, Texas Tech University, TX, USA, Chougule et al., 2016 | IF (1:200) | |
| Antibody | Goat anti-mouse IgG Alexa 488 | Molecular Probes | A-1100, RRID:AB_2534069 | IF (1:1000) |
| Antibody | Goat anti-rabbit IgG Alexa 488 | Molecular Probes | A-11008, RRID:AB_143165 | IF (1:1000) |
| Antibody | Goat anti-mouse IgG Alexa 568 | Molecular Probes | A-11004, RRID:AB_141371 | IF (1:1000) |
| Antibody | Goat anti-rabbit IgG Alexa 568 | Molecular Probes | A-1101, RRID:AB_143157 | IF (1:1000) |
| Antibody | Hoechst 33258 | Molecular Probes | H-3569 | IF (1:1000) |
| Antibody | Slow Fade Gold | Molecular Probes | S-36937 | |
| Antibody | Phalloidin Alexa 488 | Molecular Probes | A-12379, RRID:AB_2315147 | IF (1:100) |
| Antibody | Phalloidin Alexa 568 | Molecular Probes | A-12380, RRID:AB_2759224 | IF (1:100) |
| Antibody | Phalloidin Alexa 647 | Molecular Probes | A-22287, RRID:AB_2620155 | IF (1:100) |
| Software, algorithm | ImageJ and Fiji | National Institutes of Health, (Rueden et al., 2017; Schindelin et al., 2012; Schneider et al., 2012) | ||
| Software, algorithm | GraphPad Prism 5 | Prism |
Additional files
-
Supplementary file 1
Drosophila recombinants and crosses.
The stocks and recombinants used in this study are numbered in Table 1. The crosses carried out with the stocks for each figure for live imaging and fixed imaging of embryos along with the temperature at which each cross is carried out are detailed in Table 2.
- https://cdn.elifesciences.org/articles/63535/elife-63535-supp1-v2.docx
-
Transparent reporting form
- https://cdn.elifesciences.org/articles/63535/elife-63535-transrepform-v2.docx
Download links
A two-part list of links to download the article, or parts of the article, in various formats.
Downloads (link to download the article as PDF)
Open citations (links to open the citations from this article in various online reference manager services)
Cite this article (links to download the citations from this article in formats compatible with various reference manager tools)
Spatiotemporal recruitment of RhoGTPase protein GRAF inhibits actomyosin ring constriction in Drosophila cellularization
eLife 10:e63535.
https://doi.org/10.7554/eLife.63535


