RNA-binding protein Elavl1/HuR is required for maintenance of cranial neural crest specification
- Division of Biology and Biological Engineering, California Institute of Technology, United States
- Department of Cell and Tissue Biology, University of California, San Francisco, United States
- The Miller Institute for Basic Research in Science, University of California, Berkeley, United States
- Department of Biology, School of Math and Science, California State University Northridge, United States
Figures
Figure 1
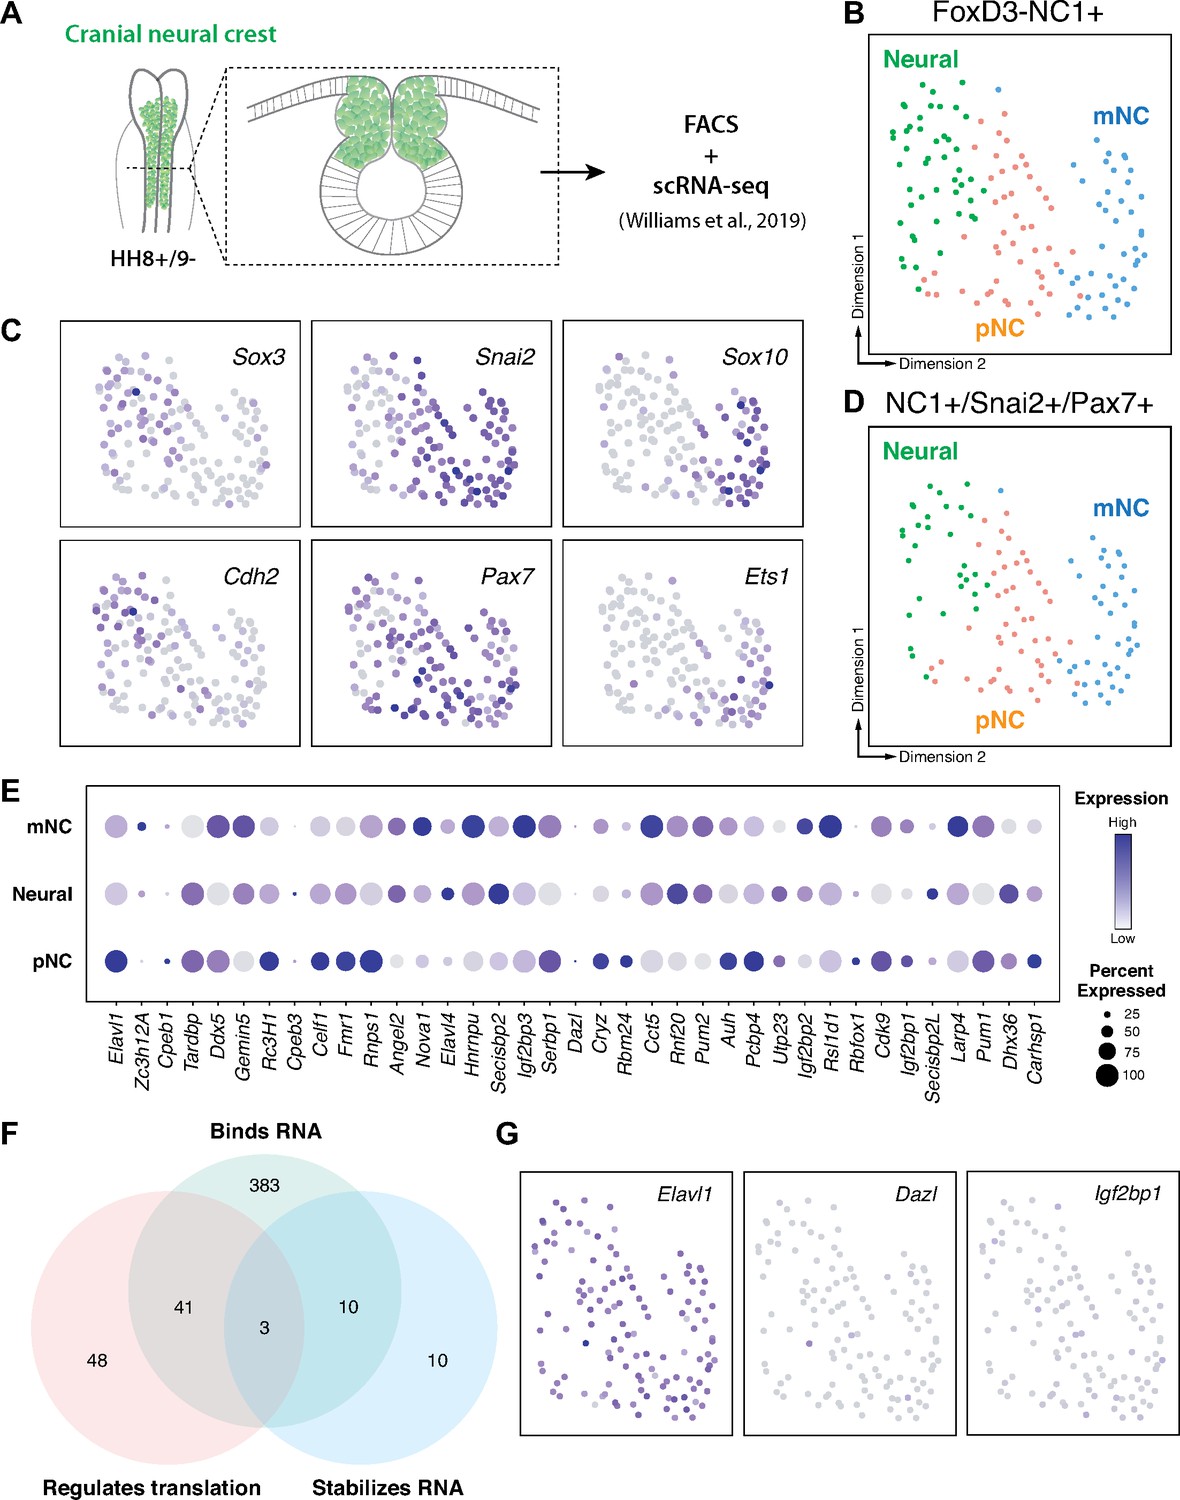
RNA-binding proteins are differentially expressed in premigratory and migratory cranial neural crest.
(A) Schematic of early chick cranial neural crest cells at premigratory stages (HH8+/9−) in intact heads and cross-section expressing Citrine fluorescent protein under control of the FoxD3 NC1 enhancer used by Williams et al. to sort cranial neural crest cells for single-cell RNA-sequencing (scRNA-seq; Williams et al., 2019). (B, C) Dimensionality reduction using Uniform Manifold Approximation and Projection (UMAP) on published scRNA-seq data from Williams et al., 2019 identified three distinct clusters neural, premigratory (pNC), and delaminating/migratory (mNC). Expression of marker genes (Sox3 and Cdh2 for neural, Pax7 and Snai2 for premigratory cranial neural crest, and Sox10 and Ets1 for early migratory cranial neural crest) was used to label the three subclusters. (D) The majority of the FoxD3-NC1+ cells were also positive for the expression of transcription factors Pax7 and Snai2, which label the dorsal neural tube and premigratory/delaminating neural crest cells. These triple positive NC1+/Snai2+/Pax7+ were further processed for gene ontology analysis to identify post-transcriptional regulators. (E) A strip-plot showing expression and abundance of a subset of genes that are associated with the gene ontology term ‘binds to 3′-UTR’. (F) A three-way Venn diagram shows overlap between genes associated with the gene ontology terms ‘binds RNA’, ‘regulates translation’, and ‘stabilizes RNA’. Only three genes, Elavl1, Dazl, and Igf2bp1, were associated with all three. (G) Feature plots showing the expression distribution of the three genes identified in (F). Only Elavl1 is abundant among all NC1+/Pax7+/Snai2+ cells.
Figure 2
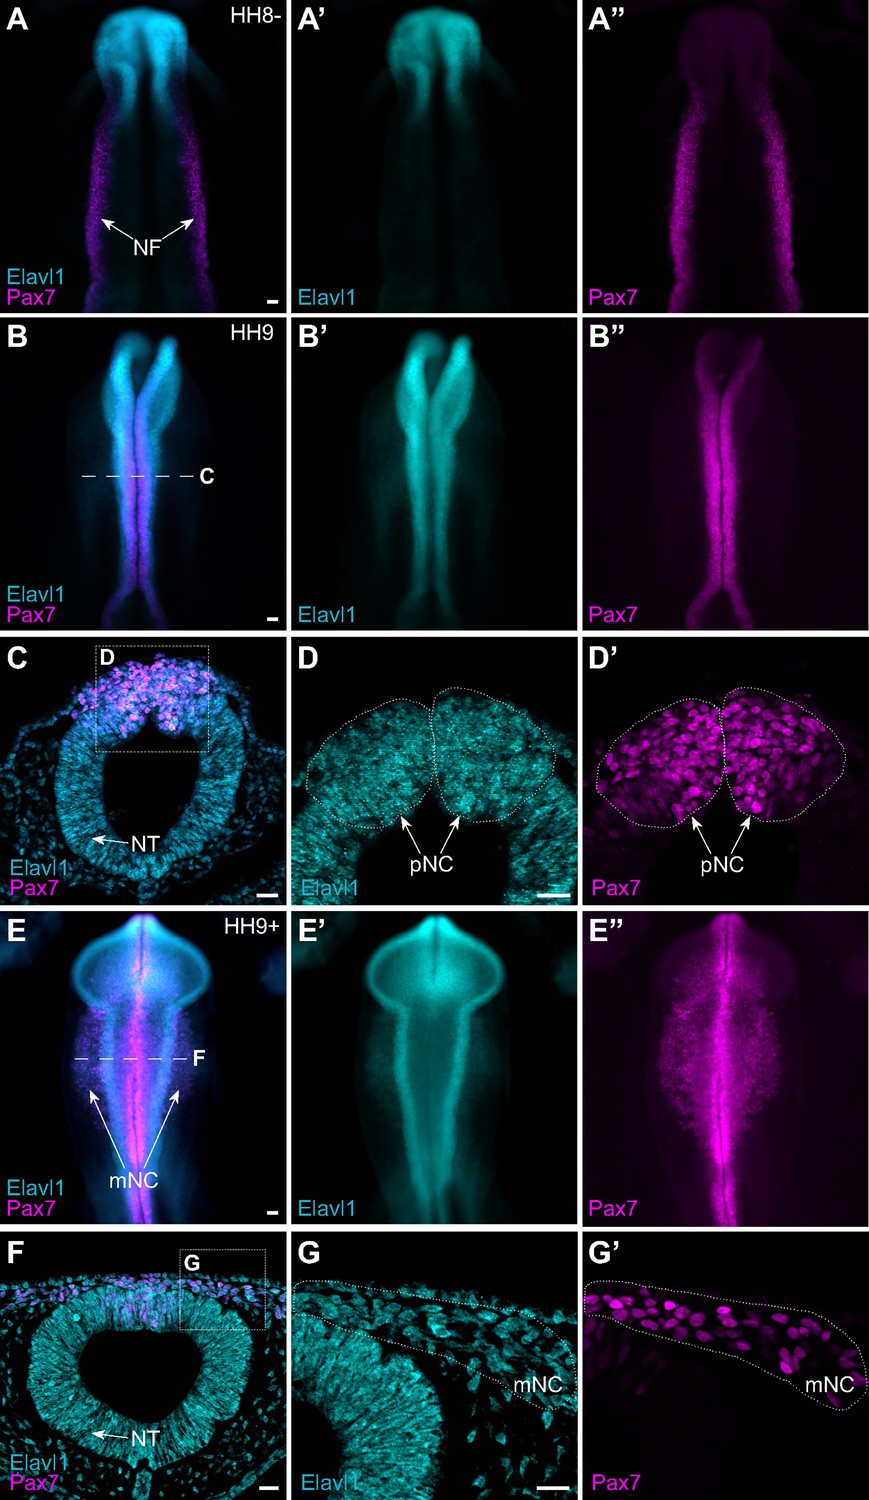
The RNA-binding protein Elavl1 is expressed in premigratory and migratory cranial neural crest.
Representative epifluorescence images of wild-type HH8− (A), HH9 (B–D), and HH9+ (E–G) chick embryos, in whole mount (A, B, E) and cross-section (C, D; F, G) immunostained for Elavl1 (cyan) and Pax7 (magenta). Dashed white line (B, E) indicates level of cross-section (C, D; F, G), respectively; dotted white lines outline regions of premigratory and migratory neural crest as indicated. NF, neural folds; NT, neural tube; pNC, premigratory neural crest; mNC, migratory neural crest. Scale bar, 50 μm.
Figure 3 with 2 supplements
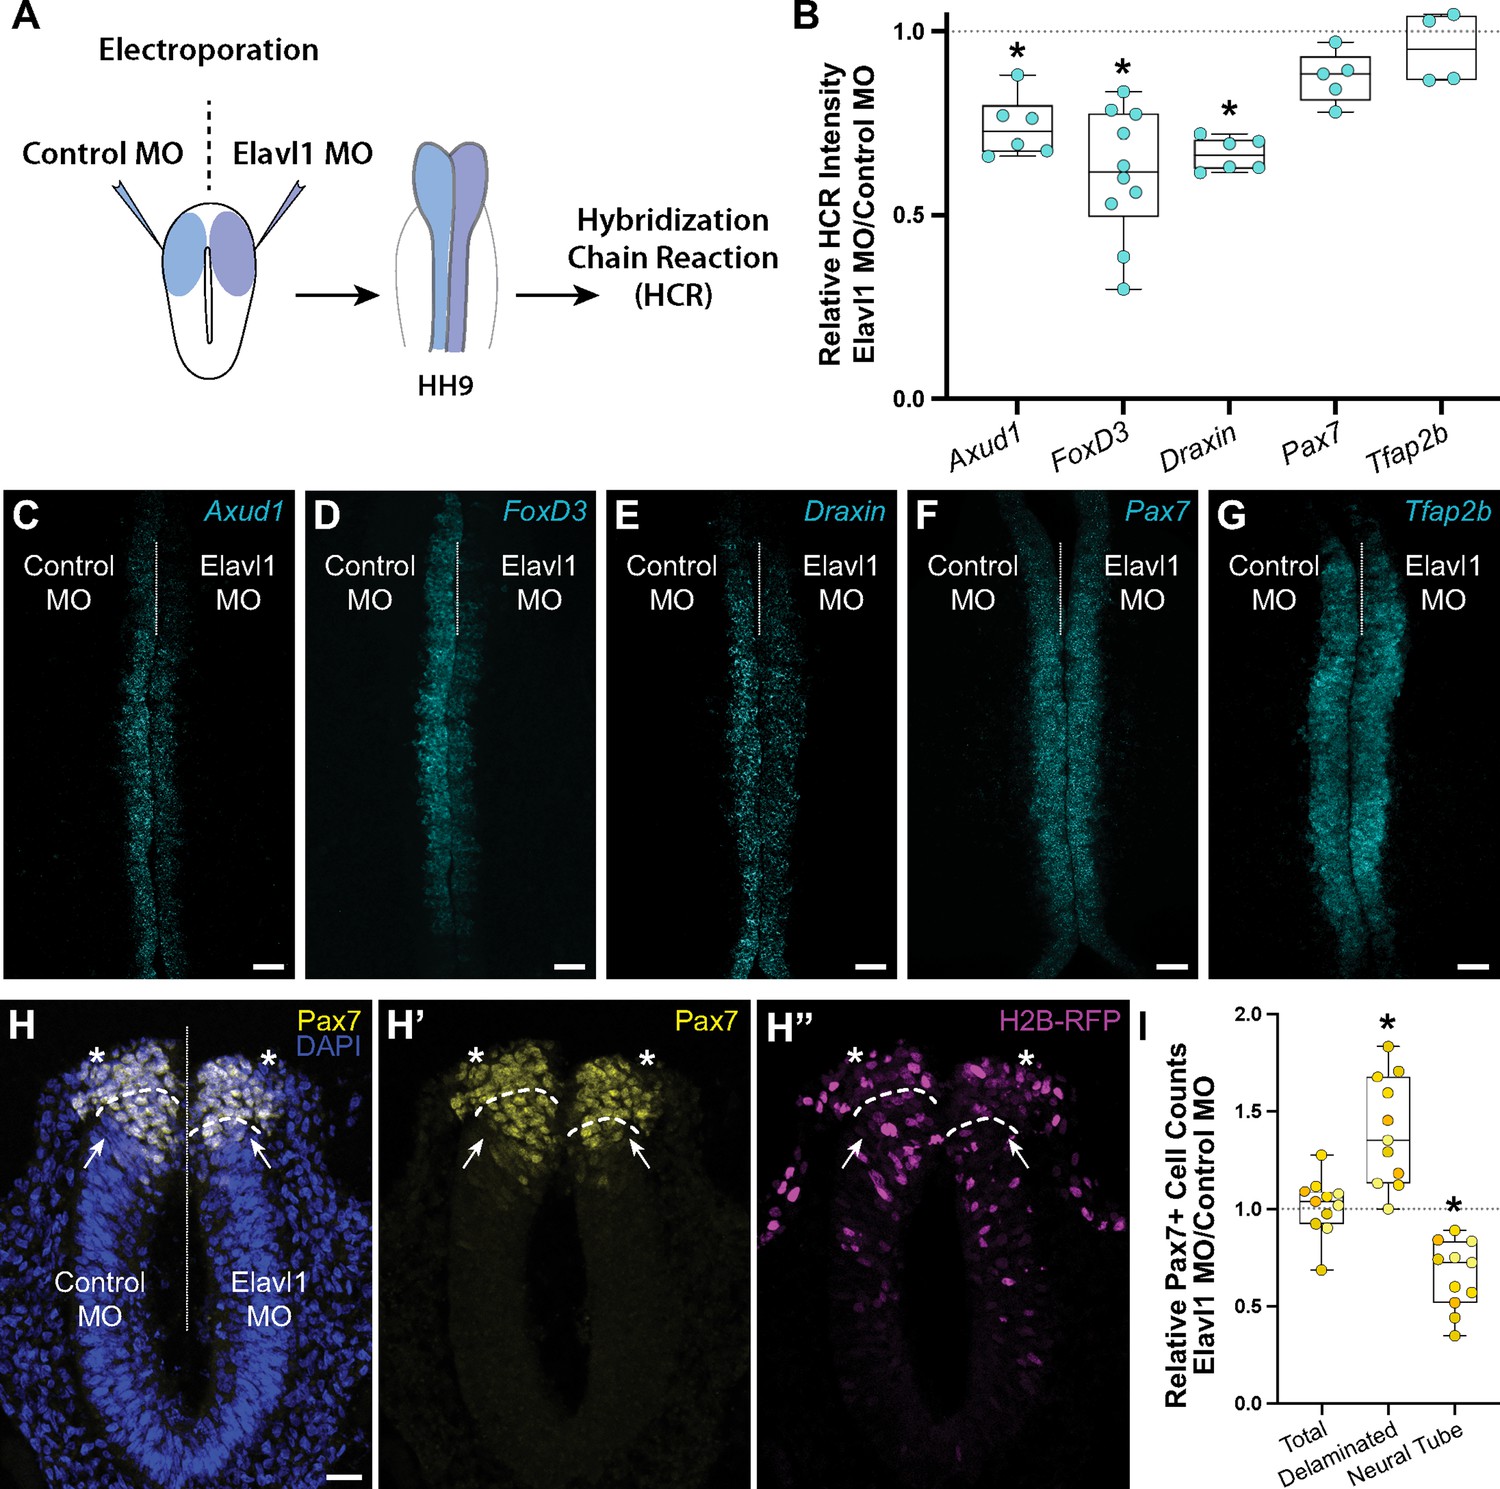
Elavl1 knockdown alters cranial neural crest specification and delamination.
(A) Schematic diagram illustrating experimental design. Gastrula stage chick embryos were electroporated bilaterally with a standard control and translation-blocking morpholino (MO) targeting Elavl1. Electroporated embryos were subsequently processed for quantitative hybridization chain reaction (HCR) and analyzed in whole mount, comparing the knockdown to the contralateral control side. (B) Quantitation of HCR processed embryos for control versus Elavl1 knockdown for cranial neural crest transcripts, calculated as ratio of Elavl1 MO versus control MO integrated density. Representative confocal maximum intensity projection micrographs for Axud1 (n = 6) (C), FoxD3 (n = 10) (D), Draxin (n = 6) (E), Pax7 (n = 5) (F), and Tfap2b (n = 4) (G) transcripts. Dotted white line indicates midline. MO, morpholino. Scale bar, 50 μm. *p < 0.05, Wilcoxon signed-rank test. (H) Representative apotome maximum intensity projection micrographs of cross-sectioned embryo bilaterally co-electroporated with a fluorescent electroporation control construct (H2B-RFP) and control MO (left) or Elavl1 MO (right) immunostained for Pax7 (yellow). Nuclei were stained with DAPI (4′,6-diamidino-2-phenylindole)(blue). Dotted white line indicates midline. Dashed white lines indicate limit of dorsal neural tube. Arrows indicate ‘neural tube’ Pax7 cells. Asterisks indicate ‘delaminated’ Pax7 cells. Scale bar, 20 μm. (I) Quantification of the ratio of Pax7 + cells on Elavl1 MO (right) versus control MO (left) sides of cross-sections. Data are from individual sections; sections from same embryo are displayed in same color (n = 4 embryos, 11 sections). *p ≤ 0.002, one-sample Wilcoxon signed-rank test.
Figure 3—figure supplement 1
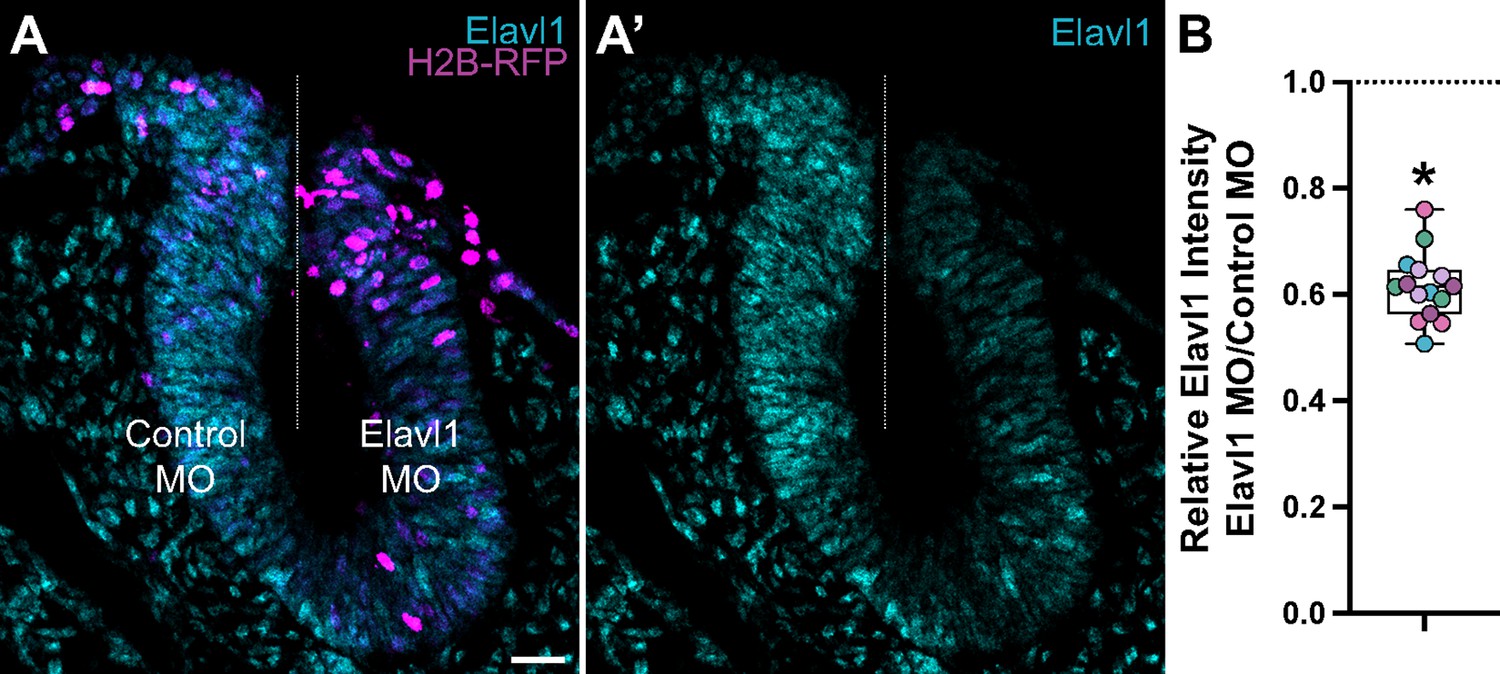
Translation-blocking morpholino suppresses Elavl1 expression.
(A) Representative apotome maximum intensity projection micrograph of cross-sectioned embryo bilaterally co-electroporated with a fluorescent electroporation control construct (H2B-RFP) and control morpholino (left) or Elavl1 morpholino (right), immunostained for Elavl1 (cyan). Dotted white line indicates midline. MO, morpholino. Scale bar, 20 μm. (B) Relative fluorescence intensity of Elavl1 for Elavl1 knockdown compared to control sides of cross-sections, calculated as ratio of Elavl1 morpholino versus control morpholino integrated density. Data are from individual sections; sections from same embryo are displayed in same color (n = 5 embryos, 15 sections). *p < 0.001, paired t-test.
Figure 3—figure supplement 2
Elavl1 knockdown inhibits cranial neural crest emigration.
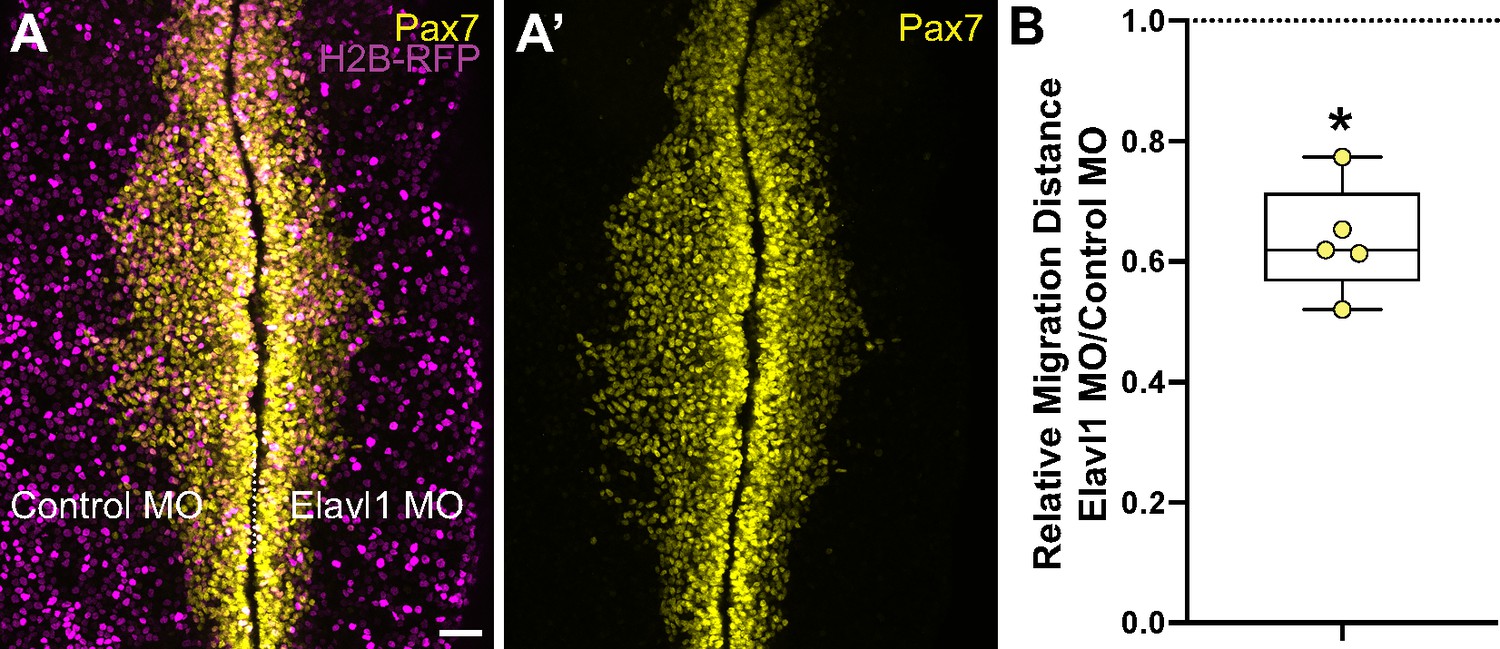
(A) Representative confocal maximum intensity projection micrograph of whole mount embryo bilaterally co-electroporated with a fluorescent electroporation control construct (H2B-RFP) and control morpholino (left) or Elavl1 morpholino (right), immunostained for Pax7 (yellow). Dotted white line indicates midline. MO, morpholino. Scale bar, 50 μm. (B) Relative migration distance for electroporated sides compared to control sides of whole mount embryos, calculated as ratio. Data are from individual embryos (n = 5 embryos, 5 measurements per embryo averaged). *p < 0.001, Wilcoxon matched-pairs signed-rank test.
Figure 4 with 2 supplements
Draxin mRNA is the primary target of Elavl1 during cranial neural crest specification.
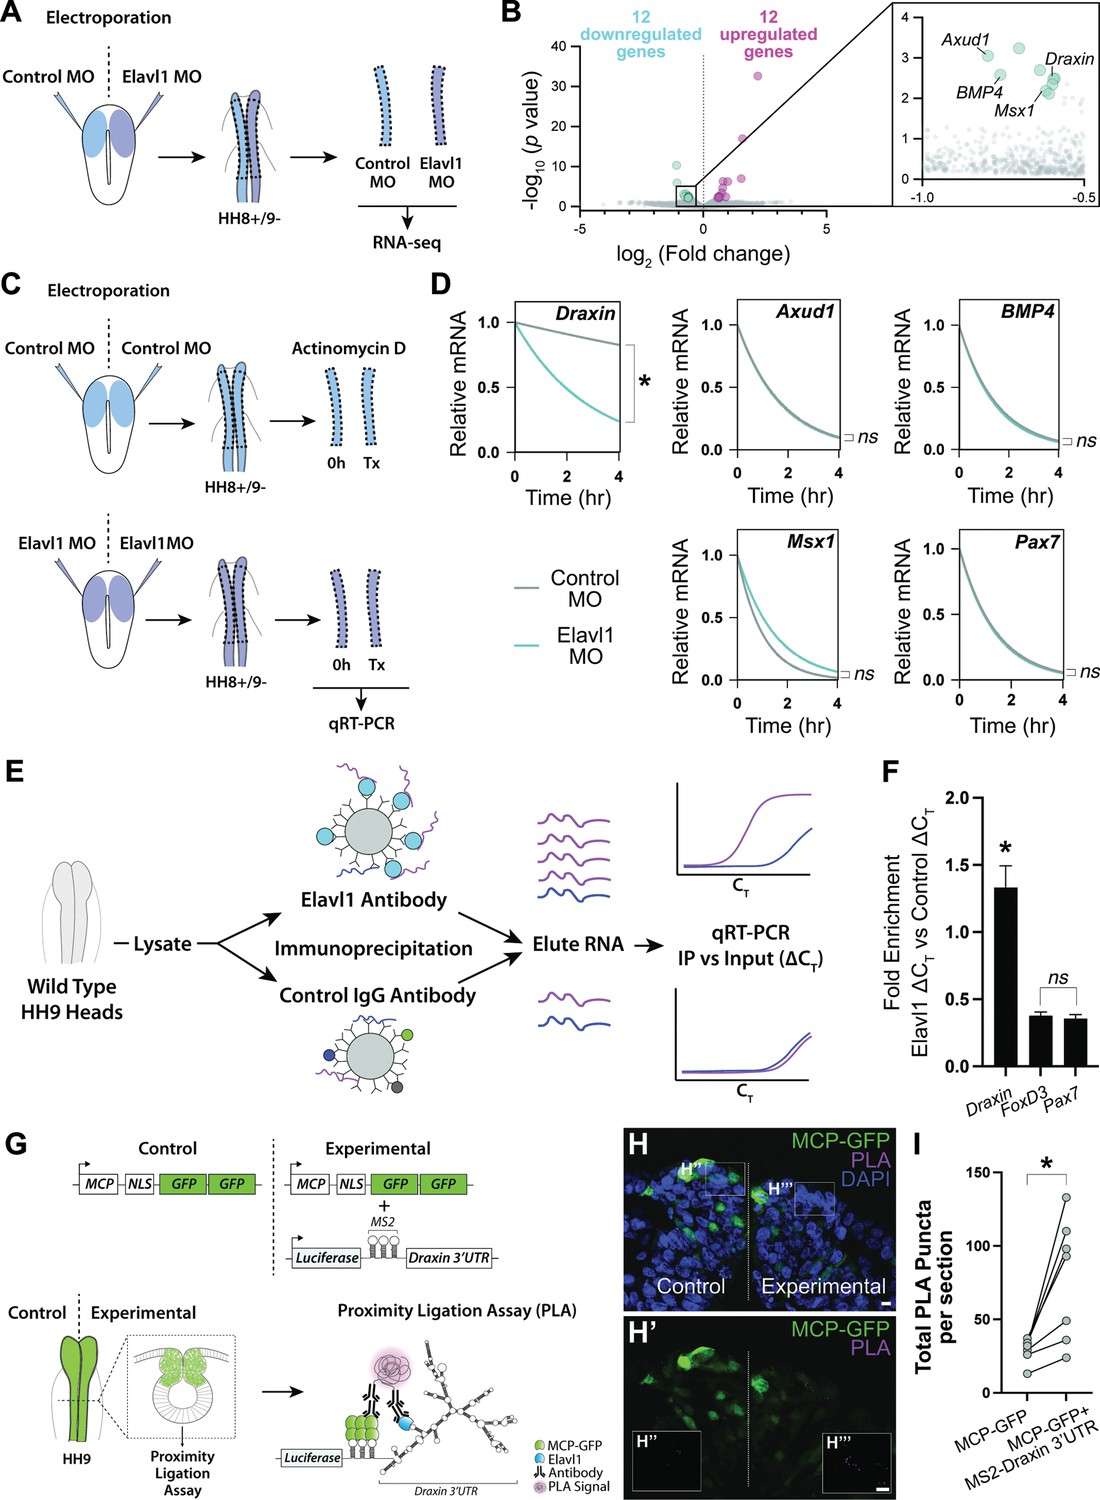
(A) Schematic diagram illustrating experimental design for RNA-sequencing (RNA-seq). Gastrula stage chick embryos were electroporated bilaterally with a standard control and translation-blocking morpholino (MO) targeting Elavl1. Dorsal neural folds were dissected from stage HH8+/9− embryos, pooled (n = 3), and processed for bulk RNA-seq (three biological replicates). (B) Volcano plot following differential expression analysis and filtering of RNA-seq data. Of the 24 genes differentially expressed following Elavl1 knockdown (12 upregulated, 12 downregulated), four genes (Draxin, Axud1, Msx1, BMP4) have established roles in neural crest development and were significantly downregulated. (C) Schematic diagram illustrating experimental design for RNA stability assay. Gastrula stage chick embryos were electroporated bilaterally with control or translation-blocking morpholino (MO) targeting Elavl1. Dorsal neural folds were dissected from stage HH8+/9− embryos; left neural folds were used as the 0 hr time point, whereas right neural folds were treated with actinomycin D for 30 min, 2 hr, or 4 hr prior to total RNA extraction and quantitative reverse transcription-PCR (qRT-PCR) to measure RNA decay. (D) Transcript stability plots show Draxin mRNA stability is significantly reduced (*p = 0.001, Mann–Whitney test) with Elavl1 knockdown (blue) compared to control (gray), whereas other neural crest mRNAs (Axud1, Msx1, BMP4, Pax7) are not (ns, nonsignificant, p > 0.37, Mann–Whitney test). (E) Schematic illustrating experimental design of RNA-binding protein/RNA co-immunoprecipitation (RIP) to test RNA association with Elavl1 in vivo for neural crest targets. Lysates generated from HH9 heads were incubated with antibody-coated beads for Elavl1 or a nonspecific IgG to co-immunoprecipitate protein with bound RNAs. In qRT-PCR, specifically bound RNAs would be more abundant and reach threshold before RNAs that were nonspecific, and therefore would have smaller CT values. CT, threshold cycle. (F) Fold enrichment of RNAs eluted from RIP (n = 16 embryos), quantified by qRT-PCR, performed in triplicate. ns, nonsignificant, p = 0.89, one-way analysis of variance (ANOVA) with Tukey’s post hoc test. *p < 0.001, one-way ANOVA with Tukey’s post hoc test. Error bars, standard error of the mean (SEM). (G) Schematic diagram illustrating experimental design for proximity ligation assay (PLA). Gastrula stage chick embryos were electroporated bilaterally with a construct expressing a nuclear localized, GFP-tagged MS2 bacteriophage coat protein (MCP-GFP) alone (left) or in combination with a construct containing a Luciferase coding region, MS2 stem loops (which are bound by MCP when transcribed), and the endogenous Draxin 3′-untranslated region (MS2-Draxin 3′UTR) (right). Following fixation and cross-sectioning at HH9, tissues were incubated with primary antibodies made in goat and rabbit that recognized GFP and Elavl1, respectively. Secondary antibodies against goat and rabbit IgG were labeled with complementary oligonucleotides that generate a fluorescent signal due to rolling circle amplification only when in close proximity (<40 nm). Thus, fluorescence signal (magenta) would indicate in vivo interaction between MCP-GFP and endogenous Elavl1. (H) Representative confocal maximum intensity projection micrograph of dorsal neural folds from cross-sectioned HH9 embryo bilaterally electroporated with MCP-GFP (green) alone (‘control’, left) or with MS2-Draxin 3′-UTR (‘experimental’, right), processed for PLA (magenta) as illustrated in panel (G), and stained for DAPI (blue). Boxes in (H) indicate zoomed-in areas in (H’’) and (H’’’). Scale bar, 5 μm. (I) Quantitation of total number of PLA puncta per section for (n = 3 embryos, 2 sections/embryo). *p = 0.016, two-tailed Wilcoxon matched-pairs signed-rank test.
Figure 4—figure supplement 1
RNA-sequencing (RNA-seq) identified four neural crest genes specifically downregulated with Elavl1 knockdown.
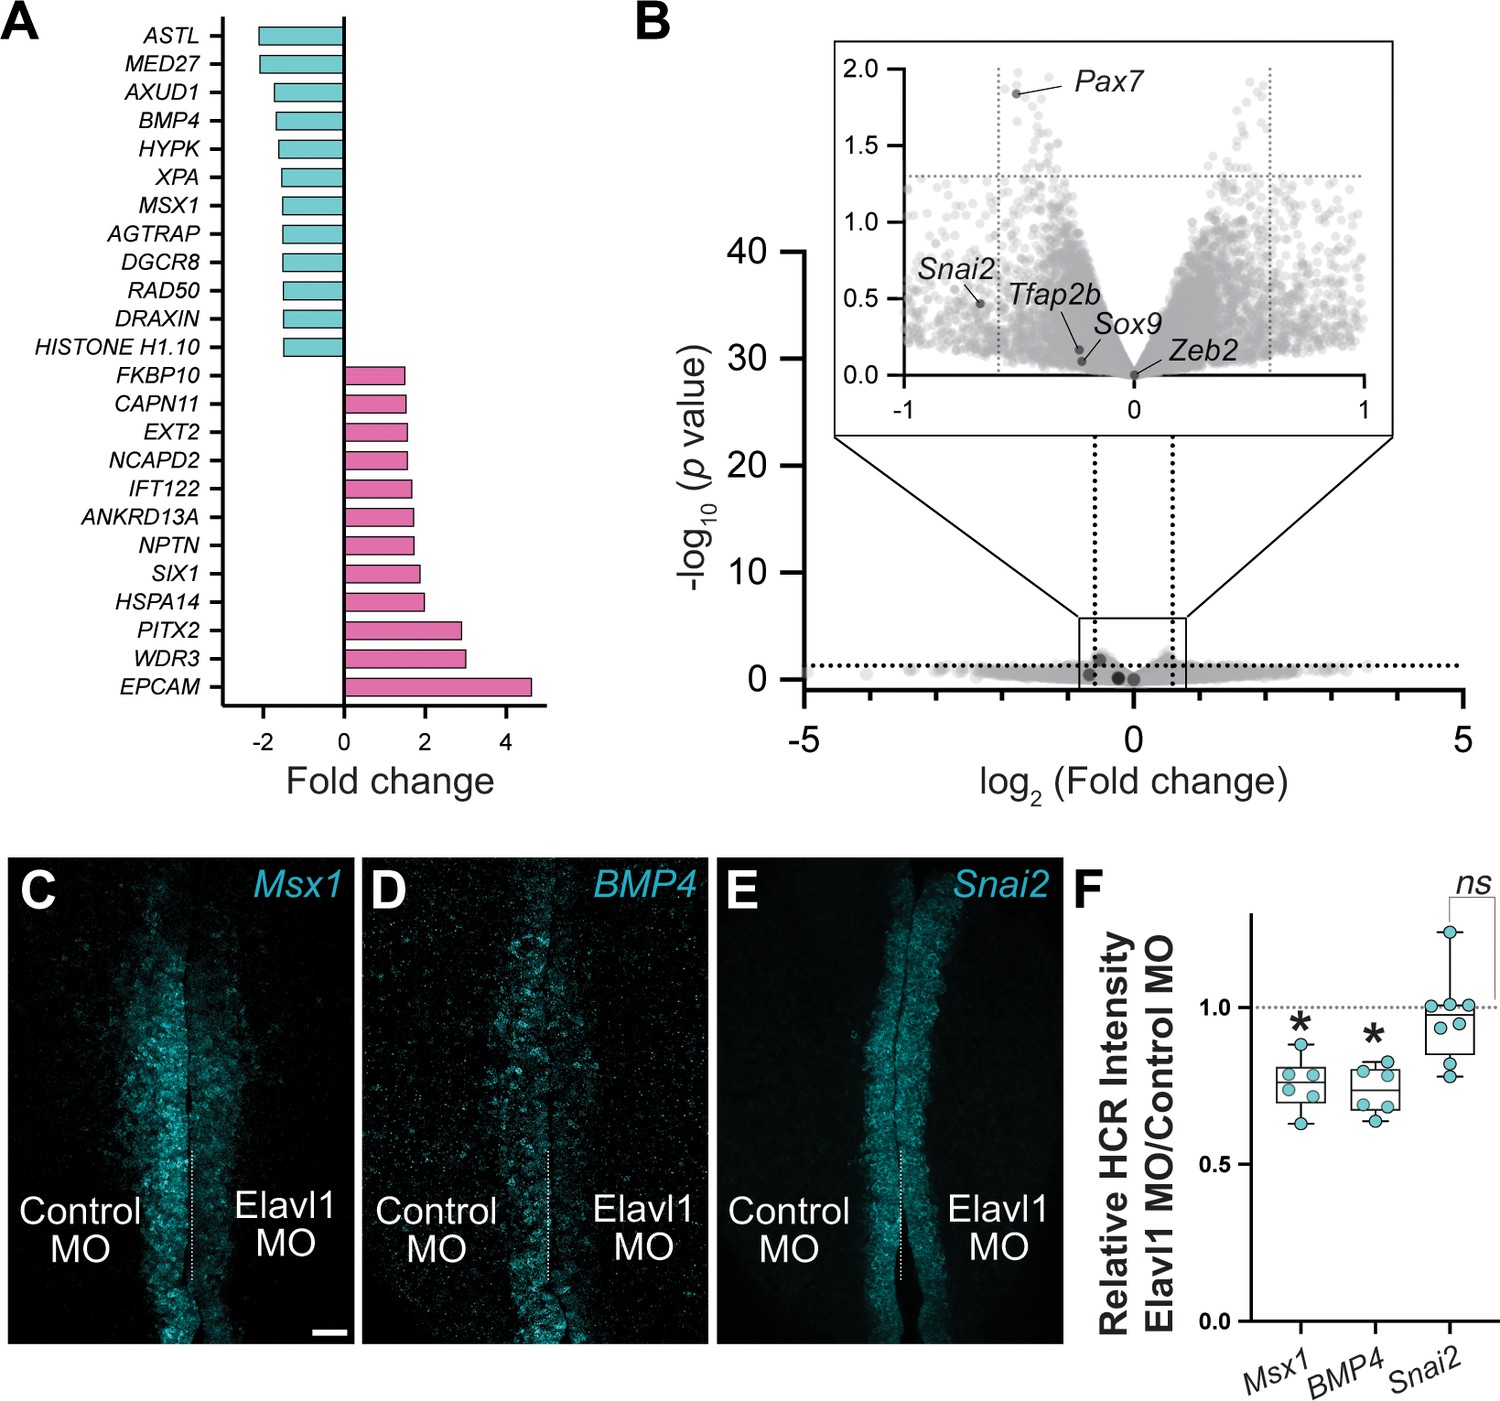
Although RNA-seq identified four genes with established roles in neural crest development (Draxin, Axud1, Msx1, BMP4) that were significantly downregulated with Elavl1 knockdown (A), several other neural crest genes were unaffected (B). (B) Volcano plot of genes that were not significantly different for Elavl1 knockdown versus control, with known neural crest genes Pax7, Tfab2b, Snai2, Sox9, and Zeb2 indicated. Representative confocal maximum intensity projection micrographs of hybridization chain reaction (HCR) processed embryos for Msx1 (n = 6) (C), BMP4 (n = 6) (D), and Snai2 (n = 8) (E). (F) Quantitation of HCR processed embryos for control versus Elavl1 knockdown, calculated as ratio of Elavl1 MO versus control MO integrated density. Dotted white line indicates midline. MO, morpholino. Scale bar, 50 μm. *p < 0.001; ns, nonsignificant, p = 0.54; one sample t-test.
Figure 4—figure supplement 2
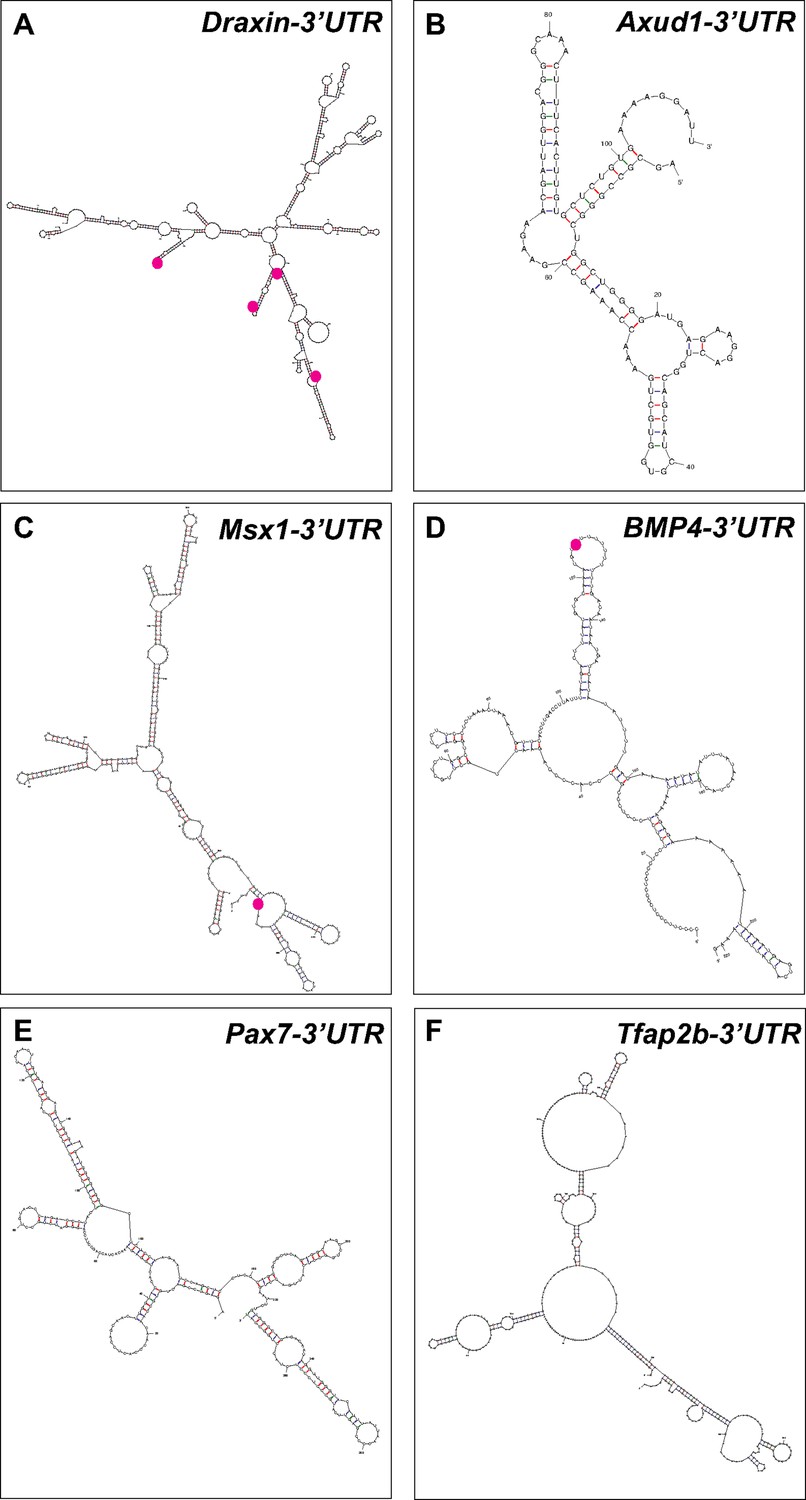
Putative Elavl1-binding sites within the Draxin 3′-untranslated region (UTR) predicts a direct interaction.
Representative secondary structures of the Draxin UTR (A), Axud1 3′-UTR (B), Msx1 3′-UTR (C), BMP4 3′-UTR (D), Pax7 3′-UTR (E), and Tfap2b 3′-UTR (F), predicted by ‘mfold’ analysis. Predicted Elavl1-binding sites are highlighted using magenta dots.
Figure 5
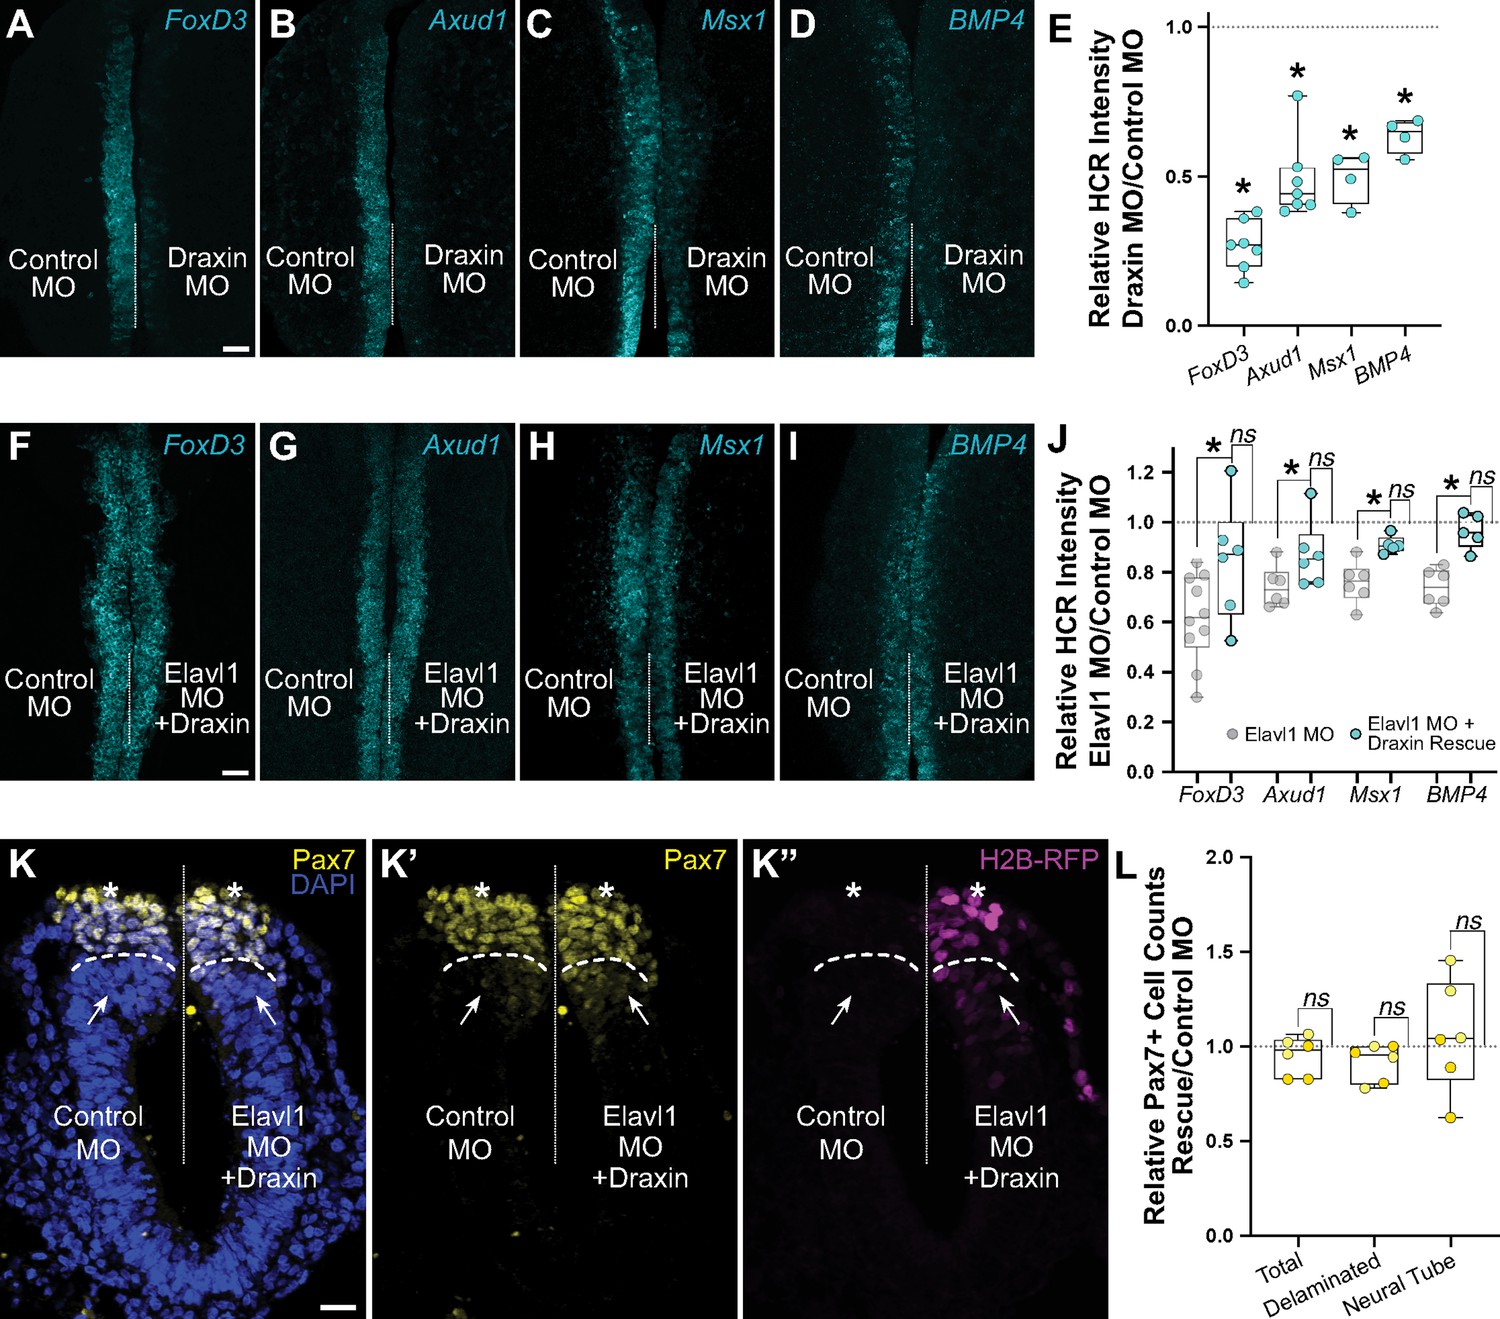
Elavl1 knockdown phenotypes are rescued by Draxin.
Representative confocal maximum intensity projection micrographs of hybridization chain reaction (HCR) processed embryos for FoxD3 (n = 7) (A), Axud1 (n = 7) (B), Msx1 (n = 4) (C), and BMP4 (n = 4) (D) transcripts in whole mount embryos bilaterally electroporated with control morpholino (left) or Draxin morpholino (right). Dotted white line indicates midline. MO, morpholino. Scale bar, 50 μm. (E) Quantitation of HCR processed embryos for control versus Elavl1 knockdown, calculated as ratio of Elavl1 MO versus control MO integrated density. *p < 0.02, Wilcoxon matched-pairs signed rank or paired t-test as indicated in text. Representative confocal maximum intensity projection micrographs of HCR processed embryos for FoxD3 (n = 6) (F), Axud1 (n = 6) (G), Msx1 (n = 5) (H), and BMP4 (n = 5) (I) transcripts in whole mount embryos bilaterally electroporated with control morpholino (left) or Elavl1 morpholino and a Draxin overexpression construct (right). Dotted white line indicates midline. MO, morpholino. Scale bar, 50 μm. (J) Quantitation of HCR processed embryos for control versus Elavl1 knockdown with Draxin rescue, calculated as ratio of Elavl1 MO + Draxin versus control MO integrated density. ns, nonsignificant, p > 0.09, Wilcoxon signed-rank test. Grayed values indicating Elavl1 MO data were originally presented in Figure 3 and are reproduced here to illustrate rescue. *p < 0.05, one-tailed paired t-test. (K) Representative apotome maximum intensity projection micrographs of cross-sectioned embryo bilaterally electroporated with control MO (left) or Elavl1 MO + Draxin overexpression (right), immunostained for Pax7 (yellow). Draxin overexpression is indicated by expression of H2B-RFP (magenta). Nuclei were stained with DAPI (blue). Dotted white line indicates midline. Dashed white lines indicate limit of dorsal neural tube. Arrows indicate ‘neural tube’ Pax7 cells. Asterisks indicate ‘delaminated’ Pax7 cells. Scale bar, 20 μm. (L) Quantification of the ratio of Pax7 + cells on Elavl1 MO + Draxin (right, ‘Rescue’) versus control MO (left) sides of cross-sections. Data are from individual sections; sections from same embryo are displayed in same color (n = 3 embryos, 6 sections). ns, nonsignificant, p > 0.12, one-sample Wilcoxon signed-rank test.
Tables
Appendix 1—key resources table
| Reagent type (species) or resource | Designation | Source or reference | Identifiers | Additional information |
|---|---|---|---|---|
| Gene (Gallus gallus) | Elavl1 | GenBank | NM_204833.1 | |
| Gene (Gallus gallus) | Draxin | GenBank | AB427147.1 | |
| Gene (Gallus gallus) | Axud1 (CSRNP1) | This paper | GenBank: ON920861 | 3′-Untranslated region |
| Gene (Gallus gallus) | Msx1 | Ensembl | ENSGALT00000024209.4 | |
| Gene (Gallus gallus) | BMP4 | Ensembl | ENSGALT00000020316.7 | |
| Gene (Gallus gallus) | Tfap2b | Ensembl | ENSGALT00000026916.6 | |
| Gene (Gallus gallus) | Pax7 | Ensembl | ENSGALT00000048594.2 | |
| Strain, strain background (Gallus gallus) | Rhode Island Red | Sun State Ranch (Monrovia, CA, USA) | ||
| Antibody | Rabbit anti-Elavl1 | Abcam | Cat# ab196626 | 1:100 immunohistochemistry; 5 µg immunoprecipitation |
| Antibody | Mouse IgG1 anti-Pax7 | Developmental Studies Hybridoma Bank | Cat# pax7, RRID:AB_528428 | 1:5 |
| Antibody | Goat IgG anti-GFP | Rockland | Cat# 600-101-215, RRID:AB_218182 | 1:500 |
| Antibody | Rabbit IgG, polyclonal – Isotype Control (ChIP Grade) | Abcam | Cat# ab171870 | 5 µg immunoprecipitation |
| Recombinant DNA reagent | pCI-H2B-RFP (plasmid) | Betancur et al., 2010 | N/A | |
| Recombinant DNA reagent | pCIG (plasmid) | Megason and McMahon, 2002 | N/A | |
| Recombinant DNA reagent | Draxin-FLAG (plasmid) | Hutchins and Bronner, 2018 | N/A | |
| Recombinant DNA reagent | MCP-GFP (plasmid) | Hutchins et al., 2020 | N/A | |
| Recombinant DNA reagent | MS2-Draxin 3′-UTR (plasmid) | This paper; Hutchins et al., 2020 | N/A | |
| Sequence-based reagent | Control morpholino | GeneTools | N/A | 5′-CCTCTTACCTCAGTTACAATTTATA |
| Sequence-based reagent | Elavl1 morpholino | This paper; GeneTools | N/A | 5′-GACATCTTATAACGTATCTCGCTGC |
| Sequence-based reagent | Draxin morpholino | Hutchins and Bronner, 2018; GeneTools | N/A | 5′-AAGGTGGAAGAAGCTGCCATAATCC |
| Sequence-based reagent | Draxin qPCR primers | This paper; IDT | Custom DNA oligos | Forward: 5′-CTACGCTGTTATGCCAAATTCC; Reverse: 5′-GAATGATCCCTGCTCTCCATT |
| Sequence-based reagent | Axud1 qPCR primers | This paper; IDT | Custom DNA oligos | Forward: 5′-TCCAGTCCTTCTCGGACTATAA; Reverse: 5′-GGGAAATTAGGCAACTGAAACTG |
| Sequence-based reagent | Msx1 qPCR primers | This paper; IDT | Custom DNA oligos | Forward: 5′-AGCTGGAGAAGCTGAAGATG; Reverse: 5′-AGGCTCCGTACAGGGAT |
| Sequence-based reagent | BMP4 qPCR primers | This paper; IDT | Custom DNA oligos | Forward: 5′-TTGGTCAACTCCGTCAACTC; Reverse: 5′-CAGCACCACCTTGTCATACT |
| Sequence-based reagent | Pax7 qPCR primers | This paper; IDT | Custom DNA oligos | Forward: 5′-CAAACCAACTCGCAGCATTC; Reverse: 5′-CTGCCTCCATCTTGGGAAAT |
| Sequence-based reagent | FoxD3 qPCR primers | This paper; IDT | Custom DNA oligos | Forward: 5′-CATCTGCGAGTTCATCAGCA; Reverse: 5'-TTCACGAAGCAGTCGTTGAG |
| Sequence-based reagent | 3′-RACE QT primer | Scotto-Lavino et al., 2006; IDT | Custom DNA oligos | 5′-CCAGTGAGCAGAGTGACGAGGACTCGAGCTCAAGCTTTTTTTTTTTTTTTTT |
| Sequence-based reagent | 3′-RACE QO primer | Scotto-Lavino et al., 2006; IDT | Custom DNA oligos | 5′-CCAGTGAGCAGAGTGACG |
| Sequence-based reagent | 3′-RACE QI primer | Scotto-Lavino et al., 2006; IDT | Custom DNA oligos | 5′-GAGGACTCGAGCTCAAGC |
| Sequence-based reagent | 3′-RACE Axud1 Gene Specific Primer 1 | This paper; IDT | Custom DNA oligos | 5′-CGTGTTCCAAGAGCTATGCC |
| Sequence-based reagent | 3′-RACE Axud1 Gene Specific Primer 2 | This paper; IDT | Custom DNA oligos | 5′-GGTTTCCCGCAAGCTGG |
| Commercial assay or kit | RNAqueous-Micro Total RNA isolation kit | Ambion | Cat# AM1931 | |
| Commercial assay or kit | SMART-Seq v4 Ultra Low Input cDNA kit | Takara Bio | Cat# 634889 | |
| Commercial assay or kit | Agencourt AMPure XP beads | Beckman Coulter | Cat# A63880 | |
| Commercial assay or kit | Endofree maxi prep kit | Qiagen | Cat# 12362 | |
| Commercial assay or kit | Duolink In Situ PLA Probe Anti-Rabbit MINUS | Millipore/Sigma | Cat# DUO92005 | |
| Commercial assay or kit | Duolink In Situ PLA Probe Anti-Goat PLUS | Millipore/Sigma | Cat# DUO92003 | |
| Commercial assay or kit | Duolink In Situ Detection Reagents FarRed | Millipore/Sigma | Cat# DUO92013 | |
| Commercial assay or kit | Duolink In Situ Wash Buffers, Fluorescence | Millipore/Sigma | Cat# DUO82049 | |
| Chemical compound, drug | Duolink In Situ Mounting Medium with DAPI | Millipore/Sigma | Cat# DUO82040 | |
| Chemical compound, drug | Fluoromount-G | SouthernBiotech | Cat# 0100-01 | |
| Chemical compound, drug | DAPI | Thermo Fisher | Cat# D1306 | 1:5000 |
| Chemical compound, drug | FastStart Universal SYBR Green Master (Rox) | Millipore/Sigma | Cat# FSUSGMMRO | |
| Chemical compound, drug | SuperScript III Reverse Transcriptase | Thermo Fisher | Cat# 18080044 | |
| Chemical compound, drug | cOmplete, Mini, EDTA-free Protease Inhibitor | Millipore/Sigma | Cat# 11836170001 | |
| Chemical compound, drug | RNaseOUT Recombinant Ribonuclease Inhibitor | Thermo Fisher | Cat# 10777019 | |
| Chemical compound, drug | Accumax | Innovative Cell Technologies, Inc | Cat# AM105 | |
| Chemical compound, drug | Protein G Dynabeads | Thermo Fisher | Cat# 10003D | |
| Chemical compound, drug | Actinomycin D | Millipore/Sigma | Cat# A9415 | 10 µg/ml |
| Software, algorithm | Fiji | Schindelin et al., 2012 | RRID:SCR_002285 | https://imagej.net/Fiji |
| Software, algorithm | Seurat | Butler et al., 2018 | RRID:SCR_007322 | https://satijalab.org/seurat/ |
| Software, algorithm | QuantStudio Design & Analysis software, version 2.4 | Life Technologies | RRID:SCR_018712 | |
| Software, algorithm | Zen 2 Blue | Zeiss | N/A | |
| Software, algorithm | Zen Black | Zeiss | N/A | |
| Software, algorithm | Photoshop CC | Adobe | N/A | |
| Software, algorithm | Prism8, Prism9 | GraphPad | N/A | |
| Software, algorithm | FastQC | Andrews, 2014 | RRID:SCR_014583 | |
| Software, algorithm | Cutadapt | Martin, 2011 | RRID:SCR_011841 | |
| Software, algorithm | Bowtie2 | Langmead and Salzberg, 2012 | RRID:SCR_016368 | |
| Software, algorithm | HTSeq-Count | Anders et al., 2015 | RRID:SCR_011867 | |
| Software, algorithm | biomaRt package | Durinck et al., 2009 | RRID:SCR_019214 | |
| Software, algorithm | mfold | Zuker, 2003 | RRID:SCR_008543 | |
| Software, algorithm | G*Power | Faul et al., 2007 | RRID:SCR_013726 | |
| Other, deposited data | sc-RNA (SmartSeq2) | Williams et al., 2019 | GEO: GSE130500 | Single-cell RNA-sequencing datasets; see Figure 1 and Data Availability Statement |
| Other, deposited data | RNA-seq data (bulk) | This paper | NCBI Bioproject: PRJNA861325 | Single-end RNA-sequencing datasets; see Figure 4 and Data Availability Statement |
Additional files
Download links
A two-part list of links to download the article, or parts of the article, in various formats.
Downloads (link to download the article as PDF)
Open citations (links to open the citations from this article in various online reference manager services)
Cite this article (links to download the citations from this article in formats compatible with various reference manager tools)
RNA-binding protein Elavl1/HuR is required for maintenance of cranial neural crest specification
eLife 11:e63600.
https://doi.org/10.7554/eLife.63600


