Leptin receptor neurons in the dorsomedial hypothalamus regulate diurnal patterns of feeding, locomotion, and metabolism
- UW Medicine Diabetes Institute, Department of Medicine, University of Washington, United States
- Department of Neurosurgery, Barrow Neurological Institute, United States
Figures
Figure 1 with 2 supplements

Silencing DMHLepR neurons elicits transient hyperphagia and increased adiposity in adult male mice.
(A) Experimental schematic for chronic inhibition of DMHLepR by microinjection on day 0 of an AAV1 containing a Cre-dependent GFP-fused TeTx delivered bilaterally to the DMH of LepR-Cre+ male mice (TeTx; n=7) and Cre-negative littermate controls (control; n=5). (B) Stereological fluorescent images from a representative animal showing the rostral-caudal extent of GFP:TeTx expression. (C) Left: colorized, higher magnification view of the boxed orange region from (B). Middle: higher magnification view of the boxed orange region showing neuronal cell bodies targeted within the DMH. Right: higher magnification view of the boxed red region showing GFP:TeTx+ terminals of targeted DMHLepR neurons within the arcuate nucleus (ARC). (D) Mean daily food intake following viral microinjection. Two-way ANOVA: F(1,10)=4.658; p=0.0563 (main effect of TeTx); F(14,140)=4.886; p<0.0001 (time x TeTx interaction). (E) Mean daily food intake from week 1 relative to week 4. Two-way ANOVA: F(1,10)=5.575; p=0.0399 (main effect of TeTx); F(1,10)=39; p<0.001 (time x TeTx interaction). (F) Body weight expressed as %day 0 value. Two-way ANOVA: F(1,10)=20.18; p=0.0012 (main effect of TeTx). F(19,190)=14.67; p<0.0001 (time x TeTx interaction). (G) Fat, lean, and total mass 26 days after viral microinjection. Multiple t-tests; tfat=4.847; p=0.0014; ttotal=2.884; p=0.016. (H) Plasma leptin 21 days after viral microinjection. Unpaired t-test, t=5.17, p=0.0017. Data are mean ± SEM. For repeated measures, post hoc Sidak’s test for each time point is indicated on the graph. *p<0.05,**p<0.01, ***p<0.001, ****p<0.0001.
-
Figure 1—source data 1
Longitudinal measures following DMH-LepR TeTx.
- https://cdn.elifesciences.org/articles/63671/elife-63671-fig1-data1-v2.xlsx
Figure 1—figure supplement 1
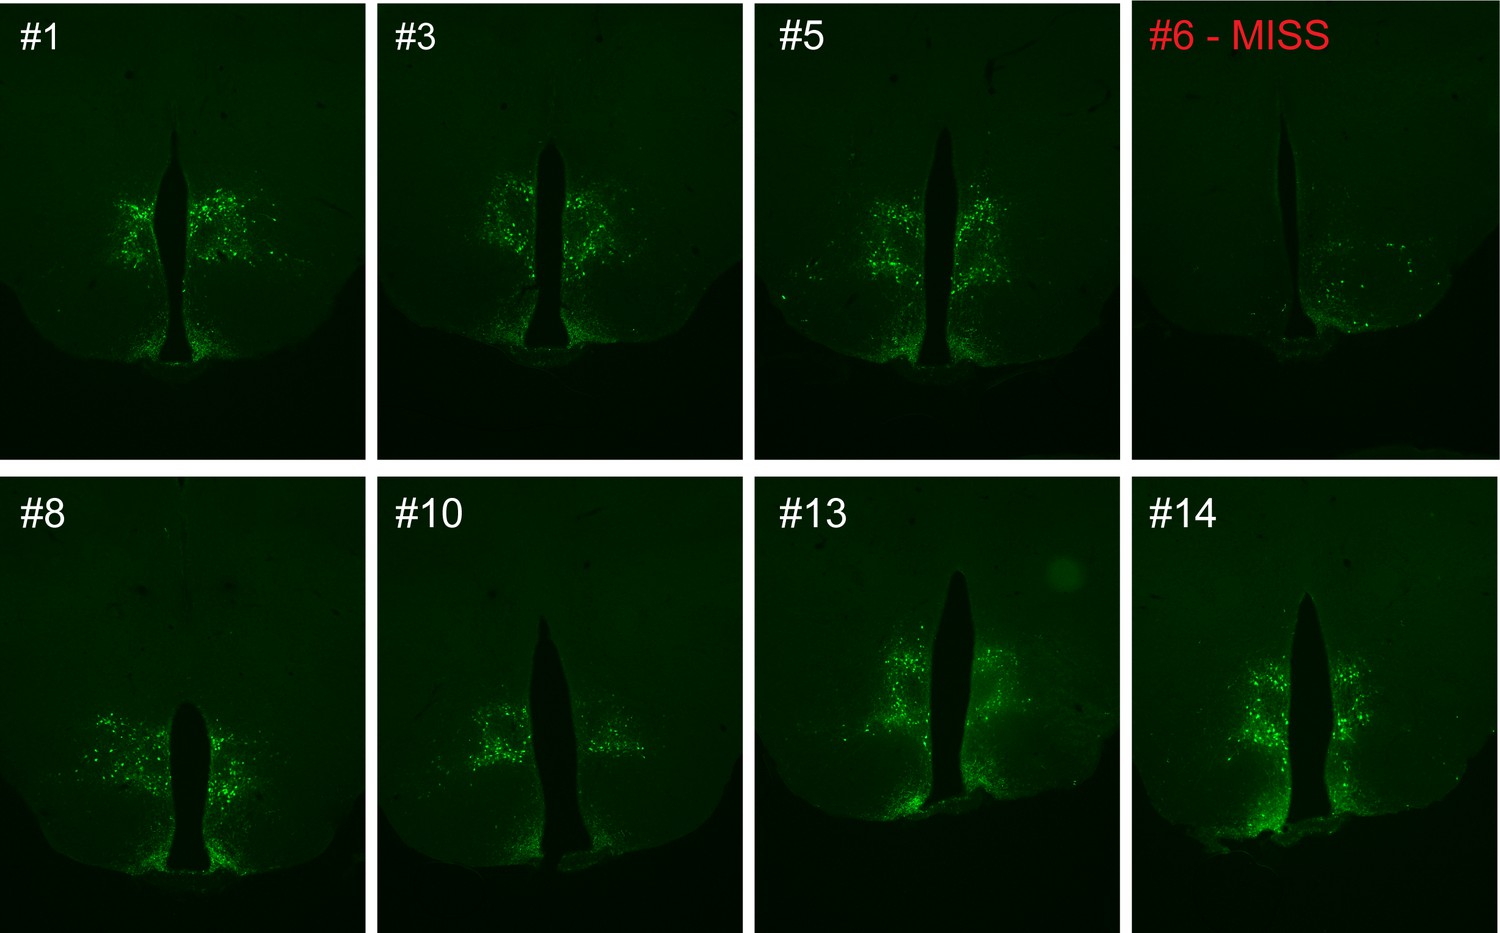
Representative viral expression is evident in both the ventral and dorsal compartments of the dorsomedial hypothalamic nucleus (DMH) following microinjection of GFP:TeTx to the DMH of LepR-Cre+ male mice.
Animal #6 represents a surgical miss and was excluded from all analyses.
Figure 1—figure supplement 2

Silencing DMHLepR neurons in female mice recapitulates body weight and fat mass increase observed in males, but not acute hyperphagia.
(A) Average daily food intake following chronic inhibition of DMHLepR by bilateral microinjection on day 0 of a Cre-dependent GFP:TeTx delivered to LepR-Cre+ female mice (TeTx; n=9) and Cre-negative littermate controls (control; n=5). Two-way ANOVA: F(1,12)=0.3474; p=0.5665 (main effect of TeTx); F(13,156)=1.563, p=0.1014 (time x TeTx interaction). (B) Cumulative food intake for the first 11 days in A (inset). Two-way ANOVA: F(1,12)=1.503; p=0.2437 (main effect of TeTx); F(10,120)=1.427, p=0.1766 (time x TeTx interaction). (C) Daily body weight expressed as %day 0 value. Two-way ANOVA: F(1,12)=7.11; p=0.0205 (main effect of TeTx); F(14,168)=15.83, p<0.0001 (time x TeTx interaction). (D) Fat, lean, and total mass 14 days after viral microinjection. Multiple t-tests; tfat=3.268; p=0.0024; ttotal=4.705; p<0.0001. Data are mean ± SEM. *p<0.05,**p<0.01, ***p<0.001, ****p<0.0001.
Figure 2
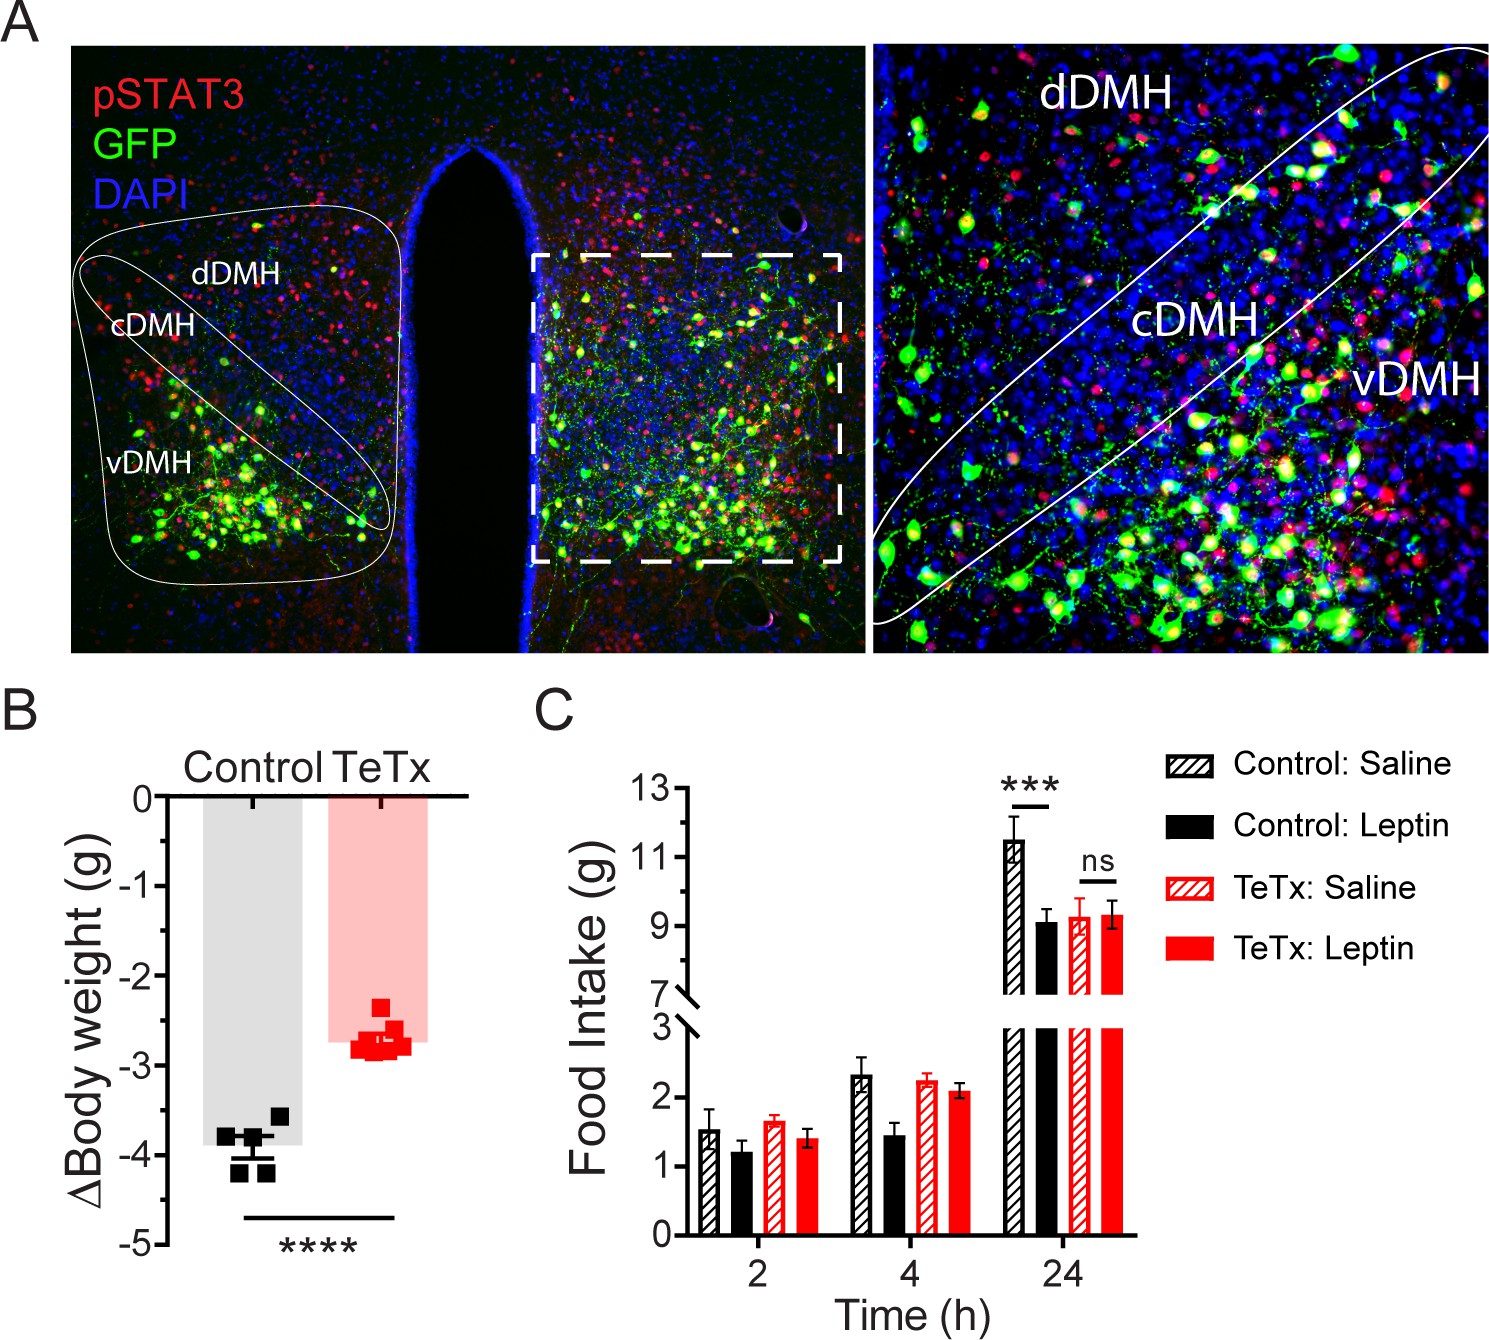
Validation of DMHLepR neuronal targeting and evidence that activation of these neurons is required for leptin-induced anorexia.
(A) Left: Representative image showing extensive overlap of pSTAT3 expression in GFP:TeTx-expressing DMHLepR in mice sacrificed 90 min after leptin administration (i.p. 5 mg/kg). Right: Higher magnification view of the boxed region from the left. (B) Change in body weight (unpaired t-test, t=8.483, p=0.0001) following a 24 hr (ZT2–ZT2’) fast 5 weeks following viral microinjection and before food was returned in (C). (C) Post-fast (24 hr) refeeding following i.p. injection of saline or leptin (3 mg/kg). Two-way ANOVA: F(1,4)=47.33; p=0.0023 (controls, main effect of leptin). F(1,6)=0.1203; p=0.7405 (TeTx, main effect of leptin). v-, c-, and dDMH = ventral, central, and dorsal compartments of the DMH, respectively. Data are mean ± SEM. For repeated measures, post hoc, Sidak’s test at each time point is indicated on the graph. *p<0.05, ***p<0.001, ****p<0.0001.
-
Figure 2—source data 1
Fast-refeeding +/- Leptin.
- https://cdn.elifesciences.org/articles/63671/elife-63671-fig2-data1-v2.xlsx
Figure 3 with 2 supplements
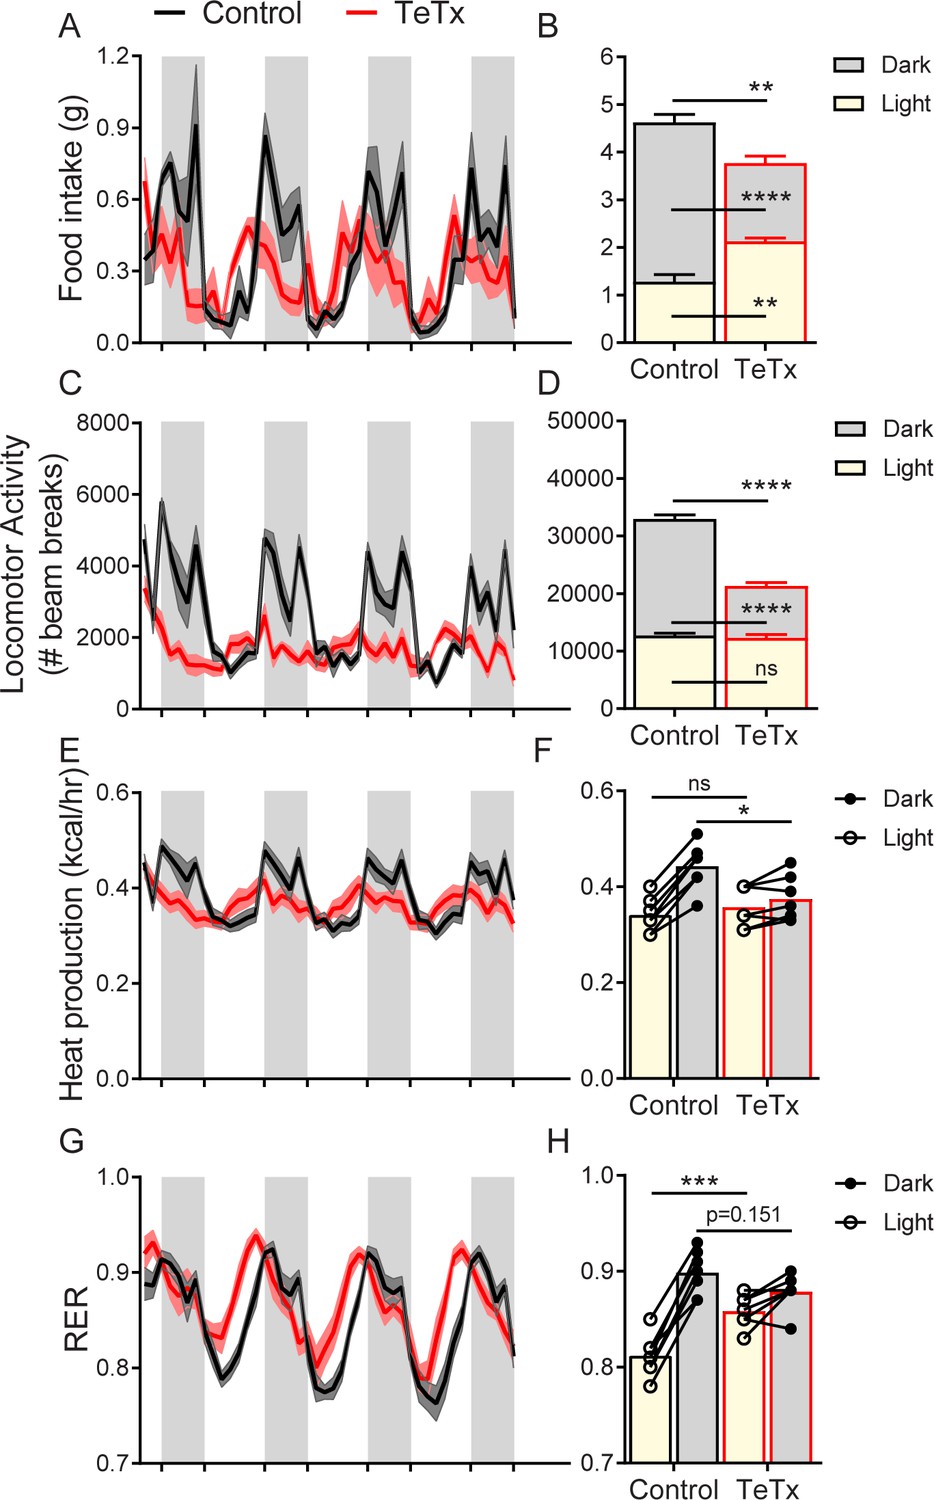
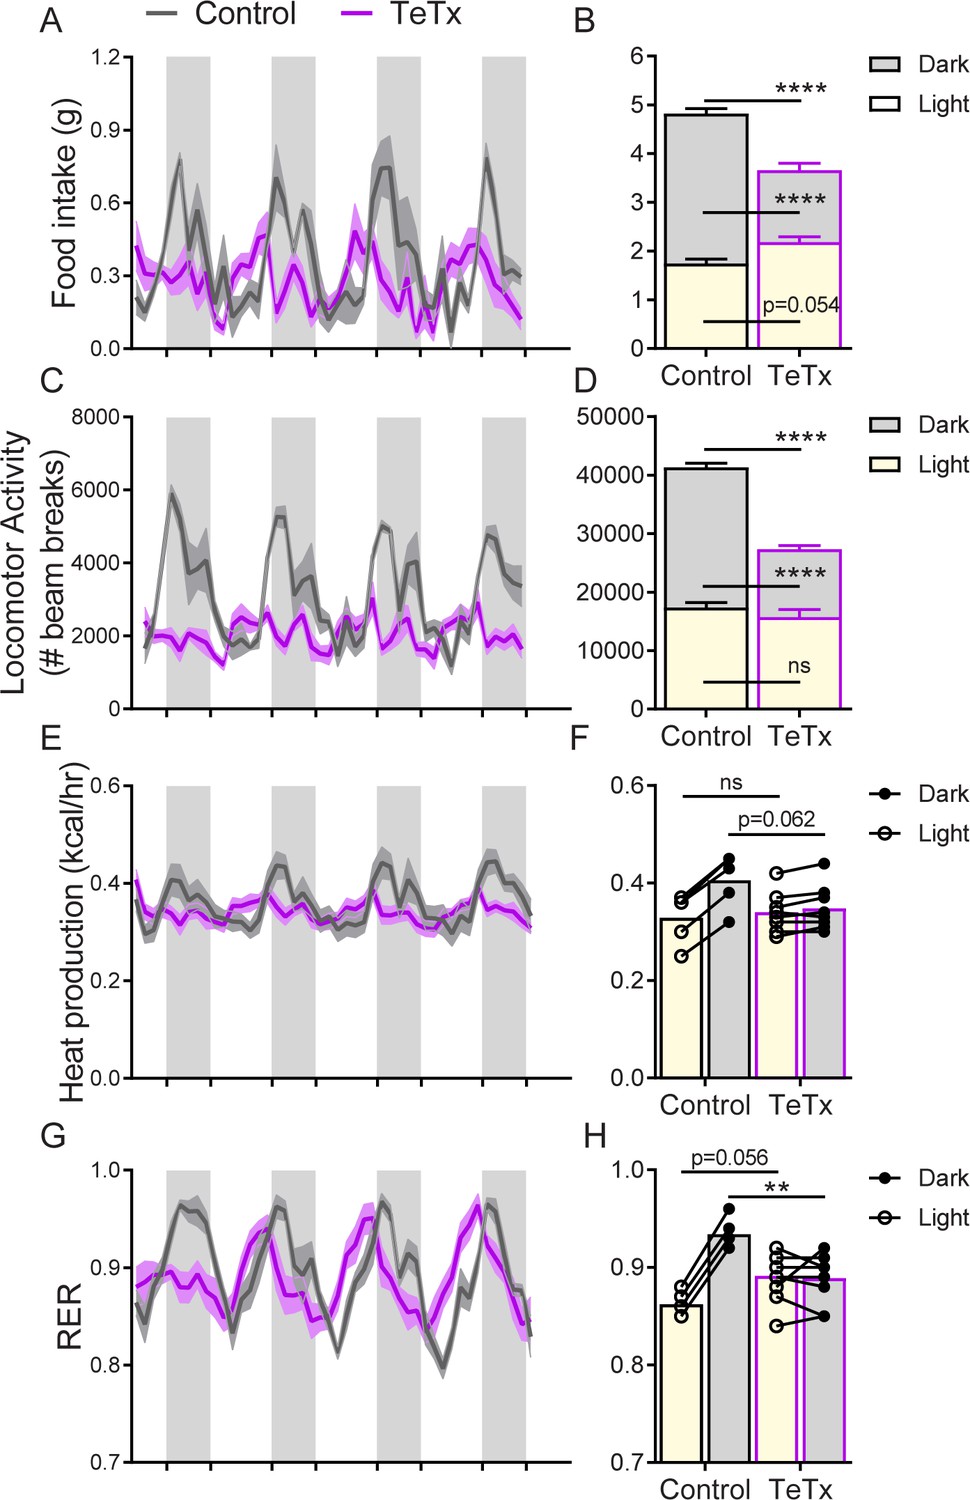
DMHLepR neuron inactivation disrupts diurnal patterns of food intake, LMA, heat production, and substrate utilization.
Two-hour binned continuous measures (left panels) and mean values across the light (L) and dark (D) periods (right panels) 30 days following microinjection of GFP:TeTx (TeTx; n=7) or GFP control (control; n=7) to the dorsomedial hypothalamic nucleus (DMH) of LepR-Cre+ male mice. Shaded areas indicate dark cycle (ZT14 – ZT24). (A) Food intake. Two-way ANOVA: F(1,12)=12; p=0.0047 (main effect of TeTx). F(87,1044)=2.354; p<0.0001 (time x TeTx interaction). (B) Mean food intake from (A) during L, D, and 24-hr periods. Two-way ANOVA: F(1,12)=9.567; p=0.0093 (main effect of TeTx). (C) Locomotor activity (LMA). Two-way ANOVA: F(1,12)=93.22; p<0.0001 (main effect of TeTx). (D) Mean LMA from (C) during L, D, and 24-hr periods. Two-way ANOVA: F(1,12)=110.4; p<0.0001 (main effect of TeTx). (E) Heat production. Two-way ANOVA: F(1,12)=1.006; p=0.3357 (main effect of TeTx). (F) Mean heat production from (E) during L and D periods. Two-way ANOVA: F(1,12)=1.209; p=0.2930 (main effect of TeTx). (G) Respiratory exchange ratio (RER). Two-way ANOVA: F(1,12)=2.789; p=0.1208 (main effect of TeTx). (H) Mean RER from (G) during L and D periods. Two-way ANOVA: F(1,12)=2.04; p=0.1788 (main effect of TeTx). Data are mean ± SEM. For repeated measures, post hoc, Sidak’s test at each time point is indicated on the graph. *p<0.05,**p<0.01, ***p<0.001, ****p<0.0001.
-
Figure 3—source data 1
Female calorimetry.
- https://cdn.elifesciences.org/articles/63671/elife-63671-fig3-data1-v2.xlsx
Figure 3—figure supplement 1
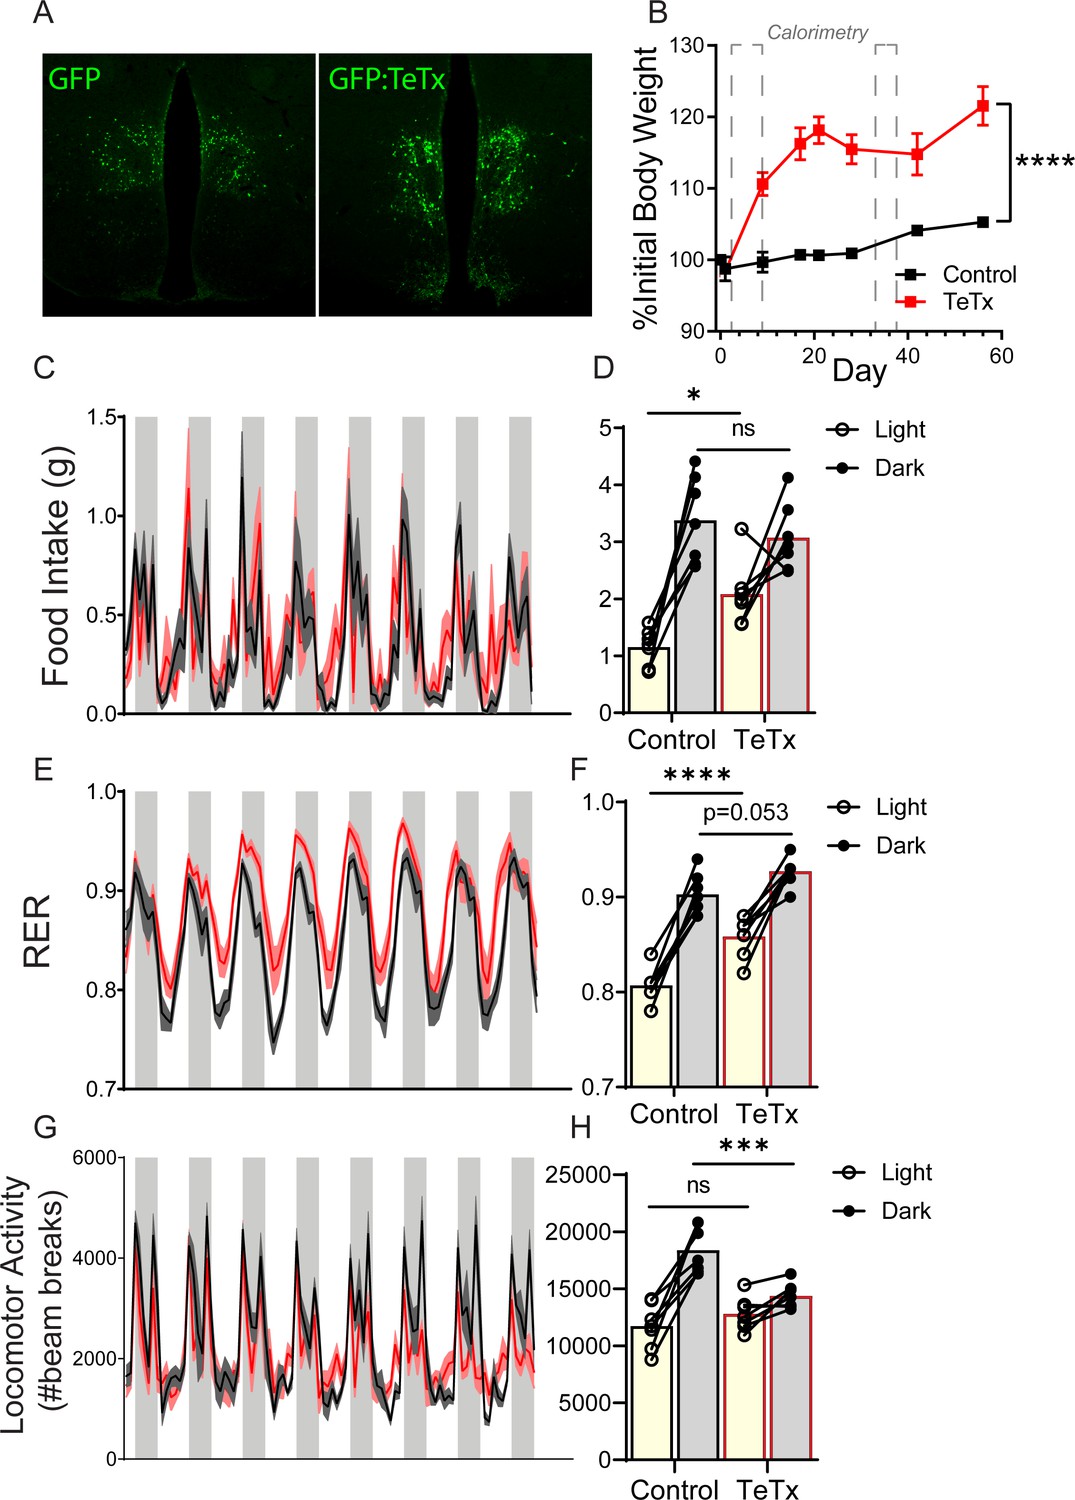
Silencing DMHLepR neurons rapidly and robustly disrupts diurnal rhythms in food intake, peripheral substrate utilization, and LMA.
(A) Representative viral expression in DMHLepR from LepR-Cre+ male mice injected bilaterally with an AAV encoding Cre-dependent GFP (left) as a control (control; n=7) or Cre-dependent GFP:TeTx (right; TeTx; n=7). (B) Daily body weight expressed as %day 0 value. Two-way ANOVA: F(1,12)=37.82; p<0.0001 (main effect of TeTx); F(7,84)=25.17; p<0.0001 (time x TeTx interaction). Dashed boxes indicate periods wherein mice were housed in calorimetry 2 days after microinjection (this figure) and 30 days after microinjection (Figure 3). Shaded areas indicate dark cycle (ZT14–ZT24). (C) Food intake (2 hr binned). (D) Photoperiod-averaged food intake from (C). Two-way ANOVA: F(1,12)=3.151; p=0.1012 (main effect of TeTx); F(1,12)=5.725; p=0.034 (time x TeTx interaction). (E) Respiratory exchange ratio (RER; 2 hr binned). (F) Photoperiod-averaged RER from (E). Two-way ANOVA: F(1,12)=25.16; p=0.0003 (main effect of TeTx); F( 1,12)=3.747; p=0.0768 (time x TeTx interaction). (G) Locomotor activity (LMA; 2 hr binned). (H) Photoperiod-averaged LMA from (G). Two-way ANOVA: F(1,12)=4.673; p=0.0516 (main effect of TeTx); F(1,12)=17.64; p=0.0012 (time x TeTx interaction).
Figure 3—figure supplement 2
Silencing DMHLepR neurons in female mice recapitulates the effect in males to disrupt diurnal rhythms.
Two-hour binned continuous measures (left panels) and photoperiod-averaged values (right panels) 30 days following bilateral microinjection of Cre-dependent GFP:TeTx (TeTx; n=9) or GFP control (control; n=5) to the dorsomedial hypothalamic nucleus (DMH) of LepR-Cre+ female mice. Shaded areas indicate dark cycle (ZT14–ZT24). (A) Food intake. Two-way ANOVA: F(1,12)=12.32; p=0.0043 (main effect of TeTx). F(89,1068)=2.766, p<0.0001; F(89,1068)=2.766; p<0.0001 (time x TeTx interaction). (B) Mean food intake from (A) during L, D, and 24-hr periods. Two-way ANOVA: F(1,12)=16.26; p=0.0017 (main effect of TeTx). (C) Locomotor activity (LMA). Two-way ANOVA: F(1,12)=36.22; p<0.0001 (main effect of TeTx); F(89,1068) = 5.197; p<0.0001 (time x TeTx interaction). (D) Mean LMA from (C) during L, D, and 24-hr periods. Two-way ANOVA: F(1,12)=27.98; p=0.0002 (main effect of TeTx). (E) Heat production. Two-way ANOVA: F(1,12)=0.5405; p=0.4764 (main effect of TeTx); F(89,1068)=5.903; p<0.0001 (time x TeTx interaction).
Figure 4 with 1 supplement
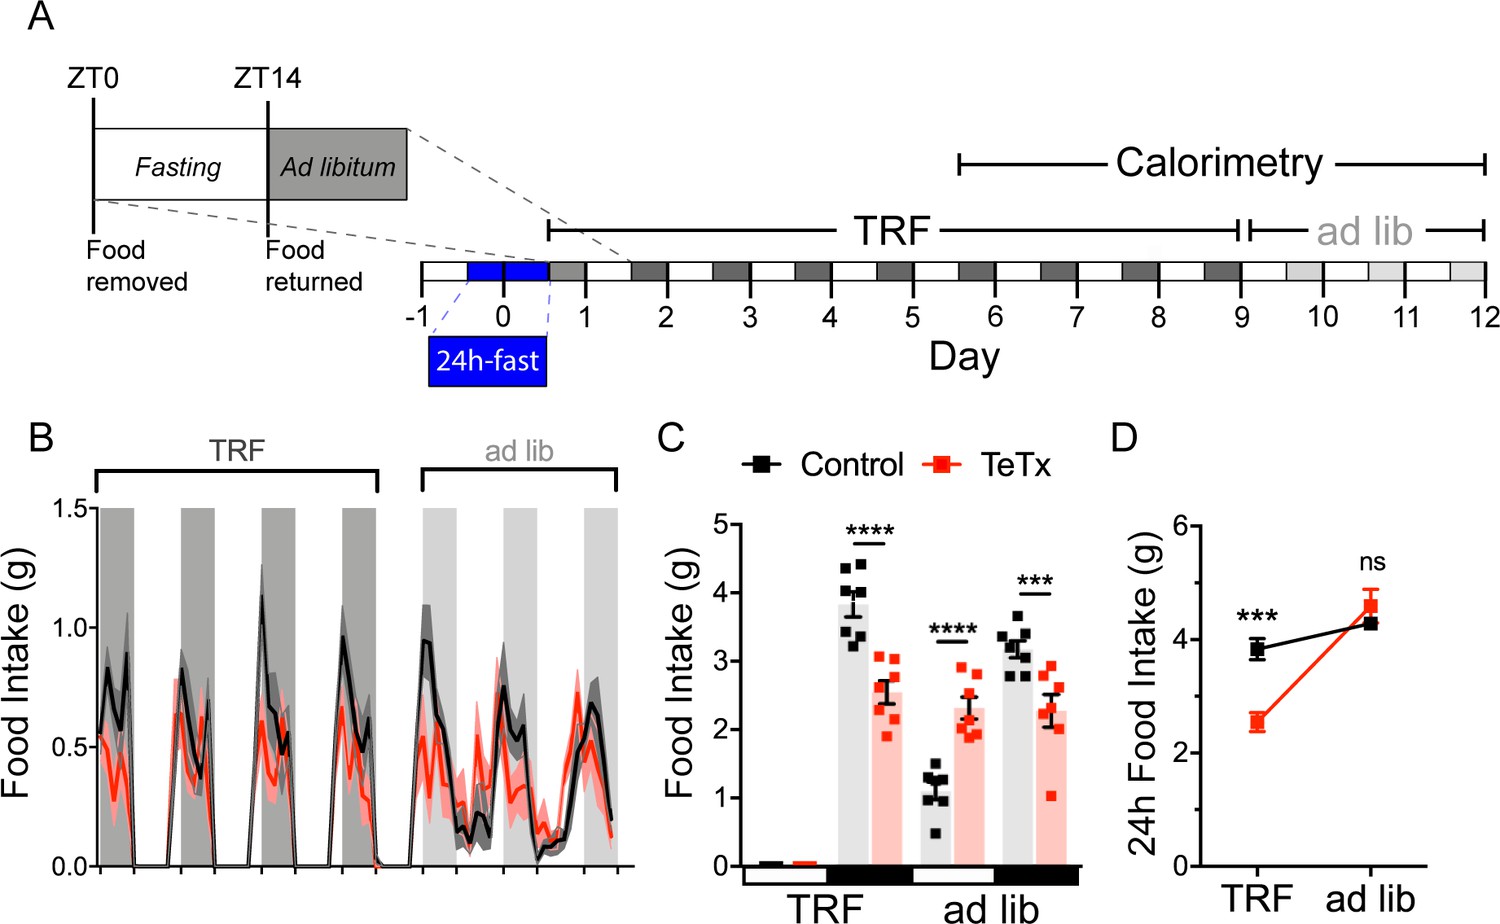
DMHLepR neurons are required for adaptation to a dark-cycle restricted feeding schedule.
(A) Experimental timeline. Six weeks following bilateral microinjection of Cre-dependent GFP:TeTx (TeTx; n=7) or GFP control (control; n=7) to the dorsomedial hypothalamic nucleus (DMH) of LepR-Cre+ male mice, mice were acclimated to time-restricted feeding (TRF) in their home cages for a 5-day lead-in before transfer into direct calorimetry. TRF was maintained in calorimetry for an additional 4 days, followed by ad lib feeding. (B) Two-hour binned continuous measures of food intake during TRF and transition back to ad lib feeding. Shaded areas indicate dark cycle (ZT14–ZT24). (C) Mean L:D food intake from (B) under TRF and ad lib feeding. Two-way ANOVA: F(1,12)=5.084; p=0.0436 (main effect of TeTx); F(3,36)=27.91; p<0.0001 (time x TeTx interaction). (D) Mean 24-hr food intake from (C) during TRF and ad lib feeding. Two-way ANOVA: F(1,12)=5.097; p=0.0434 (main effect of TeTx); F(1,12)=47.8; p<0.0001 (main effect of TRF); F(1,12)=19.58; p=0.0008 (TRF x TeTx interaction). Within treatment comparison (TRF vs. ad lib): control t(12)=1.759; p=0.1971; TeTx t(12)=8.018; p<0.0001. Data are mean ± SEM. For repeated measures, post hoc, Sidak’s test at each time point is indicated on the graph. *p<0.05,**p<0.01, ***p<0.001, ****p<0.0001.
-
Figure 4—source data 1
Body weight, RER, EE, and LMA during TRF.
- https://cdn.elifesciences.org/articles/63671/elife-63671-fig4-data1-v2.xlsx
Figure 4—figure supplement 1

TRF corrects phase shifts in RER, but has no effect on LMA.
(A) Ad lib body weight before TRF paradigm. Unpaired t-test, t(11.92)=2.946, p=0.0123. (B) Dark-cycle food intake during TRF lead-in. Two-way ANOVA: F(1,12)=10.74; p=0.0066 (main effect of TeTx). (C) Body weight during TRF lead-in expressed as a percentage of ad lib (pre-TRF) body weight in (B). Two-way ANOVA: F(1,12)=19.49; p=0.0008 (main effect of TeTx). (D) Two-hour binned continuous measures of respiratory exchange ratio (RER) during TRF and transition back to ad lib feeding. Shaded areas indicate dark cycle (ZT14–ZT24). (E) Mean L:D RER from D during TRF and ad lib feeding. Two-way ANOVA: F(1,12)=6.878; p=0.0223 (main effect of TeTx); F(3,36)=17.84; p<0.0001 (time x TeTx interaction). (F) Mean 24-hr RER from E during TRF and ad lib feeding. Two-way ANOVA: F(1,12)=9.973; p=0.0083 (main effect of TeTx); F(1,12)=28.13; p=0.0002 (main effect of TRF); F(1,12)=9.062; p=0.0109 (TRF x TeTx interaction). Within treatment comparison (TRF vs. ad lib): control t(12)=1.622; p=0.2445; TeTx t(12)=5.879; p=0.0001. (G) Two-hour binned continuous measures of heat production during TRF and transition back to ad lib feeding. (H) Mean L:D heat production from (G) during TRF and ad lib feeding. Two-way ANOVA: F(1,12)=2.486; p=0.1408 (main effect of TeTx); F(3,36)=14.8; p<0.0001 (time x TeTx interaction). (I) Mean 24-hr heat production from (H) during TRF and ad lib feeding. Two-way ANOVA: F(1,12)=2.559; p=0.1357 (main effect of TeTx); F(1,12)=0.8136; p=0.3848 (main effect of TRF); F(1,12)=2.492; p=0.1404 (TRF x TeTx interaction). Within-treatment comparison (TRF vs. ad lib): control t(12)=1.754; p=0.1988; TeTx t(12)=0.4783; p=0.8711. (J) Two-hour binned continuous measures of locomotor activity (LMA) during TRF and transition back to ad lib feeding. (K) Mean L:D LMA from (J) during TRF and ad lib feeding. Two-way ANOVA: F(1,12)=27.83; p=0.00.0002 (main effect of TeTx); F(3,36)=38.22; p<0.0001 (time x TeTx interaction). (L) Mean 24-hr LMA from (K) during TRF and ad lib feeding. Two-way ANOVA: F(1,12)=27.83; p=0.0002 (main effect of TeTx); F(1,12)=0.5965; p=0.4549 (main effect of TRF); F(1,12)=2.562; p=0.1354 (TRF x TeTx interaction). Within-treatment comparison (TRF vs. ad lib): control t(12)=0.5857; p=0.8142; TeTx t(12)=1.678; p=0.2242. Data are mean ± SEM. For repeated measures, post hoc, Sidak’s test at each time point is indicated on the graph. *p<0.05,**p<0.01, ***p<0.001, ****p<0.0001.
Tables
Key resources table
| Reagent type (species) or resource | Designation | Source or reference | Identifiers | Additional information |
|---|---|---|---|---|
| Genetic reagent (Mus musculus) | B6; LeprIRES-Cre/+ | Jackson Labs | RRID:IMSR_JAX:008320 | |
| Antibody | Anti-GFP (chicken polyclonal) | Abcam | Cat# ab13970; RRID:AB_300798 | IF (1:10,000) |
| Antibody | Anti-pSTAT3 (rabbit monoclonal) | Cell Signaling Technology | Cat# 9145; RRID:AB_2491009 | IF (1:300) |
| Recombinant DNA reagent | AAV1-CBA-DIO-GFP:TeTx | A gift from Richard Palmiter and Larry Zweifel, Han et al., 2015 | NA | |
| Recombinant DNA reagent | AAV5-hSyn-DIO-EGFP | AddGene | Addgene viral prep #50457-AAV5; RRID:Addgene_50457 | pAAV-hSyn-DIO-EGFP was a gift from Bryan Roth |
| Sequence-based reagent | LepR_WT_forward primer | Jackson Labs | PCR primer | For: 5'- TGCACATTCCCAGCCCAGTGT |
| Sequence-based reagent | Lepr_forward primer | Jackson Labs | PCR primer | For: 5' - CACGACCAAGTGACAGCAAT |
| Sequence-based reagent | Lepr_common_reverse primer | Jackson Labs | PCR primer | Rev: 5' - GACAGGCTCTACTGGAATGGA |
| Peptide, recombinant protein | Recombinant mouse leptin | A F Parlow; National Hormone and Peptide Program | Leptin | |
| Commercial assay or kit | Mouse leptin ELISA | Crystal Chem Cat #90030 | RRID:AB_2722664 | |
| Commercial assay or kit | Mouse insulin ELISA | Crystal Chem Cat #90080 | RRID:AB_2783626 | |
| Software, algorithm | Prism 9 | GraphPad | RRID:SCR_002798 | |
| Software, algorithm | ImageJ | Fiji | RRID:SCR_002285 | |
| Software, algorithm | Illustrator | Adobe | RRID:SCR_010279 |
Additional files
Download links
A two-part list of links to download the article, or parts of the article, in various formats.
Downloads (link to download the article as PDF)
Open citations (links to open the citations from this article in various online reference manager services)
Cite this article (links to download the citations from this article in formats compatible with various reference manager tools)
Leptin receptor neurons in the dorsomedial hypothalamus regulate diurnal patterns of feeding, locomotion, and metabolism
eLife 10:e63671.
https://doi.org/10.7554/eLife.63671


