Uncovering a novel function of the CCR4-NOT complex in phytochrome A-mediated light signalling in plants
- Institute of Biology II, Faculty of Biology, University of Freiburg, Germany
- Spemann Graduate School of Biology and Medicine (SGBM), University of Freiburg, Germany
- Institute for Plant Sciences and Cluster of Excellence on Plant Sciences (CEPLAS), University of Cologne, Germany
- Internal Medicine IV, Department of Medicine, Medical Center, University of Freiburg, Germany
- Laboratory of Proteomics Research, Biological Research Centre, Hungary
- Institute of Plant Biology, Biological Research Centre, Hungary
- Signalling Research Centres BIOSS and CIBSS, University of Freiburg, Germany
Figures
Figure 1 with 5 supplements
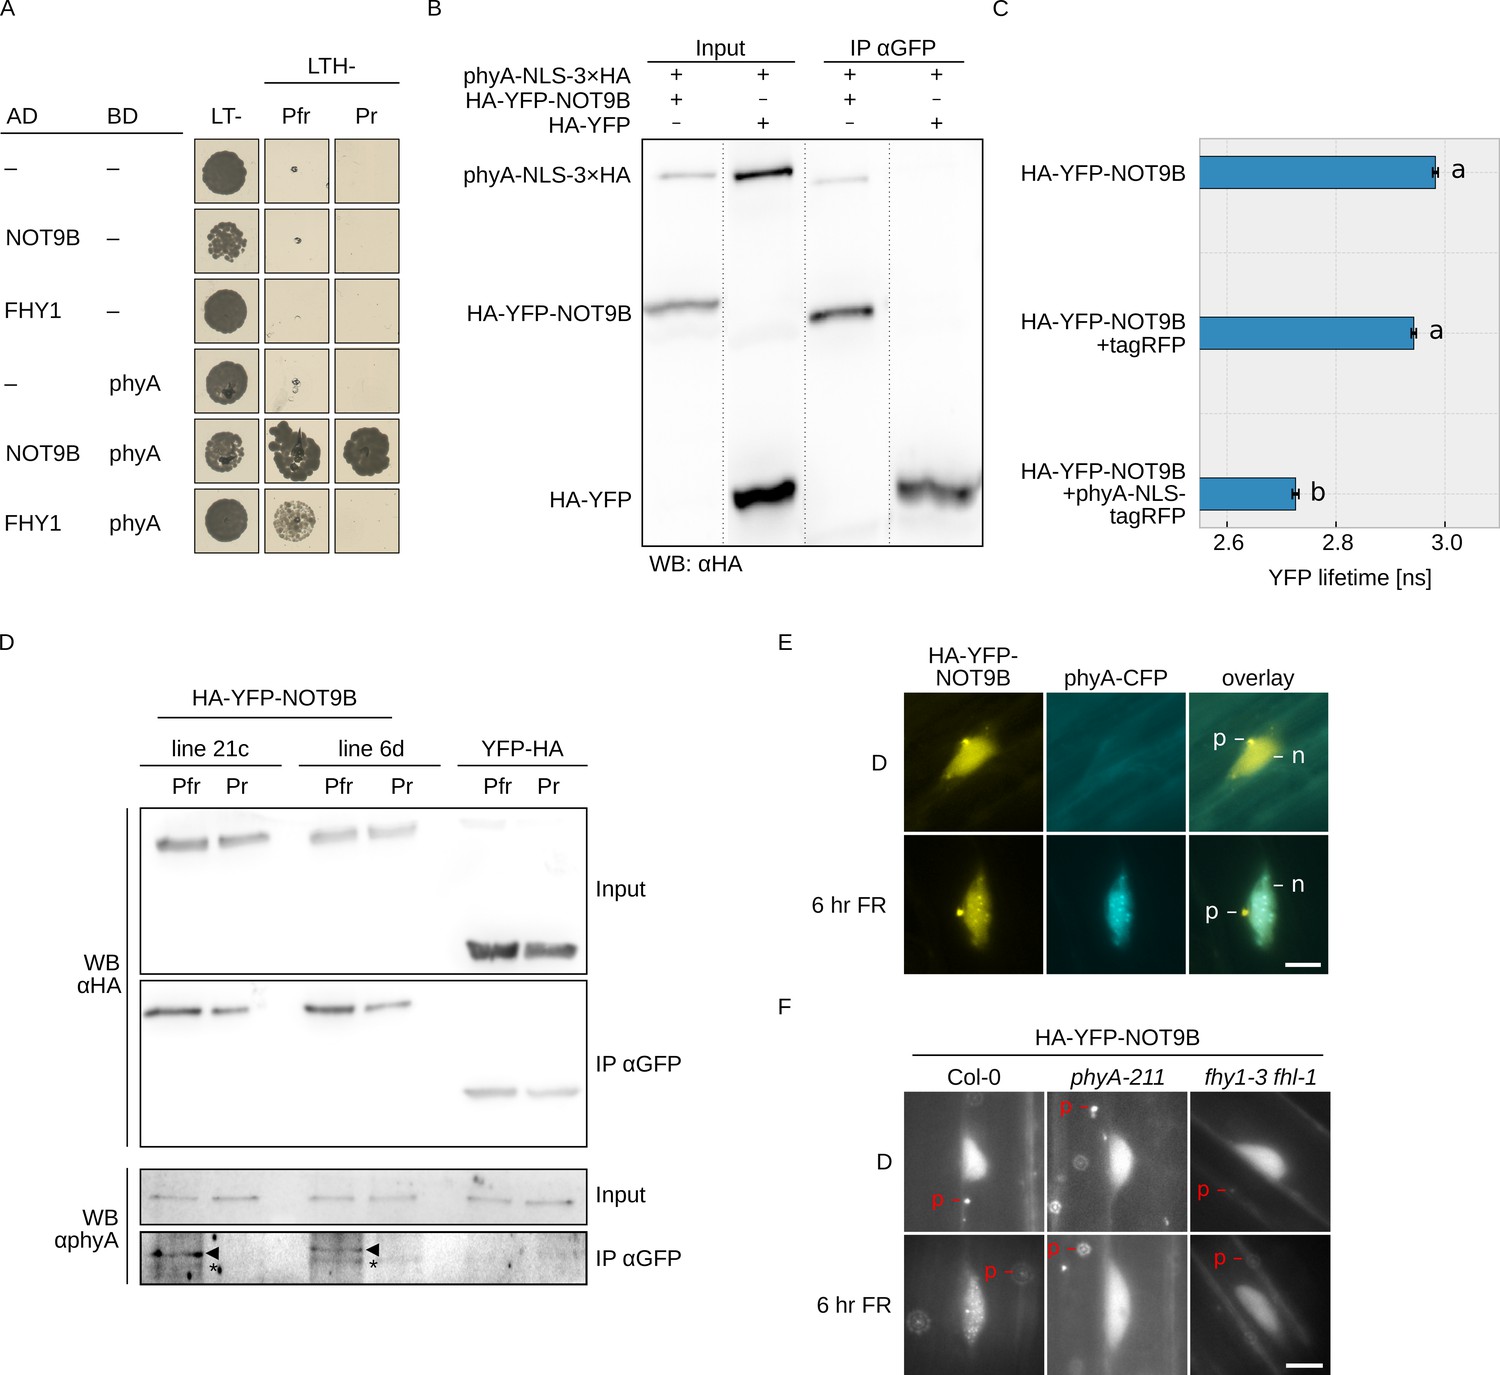
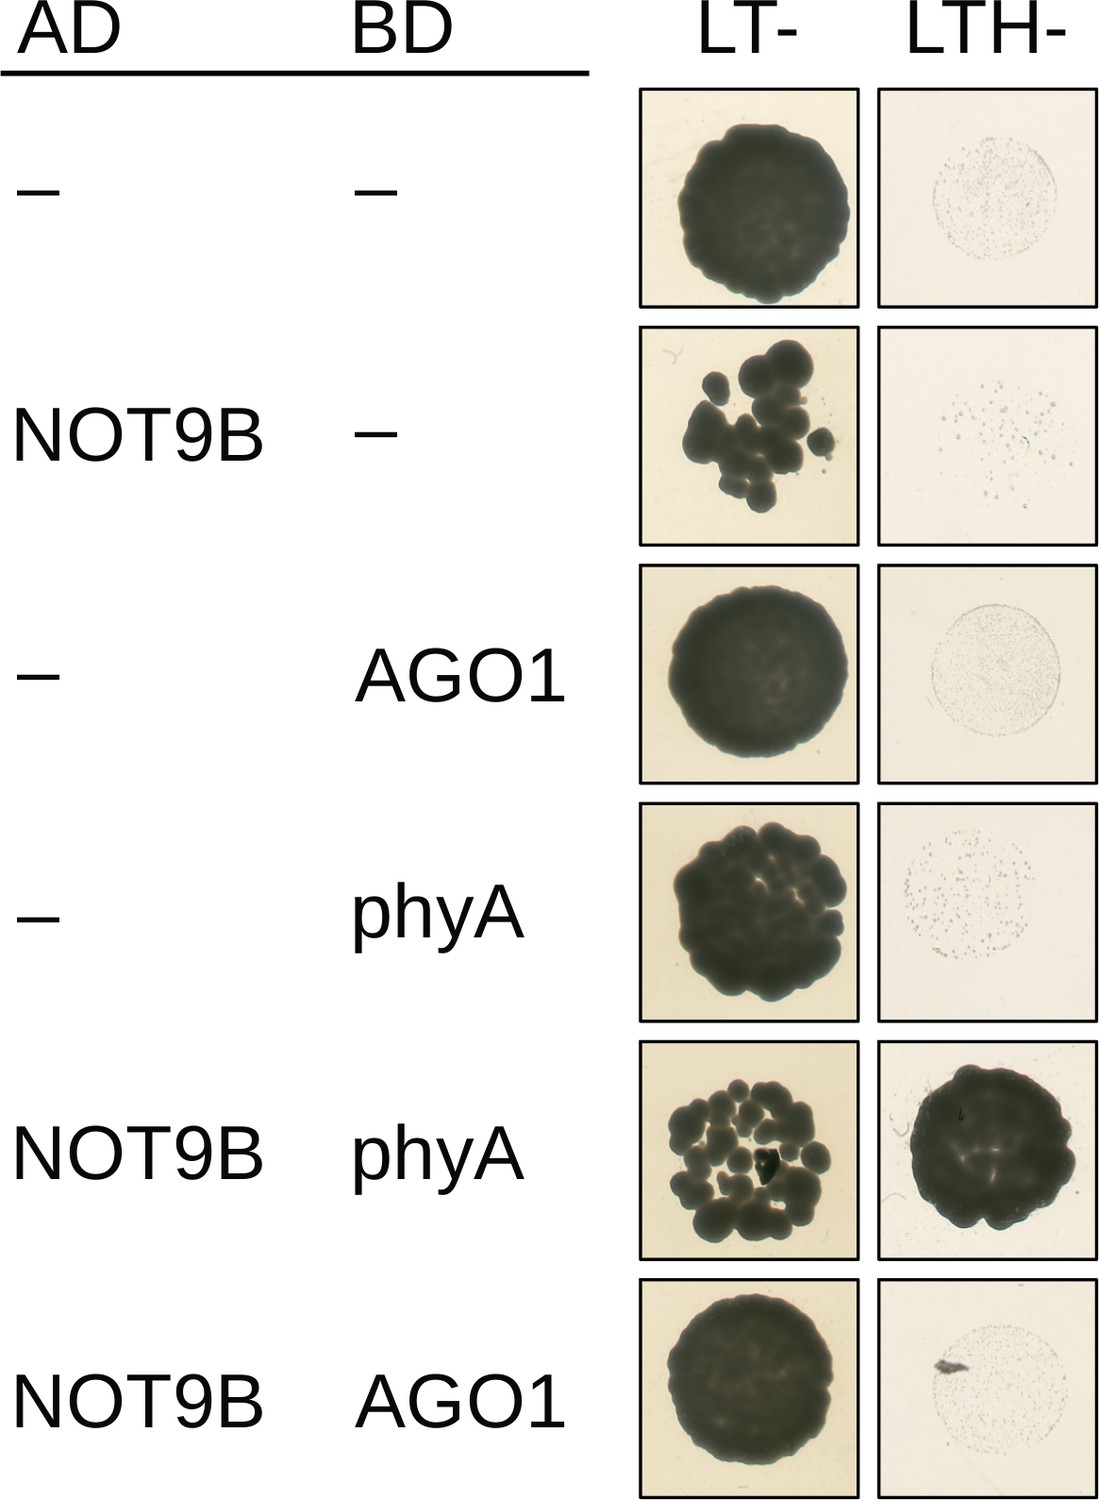
NOT9B interacts with phytochrome A.
(A) Y2H growth assay. AH109 cells were transformed with plasmids coding for indicated AD and BD fusion proteins and grown on CSM LTH- plates supplemented with 20 μM phycocyanobilin and 5 mM 3-AT to test for interaction. Growth on CSM LT- plates was used as transformation control. Plates were incubated in R or FR light to convert phyA to Pfr and Pr, respectively. (B) CoIP from transiently transformed tobacco leaves. Four-week-old tobacco leaves were infiltrated with Agrobacteria transformed with plasmids coding for p35S:PHYA-NLS-3×HA and either p35S:HA-YFP-NOT9B or p35S:HA-YFP. Plants were kept in the dark and exposed to W light for 5 min. Total soluble protein was then used for CoIP with αGFP magnetic beads. Input and eluate fractions were analysed by SDS-PAGE and immunoblotting with αHA antibodies. (C) FRET-FLIM experiment in leek cells. Leek cells were bombarded with plasmids coding for p35S:HA-YFP-NOT9B, p35S:PHYA-NLS-tagRFP, or p35S:tagRFP. FRET-FLIM was quantified for the YFP-tagRFP FRET pair. Mean YFP fluorescence life time of >15 replicates (±SE) is shown. Letters indicate levels of significance as determined by one-way ANOVA followed by post-hoc Tukeys HSD test; p<0.05. (D) CoIP from stable transgenic Arabidopsis lines. Four-day-old dark-grown Arabidopsis seedlings expressing either p35S:HA-YFP-NOT9B or p35S:YFP-HA were exposed to FR light for 5 hr followed by 5 min R (Pfr) or long-wavelength FR light (Pr). Total soluble protein was then used for CoIP with αGFP magnetic beads. Input and eluate fractions were analysed by SDS-PAGE and immunoblotting with αHA and αphyA antibodies. *, unspecific band; ►, phyA. (E and F) Subcellular localisation of NOT9B. Four-day-old dark-grown Arabidopsis seedlings co-expressing p35S:HA-YFP-NOT9B and pPHYA:PHYA-CFP (E) or expressing p35S:HA-YFP-NOT9B in Col-0, phyA-211, or fhy1-3 fhl-1 background (F) were irradiated with FR light for 6 hr or kept in the dark (D) and analysed by epifluorescence microscopy. Scale bar represents 5 μm. p, p-body; n, nucleus.
Figure 1—figure supplement 1
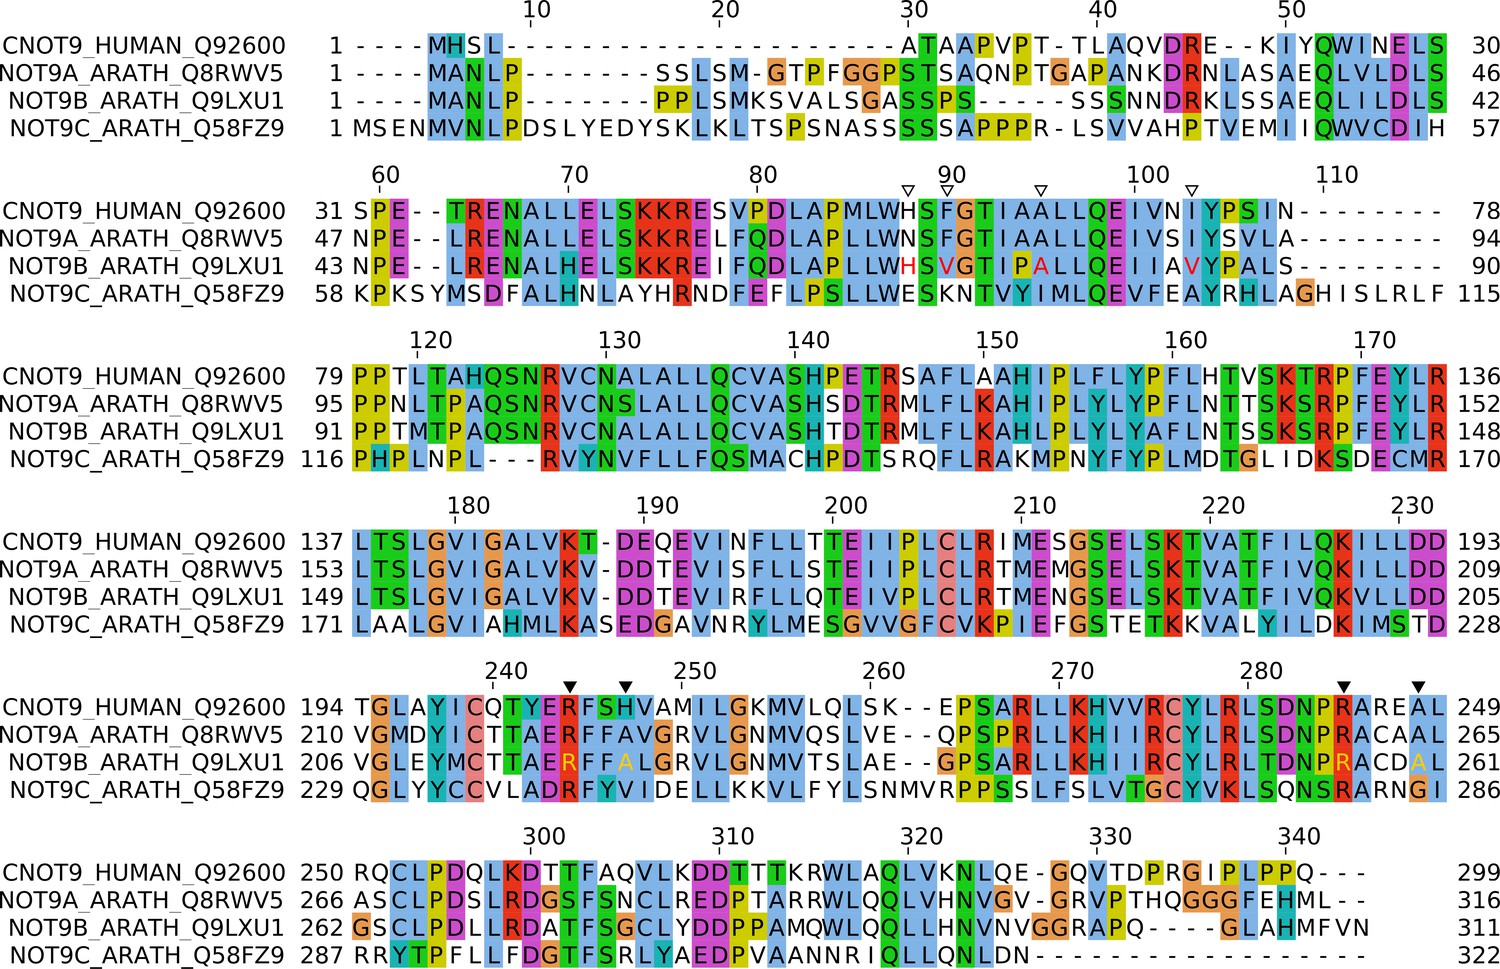
Sequence alignment for human CNOT9 and Arabidopsis NOT9 proteins.
Sequences were retrieved from UniProt and aligned in JalView using MAFFT with default settings (UniProt Consortium, 2019; Katoh and Standley, 2013; Waterhouse et al., 2009). Open and closed triangles above the sequence alignment indicate residues mutated in NOT9B ΔPNB (red) and NOT9B ΔGWB (orange), respectively. UniProt sequence identifiers are included in the sequence names.
Figure 1—figure supplement 2
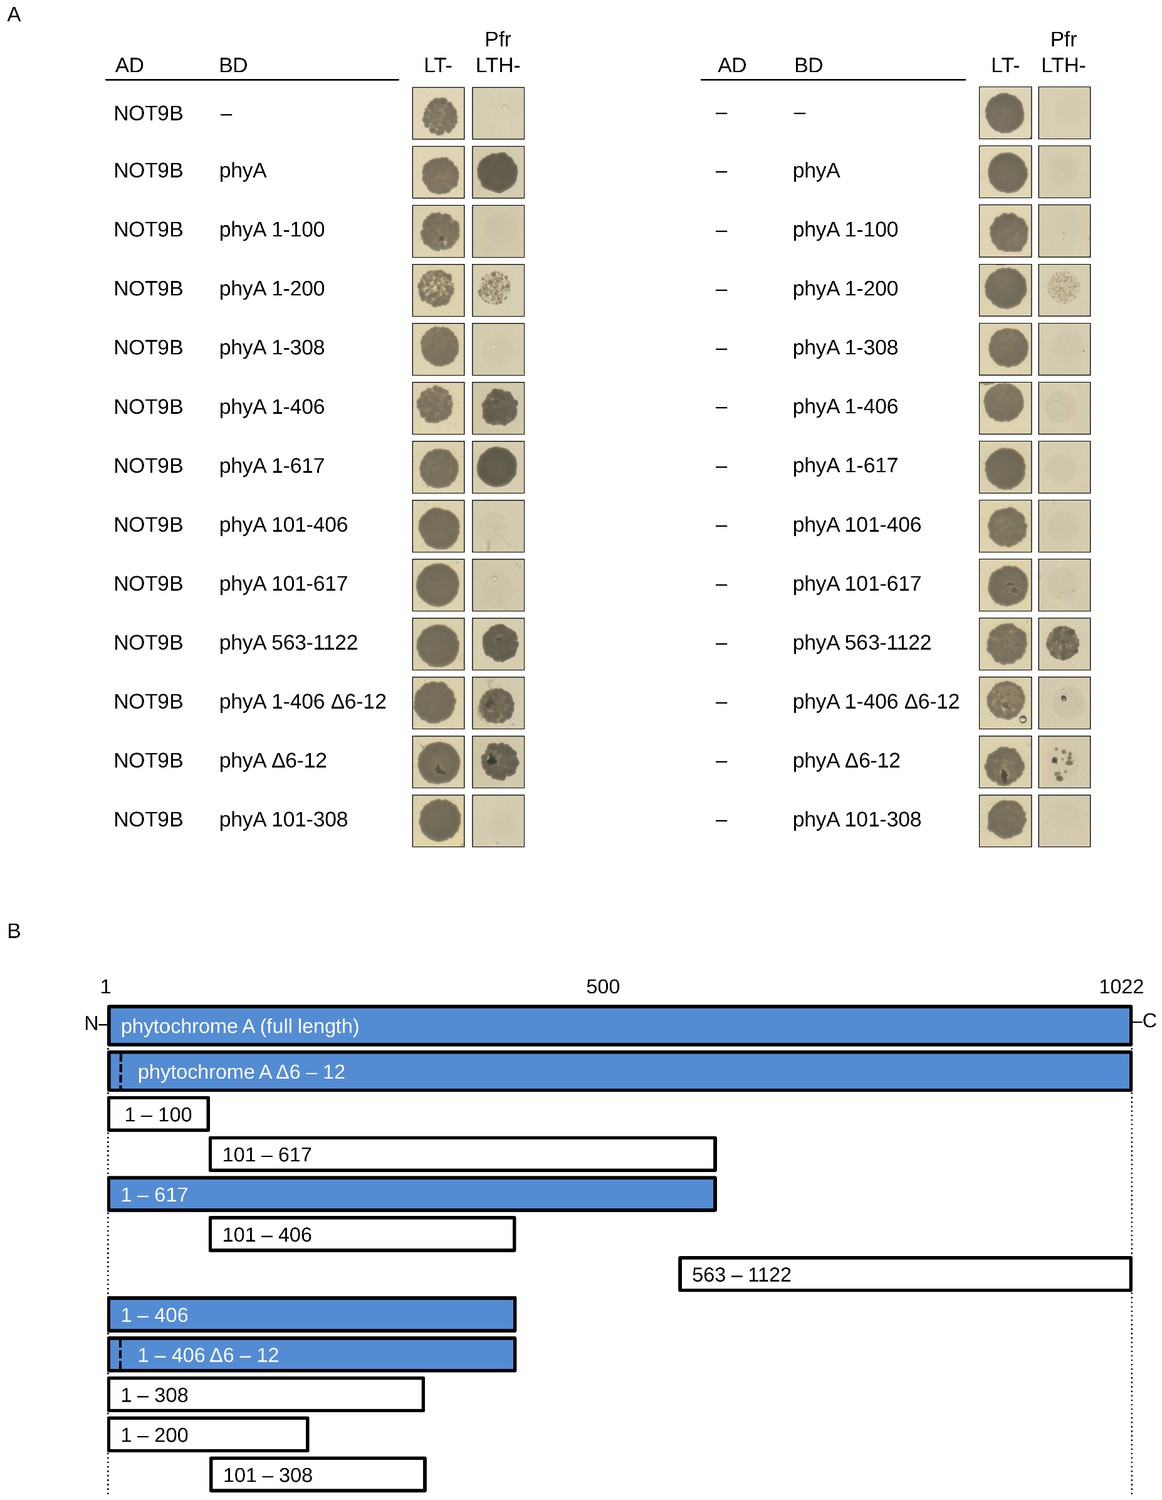
NOT9B binds to the N-terminal half of phyA.
(A) Y2H growth assay. AH109 yeast cells were transformed with plasmids coding for the indicated AD and BD fusion proteins and grown in R light (Pfr) on CSM LTH- plates supplemented with 10 mM 3-AT and 20 μM phycocyanobilin. CSM LT- plates were used as transformation control. (B) Schematic overview on phyA fragments used in (A). Interacting fragments are highlighted in blue.
Figure 1—figure supplement 3
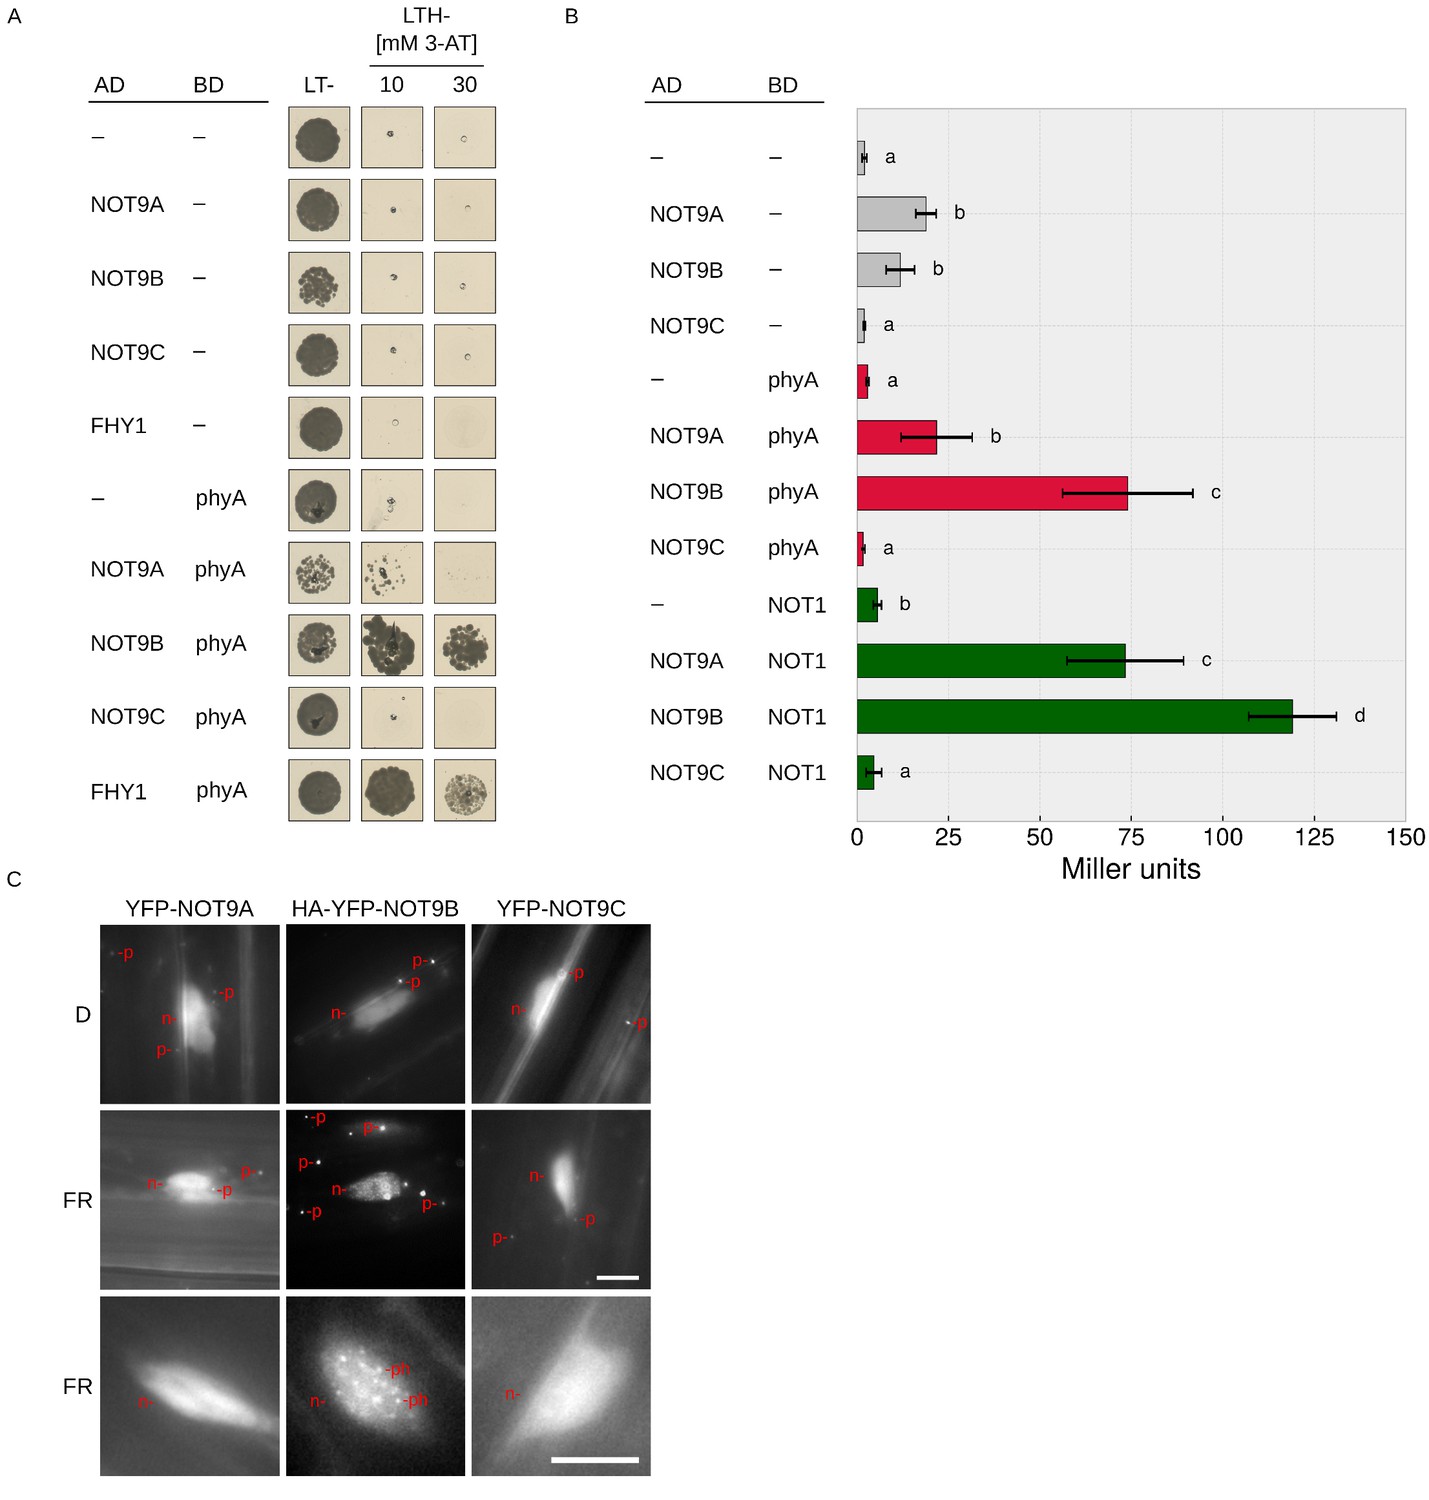
NOT9B homologues do not affect phyA signalling.
(A) Y2H growth assay. AH109 cells were transformed with plasmids coding for indicated AD and BD fusion proteins and grown in R light on CSM LTH- plates supplemented with 20 μM phycocyanobilin and 10 mM or 30 mM 3-AT to test for interaction. Growth on CSM LT- plates was used as transformation control. (B) Y2H ONPG assay. Y190 cells were transformed with plasmids coding for indicated AD and BD fusion proteins and grown in liquid CSM supplemented with 10 μM phycocyanobilin. β-Gal activity was quantified using an ONPG assay. Bars represent mean β-Gal activity of three replicates (± SD). Letters indicate levels of significance as determined by one-way ANOVA followed by post-hoc Tukeys HSD test; p<0.05. (C) Subcellular localisation of NOT9B homologues. Four-day-old dark-grown Arabidopsis seedlings expressing either p35S:YFP-NOT9A, p35S:HA-YFP-NOT9B, or p35S:YFP-NOT9C were irradiated with FR light for 6 hr or kept in D and analysed by epifluorescence microscopy. Scale bar represents 5 μm. p, p-body; ph, photobody; n, nucleus.
Figure 1—figure supplement 4
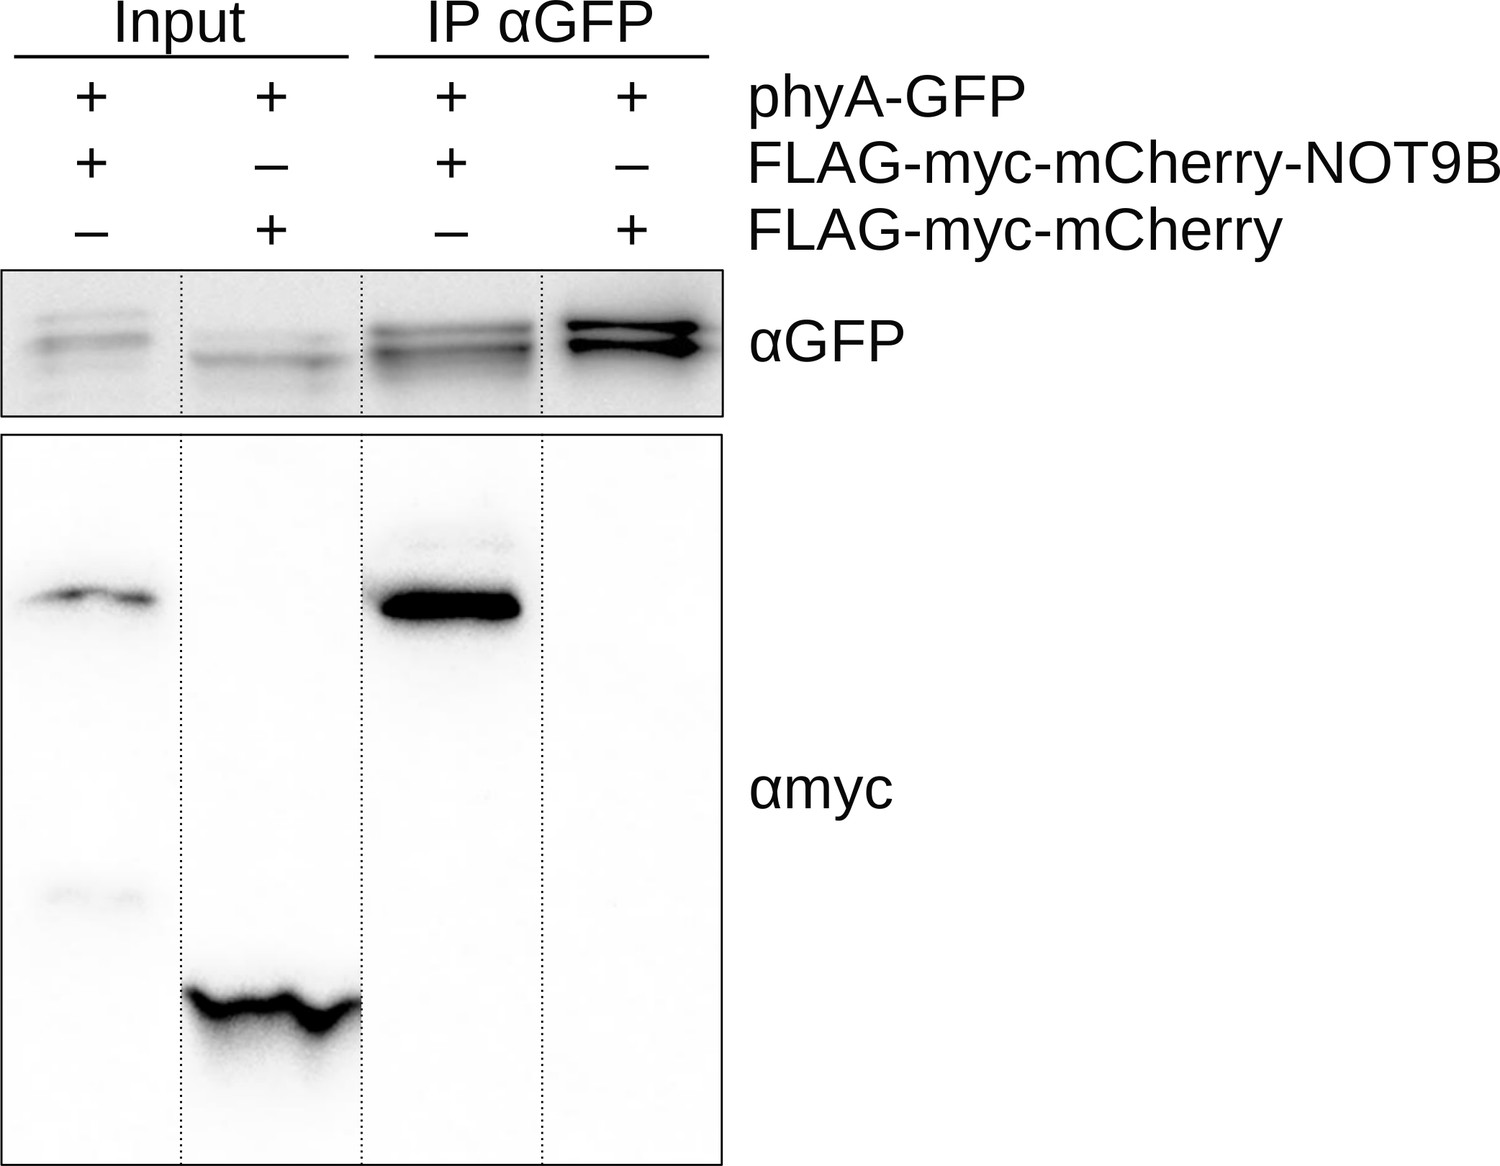
NOT9B co-precipitates with phyA in HEK293T cells.
HEK293T cells were transfected with plasmids coding for phyA-GFP and either FLAG-myc-mCherry-NOT9B or FLAG-myc-mCherry. Medium was supplemented with 20 μM PCB. Total soluble protein was extracted, and CoIP was performed using αGFP magnetic beads. Input and eluate fractions were analysed by SDS-PAGE and immunoblotting with αGFP and αmyc antibodies. The figure is assembled from different lanes of the same membrane (dashed lines).
Figure 1—figure supplement 5
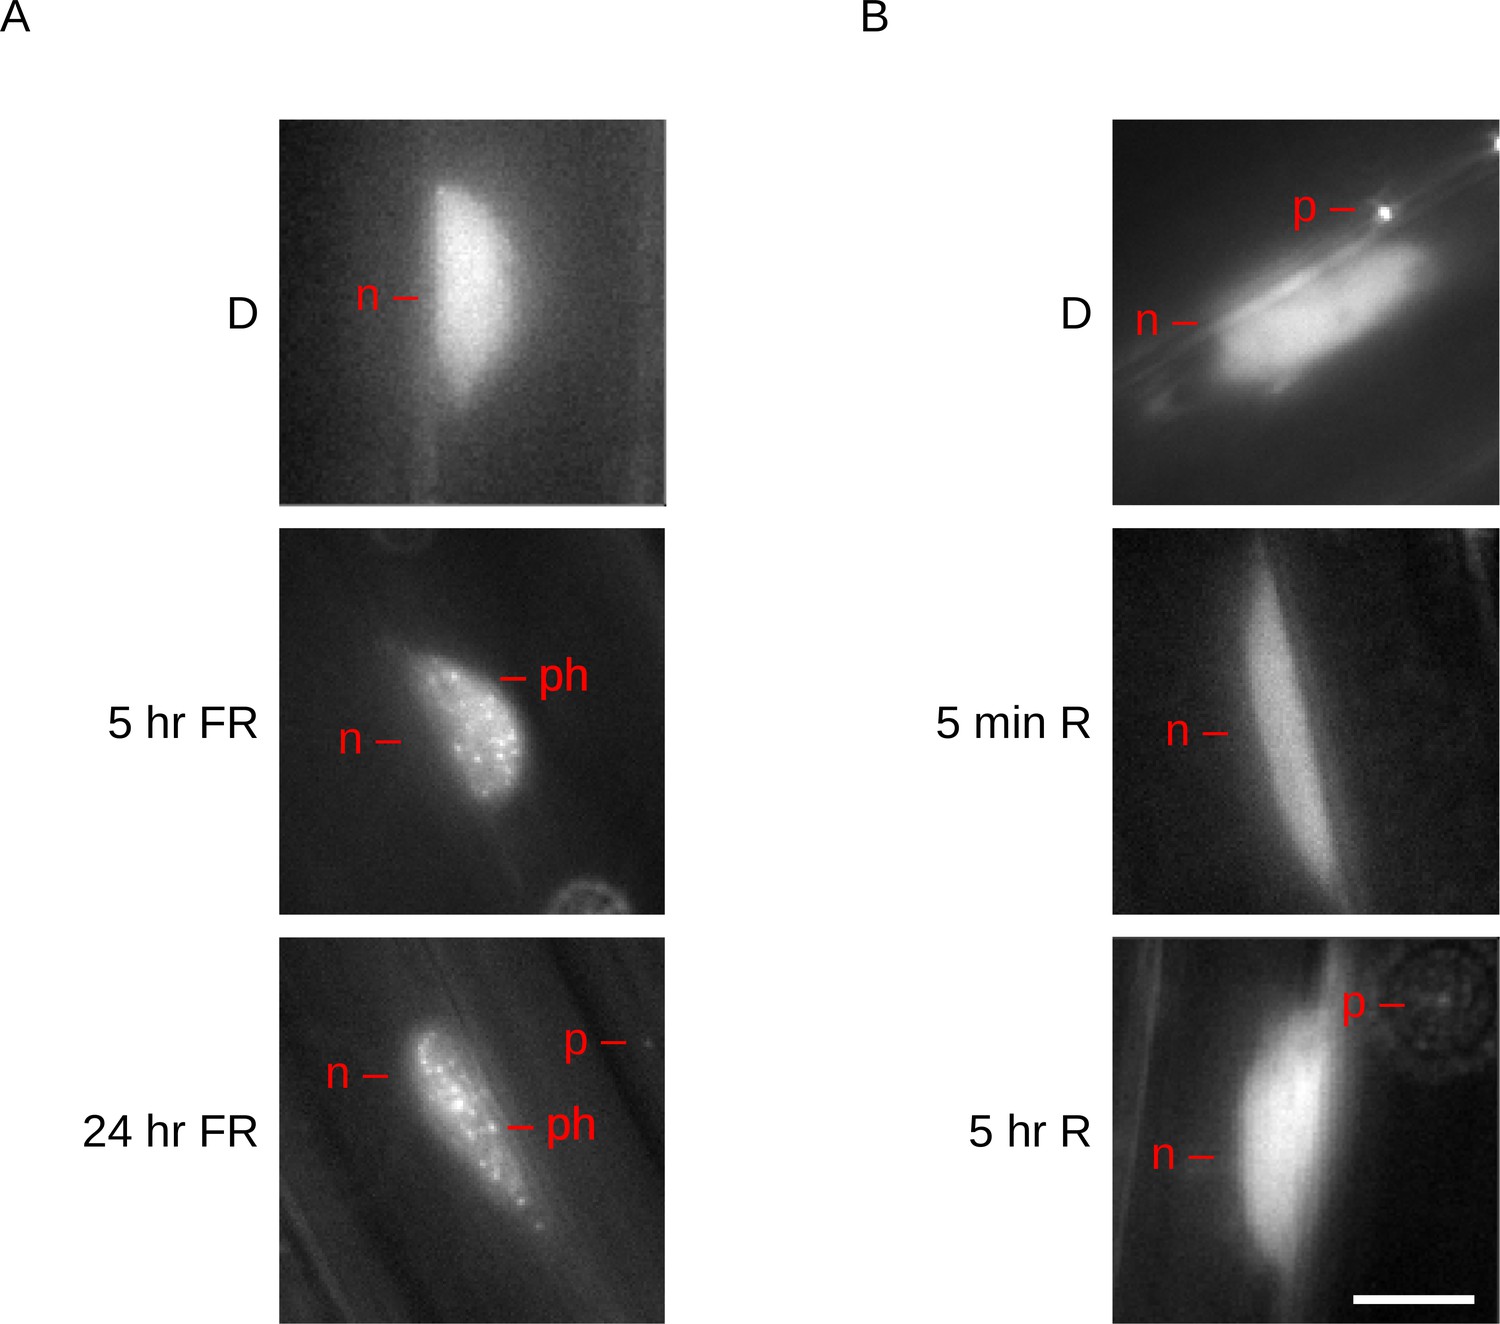
NOT9B forms photobodies in FR but not R light.
(A and B) Four-day-old dark-grown seedlings expressing p35S:HA-YFP-NOT9B in Col-0 (NOTBox, line 21c) were exposed to FR (A) or R (B) light for indicated time or kept in the dark (D). Formation of photobodies was analysed by epifluorescence microscopy. Scale bar represents 5 μm. p, p-body; n, nucleus; ph, photobody.
Figure 2 with 4 supplements
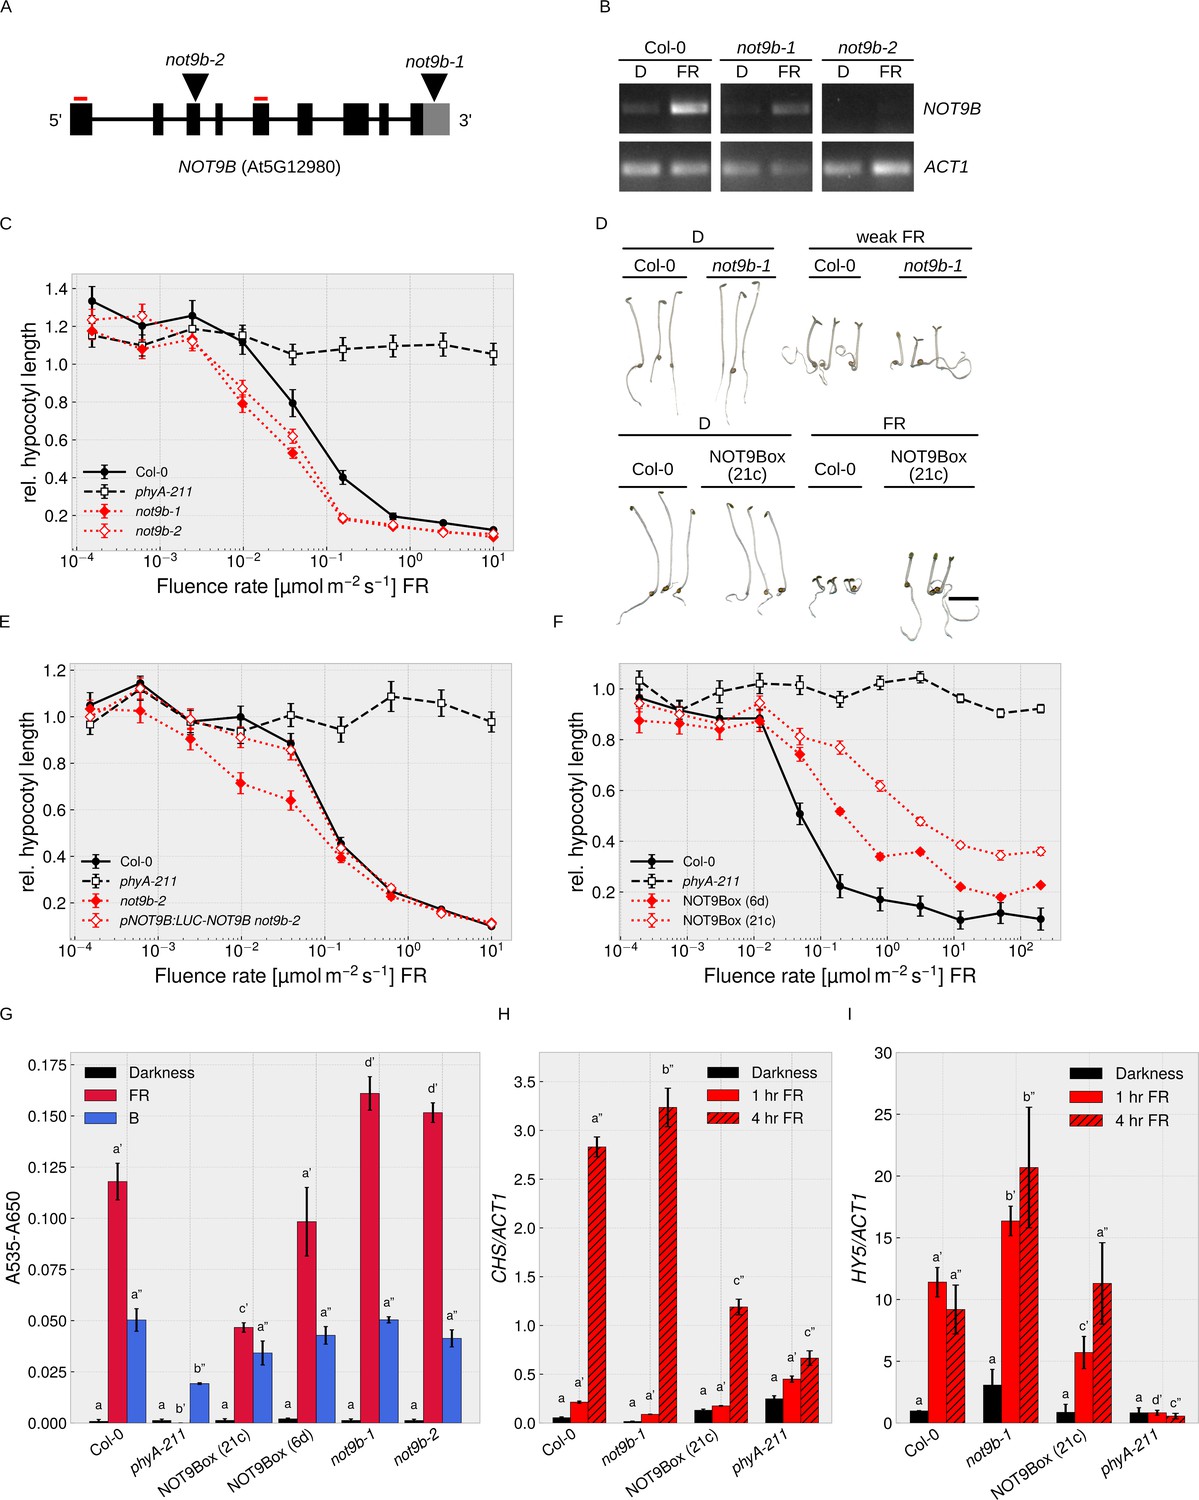
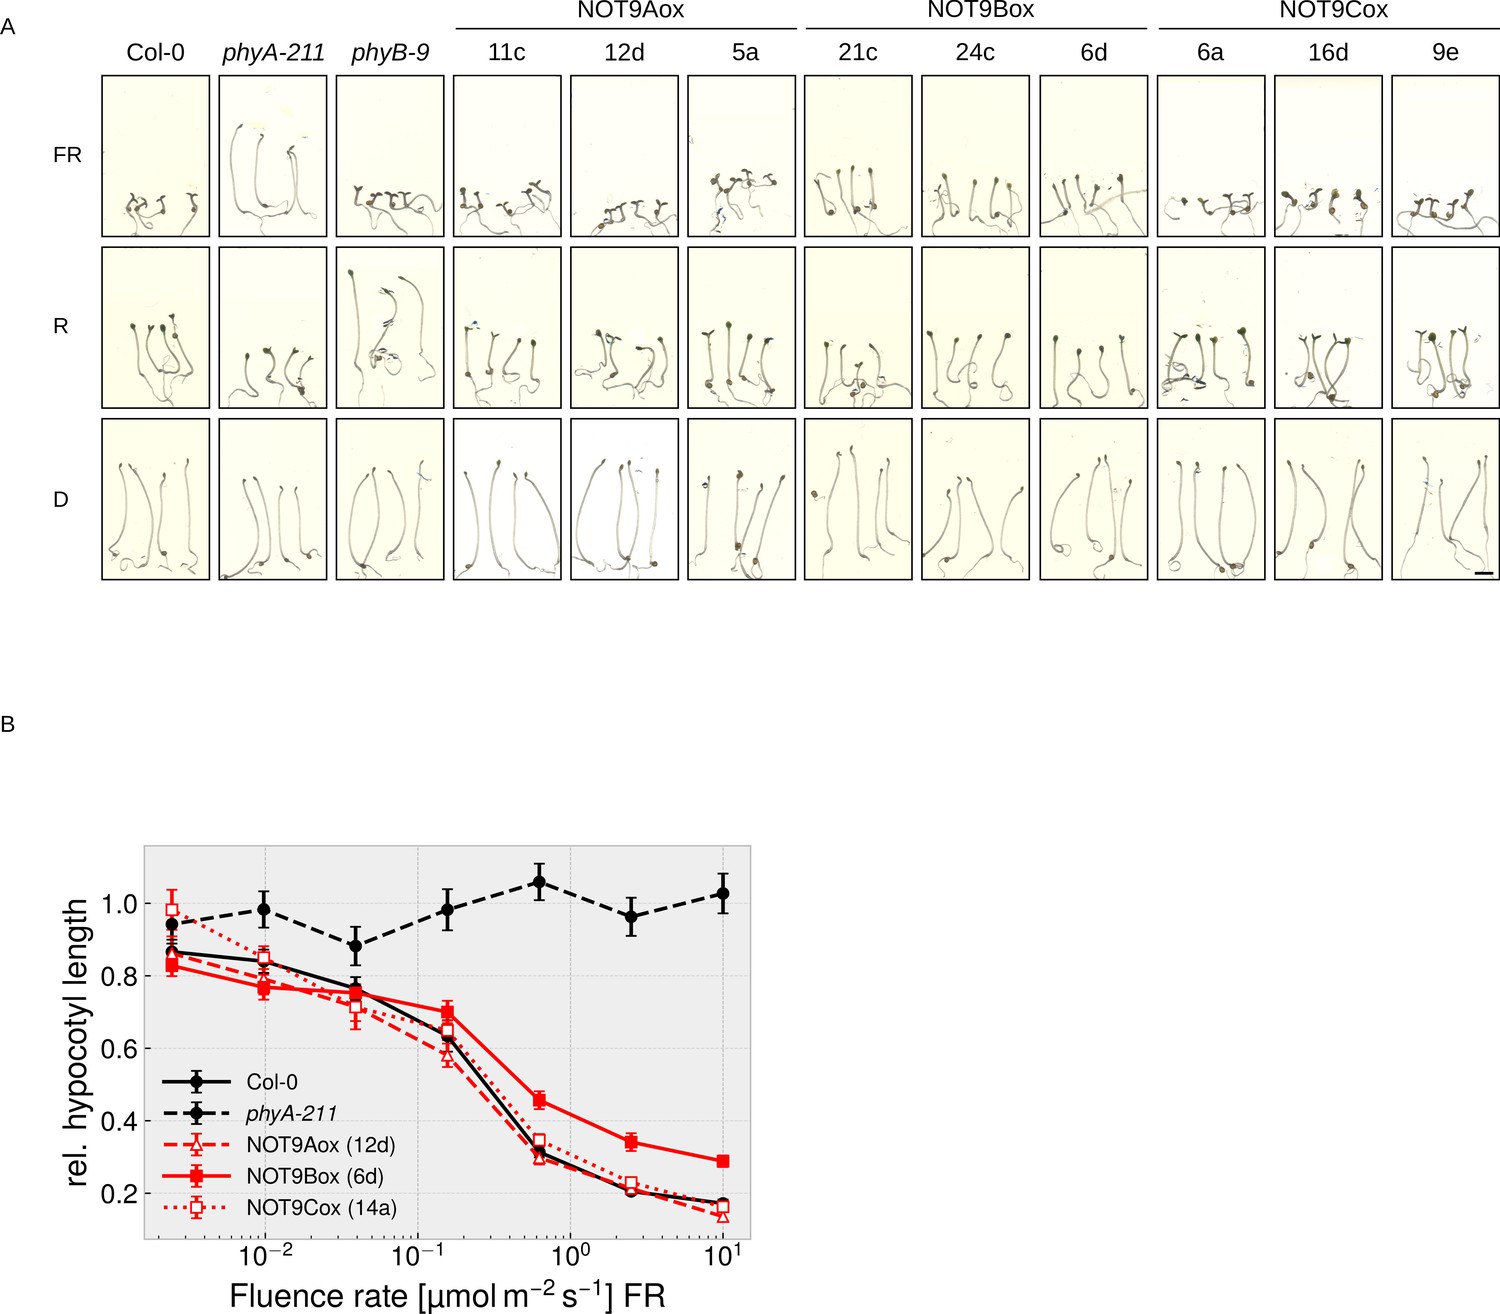
NOT9B is a negative regulator of phyA-mediated light signalling.
(A) NOT9B T-DNA insertion mutants. Schematic drawing of the NOT9B genomic locus. T-DNA insertions in not9b-1 and not9b-2 are shown as triangles and primers used for RT-PCR in (B) as red lines. Black boxes, exons; black lines, introns; grey box, 3’ UTR. (B) RT-PCR for not9b alleles. Four-day-old dark-grown Col-0, not9b-1, and not9b-2 seedlings were exposed to FR light for 24 hr (FR) or kept in the dark. Total RNA was extracted and NOT9B and ACT1 transcripts were detected by RT-PCR and agarose gel electrophoresis. Positions of primers used to detect NOT9B are indicated in (A). ACT1 was used as reference gene. (C), (E), (F) Fluence rate response curves for inhibition of hypocotyl growth. Seedlings of the indicated genotypes were grown for 4 days at different fluence rates of FR light or in the dark. Mean hypocotyl length (±SE) of 20 seedlings relative to dark-grown seedlings is shown. NOT9Box 6d and 21c are two independent lines expressing p35S:HA-YFP-NOT9B. Expression of pNOT9B:LUC-NOT9B was used for complementation of not9-2. (D) Phenotype of not9b-1 and NOT9Box seedlings. Seedlings were grown for 4 days in the dark or in FR light (FR, 10 μmol m−2 s−1; weak FR, 0.05 μmol m−2 s−1). Scale bar represents 2 mm. (G) Quantification of anthocyanin levels in not9b-1 and NOT9Box seedlings. Seedlings of indicated genotypes were grown for 4 days in the dark (D), FR, or B light on ½ MS supplemented with 1.5% sucrose. Anthocyanin was extracted from 25 seedlings per genotype/condition and A535-A650 was measured. Bars represent biological triplicates (± SD). (G)-(I) Letters indicate levels of significance as determined by one-way ANOVA followed by post-hoc Tukeys HSD test; p<0.05. (H and I) Quantification of CHS and HY5 transcript levels in not9b-1 and NOT9Box seedlings. Four-day-old dark-grown seedlings were exposed to FR light for 1 or 4 hr or kept in the dark. Total RNA was extracted and CHS, HY5, and ACT1 transcript levels were quantified by qRT-PCR. Bars represent biological triplicates (± SD).
Figure 2—figure supplement 1
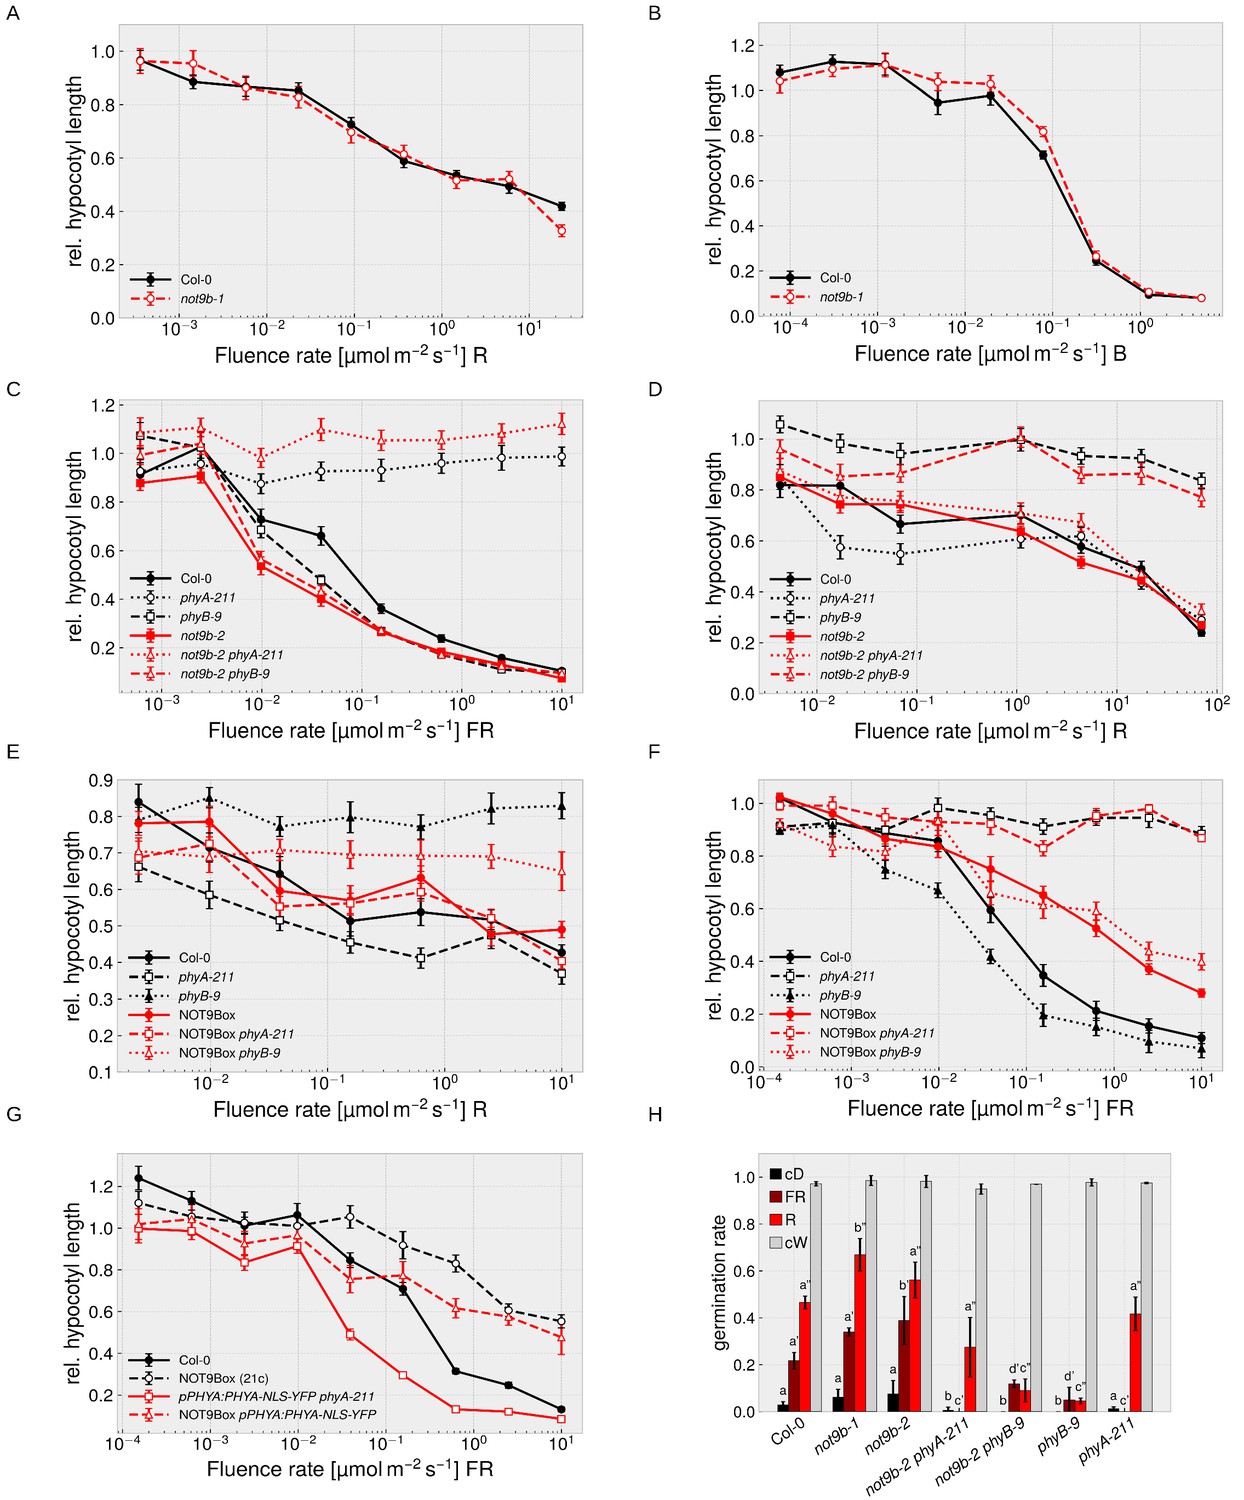
Fluence rate response curves for inhibition of hypocotyl growth and seed germination experiment.
(A-G) Seedlings of the indicated genotypes were grown for four days at different fluence rates of FR, R, or B light or in the dark. Mean hypocotyl length (±SE) of 20 seedlings relative to dark-grown seedlings is shown. (A), (D), and (E) Seedlings were grown in R light. (B) Seedlings were grown in B light. (C), (F), and (G) Seedlings were grown in FR light. (H) Effect of NOT9B on seed germination. Seeds of indicated genotypes were imbibed on ½ MS, 2% agar and exposed to either R or FR light. After 5 days incubation in the dark, germination of >60 seeds per genotype and light condition was evaluated. Bars show mean seed germination rates of three biological replicates (± SD). Letters indicate levels of significance as determined by one-way ANOVA followed by post-hoc Tukeys HSD test: p<0.05.
Figure 2—figure supplement 2
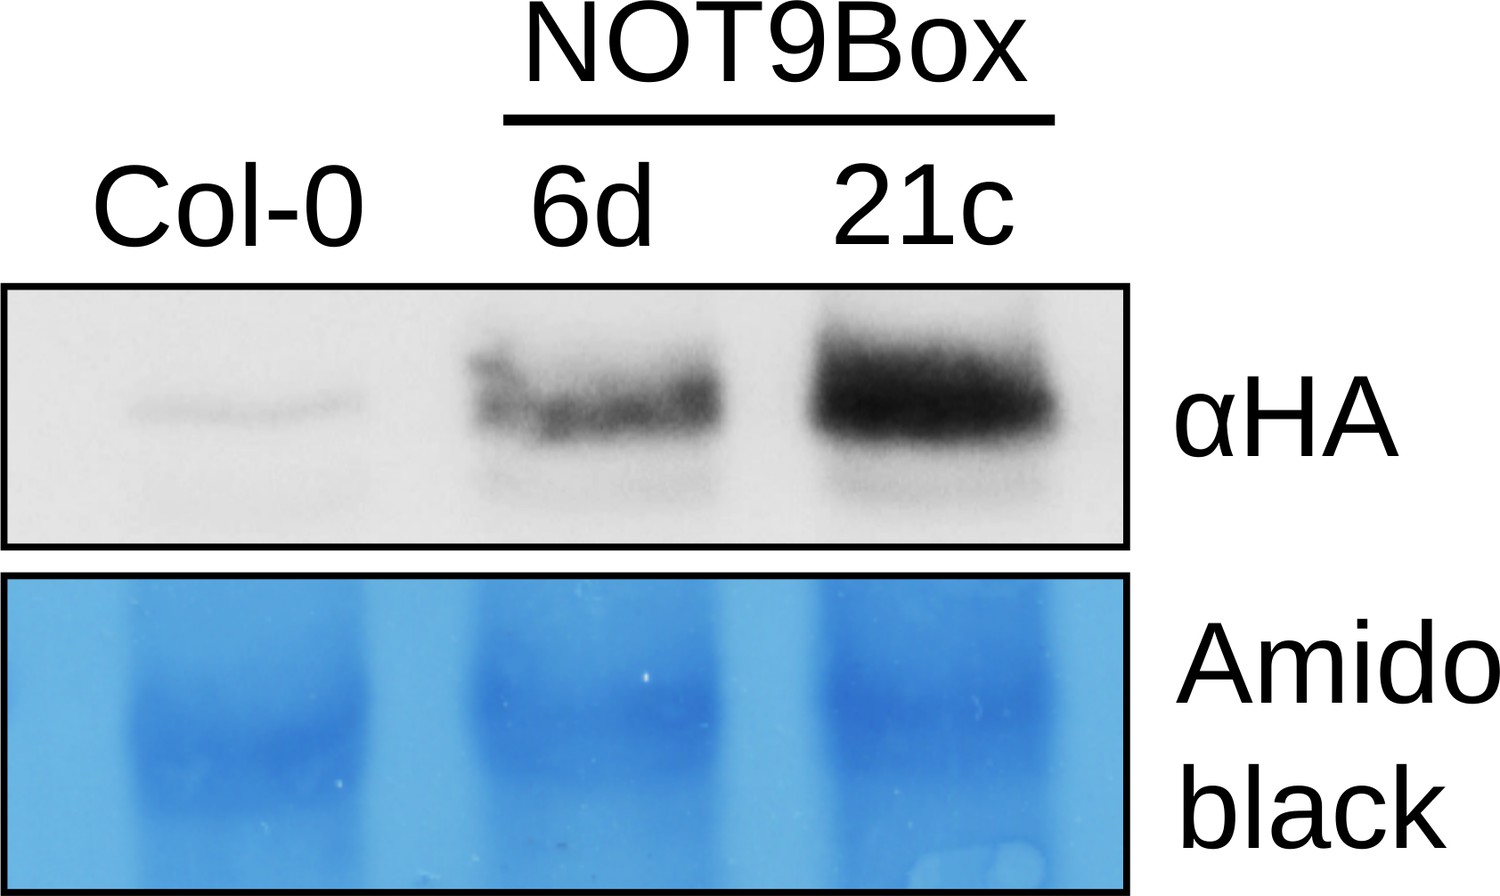
Western blot analysis of protein levels.
Total protein was extracted from 4-day-old dark-grown wildtype seedlings (Col-0) and two independent transgenic lines expressing p35S:HA-YFP-NOT9B in Col-0 background (NOT9Box; lines 6d and 21c). Protein extracts were analysed by SDS-PAGE and immunoblotting with αHA antibodies. Part of the amido black stained membrane is shown as loading control.
Figure 2—figure supplement 3
NOT9B homologues do not affect phyA signalling.
(A) Fluence rate response curves for inhibition of hypocotyl growth. Seedlings of the indicated genotypes were grown for four days at different fluence rates of FR light or in the dark. Mean hypocotyl length (± SE) of 20 seedlings relative to dark-grown seedlings is shown. (B) Representative seedlings of indicated genotypes were grown for 4 days in R (20 μmol m−2 s−1), FR (40 μmol m−2 s−1), or in D. For each transgene, three independent lines are shown. Scale bar represents 2 mm.
Figure 2—figure supplement 4
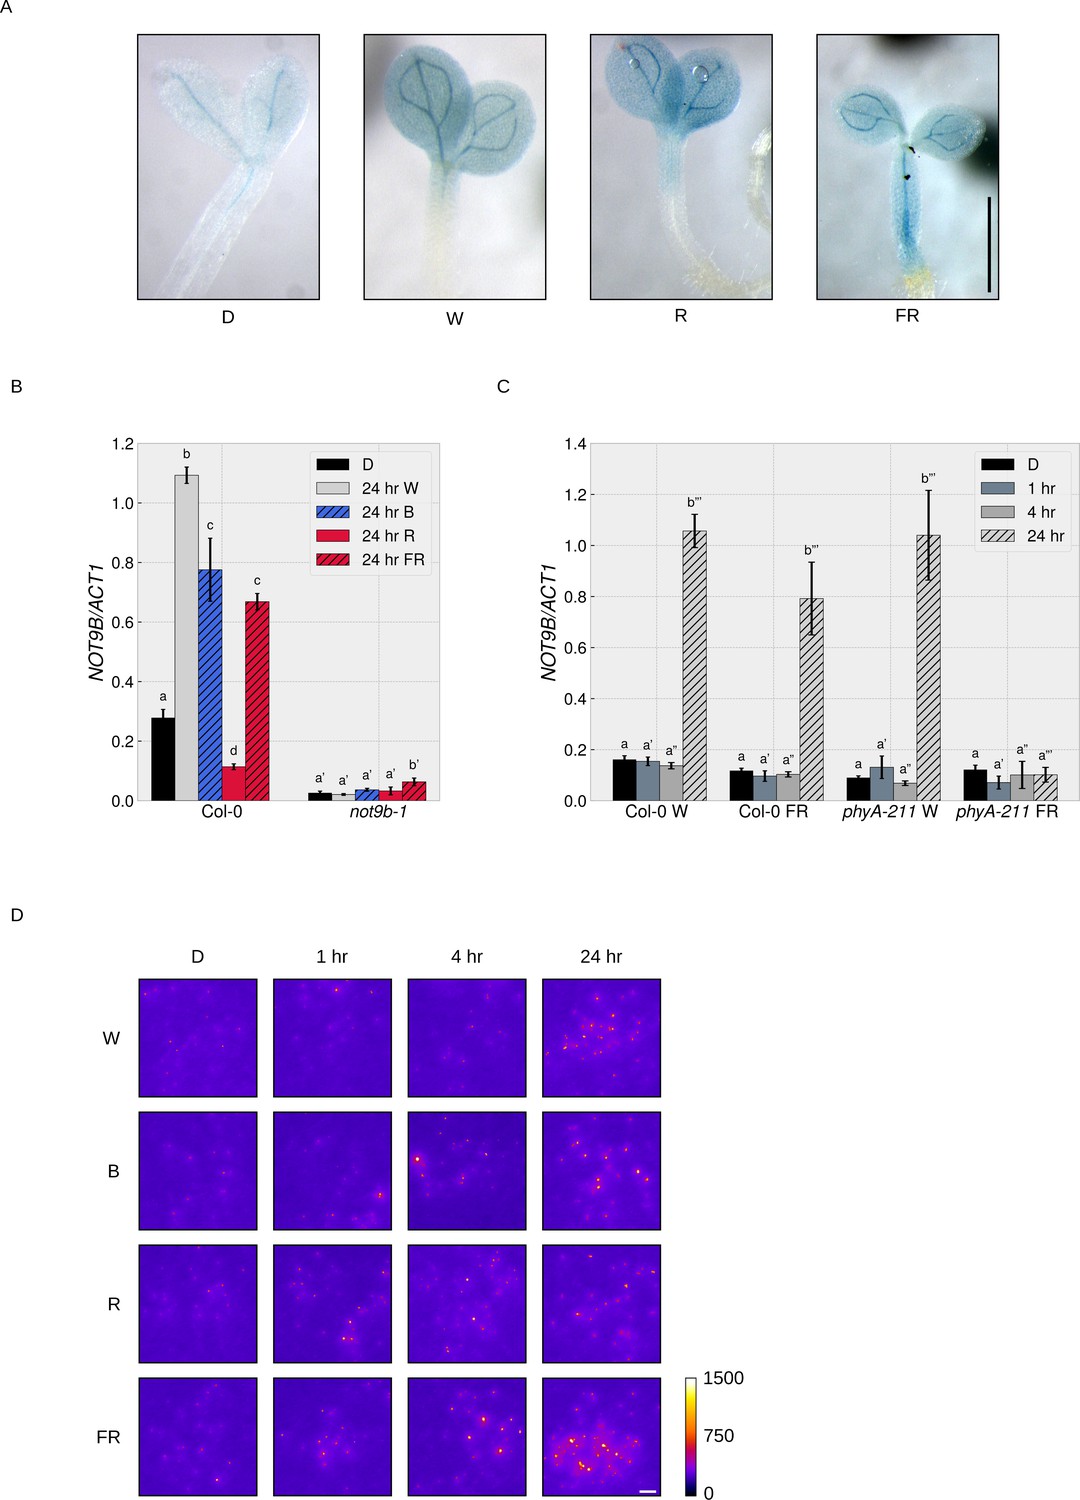
Expression pattern and light-regulation of NOT9B transcript and protein levels.
(A) NOT9B expression pattern. Seedlings expressing a pNOT9B:GUS reporter gene were grown in W, R, or FR light for 4 days or kept in the dark. Seedlings were then stained for GUS activity. Scale bar represents 1 mm. (B and C) Light-regulation of NOT9B transcript levels. (B) Four-day-old dark-grown wildtype (Col-0) or not9b-1 seedlings were exposed to W, R, B, or FR light for 24 hr or kept in the dark. (C) Four-day-old wildtype (Col-0) or phyA-211 seedlings were irradiated with W or FR light for 1, 4, or 24 hr, or kept in the dark. (B and C) Total RNA was extracted and NOT9B levels were quantified by qRT-PCR. ACT1 transcript levels were used for normalisation. Bars show mean NOT9B/ACT1 levels of three biological replicates (± SD). Letters indicate levels of significance as determined by one-way ANOVA followed by post-hoc Tukeys HSD test: p<0.05. (D) Light-regulation of NOT9B protein levels. Four-day-old Col-0 seedlings expressing pNOT9B:LUC-NOT9B were irradiated with W, R, FR, or B light for 1, 4, or 24 hr, or kept in the dark. Seedlings were sprayed with luciferin and light emission was detected using a CCD camera. Scale bar represents 5 mm.
Figure 3
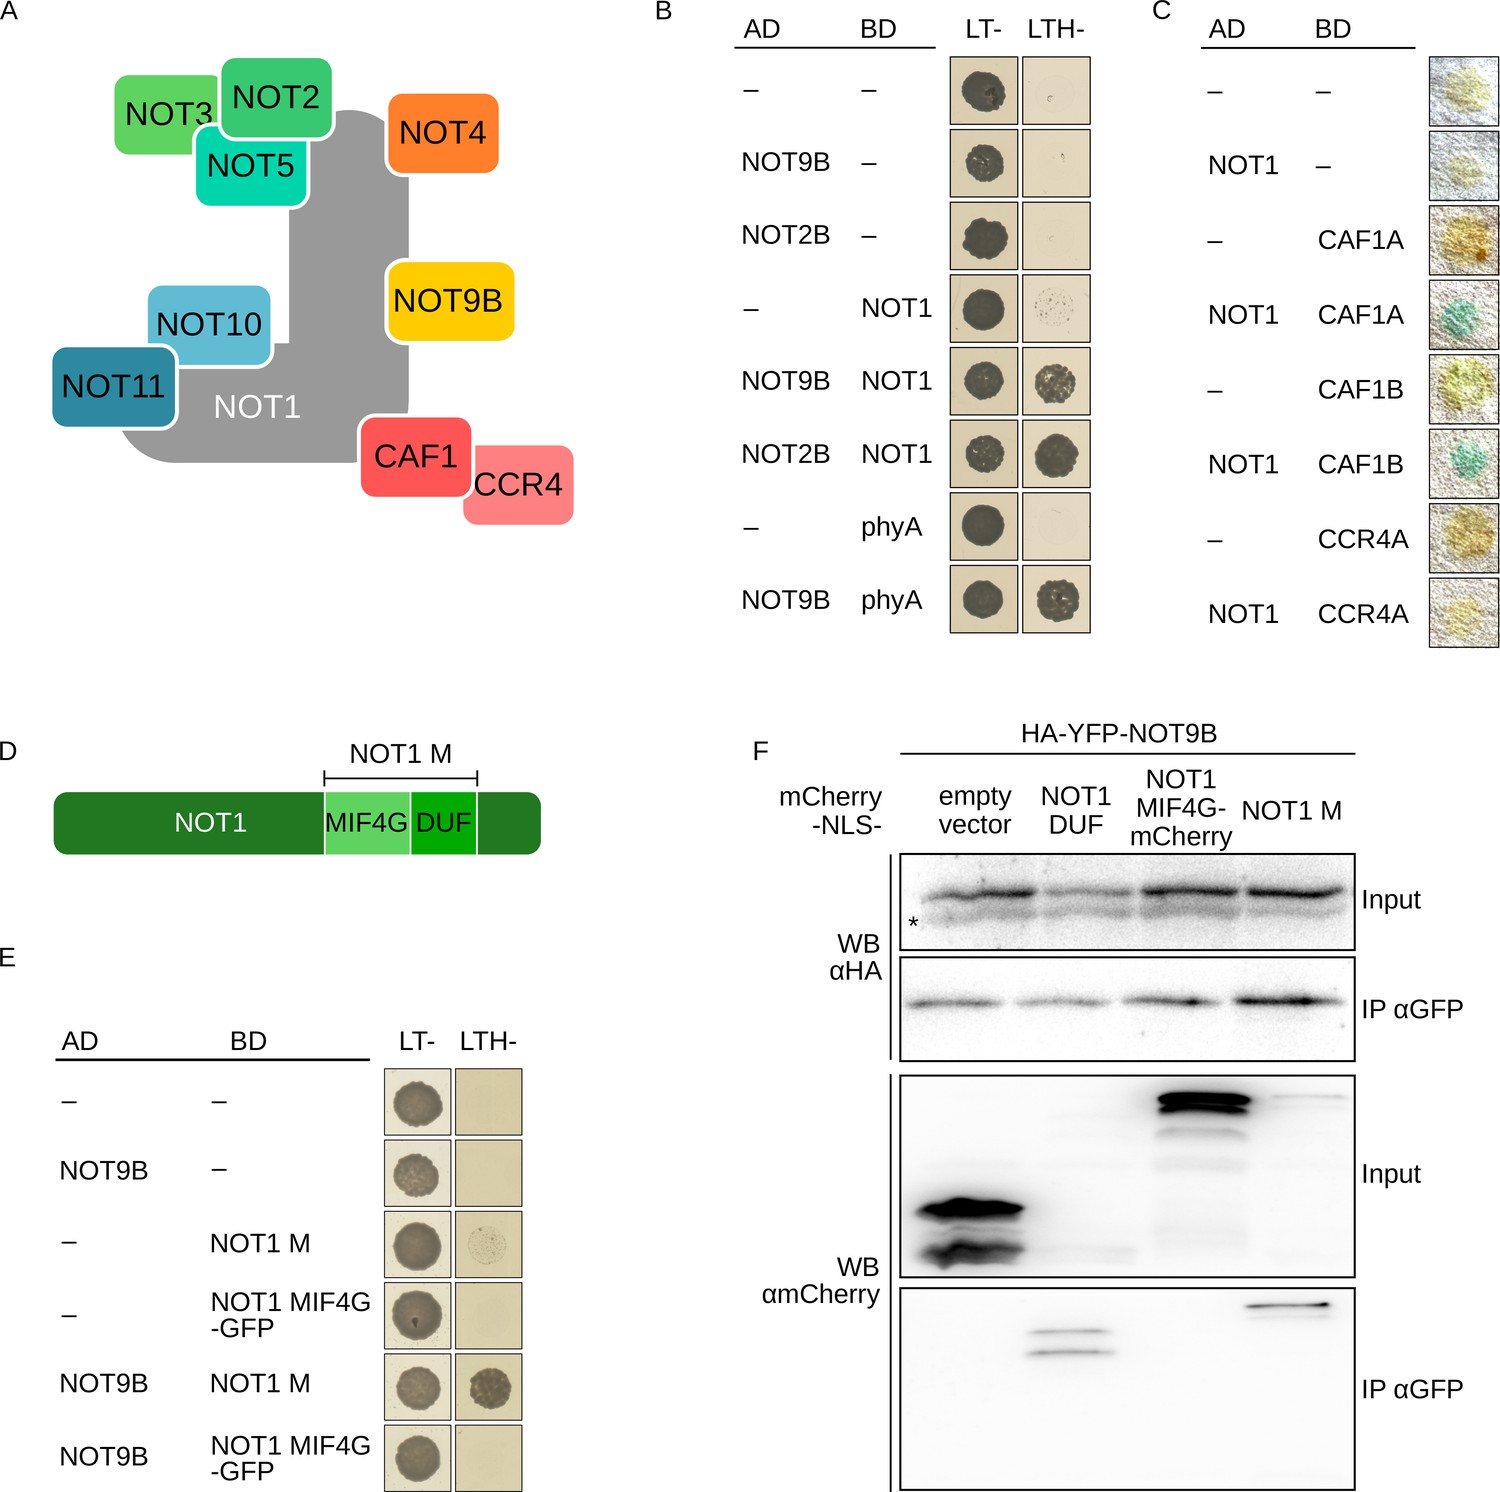
NOT9B is part of the CCR4-NOT complex.
(A) Schematic representation of the yeast/human CCR4-NOT core complex (Collart, 2016; Collart and Panasenko, 2017). (B) Y2H growth assay with components of the CCR4-NOT complex. AH109 cells were transformed with plasmids coding for the indicated AD and BD fusion proteins and grown on CSM LTH- plates supplemented with 25 mM 3-AT to test for interaction. Growth on CSM LT- plates was used as transformation control. (C) Y2H filter lift assay. Y190 yeast cells were transformed with plasmids coding the indicated AD and BD fusion proteins and grown on CSM LT- plates. Colonies were lifted onto filter paper and assayed for β-Galactosidase activity, which results in blue staining. (D) Schematic representation of NOT1 (Collart, 2016; Collart and Panasenko, 2017). (E) Y2H growth assay with NOT1 fragments. AH109 cells were transformed with plasmids coding for the indicated AD and BD fusion proteins and grown on CSM LTH- plates supplemented with 25 mM 3-AT to test for interaction. (F) CoIP from transiently transformed tobacco leaves. Leaves of 4-week-old tobacco plants were infiltrated with Agrobacteria transformed with plasmids coding for HA-YFP-NOT9B and different NOT1 fragments tagged with FLAG-myc-mCherry-NLS (mCherry-NLS). Plants were kept in the dark for 3 days followed by 5 min irradiation with white light. Total soluble protein was extracted, and CoIP was performed using αGFP magnetic beads. Input and eluate fractions were analysed by SDS-PAGE and immunoblotting with αHA and αmCherry antibodies. *, unspecific band.
Figure 4 with 2 supplements
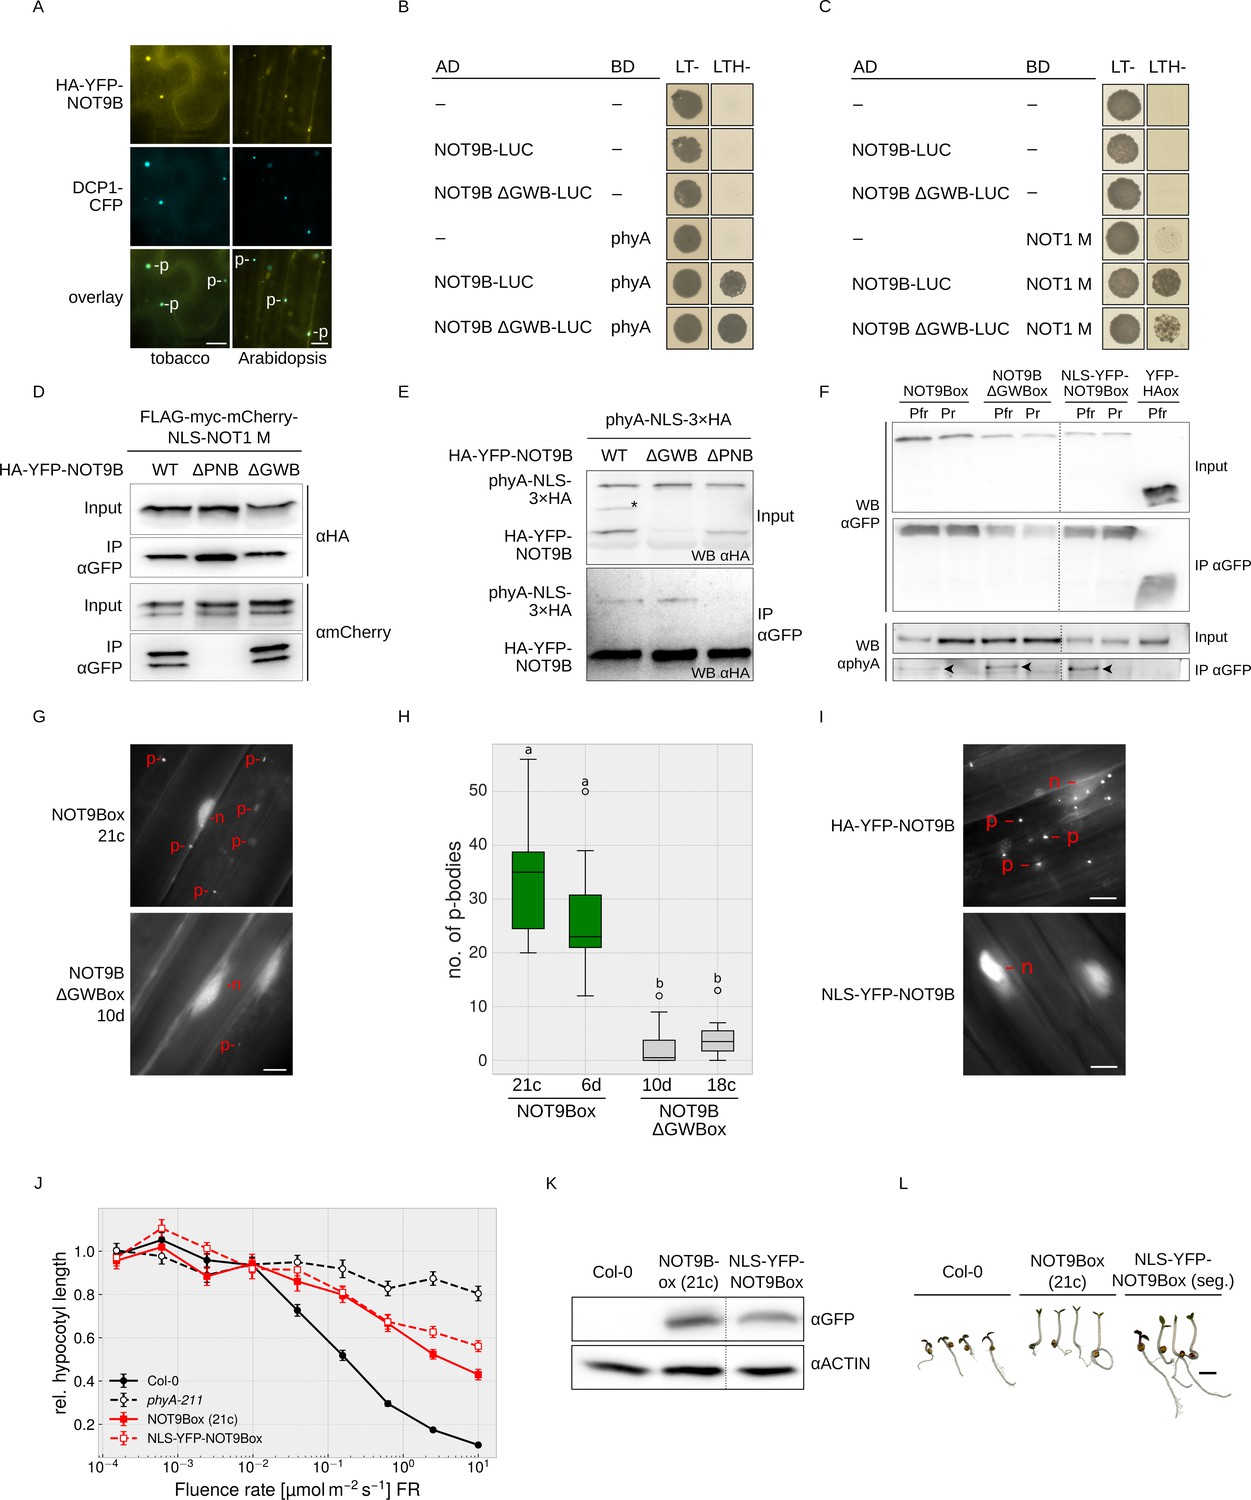
NOT9B is a dual-localised protein with both a nuclear and a p-body localised fraction.
(A) Subcellular localisation of NOT9B. Leaves of 4-week-old tobacco plants were infiltrated with Agrobacteria transformed with plasmids coding for p35S:HA-YFP-NOT9B and p35S:DCP1-CFP. Plants were then incubated in white light for 3 days. Arabidopsis seedlings co-expressing p35S:HA-YFP-NOT9B and p35S:DCP1-CFP were grown in the dark for 4 days. Localisation of NOT9B and DCP1 was investigated by epifluorescence microscopy. Scale bars represent 5 μm. p, p-body. An intensity plot for DCP1-CFP and YFP-NOT9B co-expressed in Arabidopsis is shown in Figure 4—figure supplement 1. (B and C) Y2H growth assays. AH109 yeast cells were transformed with plasmids coding for the indicated AD and BD fusion proteins and grown in R light on CSM LTH- plates supplemented with 10 mM 3-AT and 20 μM phycocyanobilin (B) or grown on CSM LTH- plates containing 25 mM 3-AT (C). CSM LT- plates were used as transformation control. (D and E) CoIP from transiently transformed tobacco leaves. Leaves of 4-week-old tobacco plants were co-infiltrated with Agrobacteria transformed with plasmids coding for different HA-YFP-NOT9B versions (WT, ΔPNB, ΔGWB) and either p35S:FLAG-myc-mCherry-NLS-NOT1 M (D) or p35S:PHYA-NLS-3×HA (E). Plants were kept in the dark for 3 days followed by 5 min irradiation with white light. Total soluble protein was extracted and CoIP was performed using αGFP magnetic beads. Input and eluate fractions were analysed by SDS-PAGE and immunoblotting with αHA (E) or αHA and αmCherry antibodies (D). *, unspecific band. (F) CoIP from transgenic Arabidopsis seedlings. Arabidopsis seedlings expressing p35S:HA-YFP-NOT9B (NOT9Box), p35S:HA-YFP-NOT9B ΔGWB, p35S:NLS-YFP-NOT9B, or p35S:YFP-HA (negative control) were grown for four days in the dark and subjected to FR light for 5 hr followed by 5 min of R light (Pfr) or long-wavelength FR light (Pr). Total soluble protein was extracted, and CoIP was performed using αGFP magnetic beads. Input and eluate fractions were analysed by SDS-PAGE and immunoblotting with αGFP and αphyA. Arrowheads point to phyA in the eluate fraction. (G) Subcellular localisation of NOT9B ΔGWB. Arabidopsis seedlings expressing p35S:HA-YFP-NOT9B (NOT9Box 21c) or p35S:HA-YFP-NOT9B ΔGWB (NOT9B ΔGWB 10d) were grown for 4 days in the dark followed by 6 hr in FR light and subjected to epifluorescence microscopy. Scale bar represents 5 μm. p, p-body; n, nucleus. (H) Quantification of p-bodies. Seedlings of two independent lines expressing p35S:HA-YFP-NOT9B (NOT9Box) or p35S:HA-YFP-NOT9B ΔGWB (NOT9B ΔGWBox) were grown as in (G). Pictures were taken and number of p-bodies was counted in a 200 × 350 pixel area. Boxplots represent 12 evaluated areas per line. Letters indicate levels of significance as determined by one-way ANOVA followed by post-hoc Tukeys HSD test; p<0.05. (I) Subcellular localisation of NLS-YFP-NOT9Box. Four-day-old dark-grown seedlings expressing either p35S:HA-YFP-NOT9B or p35S:NLS-YFP-NOT9B were analysed by epifluorescence microscopy. Scale bar represents 5 μm. (J) Fluence rate response curve for inhibition of hypocotyl growth. Arabidopsis seedlings expressing p35S:HA-YFP-NOT9B (NOT9Box) or p35S:NLS-YFP-NOT9B (NLS-YFP-NOT9Box) were grown for 4 days in FR light. Mean hypocotyl length (±SE) of 20 seedlings relative to dark-grown seedlings is shown. (K) Western blot analysis of protein levels. Total protein was extracted from 4-day-old dark-grown Arabidopsis seedlings expressing p35S:HA-YFP-NOT9B (NOT9Box) or p35S:NLS-YFP-NOT9B (NLS-YFP-NOT9Box) and analysed by SDS-PAGE and immunoblotting with αGFP and αACTIN antibodies. ACTIN was detected as loading control. (L) Phenotype of NLS-YFP-NOT9Box seedlings. NOT9Box seedlings and a segregating population of the p35S:NLS-YFP-NOT9B expressing line shown in (J and K) were grown for 4 days in FR light (FR, 40 μmol m−2 s−1). Scale bar represents 2 mm.
Figure 4—figure supplement 1
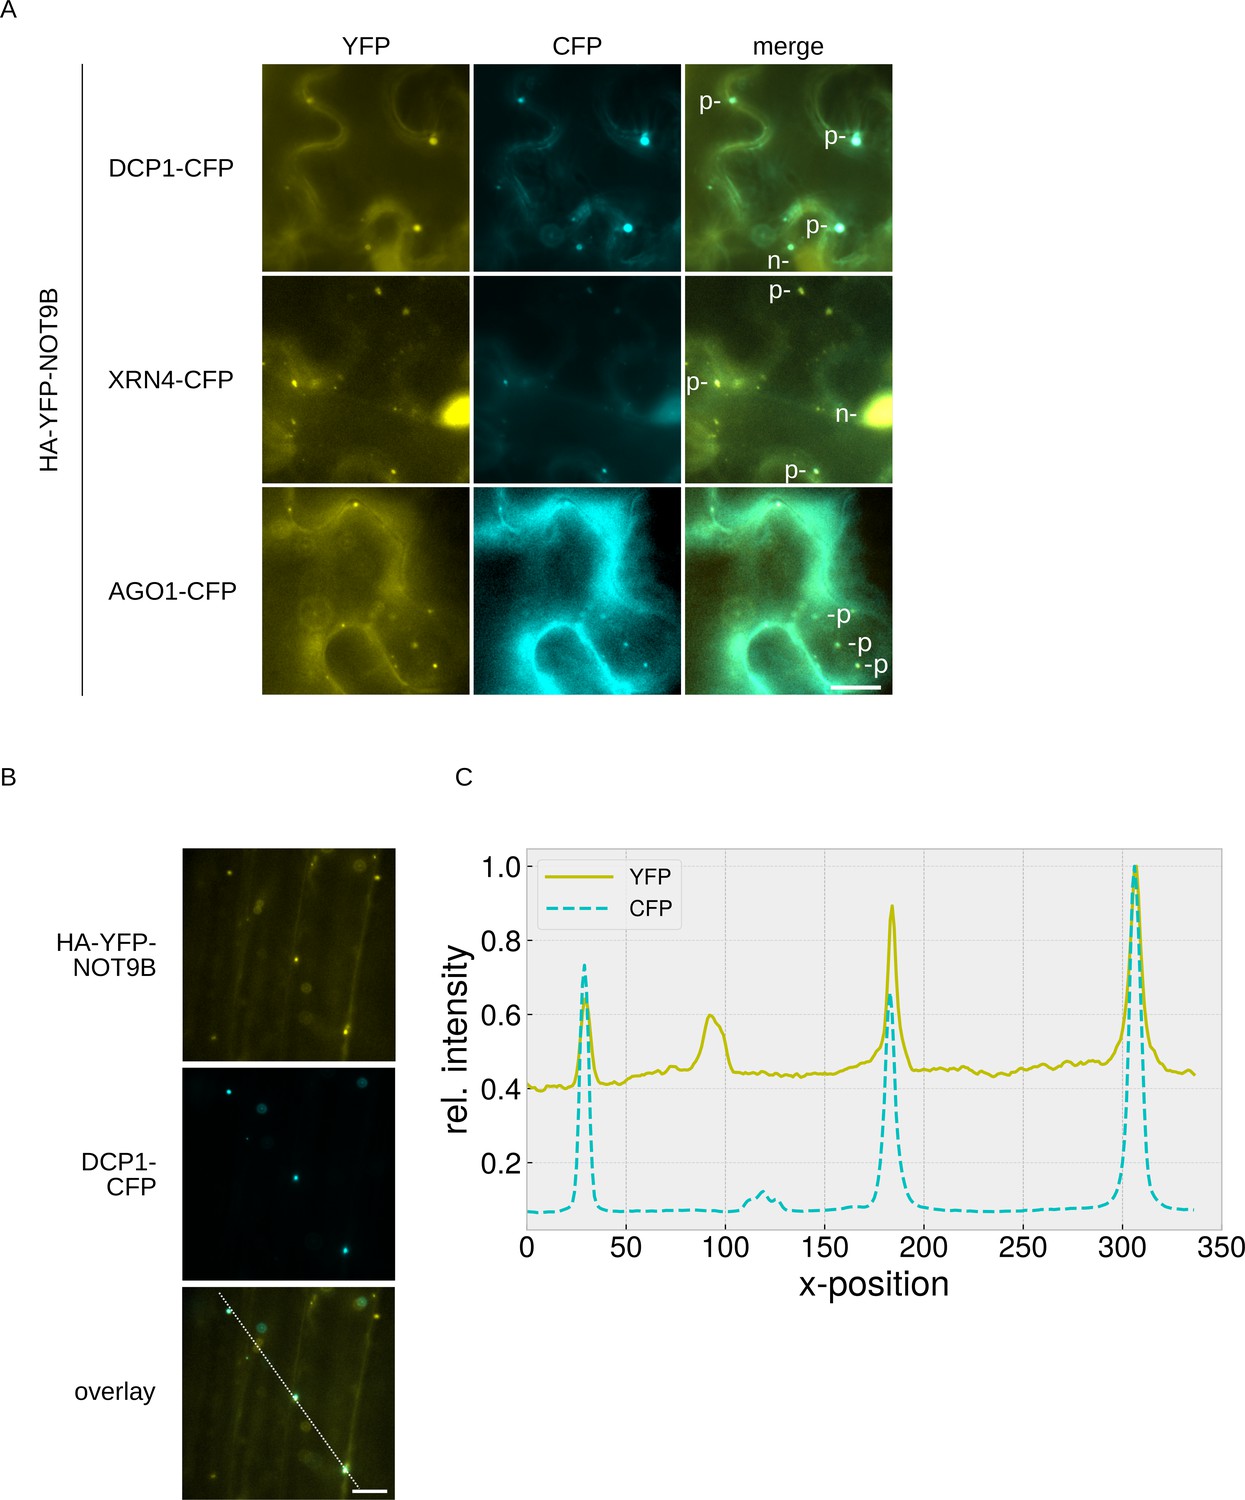
Colocalisation of NOT9B with p-body markers.
(A) Co-expression of HA-YFP-NOT9B and p-body markers in tobacco leaves. Leaves of 4-week-old tobacco plants were co-infiltrated with Agrobacteria transformed with plasmids coding for p35S:HA-YFP-NOT9B and either p35S:DCP1-CFP, p35S:XRN4-CFP, or p35S:AGO1-CFP. Plants were then incubated in white light for 3 days and analysed by epifluorescence microscopy. Scale bar represents 5 μm. p, p-body; n, nucleus. (B and C) Intensity plot for YFP-NOT9B and DCP1-CFP co-expressed in Arabidopsis (data also shown in Figure 4A). (B) Seedlings co-expressing p35S:HA-YFP-NOT9B and p35S:DCP1-CFP were grown in the dark for 4 days. Localisation of NOT9B and DCP1 was investigated by epifluorescence microscopy. Scale bar represents 5 μm. (C) Intensity plot for trajectory indicated in overlay of panel (B).
Figure 4—figure supplement 2
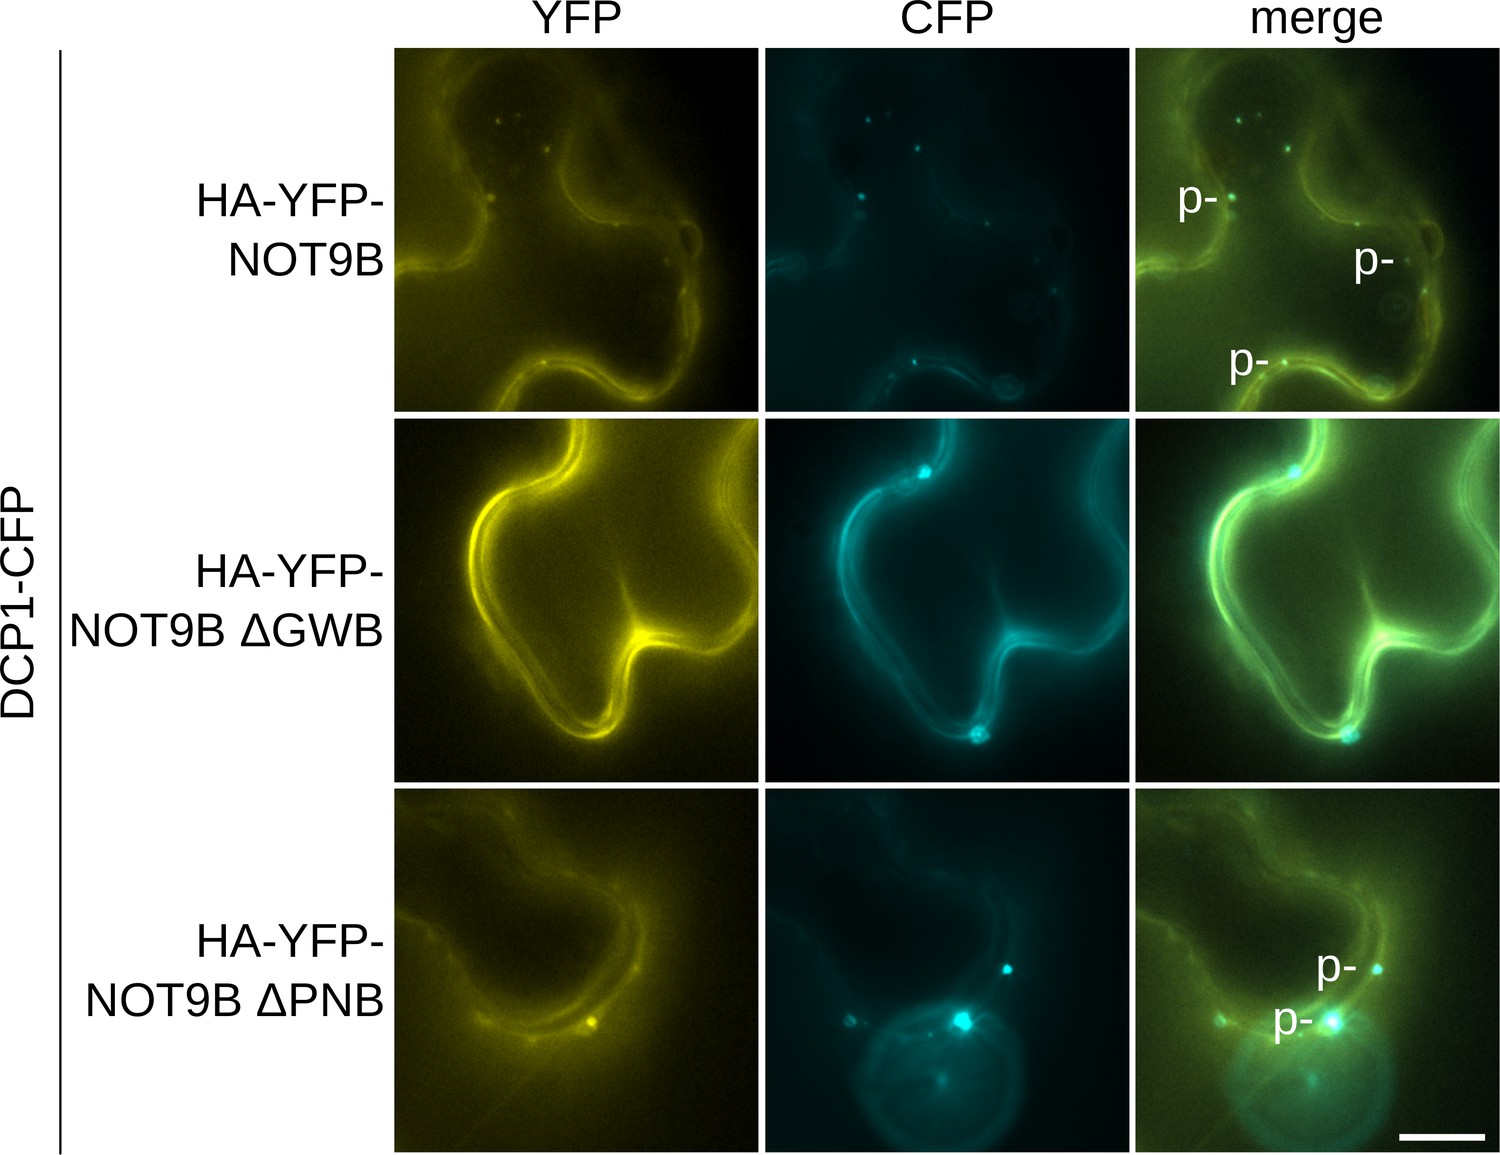
Analysis of p-body formation for NOT9B mutants.
Leaves of 4-week-old tobacco plants were co-infiltrated with Agrobacteria transformed with plasmids coding for p35S:DCP1-CFP and either p35S:HA-YFP-NOT9B, p35S:HA-YFP-NOT9B ΔGWB, or p35S:HA-YFP-NOT9B ΔPNB. Plants were then incubated in white light for 3 days and analysed by epifluorescence microscopy. Scale bar represents 5 μm. p, p-body.
Figure 5
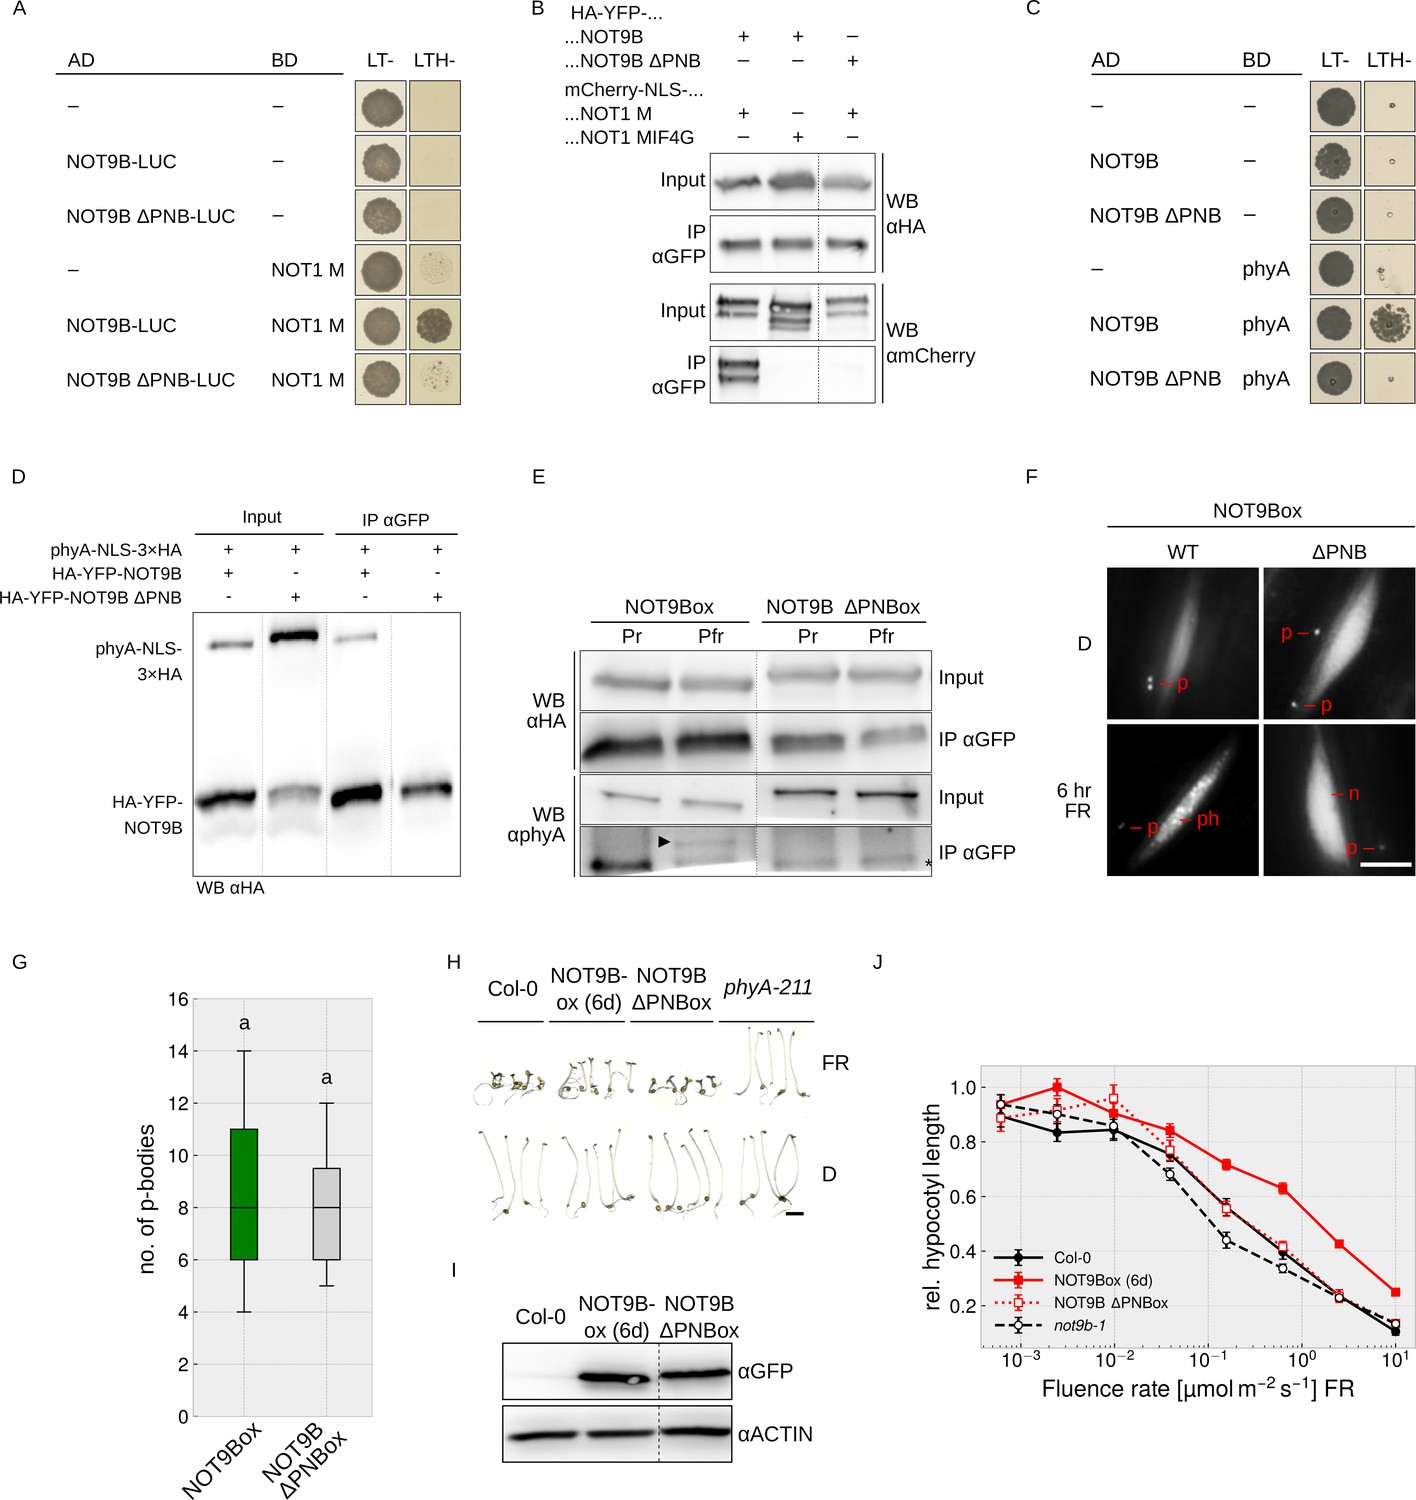
Both phyA and NOT1 bind to the PNB site of NOT9B.
(A and C) Y2H growth assays. AH109 yeast cells were transformed with plasmids coding for the indicated AD and BD fusion proteins and grown on CSM LTH- plates containing 25 mM 3-AT (A) or grown in R light on CSM LTH- plates supplemented with 10 mM 3-AT and 20 μM phycocyanobilin (C). CSM LT- plates were used as transformation control. (B and D) CoIP from transiently transformed tobacco. Leaves of 4 week-old tobacco plants were co-infiltrated with Agrobacteria transformed with plasmids coding for p35S:HA-YFP-NOT9B or -NOT9B ΔPNB and p35S:FLAG-myc-mCherry-NLS-NOT1 M or -NOT1 MIF4G-mCherry (B), and p35S:PHYA-NLS-3×HA and either p35S:HA-YFP-NOT9B or -NOT9B ΔPNB (D). Plants were kept in the dark and exposed to W light for 5 min. Total soluble protein was then extracted and used for CoIP with αGFP magnetic beads. Input and eluate fractions were analysed by SDS-PAGE and immunoblotting with αHA and αmCherry (B) or αHA antibodies (D). (E) CoIP from transgenic Arabidopsis lines. Four-day-old dark-grown Arabidopsis seedlings expressing p35S:HA-YFP-NOT9B or -NOT9B ΔPNB were exposed to FR light for 5 hr followed by 5 min R (Pfr) or long-wavelength FR light (Pr). Total soluble protein was then extracted and used for CoIP with αGFP magnetic beads. Input and eluate fractions were analysed by SDS-PAGE and immunoblotting with αHA and αphyA antibodies. *, unspecific band; ►, phyA. (F) Nuclear body formation of NOT9B and NOT9B ΔPNB. Four-day-old dark-grown Arabidopsis seedlings expressing p35S:HA-YFP-NOT9B (NOT9Box WT, line 6d) or -NOT9B ΔPNB (NOT9Box ΔPNB) were exposed to FR light for 6 hr or kept in the dark and analysed by epifluorescence microscopy. Scale bar represents 5 μm. p, p-body; ph, photobody; n, nucleus. (G) Quantification of p-bodies. Seedlings expressing p35S:HA-YFP-NOT9B (NOT9Box) or p35S:HA-YFP-NOT9B ΔPNB (NOT9B ΔPNBox) were grown for 4 days in D. Pictures were taken and number of p-bodies was counted in a 200 × 350 pixel area. Boxplots represent 12 evaluated areas per line. Letters indicate levels of significance as determined by one-way ANOVA followed by post-hoc Tukeys HSD test; p<0.05. (H) Phenotype of NOT9B ΔPNBox seedlings. Seedlings were grown for 4 days in FR light (FR, 40 μmol m−2 s−1) or in the dark. Scale bar represents 2 mm. (I) Western blot analysis of protein levels. Total protein was extracted from 4-day-old dark-grown Arabidopsis seedlings expressing p35S:HA-YFP-NOT9B (NOT9Box, line 6d) or -NOT9B ΔPNB (NOT9B ΔPNBox) and analysed by SDS-PAGE and immunoblotting with αGFP and αACTIN antibodies. ACTIN was detected as loading control. (J) Fluence rate response curve for inhibition of hypocotyl growth. Arabidopsis seedlings expressing p35S:HA-YFP-NOT9B (NOT9Box, line 6d) or -NOT9B ΔPNB (NOT9B ΔPNBox) were grown for 4 days in FR light. Mean hypocotyl length (±SE) of 20 seedlings relative to dark-grown seedlings is shown.
Figure 6 with 5 supplements
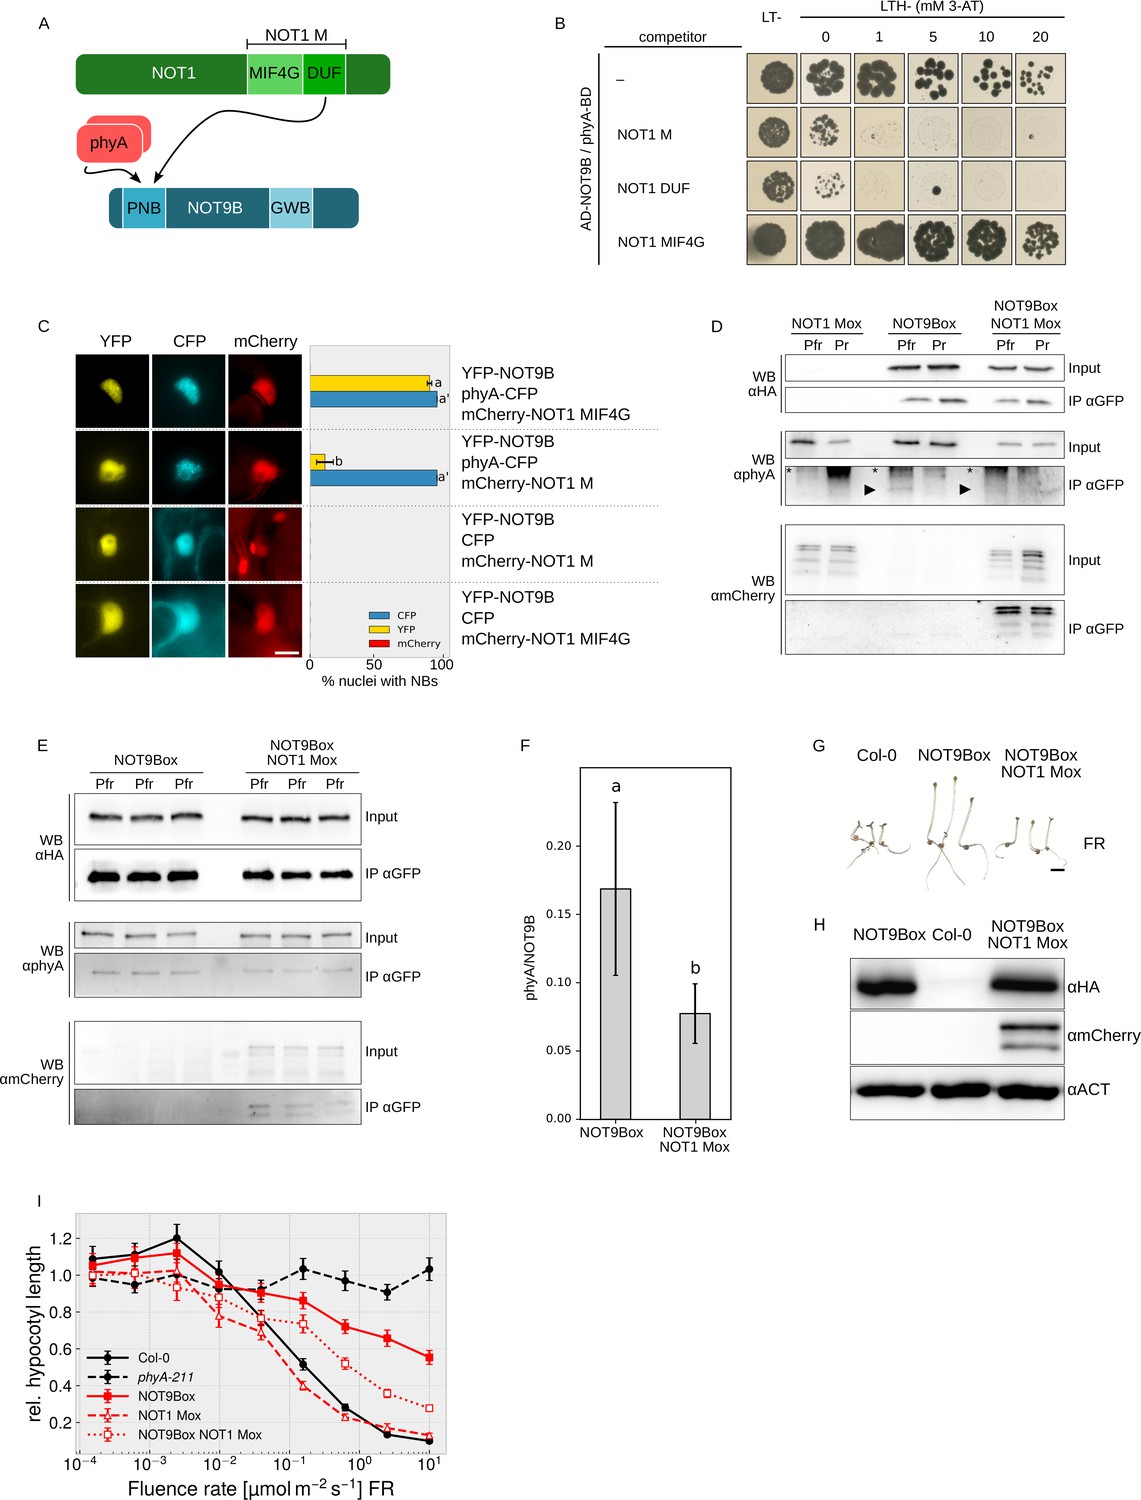
NOT1 and phyA compete for binding NOT9B.
(A) Domain structure and interaction domains of NOT1 and NOT9B. (B) Yeast three-hybrid competition assay. AH109 cells were transformed with plasmids coding for the yeast-two-hybrid pair AD-NOT9B and phyA-BD, and for different NOT1 fragments as potential competitors. Yeast cells were grown in R light on CSM LTH- plates supplemented with 20 μM phycocyanobilin and containing increasing amounts of 3-AT. CSM LT- plates were used as transformation control. (C) Quantification of NOT9B nuclear body formation. Four-week-old tobacco plants were co-infiltrated with Agrobacteria transformed with plasmids coding for p35S:NLS-YFP-NOT9B (YFP-NOT9B), either p35S:PHYA-NLS-CFP (phyA-CFP) or p35S:CFP (CFP), and either p35S:FLAG-myc-mCherry-NLS-NOT1 M (mCherry-NOT1 M) or -NOT1 MIF4G-mCherry (mCherry-NOT1 MIF4G). Plants were kept in the dark for 2 days and subjected to epifluorescence microscopy. Representative pictures are shown on the left. Scale bar represents 5 μm. Twenty-five nuclei per plasmid combination were randomly chosen and evaluated for nuclear body formation. Bars represent the mean of three biological replicates (± SD) and show the relative number of nuclei with nuclear bodies in the respective channel. (C and F) Letters indicate levels of significance as determined by one-way ANOVA followed by post-hoc Tukeys HSD test; p<0.05. (D) CoIP from transgenic Arabidopsis lines. Four-day-old dark-grown Arabidopsis seedlings expressing p35S:HA-YFP-NOT9B (NOT9Box, line 21c), p35S:FLAG-myc-mCherry-NLS-NOT1 M (NOT1 Mox) or both were exposed to FR light for 5 hr followed by 5 min R (Pfr) or long-wavelength FR light (Pr). Total soluble protein was then used for CoIP with αGFP magnetic beads. Input and eluate fractions were analysed by SDS-PAGE and immunoblotting with αHA, αphyA, and αmCherry antibodies. *, unspecific bands; ►, phyA. (E) CoIP for quantification. Arabidopsis NOT9Box (line 21c) and NOT9Box NOT1 Mox seedlings were grown as described in (D). CoIP and analysis of input and eluate fractions was done as in (D). The three lanes per genotype represent independent biological replicates. (F) Quantification of CoIP in (E). The amount of precipitated NOT9B and phyA was quantified using ImageJ. Bars represent mean phyA/NOT9B ratio of three biological replicates (± SD). (G) Seedling phenotype. Arabidopsis wildtype (Col-0), NOT9Box (line 21c), and NOT9Box NOT1 Mox seedlings were grown for 4 days in FR light (40 μmol m−2 s−1). Scale bar represents 2 mm. (H) Western blot analysis of protein levels. Total protein was extracted from 4-day-old dark-grown Col-0, NOT9Box (line 21c), and NOT9Box NOT1 Mox seedlings and analysed by SDS-PAGE and immunoblotting with αHA, αmCherry, and αACTIN antibodies. ACTIN was detected as loading control. (I) Fluence rate response curve for inhibition of hypocotyl growth. Seedlings of the indicated genotypes were grown for 4 days in FR light. Mean hypocotyl length (± SE) of 20 seedlings relative to dark-grown seedlings is shown.
Figure 6—figure supplement 1
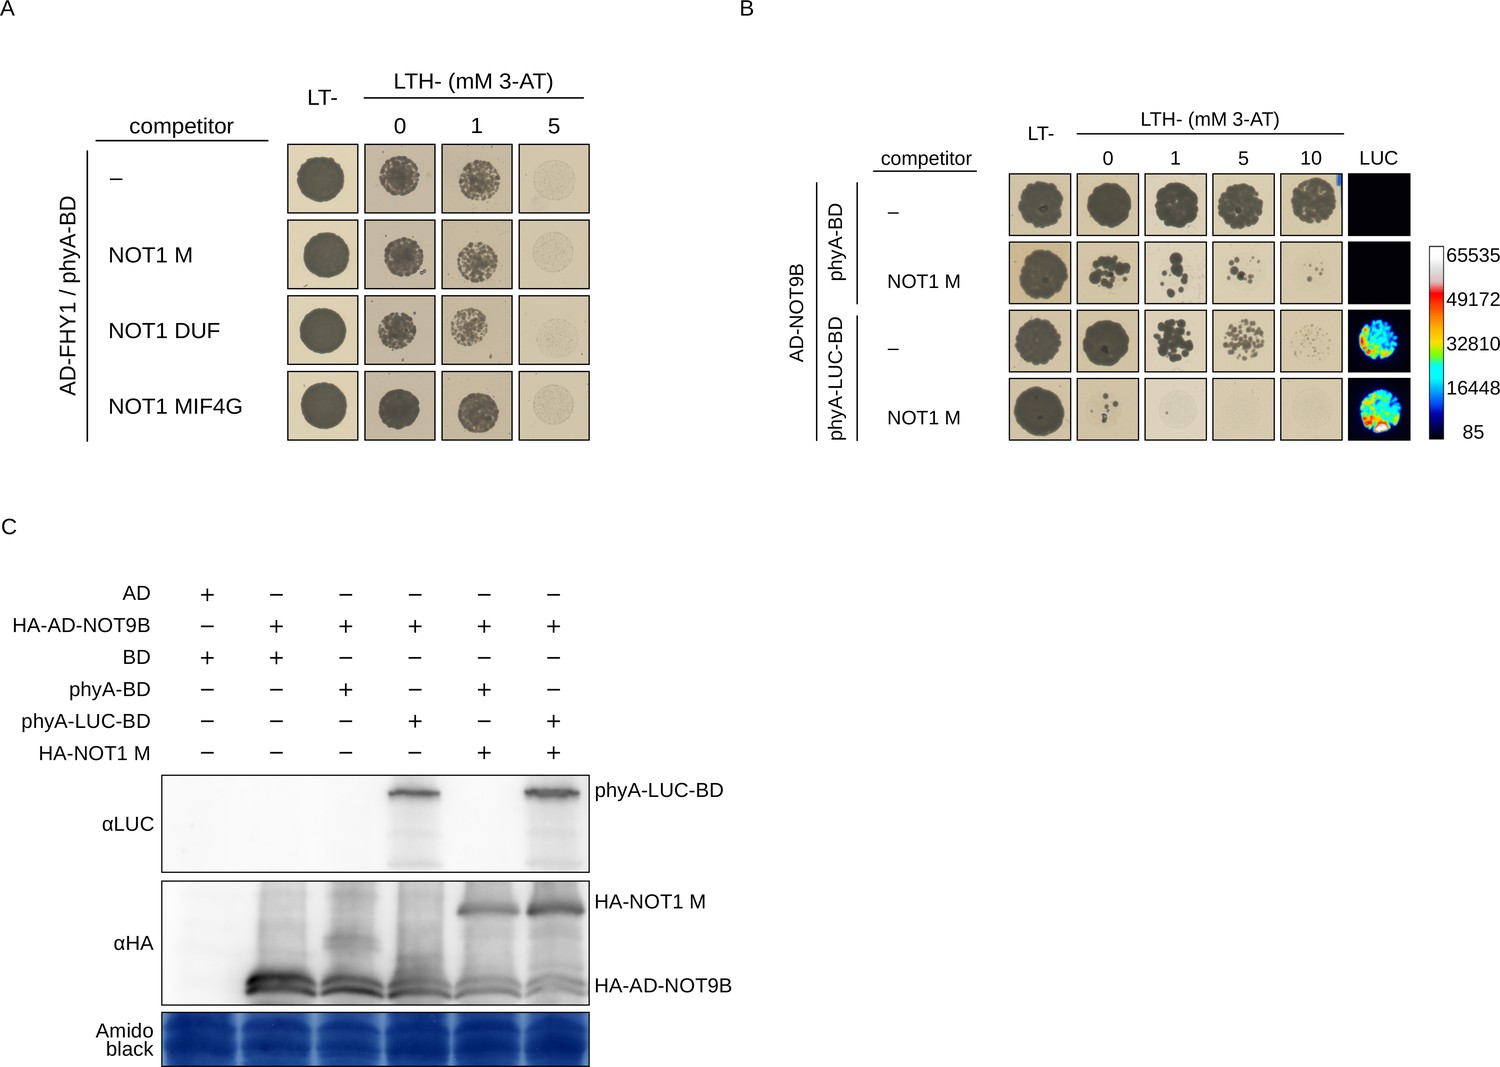
Yeast three-hybrid competition assays.
(A) Yeast three-hybrid competition assay for NOT1, phyA, and FHY1. AH109 cells were transformed with plasmids coding for the yeast-two-hybrid pair AD-FHY1 and phyA-BD, and for different NOT1 fragments as potential competitors. (B) Yeast-three hybrid competition assay for NOT1, phyA-LUC, and NOT9B. AH109 cells were transformed with plasmids coding for the yeast-two-hybrid pair AD-NOT9B and either phyA-BD or phyA-LUC-BD, and for NOT1 M as potential competitor. (A and B) Yeast cells were grown in R light on CSM LTH- plates supplemented with 20 μM phycocyanobilin and containing increasing amounts of 3-AT. CSM LT- plates were used as transformation control. (B) The CSM LT- plate was sprayed with luciferin and light emission was detected using a CCD camera. (C) Immunoblot analysis of protein levels in yeast cells in (B). Total protein was extracted from yeast cells expressing the indicated proteins and analysed by SDS-PAGE and immunoblotting with αLUC and αHA antibodies. Part of the amido-black-stained membrane is shown as loading control.
Figure 6—figure supplement 2
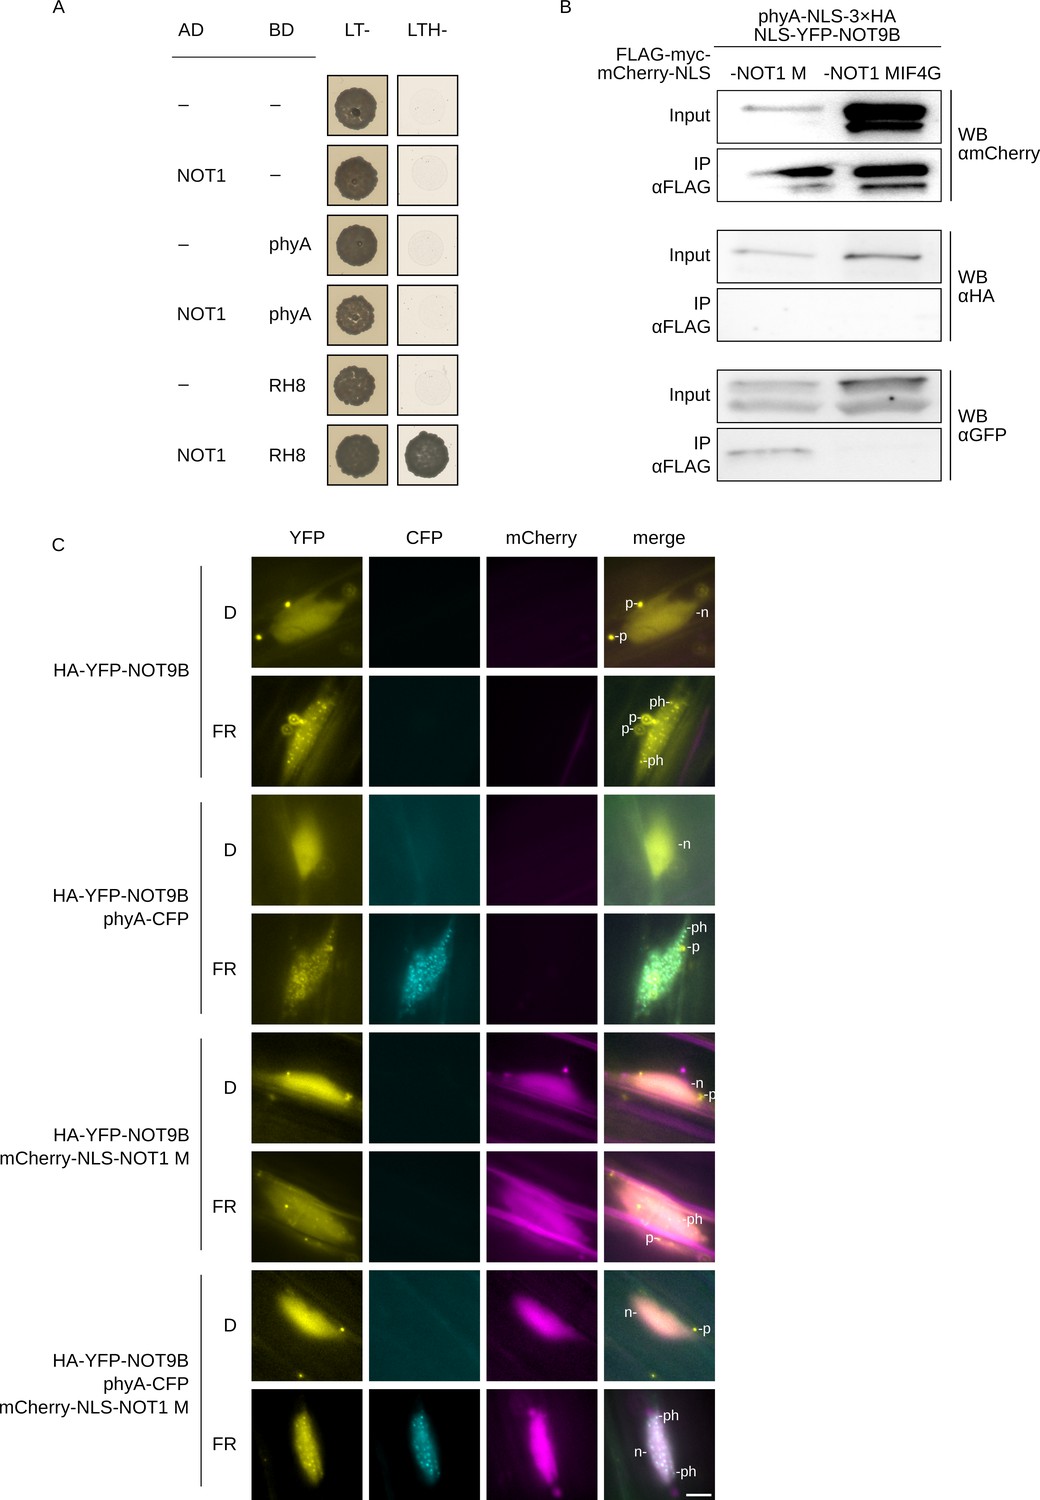
NOT1 does not interact with phyA and is not recruited into photobodies.
(A) Y2H growth assay. AH109 cells were transformed with plasmids coding for indicated AD and BD fusion proteins and grown on CSM LTH- plates supplemented with 10 mM 3-AT to test for interaction. Growth on CSM LT- plates was used as transformation control. RH8 was used as positive control for interaction with NOT1. (B) CoIP from transiently transformed tobacco leaves. Four-week-old tobacco leaves were co-infiltrated with Agrobacteria transformed with plasmids coding for p35S:PHYA-NLS-3×HA, p35S:NLS-YFP-NOT9B, and either p35S:FLAG-myc-mCherry-NLS-NOT1 M or -NOT1 MIF4G-mCherry. Plants were kept in the dark and exposed to W light for 5 min. Total soluble protein was then extracted and used for CoIP with αFLAG magnetic beads. Input and eluate fractions were analysed by SDS-PAGE and immunoblotting with αmCherry, αHA, and αGFP antibodies. (C) Subcellular localisation of NOT1 M protein in Arabidopsis seedlings. Four-day-old dark-grown seedlings expressing p35S:HA-YFP-NOT9B, co-expressing p35S:HA-YFP-NOT9B and either pPHYA:PHYA-CFP or p35S:FLAG-myc-mCherry-NLS-NOT1 M, or co-expressing all three transgenes were exposed to FR light for 6 hr or kept in the dark and analysed by epifluorescence microscopy. Scale bar represents 5 μm. p, p-body; n, nucleus; ph, photobody.
Figure 6—figure supplement 3
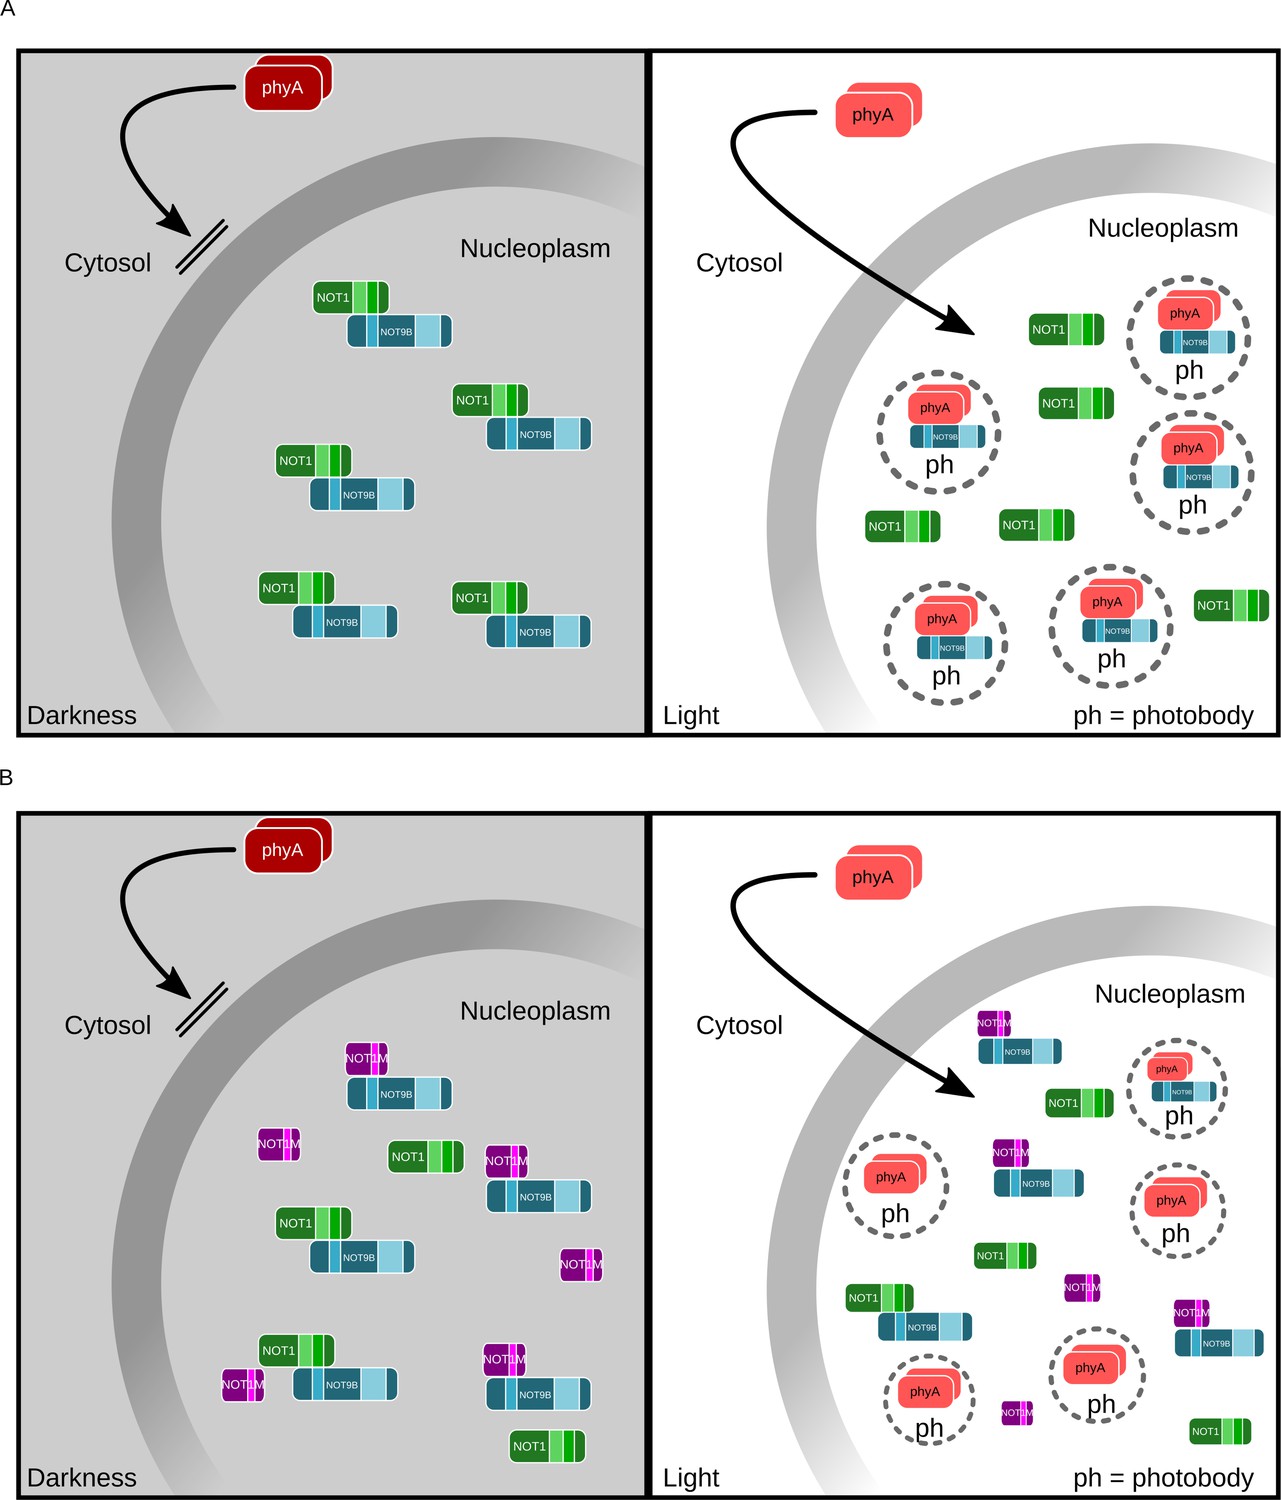
Model for NOT9B photobody formation in wildtype and NOT1 Mox background.
(A) Light-activated phyA translocates from the cytosol into the nucleus and recruits NOT9B into photobodies through binding to the PNB site. (B) Partially blocking the PNB site of NOT9B by overexpression of NOT1 M is therefore expected to reduce the number of NOT9B photobodies, while phyA photobodies should not be affected.
Figure 6—figure supplement 4
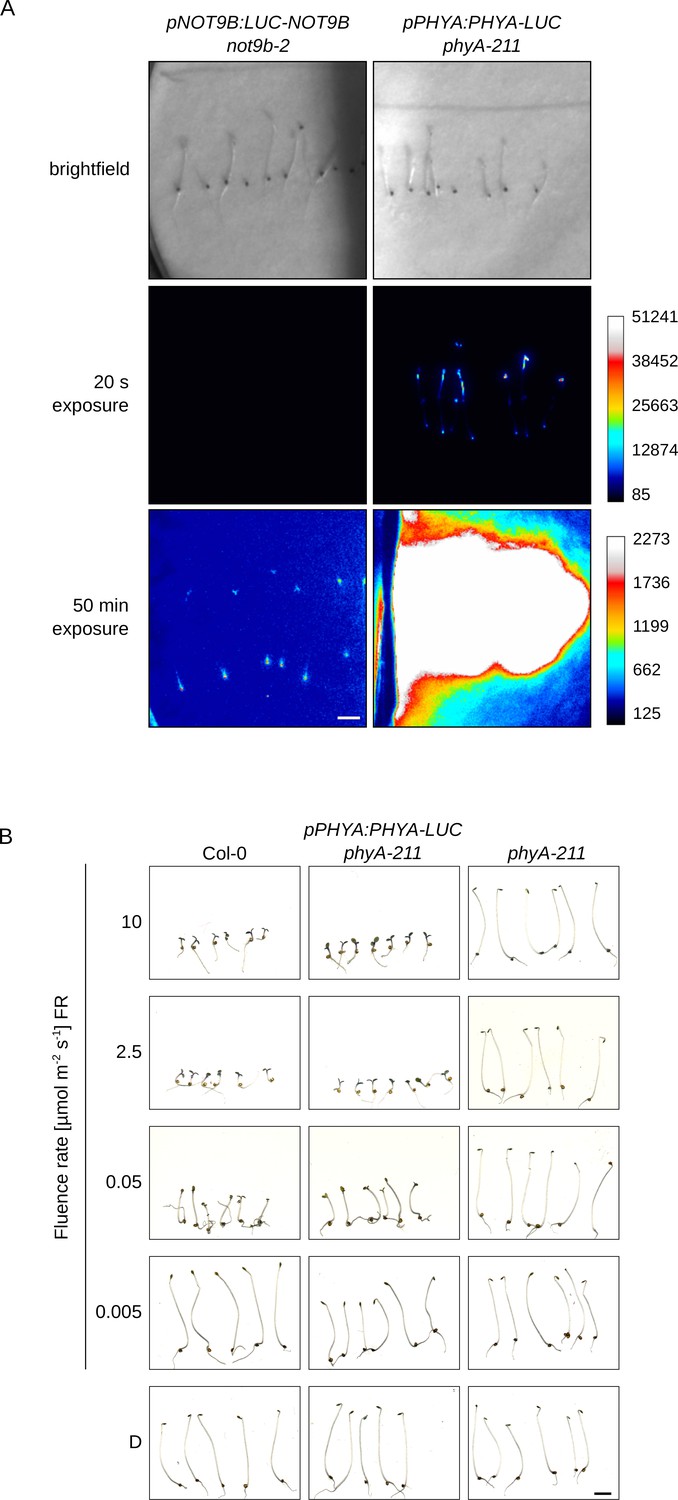
Comparison of NOT9B and phyA protein levels.
(A) Arabidopsis not9b-2 and phyA-211 seedlings complemented by expression of pNOT9B:LUC-NOT9B and pPHYA:PHYA-LUC, respectively, were grown for 4 days in the dark and exposed to FR light for 16 hr. Seedlings were then sprayed with luciferin and light emission was detected using a CCD camera. Pictures with 20 s and 50 min exposure time were acquired and processed in ImageJ. (B) Complementation of phyA-211 by expression of pPHYA:PHYA-LUC. Arabidopsis wildtype (Col-0), phyA-211, and phyA-211 pPHYA:PHYA-LUC seedlings were grown for 4 days in FR light of different fluence rates. Complementation of not9b-2 by pNOT9B:LUC-NOT9B is shown in Figure 2E. (A and B) Scale bars represent 2 mm.
Figure 6—figure supplement 5
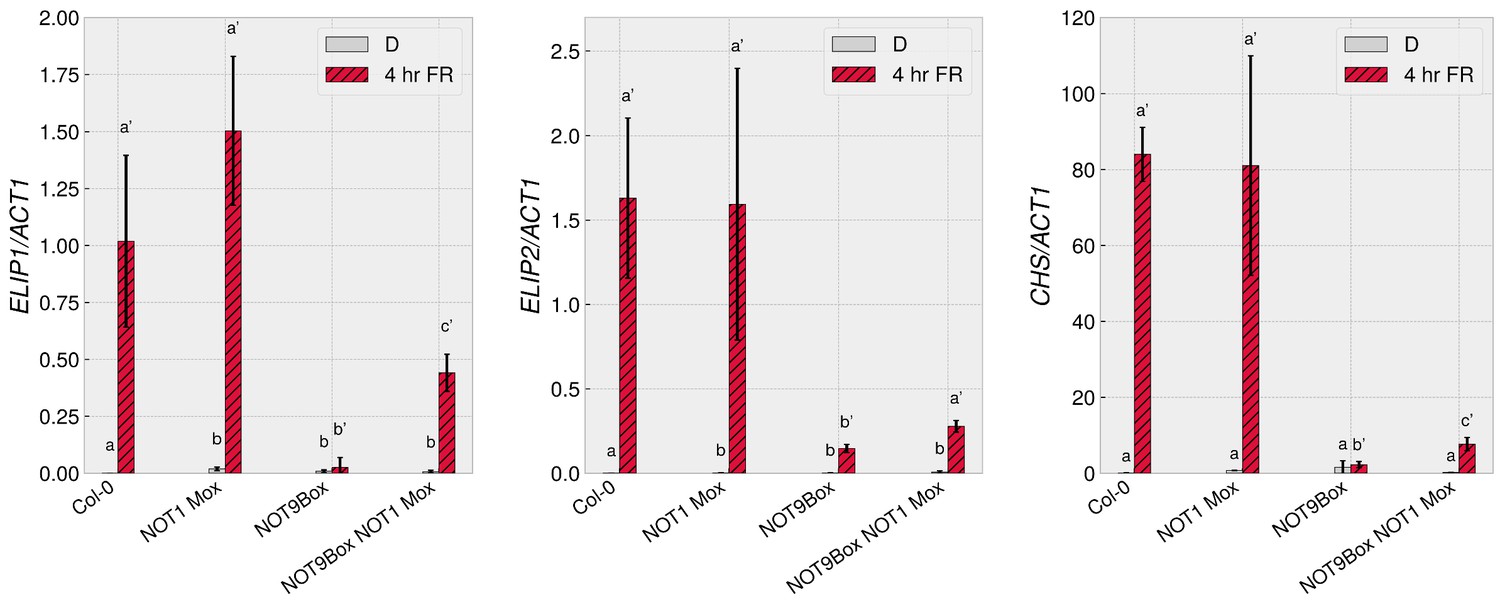
NOT1 M overexpression partially rescues NOT9Box gene expression defects.
Quantification of ELIP1, ELIP2, and CHS transcript levels in wildtype seedlings, seedlings expressing p35S:FLAG-myc-mCherry-NLS-NOT1 M (NOT1 Mox) or p35S:HA-YFP-NOT9B (NOT9Box, line 21c), and NOT9Box NOT1 Mox double transgenic seedlings. Four-day-old dark-grown seedlings were exposed to FR light for 4 hr or kept in the dark. Total RNA was extracted and ELIP1, ELIP2, CHS, and ACT1 transcript levels were quantified by qRT-PCR. Bars represent biological triplicates (± SD). Letters indicate levels of significance as determined by one-way ANOVA followed by post-hoc Tukeys HSD test; p<0.05.
Figure 7 with 3 supplements
Physical and phenotypical link between NOT9B and AGO1.
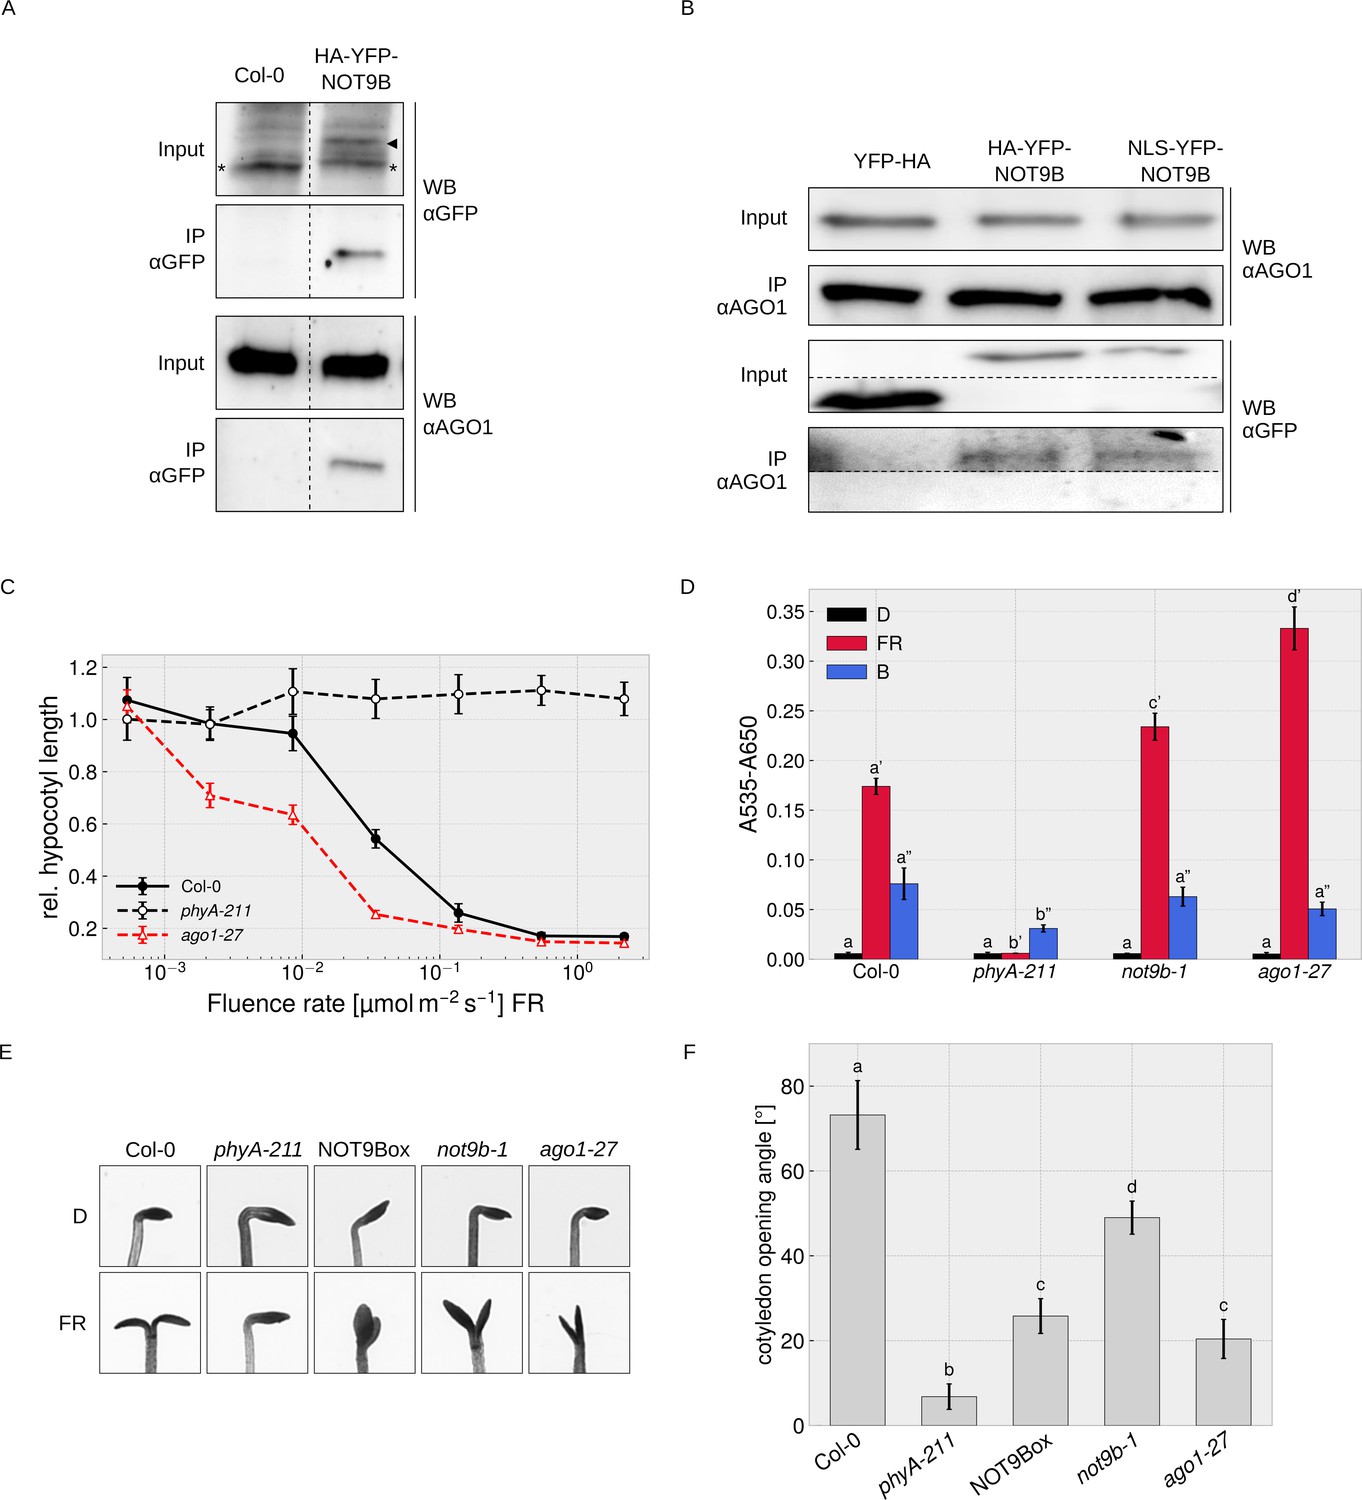
(A) CoIP from transgenic Arabidopsis lines. Total soluble protein was extracted from 4-day-old dark-grown wildtype (Col-0) and p35S:HA-YFP-NOT9B expressing seedlings (NOT9Box) and used for CoIP with αGFP magnetic beads. Input and eluate fractions were analysed by SDS-PAGE and immunoblotting with αGFP and αAGO1. *, unspecific band; ►, HA-YFP-NOT9B. (B) CoIP from Arabidopsis lines expressing constitutively nuclear localised NOT9B. Total soluble protein was extracted from 4-day-old dark-grown Arabidopsis seedlings expressing p35S:YFP-HA (YFP-HA), p35S:HA-YFP-NOT9B (NOT9Box), or p35S:NLS-YFP-NOT9B (NLS-YFP-NOT9B) and used for CoIP with αAGO1 bound to protein A-coated magnetic beads. Input and eluate fractions were analysed as in (A) using αAGO1 and αGFP antibodies. (C) Fluence rate response curve for inhibition of hypocotyl growth. Seedlings of the indicated genotypes were grown for 4 days in FR light. Mean hypocotyl length (± SE) of 20 seedlings relative to dark-grown seedlings is shown. Absolute hypocotyl length is shown in Figure 7—figure supplement 3. (D) Quantification of anthocyanin content. Seedlings of indicated genotypes were grown on ½ MS supplemented with 1.5% sucrose for 4 days in the dark (D), FR, or B light. Anthocyanin was extracted from 25 seedlings per genotype/condition and A535-A650 was measured. Bars represent biological triplicates (± SD). (D and F) Letters indicate levels of significance as determined by one-way ANOVA followed by post-hoc Tukeys HSD test; p<0.05. (E and F) Cotyledon opening in FR light. Seedlings of indicated genotypes were grown for 4 days in D followed by 24 hr in weak FR light (716 nm, 0.05 μmol m−2 s−1) or D. (F) Cotyledon opening of FR-treated seedlings was quantified by measuring the angle between the cotyledons of 20 seedlings per genotype. Bars show mean cotyledon opening of three biological replicates (± SD).
Figure 7—figure supplement 1
Investigation of the NOT9B interactome by AP-MS.
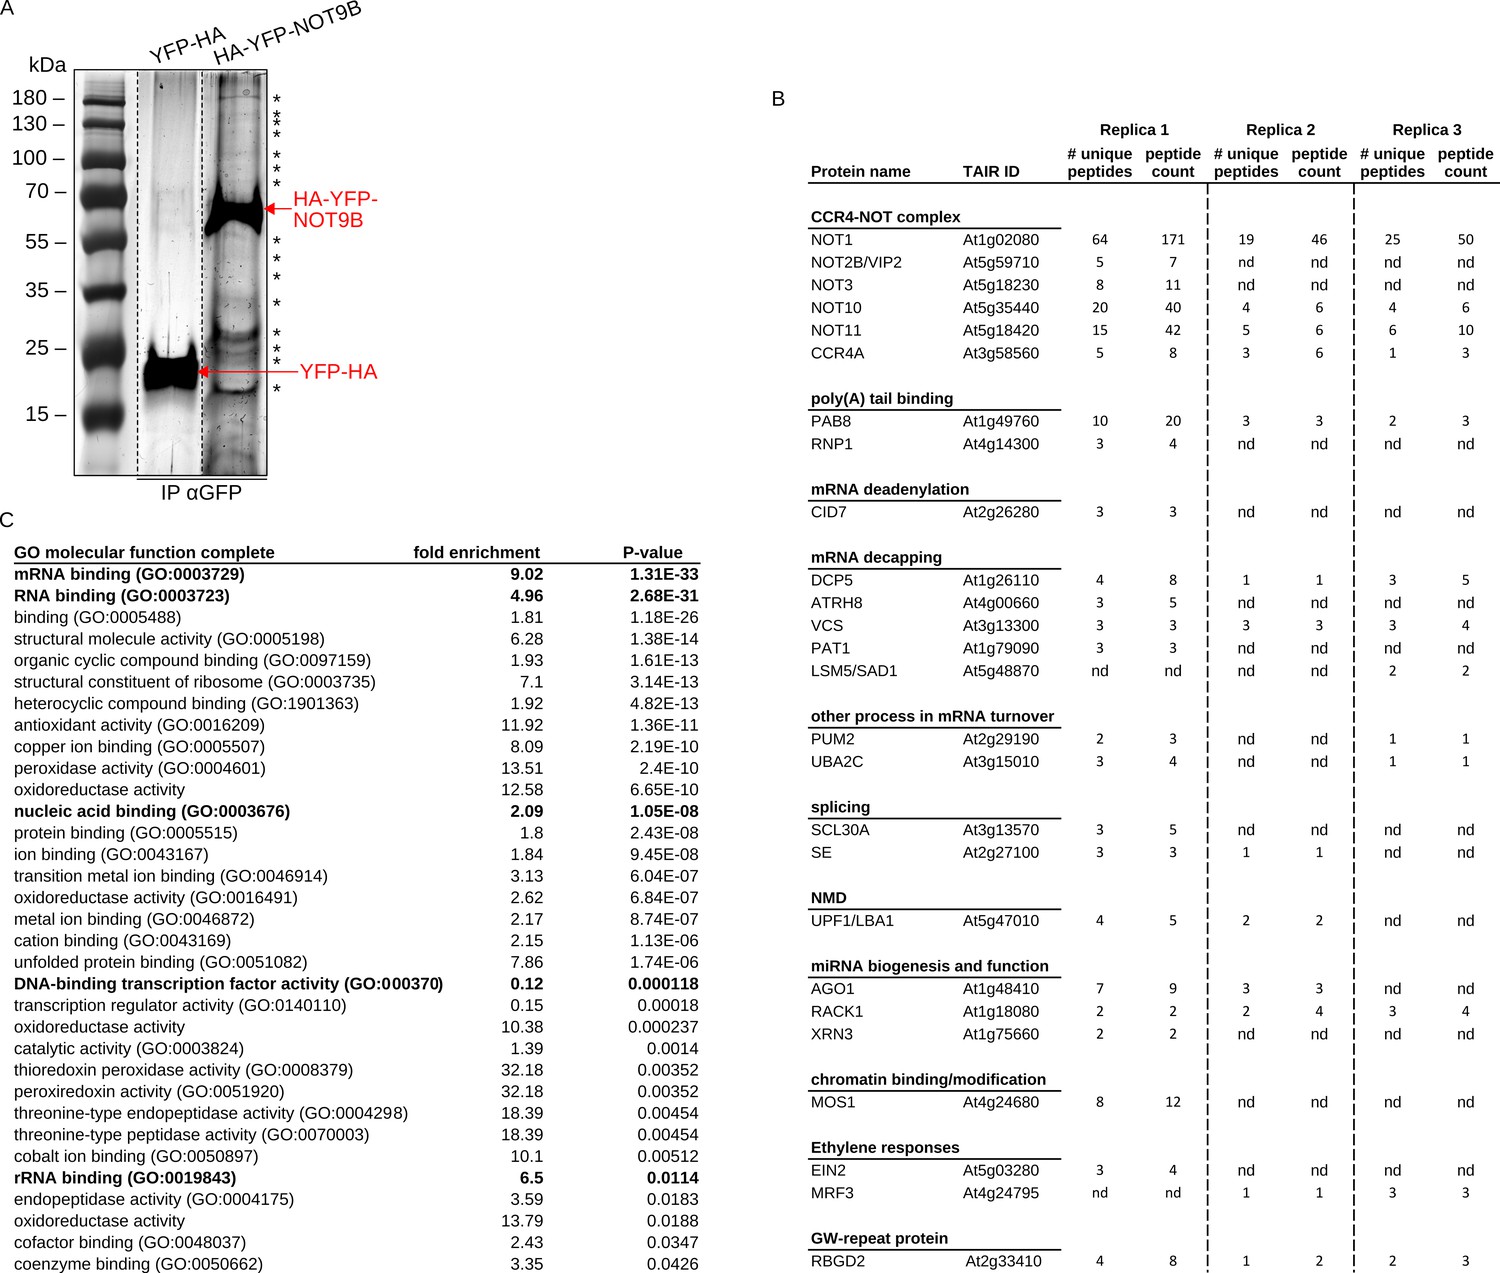
(A) Immunoprecipitation of NOT9B associated proteins. Arabidopsis seedlings expressing p35S:HA-YFP-NOT9B (NOT9Box, line 21c) or p35S:YFP-HA were grown for 4 days in the dark and exposed to FR light for 5 hr. Total soluble protein was extracted and IP was performed using αGFP coupled magnetic beads. Eluate fractions were analysed by SDS-PAGE followed by silver staining of the gel. Bands specifically detected in the HA-YFP-NOT9B eluate fraction are labelled (*) and position of HA-YFP-NOT9B and YFP-HA is indicated. (B) List of selected proteins associated with NOT9B. Eluate fractions as in (A) were analysed by LC-MS/MS. Selected hits of the MS/MS analysis identified exclusively in the HA-YFP-NOT9B eluate fractions are listed with their unique and total peptides counts. nd, not detected. (C) GO term analysis of proteins enriched in the HA-YFP-NOT9B eluate fraction.
Figure 7—figure supplement 2
Yeast-two-hybrid growth assay for NOT9B and AGO1.
AH109 cells were transformed with plasmids coding for indicated AD and BD fusion proteins and grown on CSM LTH- plates supplemented with 1 mM 3-AT to test for interaction. Growth on CSM LT- plates was used as transformation control.
Figure 7—figure supplement 3
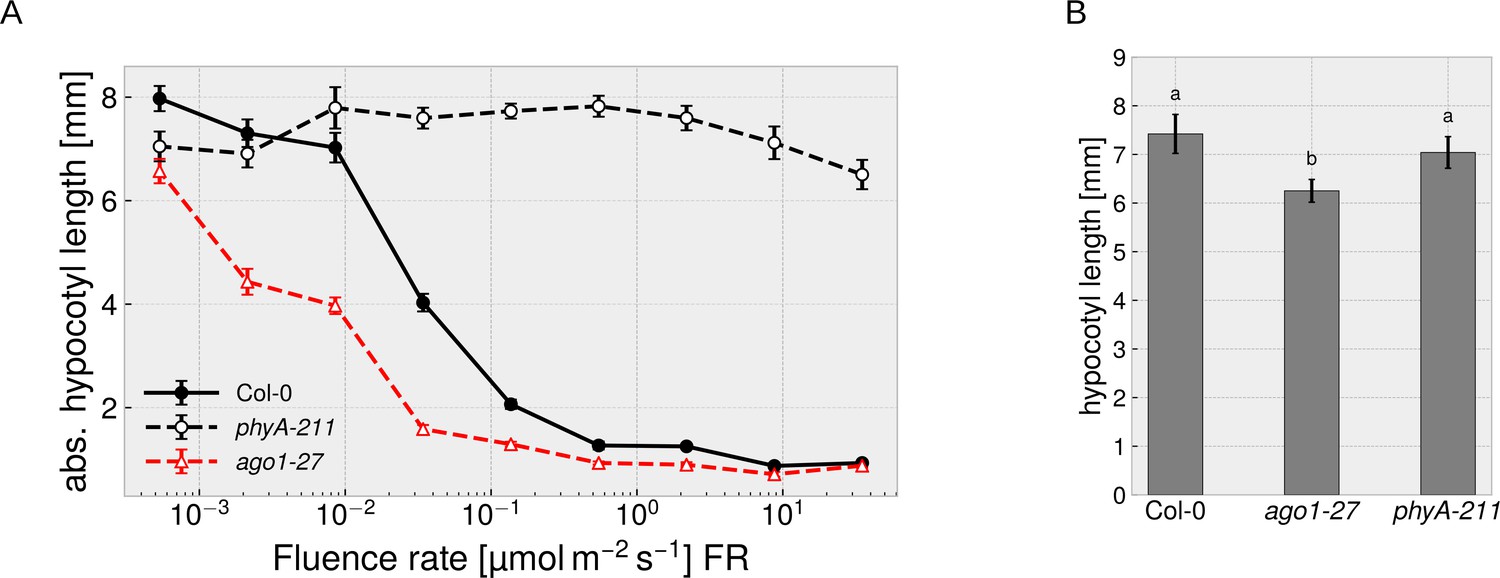
Absolute hypocotyl length of ago1-27 seedlings.
(A) Absolute hypocotyl length of ago1-27 seedlings in FR light. Seedlings of the indicated genotypes were grown for 4 days at different fluence rates of FR light or in the dark. Mean hypocotyl length (± SE) of 20 seedlings is shown. Relative hypocotyl length is shown in Figure 7C. (B) Hypocotyl length of 4-day-old dark-grown wildtype (Col-0), ago1-27, and phyA-211 seedlings. Letters indicate levels of significance as determined by one-way ANOVA followed by post-hoc Tukeys HSD test; p<0.05.
Figure 8
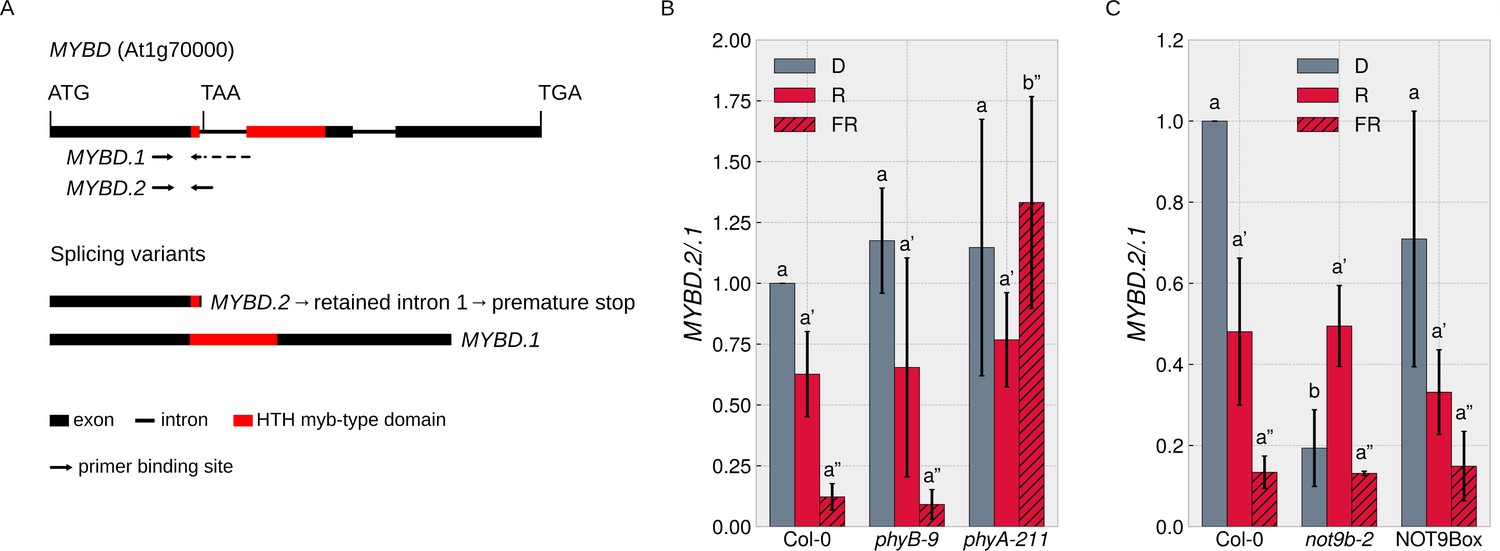
NOT9B affects alternative splicing of MYBD.
(A) Schematic overview of MYBD genomic locus and MYBD transcripts. Alternative splicing of MYBD results in two transcripts, MYBD.1 and MYBD.2. Binding sites of splicing variant specific primers used in (B and C) are indicated. (B and C) Analysis of MYBD splicing pattern. Six-day-old dark-grown seedlings of indicated genotypes were exposed to R or FR light for 6 hr or kept in the dark. Total RNA was extracted and transcribed into cDNA. Splice site specific primers and qPCR were used to quantify the ratio between the two splice variants (MYBD.2/MYBD.1). Bars show mean MYBD.2/MYBD.1 ratio of three biological replicates (± SD). Letters indicate levels of significance as determined by one-way ANOVA followed by post-hoc Tukeys HSD test; p<0.05.
Figure 9 with 1 supplement
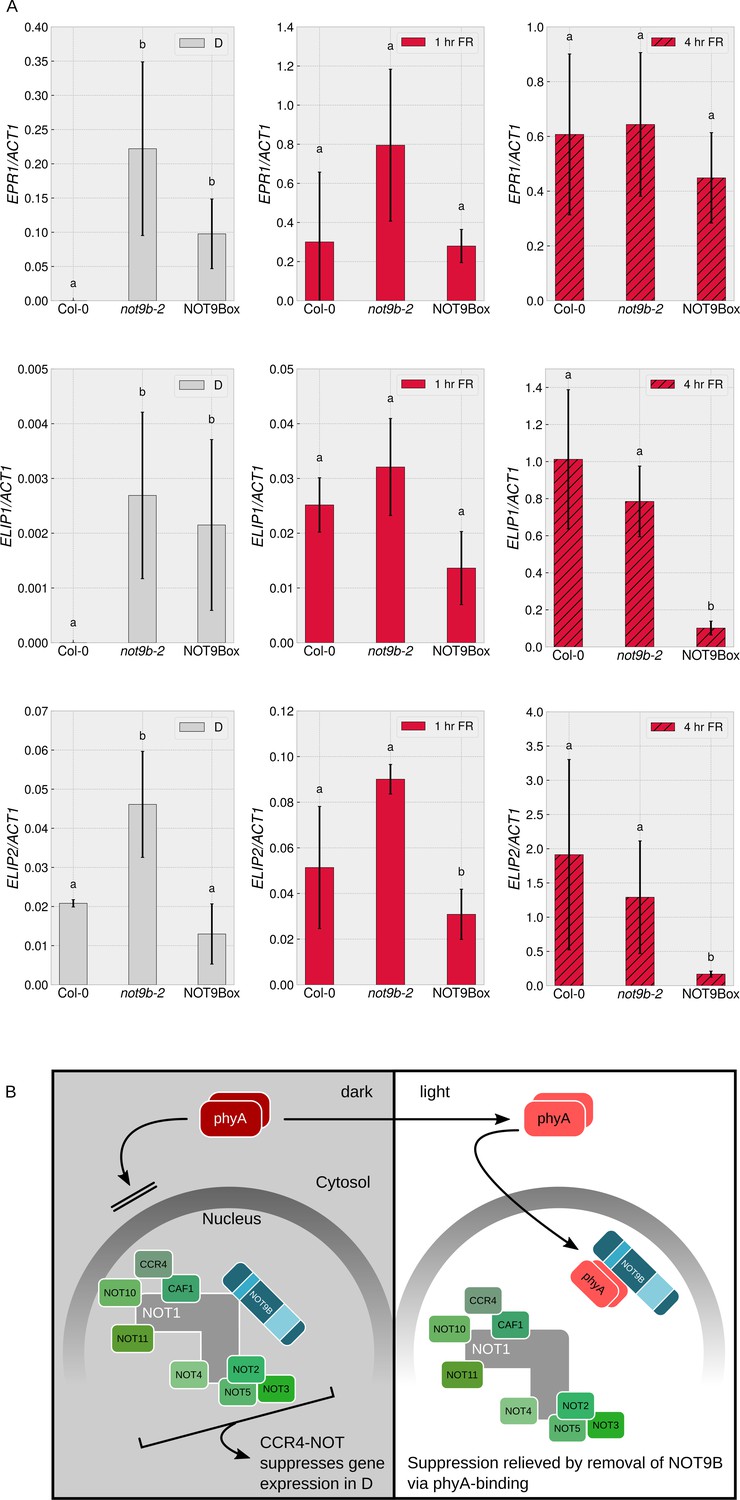
NOT9B suppresses gene expression in darkness.
(A) Quantification of EPR1, ELIP1, and ELIP2 transcript levels in wildtype (Col-0), not9b-2, and NOT9Box seedlings. Four-day-old dark-grown seedlings were exposed to FR light for 1 or 4 hr or kept in the dark. Total RNA was extracted and EPR1, ELIP1, ELIP2, and ACT1 transcript levels were quantified by qRT-PCR. Bars represent biological triplicates (± SD). Letters indicate levels of significance as determined by one-way ANOVA followed by post-hoc Tukeys HSD test; p<0.05. (B) Hypothetical working model for modulation of phyA-mediated light signalling by nuclear NOT9B. The CCR4-NOTNOT9B complex suppresses gene expression in the dark. Light-induced activation and translocation into the nucleus allow phyA to bind NOT9B and displace it from CCR4-NOTNOT9B, thereby promoting expression of light-regulated genes.
Figure 9—figure supplement 1
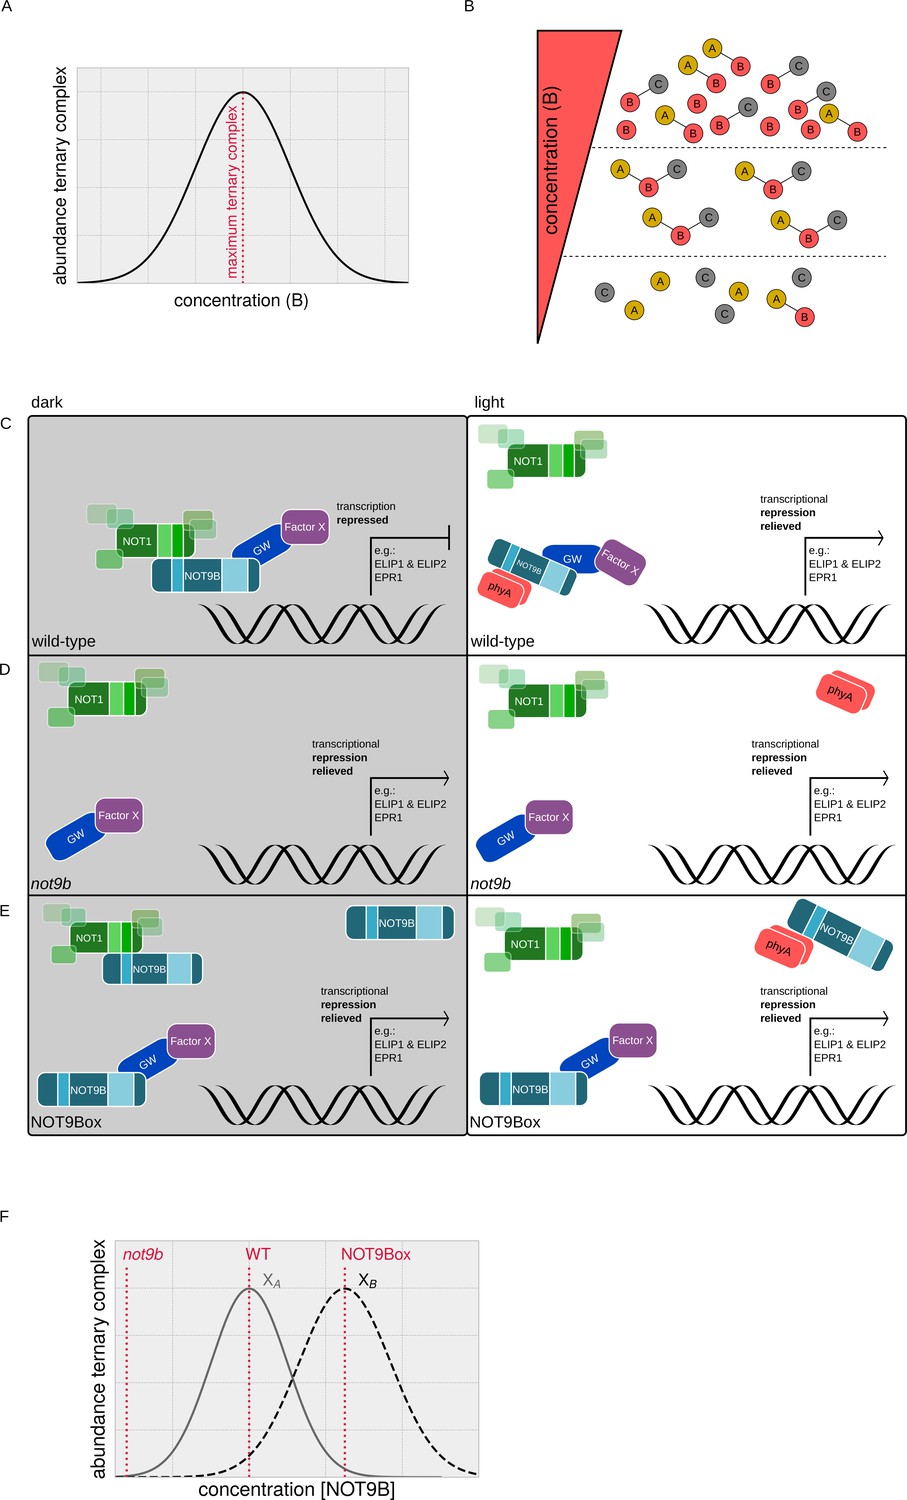
Hypothetical model of NOT9B in a ternary complex.
(A and B) Abundance of ternary complexes. (A) Abundance of a ternary complex A-B-C (y-axis) is highest, if the bridge protein B is present at intermediate concentration (x-axis) (Douglass et al., 2013). (B) If the concentration of the bridge protein B exceeds the optimal concentration, the amount of A-B-C ternary complexes will decrease, while the concentration of A-B and B-C dimeric complexes will increase. (C) In the CCR4-NOTNOT9B complex, NOT9B could play a role as bridge protein and allow other proteins (e.g. GW-repeat containing proteins) or protein complexes (e.g. GW-repeat protein bound to Factor X) to associate with CCR4-NOTNOT9B through the NOT9B GWB site or other binding sites in NOT9B. In our model, such ternary complexes consisting of CCR4-NOT, NOT9B, and proteins or protein complexes bound to NOT9B repress gene expression in dark-grown wildtype seedlings. Light-activated phyA translocates into the nucleus, binds NOT9B, and thereby displaces NOT9B from CCR4-NOTNOT9B, resulting in derepression of gene expression. (D) In the not9b mutant, NOT9B would be missing as bridge protein. The lack of functional ternary complexes would lead to partial derepression of light signalling in dark-grown seedlings. (E) In NOT9Box seedlings, NOT9B protein levels might exceed the optimal concentration of the bridge protein, resulting in high levels of non-functional CCR4-NOTNOT9B and NOT9B-protein X dimeric complexes, but reduced levels of the functional CCR4-NOTNOT9B-protein X ternary complex. (F) Formation of ternary complexes with different protein Xs. In the hypothetical setting shown in panel (F), proteins XA and XB are present at different concentrations and/or have different affinity for NOT9B. As a consequence, the levels of NOT9B (x-axis) at which the concentrations of NOT1-NOT9B-protein XA (XA, grey solid line) and NOT1-NOT9B-protein XB (XB, black dashed line) ternary complexes (y-axis) are highest is different. If we assume that only ternary complexes are physiologically active, responses depending on ternary complexes containing protein XA will be highest in the WT, while they are reduced in both the not9b mutant and the NOT9Box line. In contrast, responses that require ternary complexes containing protein XB are lower in the not9b mutant compared to the WT, but enhanced in the NOT9Box line.
Figure 10
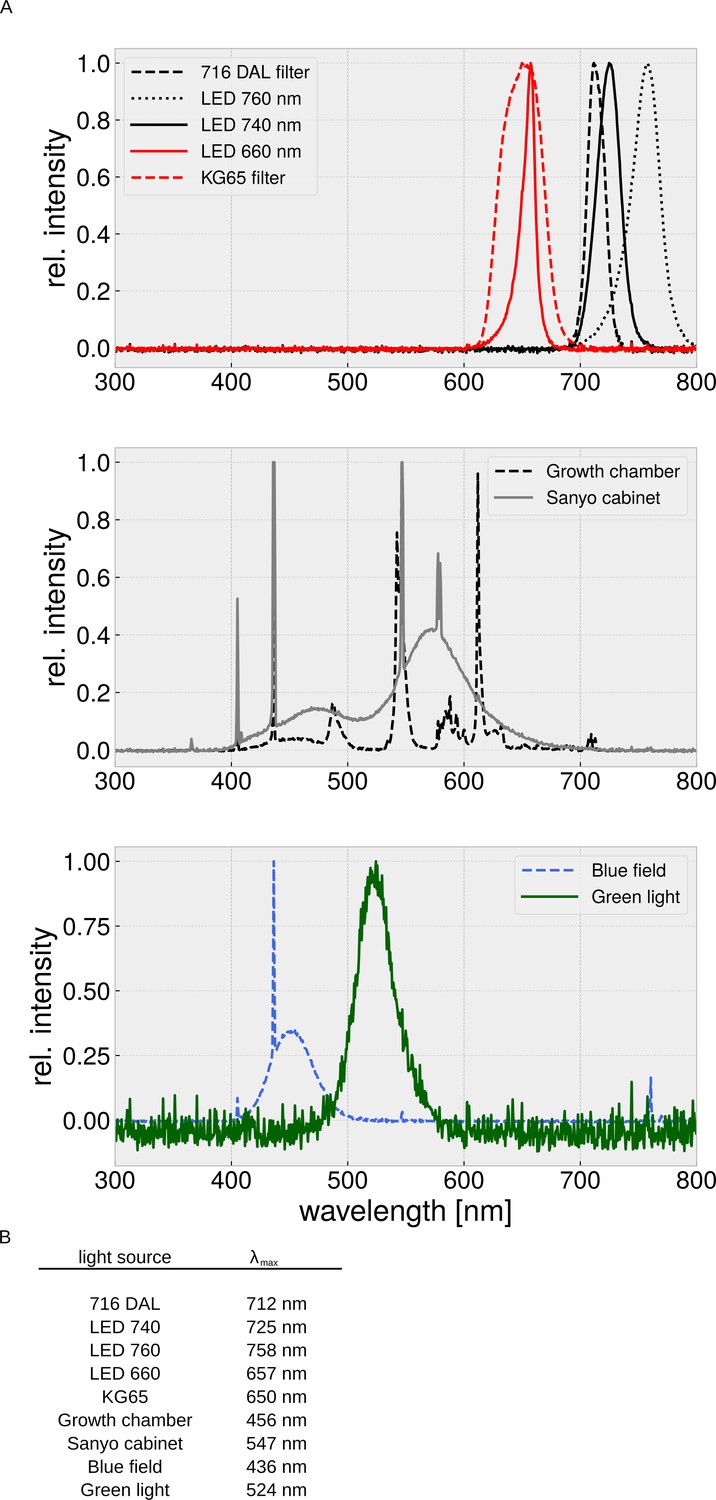
Emission spectra of light sources.
(A) Spectra of light sources used in this study were characterised using a photospectrometer. Emission in the wavelength range from 300 to 800 nm was normalised to emission at λmax. (B) λmax for light sources used in this study.
Tables
Key resources table
| Reagent type (species) or resource | Designation | Source or reference | Identifiers | Additional information |
|---|---|---|---|---|
| Gene (Arabidopsis thaliana) | NOT9B | https://www.arabidopsis.org/ | AT5G12980 | n/a |
| Gene (Arabidopsis thaliana) | PHYA | https://www.arabidopsis.org/ | AT1G09570 | n/a |
| Gene (Arabidopsis thaliana) | NOT1 | https://www.arabidopsis.org/ | AT1G02080 | n/a |
| Gene (Arabidopsis thaliana) | AGO1 | https://www.arabidopsis.org/ | AT1G48410 | n/a |
| Cell line (H. sapiens) | HEK293T | https://www.atcc.org/ | 293T (ATCC CRL-3216) | Cell line maintained by Core Facility Signalling Factory, University of Freiburg, |
| Genetic reagent (Arabidopsis thaliana) | not9b-1 | https://www.arabidopsis.org/, Sessions et al., 2002 | SAIL_584_D02/NASC N824896 | |
| Genetic reagent (Arabidopsis thaliana) | not9b-2 | https://www.arabidopsis.org/, Alonso, 2003 | SALKseq_39334/NASC N925357 | |
| Genetic reagent (Arabidopsis thaliana) | ago1-27 | https://www.arabidopsis.org/, Morel et al., 2002 | n/a | |
| Genetic reagent (Arabidopsis thaliana) | 35S:HA-YFP-NOT9B | this paper | ATPS06 | n/a |
| Antibody | αPHYA (rabbit polyclonal) | Agrisera, Vännäs, Sweden | AS07 220 | WB (1:1,500) |
| Antibody | αAGO1 (rabbit polyclonal) | Agrisera, Vännäs, Sweden | AS09 527 | WB (1:2,000) |
| Recombinant DNA reagent | 35S:HA-YFP-NOT9B | this paper | DS361 | n/a |
| Commercial assay or kit | Anti-GFP MicroBeads | Miltenyi | 130-091-125 | n/a |
| Chemical compound, drug | Phycocyano-billin (PCB) | Frontier Scientific, Logan, Utah | FSIP14137 | n/a |
Additional files
-
Supplementary file 1
This file contains the complete list of proteins identified in the AP-MS experiment described in Figure 7—figure supplement 1.
Protein hits with at least two unique peptide matches in any of the samples were included in this list.
- https://cdn.elifesciences.org/articles/63697/elife-63697-supp1-v1.csv
-
Supplementary file 2
This file contains detailed information on plasmids used in this study, including the cloning procedure and sequences of primers and gBlock fragments used for cloning.
This file also contains detailed information on mutants and transgenic lines used in this study, including the generation of transgenic lines and genotyping of mutants.
- https://cdn.elifesciences.org/articles/63697/elife-63697-supp2-v1.odt
-
Supplementary file 3
This file contains detailed information on primers and probes used for qPCR analyses as well as on antibodies used for immunblotting and/or CoIPs.
- https://cdn.elifesciences.org/articles/63697/elife-63697-supp3-v1.odt
-
Transparent reporting form
- https://cdn.elifesciences.org/articles/63697/elife-63697-transrepform-v1.pdf
Download links
A two-part list of links to download the article, or parts of the article, in various formats.
Downloads (link to download the article as PDF)
Open citations (links to open the citations from this article in various online reference manager services)
Cite this article (links to download the citations from this article in formats compatible with various reference manager tools)
Uncovering a novel function of the CCR4-NOT complex in phytochrome A-mediated light signalling in plants
eLife 10:e63697.
https://doi.org/10.7554/eLife.63697


