Determining the probability of hemiplasy in the presence of incomplete lineage sorting and introgression
- Department of Biology, Indiana University, United States
- Department of Computer Science, Indiana University, United States
Figures
Figure 1 with 2 supplements
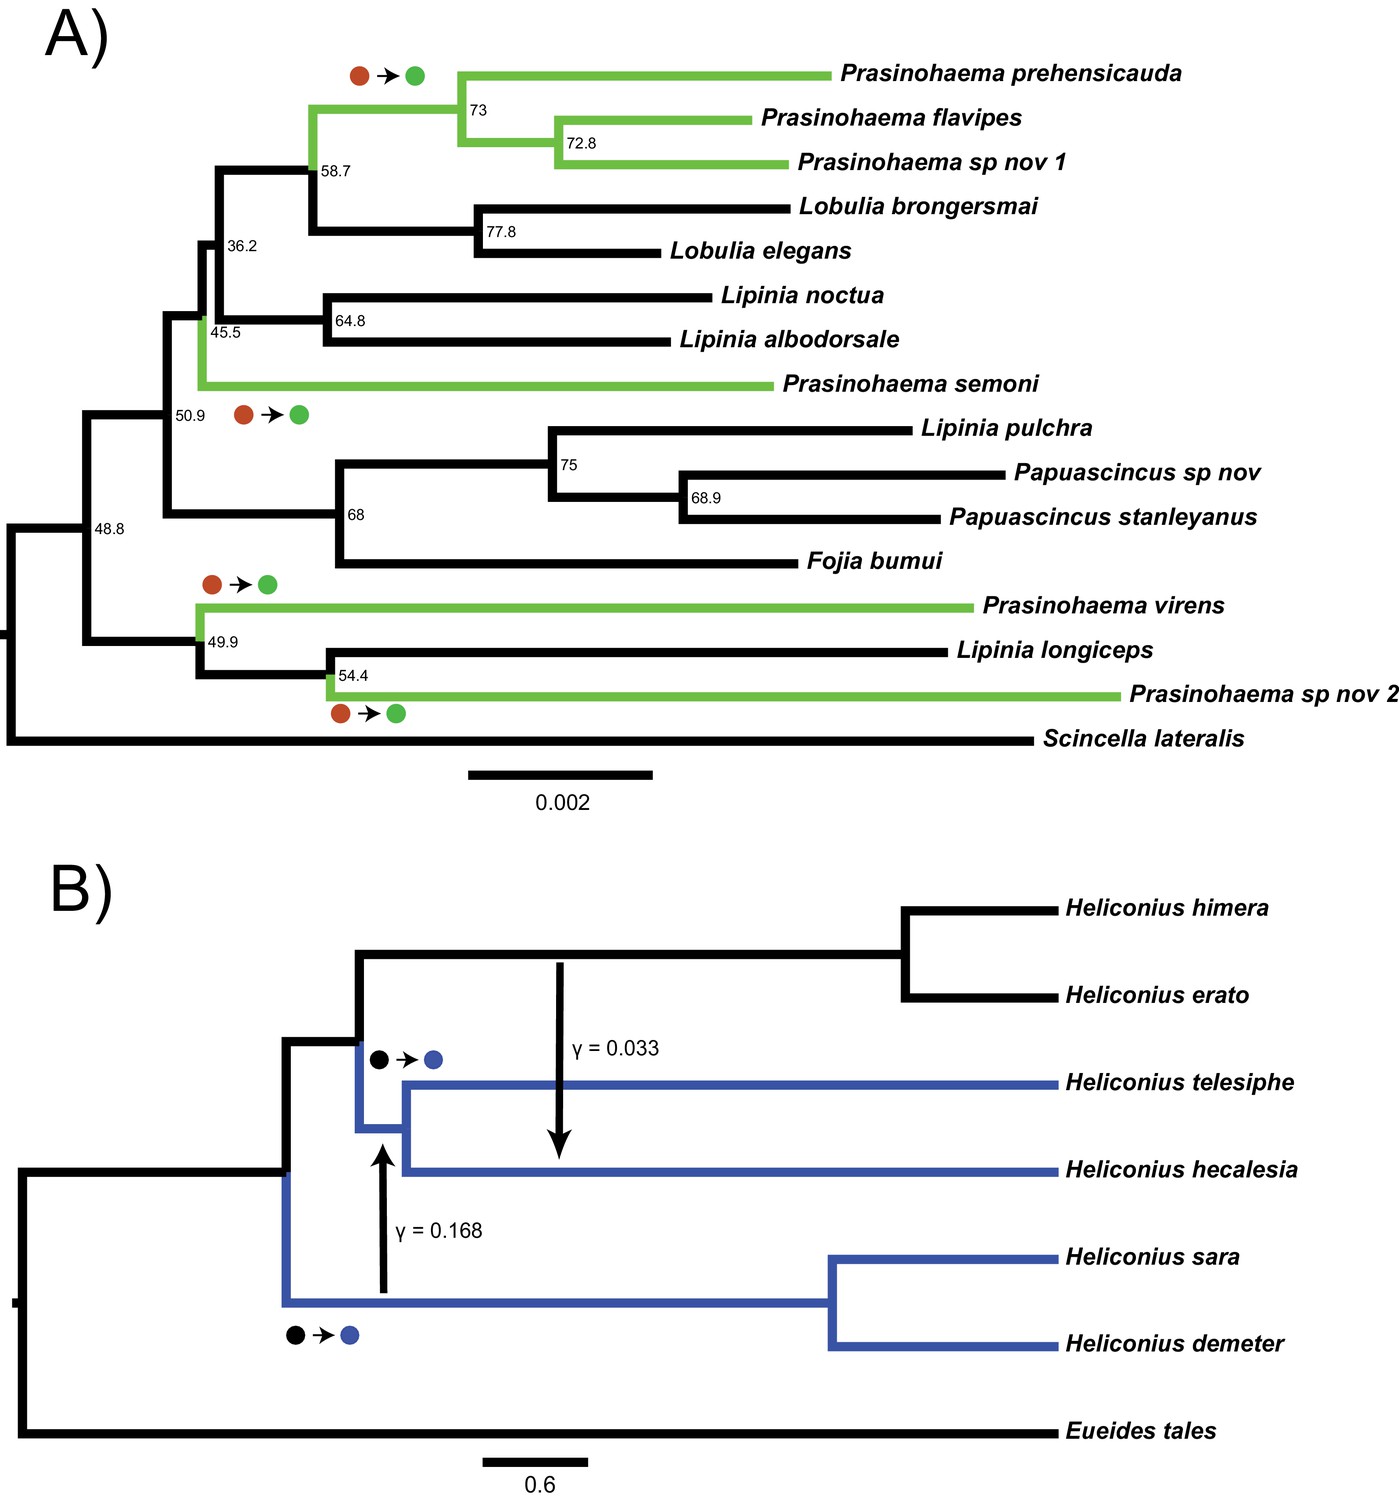
Two empirical examples of apparent convergence in character states that could potentially be explained by hemiplasy.
(A) Maximum-likelihood species tree of the clade including green-blooded lizards and an outgroup, constructed from the concatenation of 3220 ultra-conserved elements (data from Rodriguez et al., 2018). Branch lengths in substitutions per site; nodes labeled with site concordance factors. (B) Coalescent network of Heliconius erato/sara clade, processed from the network constructed for the clade in Edelman et al., 2019. Branch lengths in units of 2N generations; rate, direction, and approximate timing of introgression events indicated by vertical arrows. In both trees, taxa with derived characters are colored, and the most parsimonious transitions from ancestral to derived states are labeled with circles.
-
Figure 1—source data 1
Input file given to HeIST for the lizard analysis, using the tree and character states shown in Figure 1A.
- https://cdn.elifesciences.org/articles/63753/elife-63753-fig1-data1-v2.zip
-
Figure 1—source data 2
Input file given to HeIST for the butterfly analysis, using the tree, character states, and introgression events shown in Figure 1B.
- https://cdn.elifesciences.org/articles/63753/elife-63753-fig1-data2-v2.zip
Figure 1—figure supplement 1
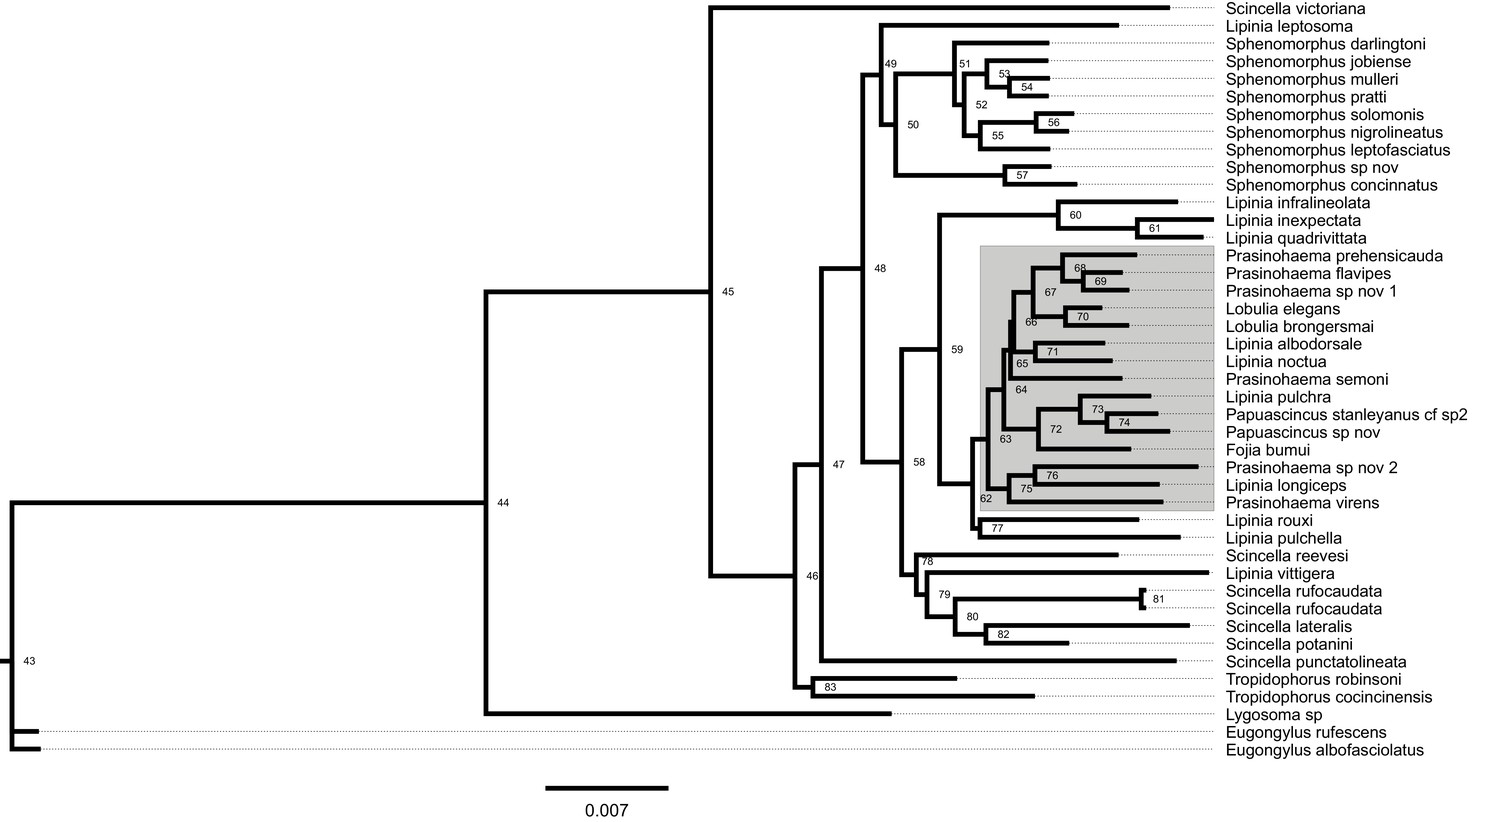
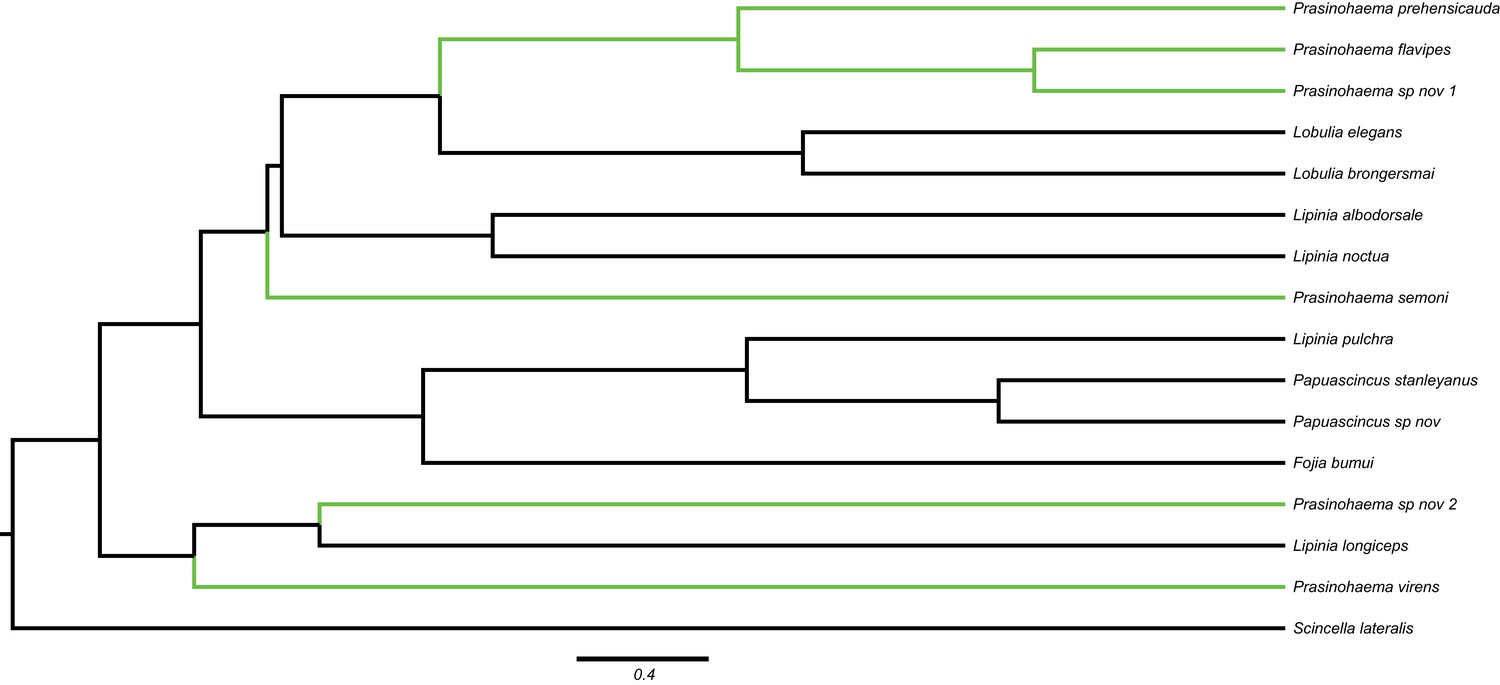
Full 43-species maximum-likelihood lizard phylogeny constructed by RAxML, with branch lengths in units of substitutions per site.
The 15-species subclade containing green-blooded species is highlighted in gray. Node labels correspond to the IDs in Supplementary file 1-Table 1 (below). This tree, and its associated site concordance factors in Supplementary file 1-Table 1, were used to obtain the linear formula for unit conversion in the regression module of HeIST.
Figure 1—figure supplement 2
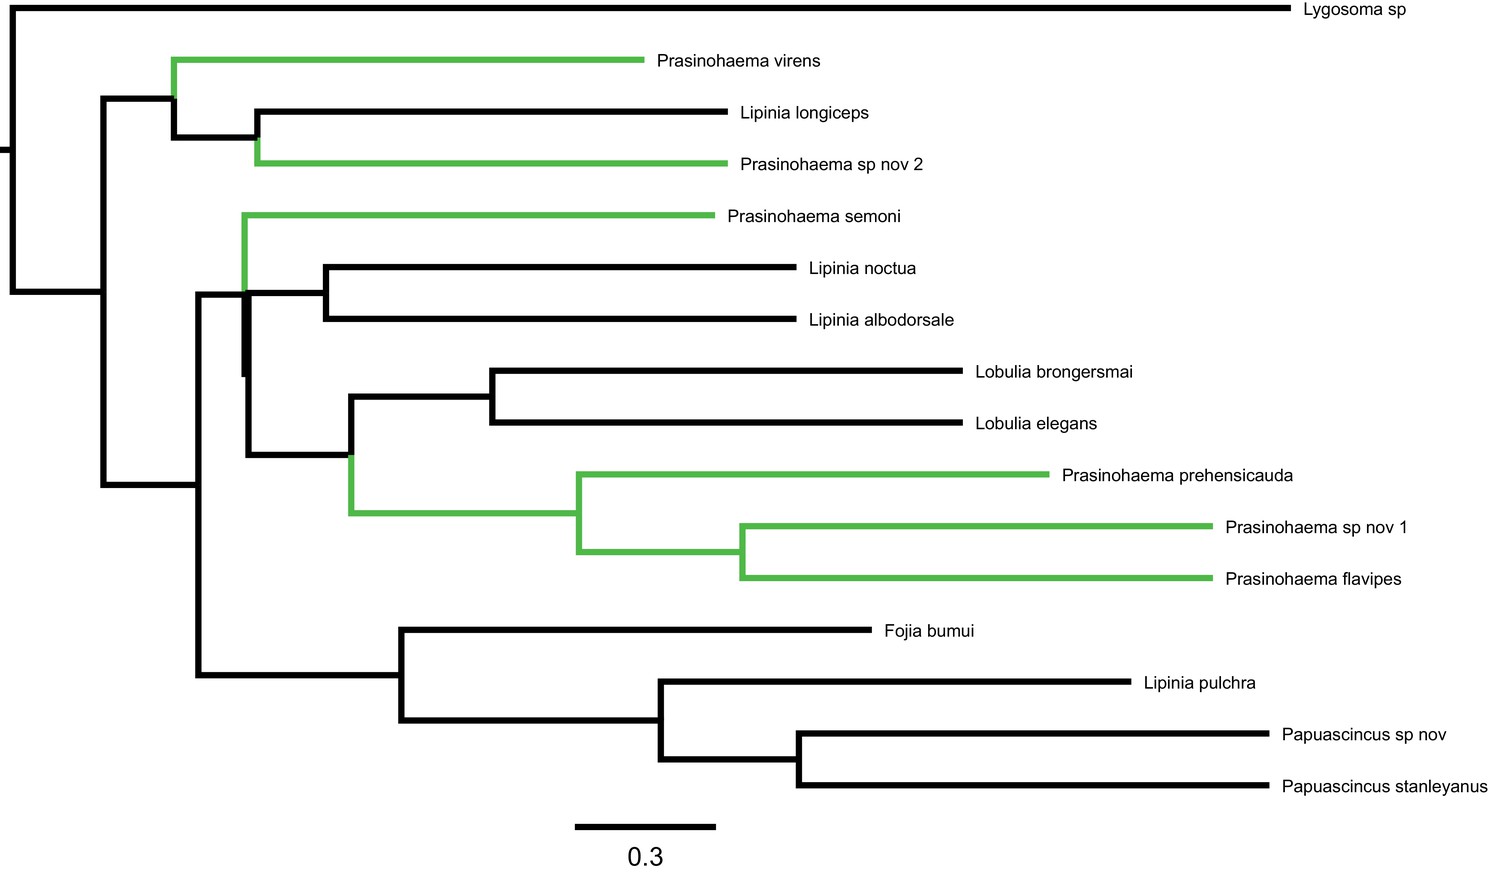
Phylogeny of green-blooded lizards and an outgroup inferred from 3220 UCE gene trees using ASTRAL (data from Rodriguez et al., 2018).
Internal branch lengths are shown in coalescent units of 2N generations, with arbitrary tip lengths of 1 coalescent unit. Taxa with green blood are labeled in green.
Figure 2 with 1 supplement
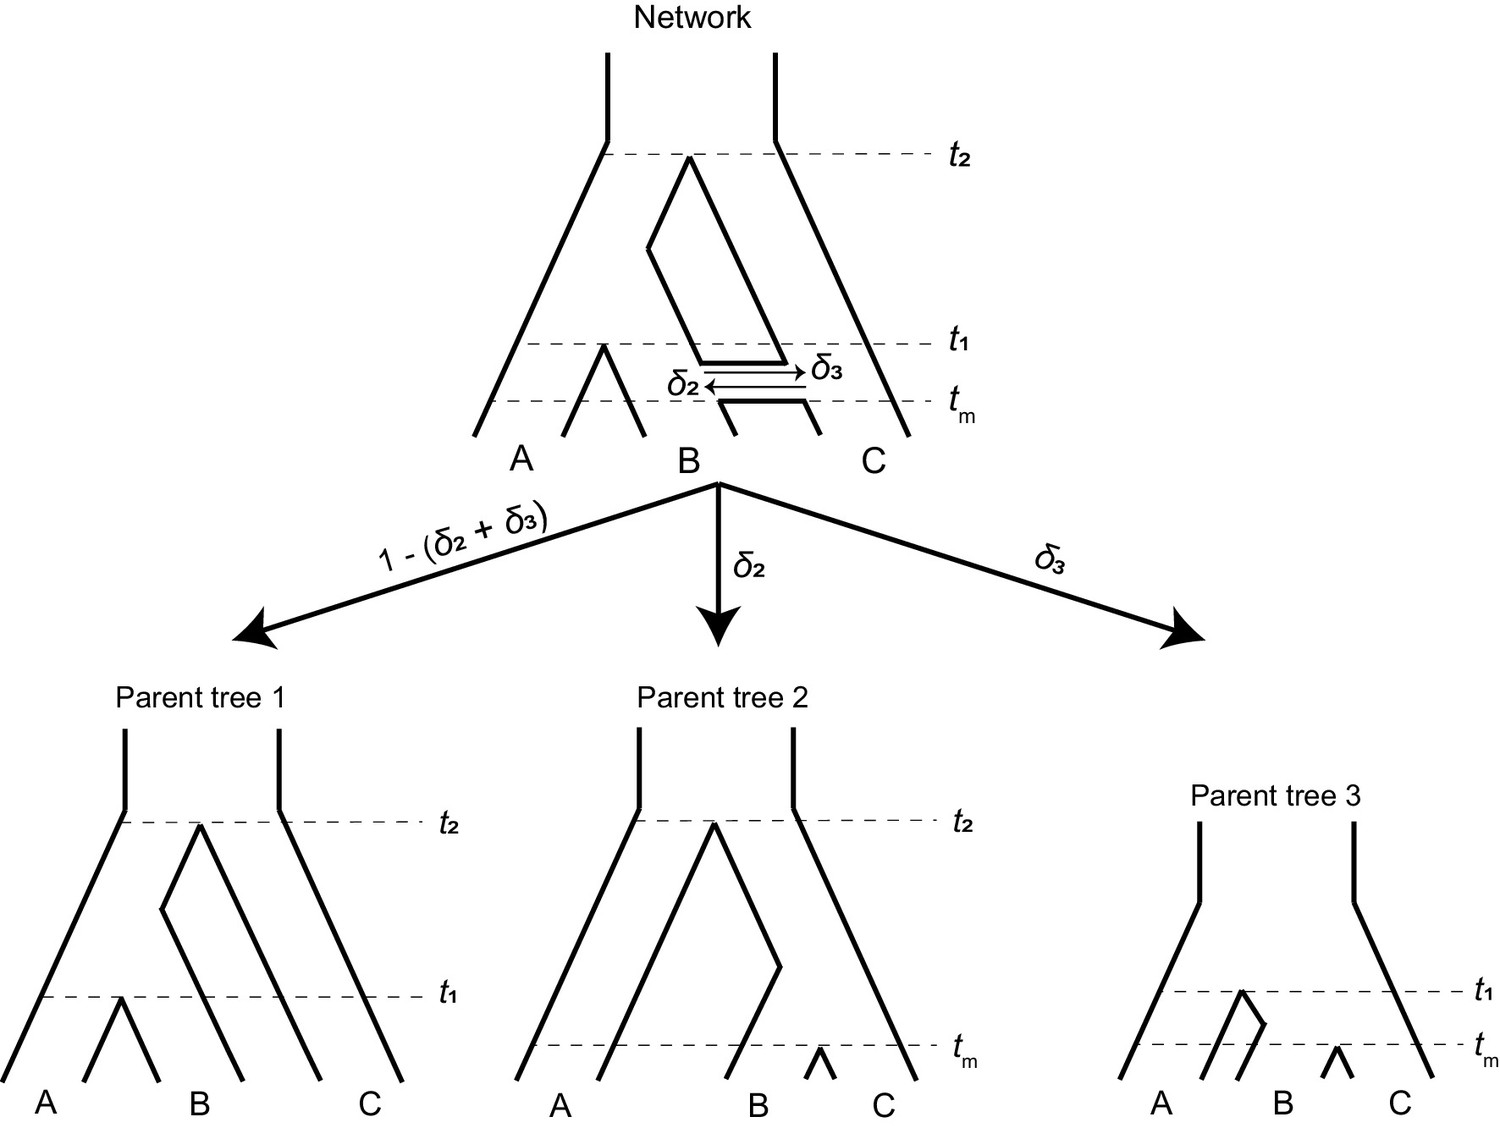
A phylogenetic network (top) can be split into a set of parent trees (bottom) representing the possible histories at individual loci.
The probability that a locus is described by a particular parent tree depends on the probability of introgression (arrow labels). The horizontal ‘tube’ shown in the phylogenetic network does not depict introgression over a continuous time interval, but rather shows the timing of introgression (tm) in an instantaneous pulse, while allowing for coalescence to be visualized for loci that follow a history of introgression.
Figure 2—figure supplement 1
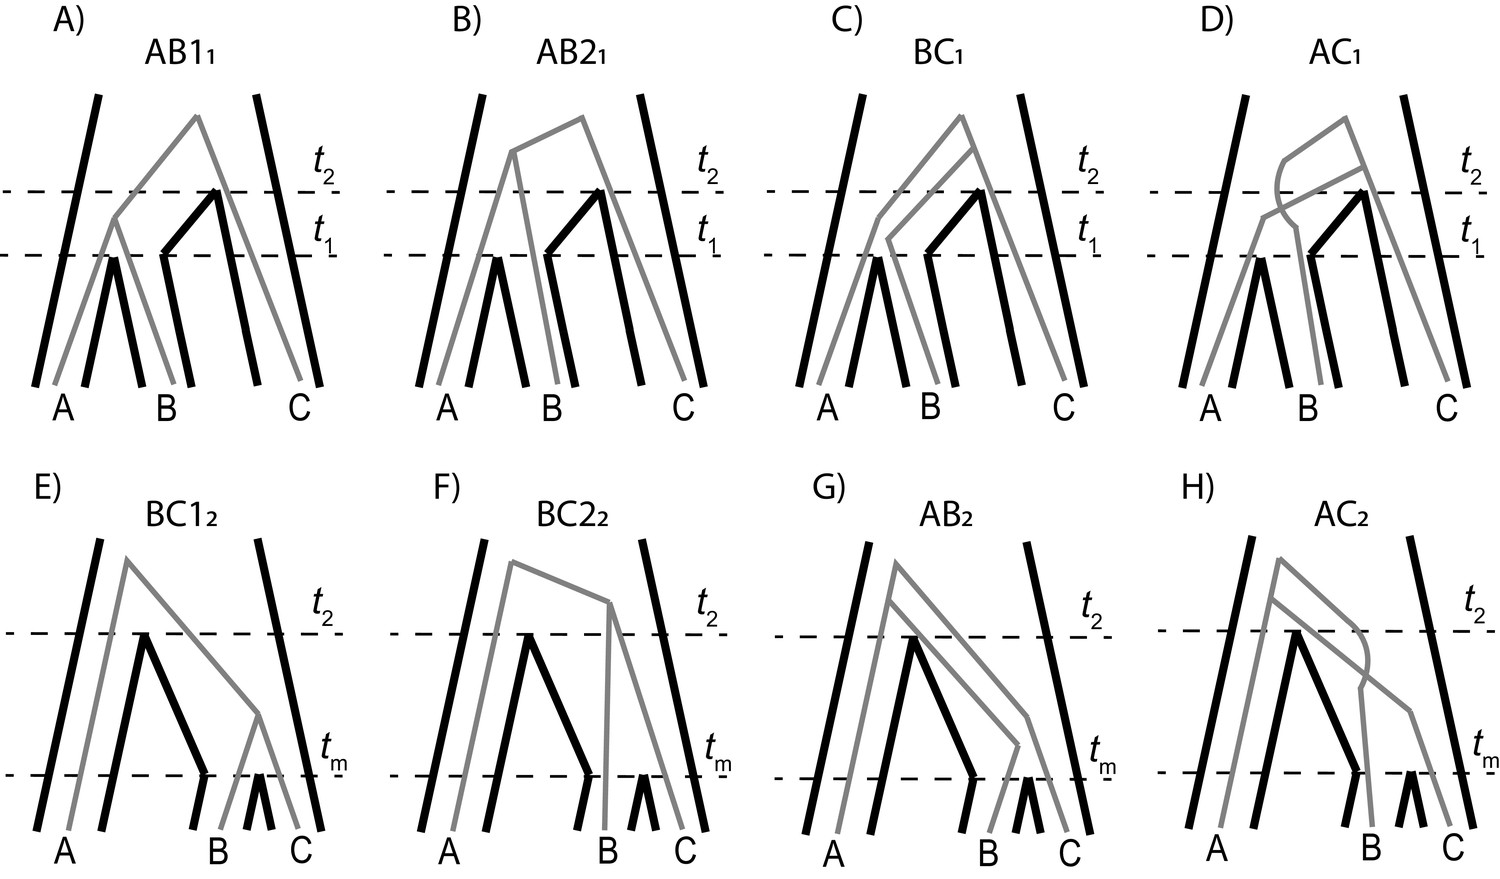
Each parent tree in our model generates four gene trees: one generated from lineage sorting (Panels A and E), and three equally likely trees generated from incomplete lineage sorting (panels B-D, F–H).
Top row shows the trees generated from parent tree 1; the bottom row shows the trees for parent tree 2.
Figure 3
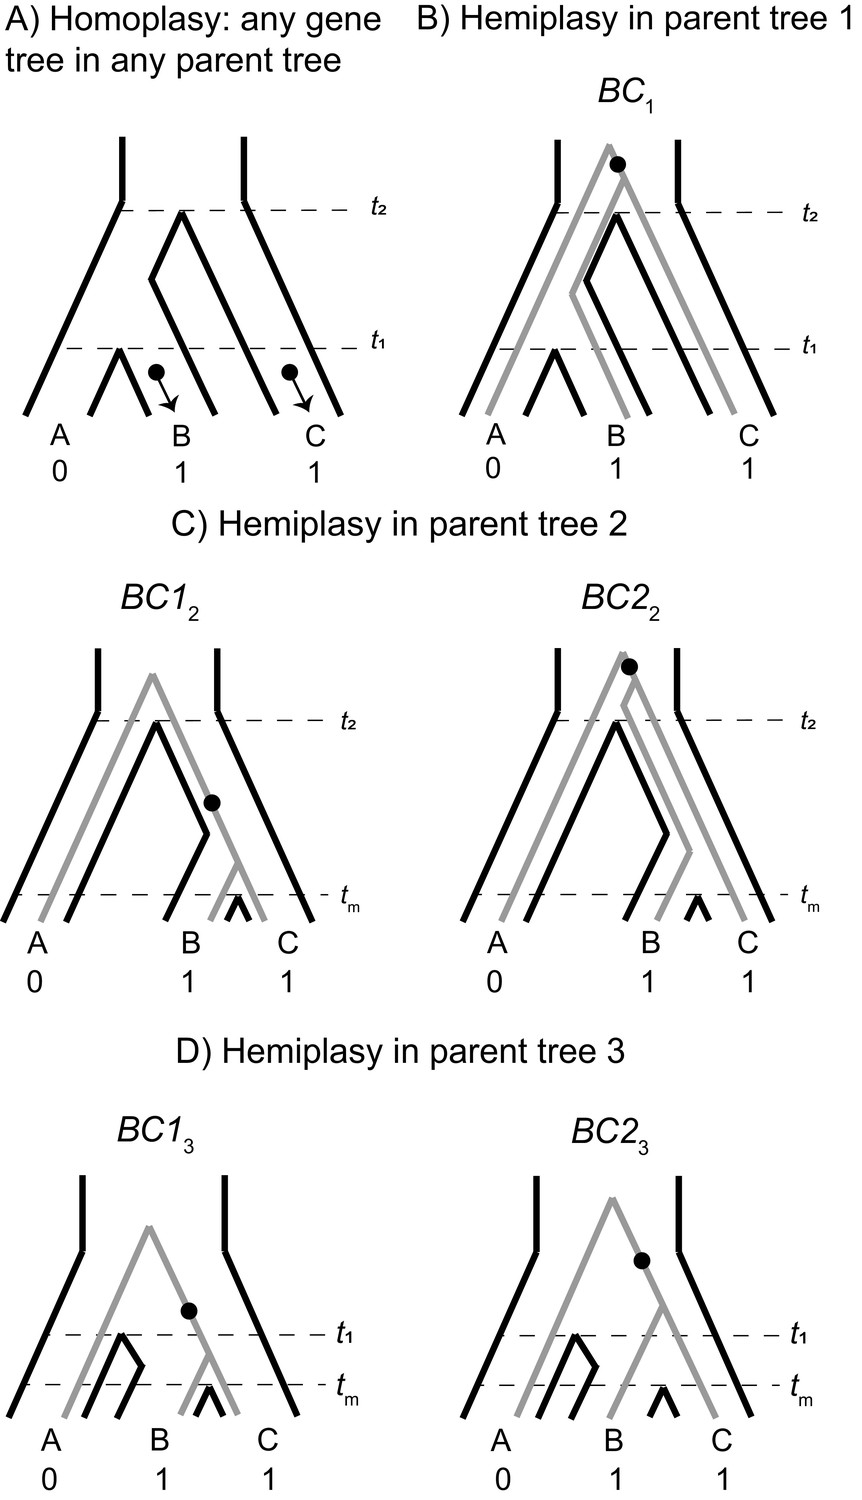
The possible paths to homoplasy and hemiplasy under the multispecies network coalescent.
Homoplasy can happen on any gene tree, as long as there are two independent mutations on tip branches (panel A). Homoplasy can also happen via a mutation in the ancestor of all three species, followed by a reversal (not shown). All cases of hemiplasy require a transition on the internal branch of a gene tree with the topology ((B,C),A). In parent tree 1 (panel B), only one such possible gene tree exists (shown in gray; BC1). In both parent trees 2 and 3 (panels C and D respectively), there are two possible gene trees with this topology. These gene trees differ in internal branch lengths, depending on the parent tree of origin and whether the tree is the result of lineage sorting (BC12 and BC13) or incomplete lineage sorting (BC22 and BC23) within introgressed histories.
Figure 4
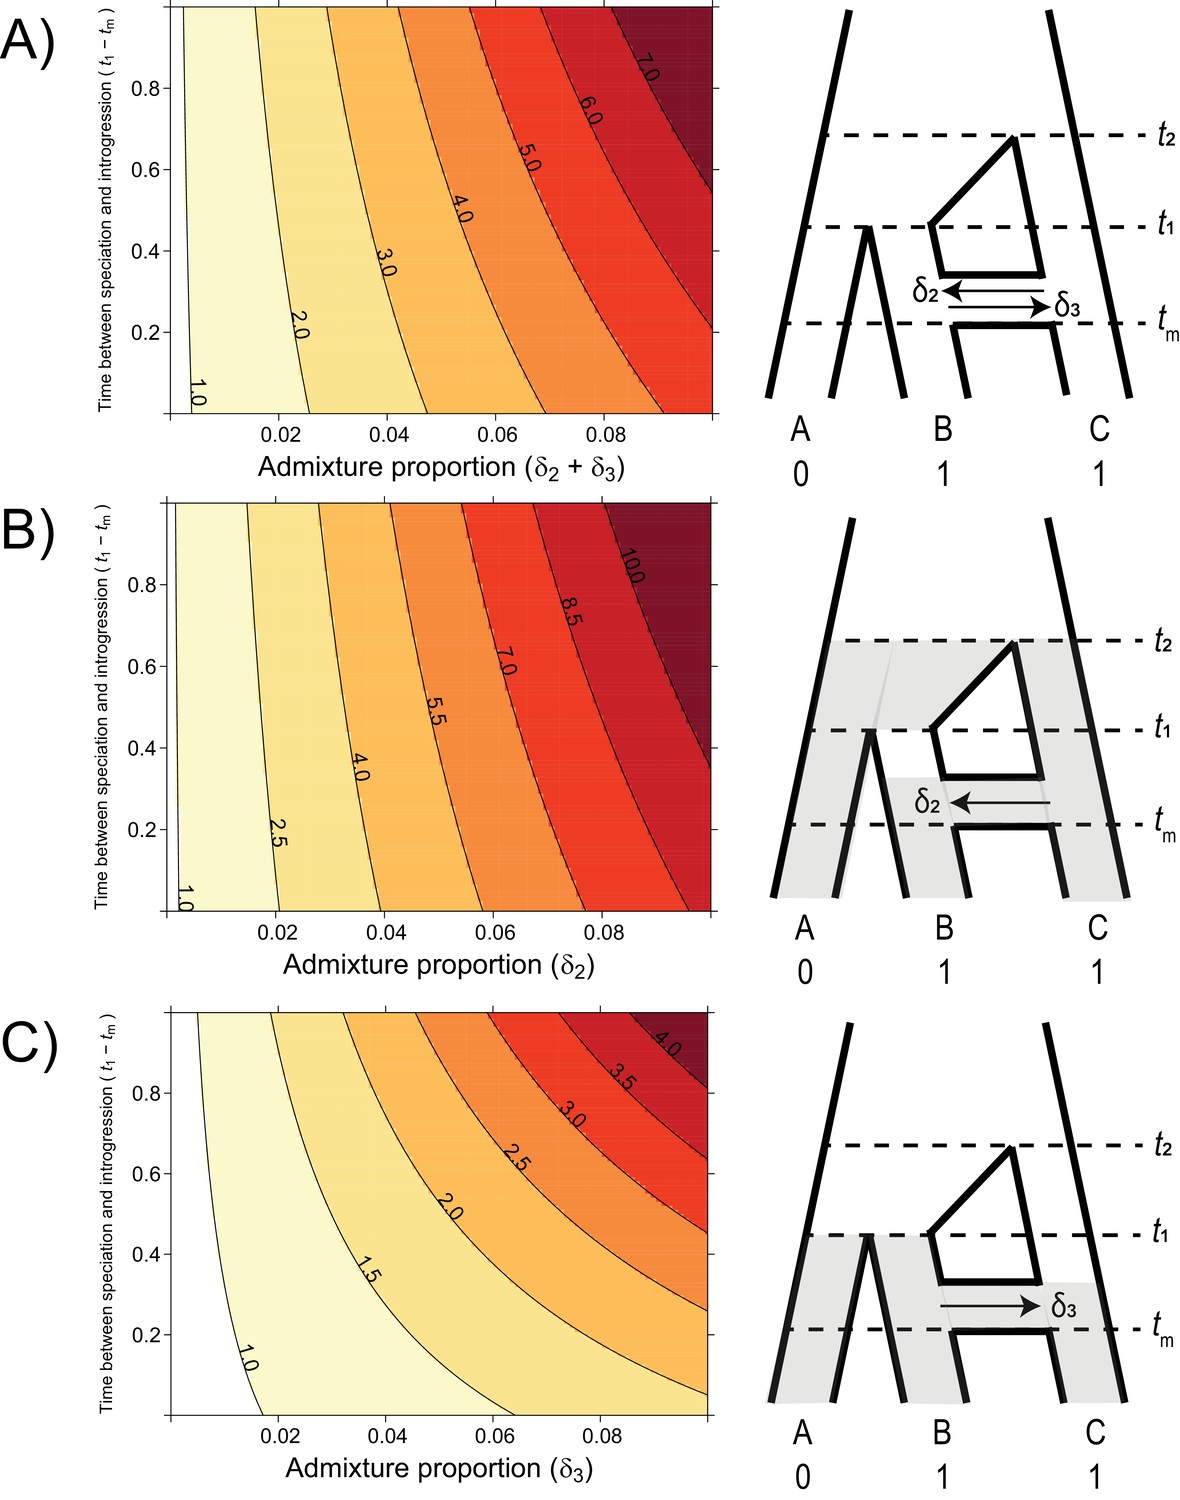
The probability of hemiplasy relative to homoplasy (contours) as a function of the admixture proportion (x-axis), the time between speciation and introgression (y-axis), and the direction of introgression (panels).
The contours delineate the factor difference between hemiplasy and homoplasy; for instance, a contour value of 2.0 means hemiplasy is twice as probable as homoplasy in that area of parameter space. At x = 0 in each panel, Pe/Po = 0.818. (A) Equal rates of introgression in both directions. (B) Introgression in only the C → B direction. (C) Introgression in only the B → C direction.
-
Figure 4—source data 1
Data used to generate the contour plots in Figure 4.
The value of Pe/Po is reported for each parameter combination. Data for each panel is in separate tabs.
- https://cdn.elifesciences.org/articles/63753/elife-63753-fig4-data1-v2.xlsx
Figure 5 with 6 supplements
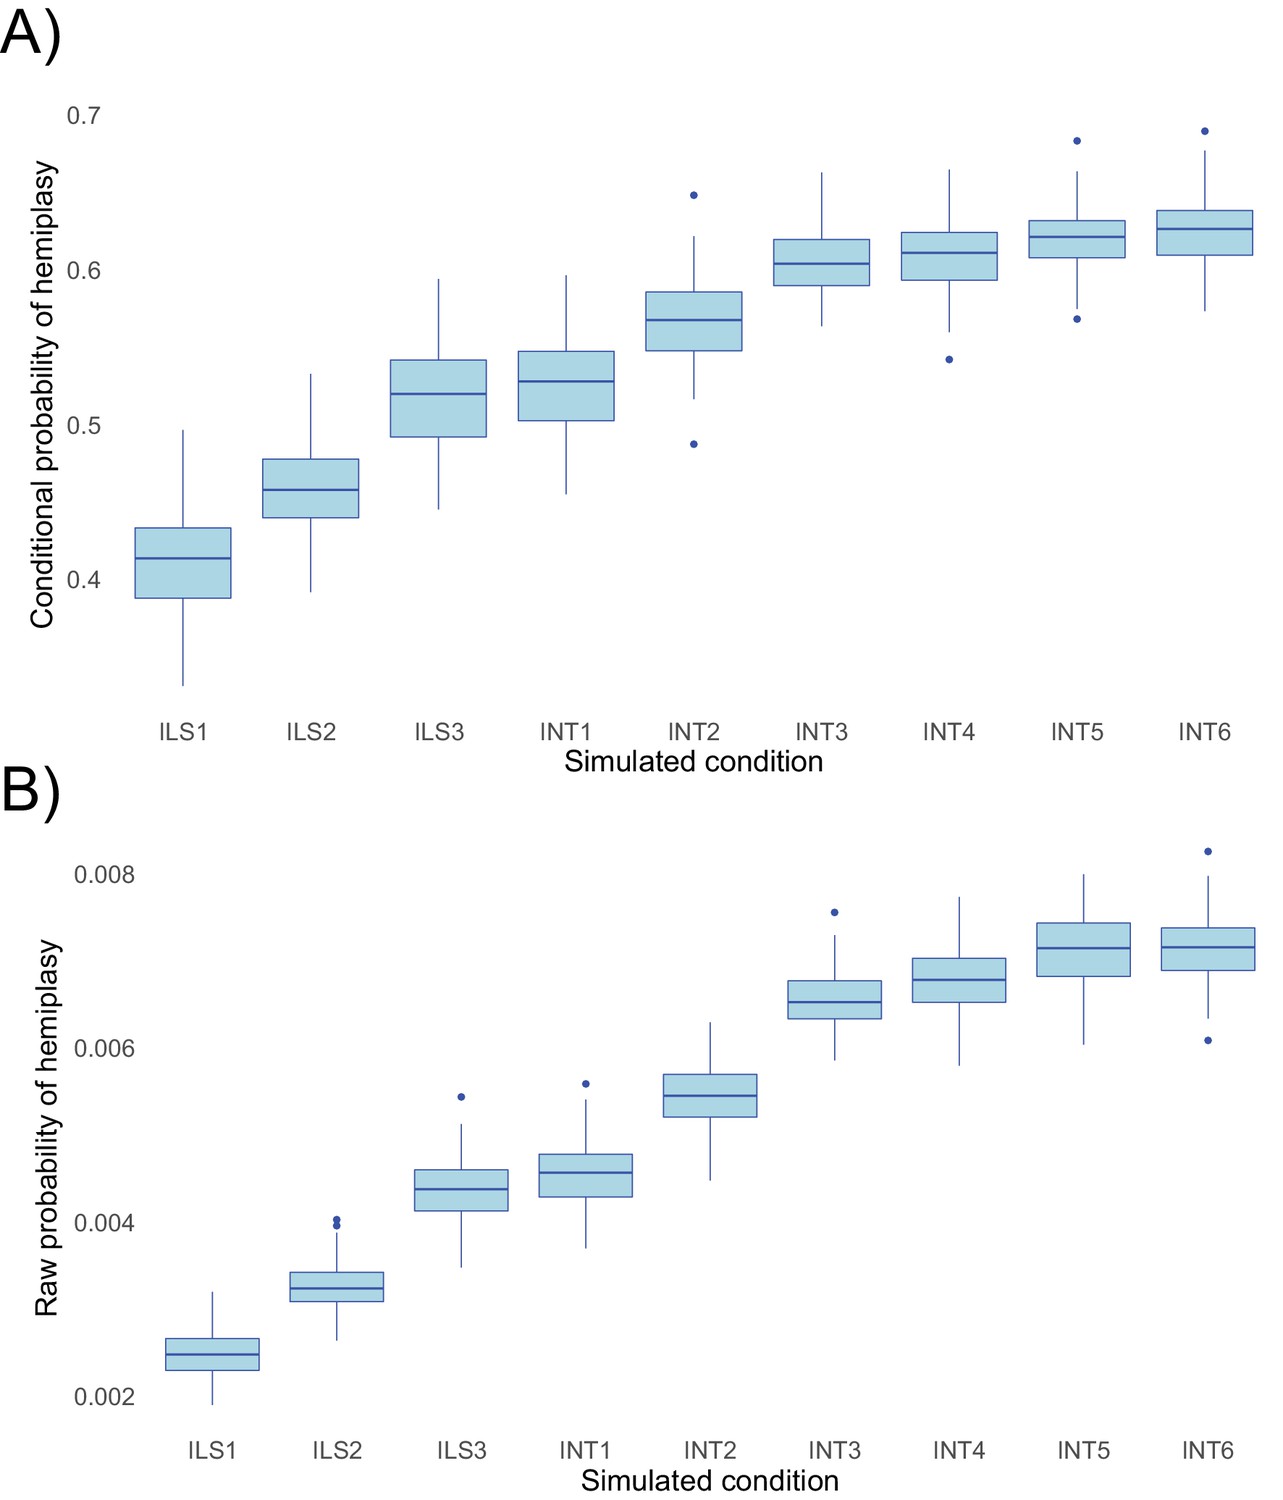
Probabilities of hemiplasy estimated from HeIST across nine simulated conditions.
ILS1-ILS3 decrease the internal branch length of the species tree; INT1-INT3 introduce introgression between derived taxa with increasing probability; INT4-INT6 make introgression more recent while holding the probability constant. See Figure 5—figure supplement 1 for the exact parameters used in each condition. Panel A shows the probability conditional on observing the trait pattern, whereas panel B shows the raw probability out of 100,000 simulations.
-
Figure 5—source data 1
Data used to generate Figure 5.
condition: the simulation condition. hemi_count: the count of trees where a single mutation was observed. homo_count: the count of trees where two mutations were observed. cond_hemi: hemi_count divided by the sum of hemi_count and homo_count. raw_hemi: hemi_count divided by the total number of simulated trees. cond_homo: homo_count divided by the sum of hemi_count and homo_count. raw_homo: homo_count divided by the total number of simulated trees. pepo: cond_hemi divided by cond_homo.
- https://cdn.elifesciences.org/articles/63753/elife-63753-fig5-data1-v2.xlsx
Figure 5—figure supplement 1
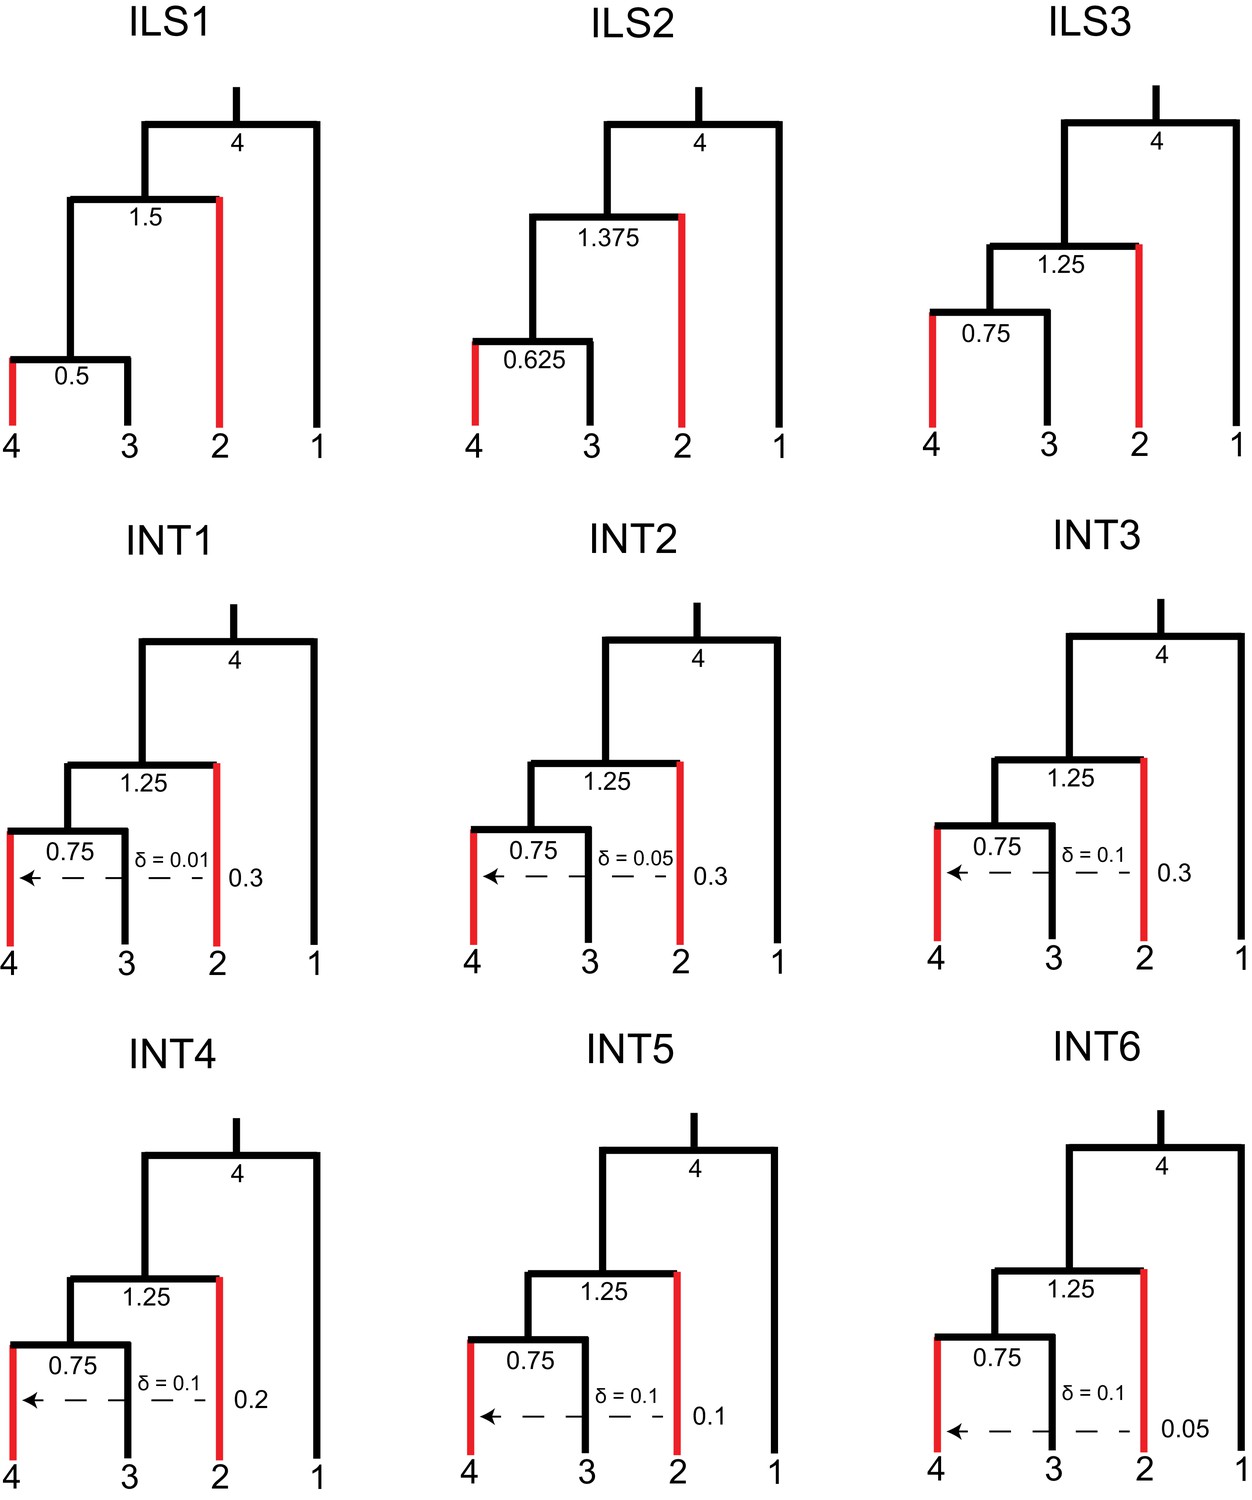
Parameters used for benchmarking simulations in HeIST.
Nodes and reticulations are labeled with the timing of the split in units of 2N generations. Branch lengths are visually adjusted in each condition to show how the parameters change, but they are not to scale. Species sharing the derived character are shown in red.
Figure 5—figure supplement 2
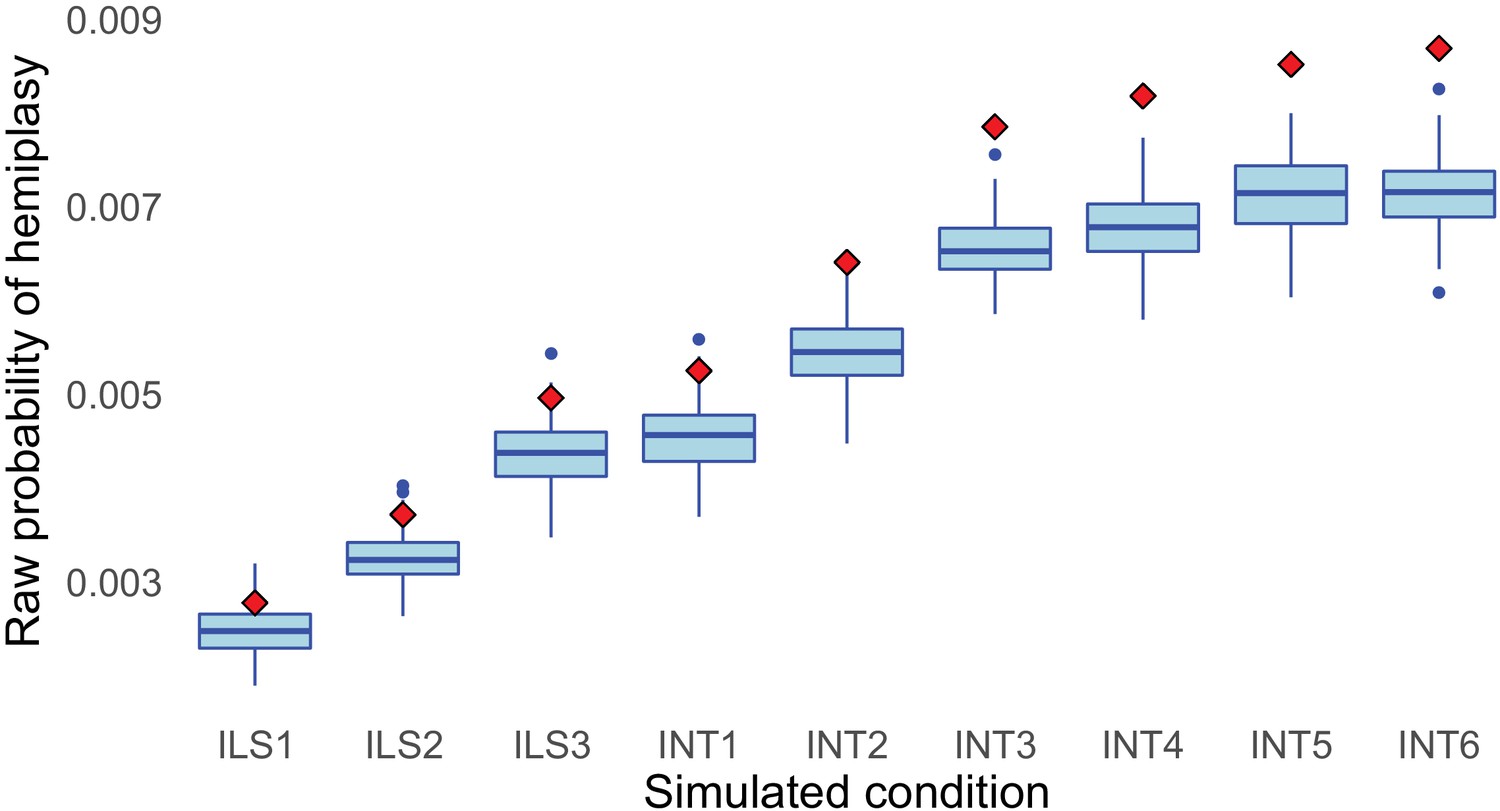
Mismatch between simulated (blue boxes) and theoretical (red diamonds) raw probabilities of hemiplasy across simulated conditions, using a mutation rate per 2N generations of 0.05.
Figure 5—figure supplement 3
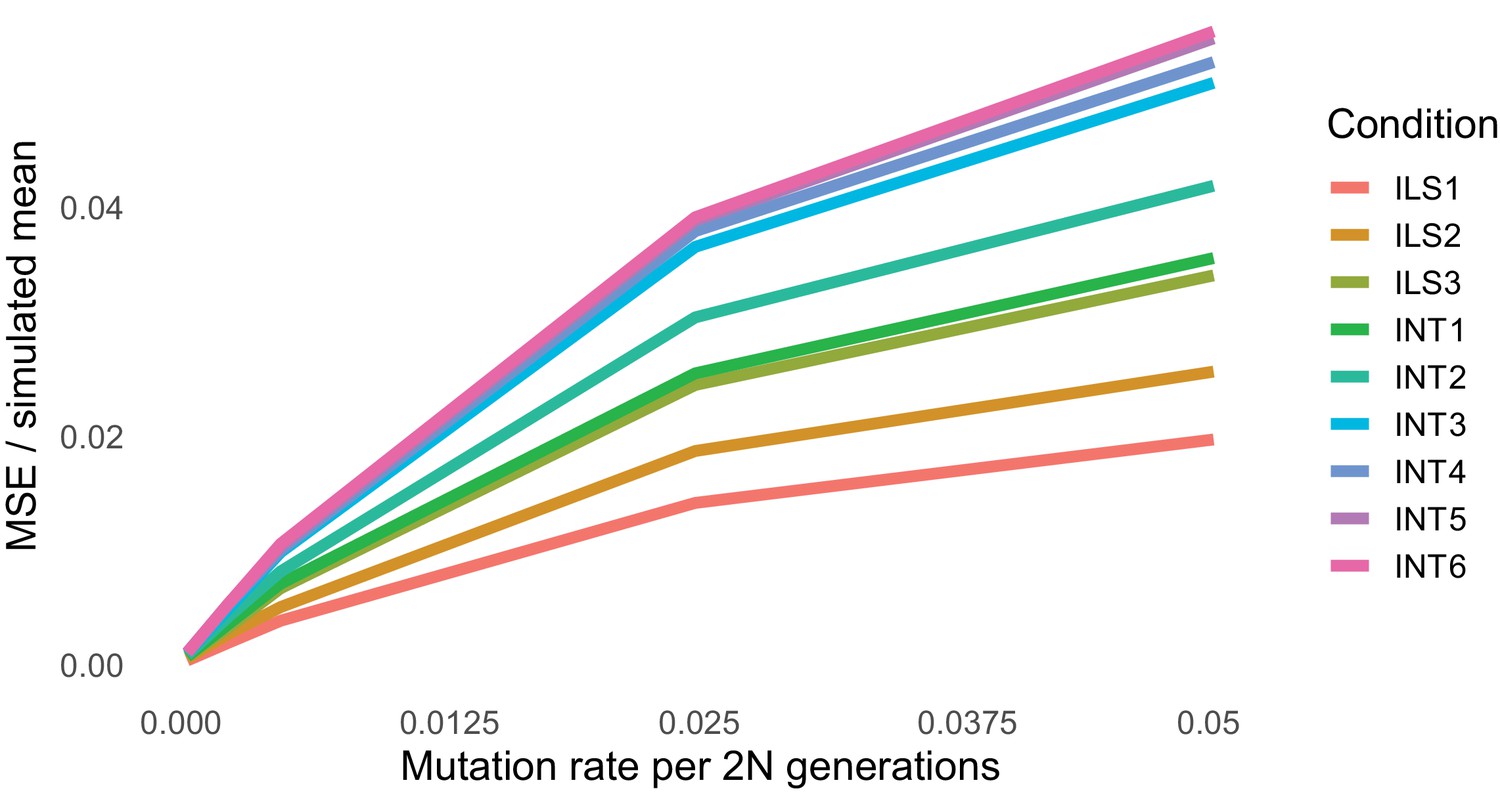
Degree of mismatch between simulated and theoretical values of the raw probability of hemiplasy for our nine simulated conditions (colors) across five mutation rates (x-axis).
In the y-axis, the mean-squared error between the simulated and theoretical value is normalized by the mean simulated value to make the error comparable across simulation conditions.
Figure 5—figure supplement 4
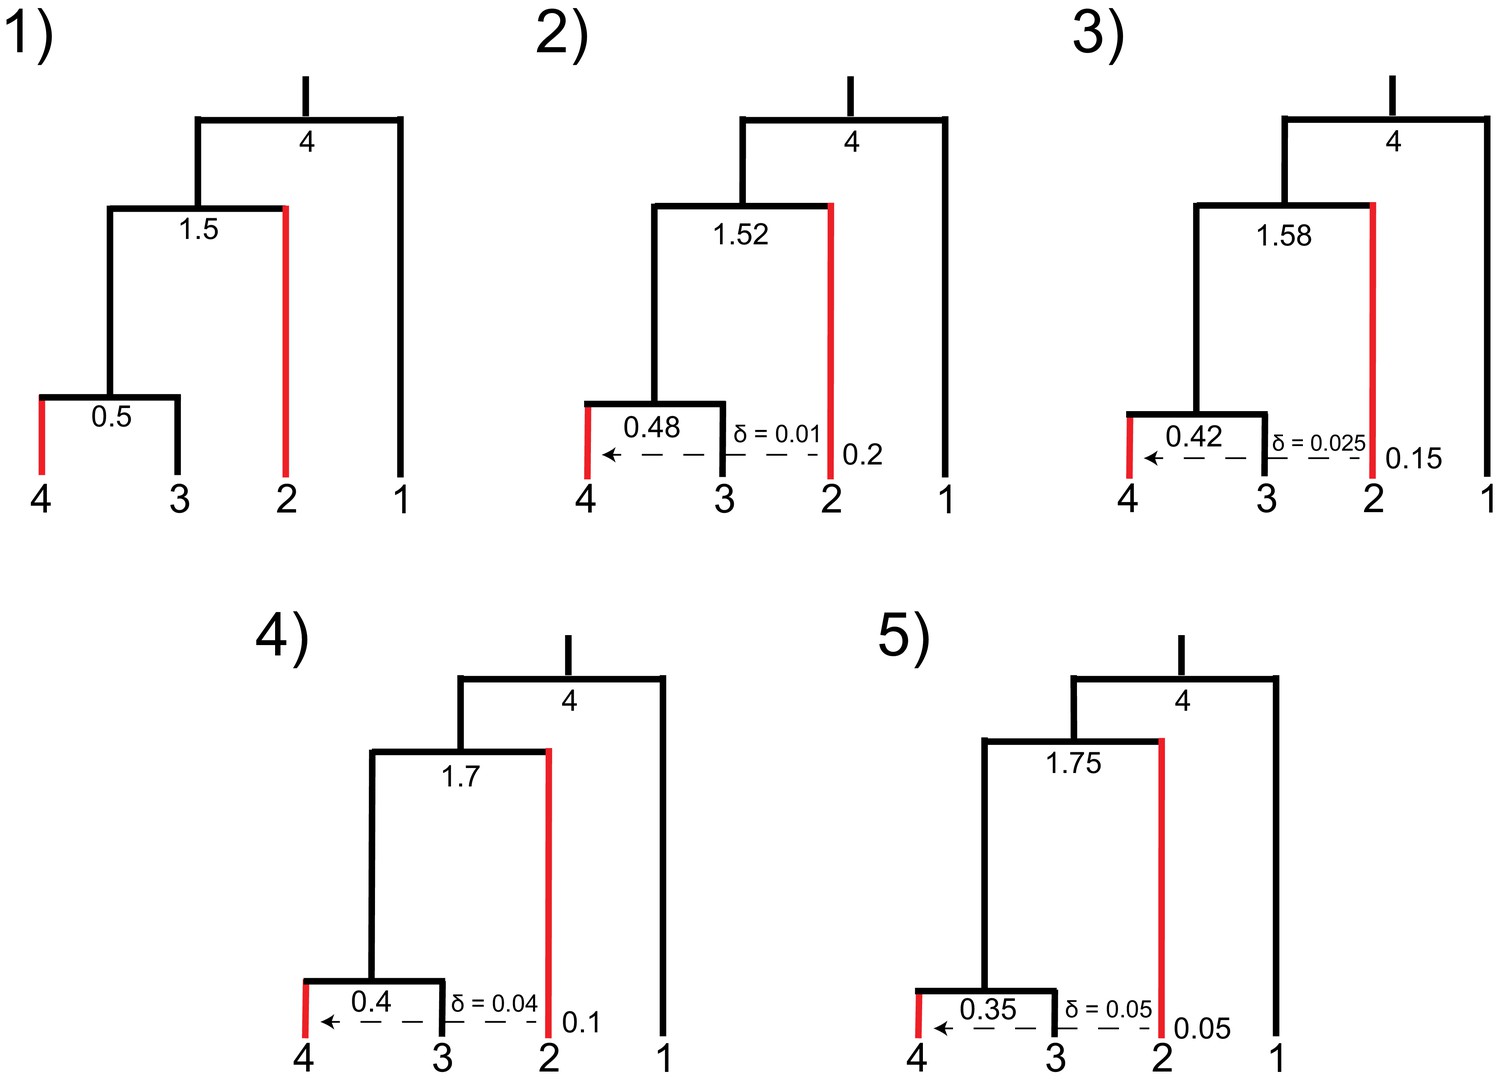
Parameters used for simulations demonstrating trade-offs in introgression parameters in HeIST.
Nodes and reticulations are labeled with the timing of the split in units of 2N generations. Branch lengths are visually adjusted in each condition to show how the parameters change, but they are not to scale. Species sharing the derived character are shown in red.
Figure 5—figure supplement 5
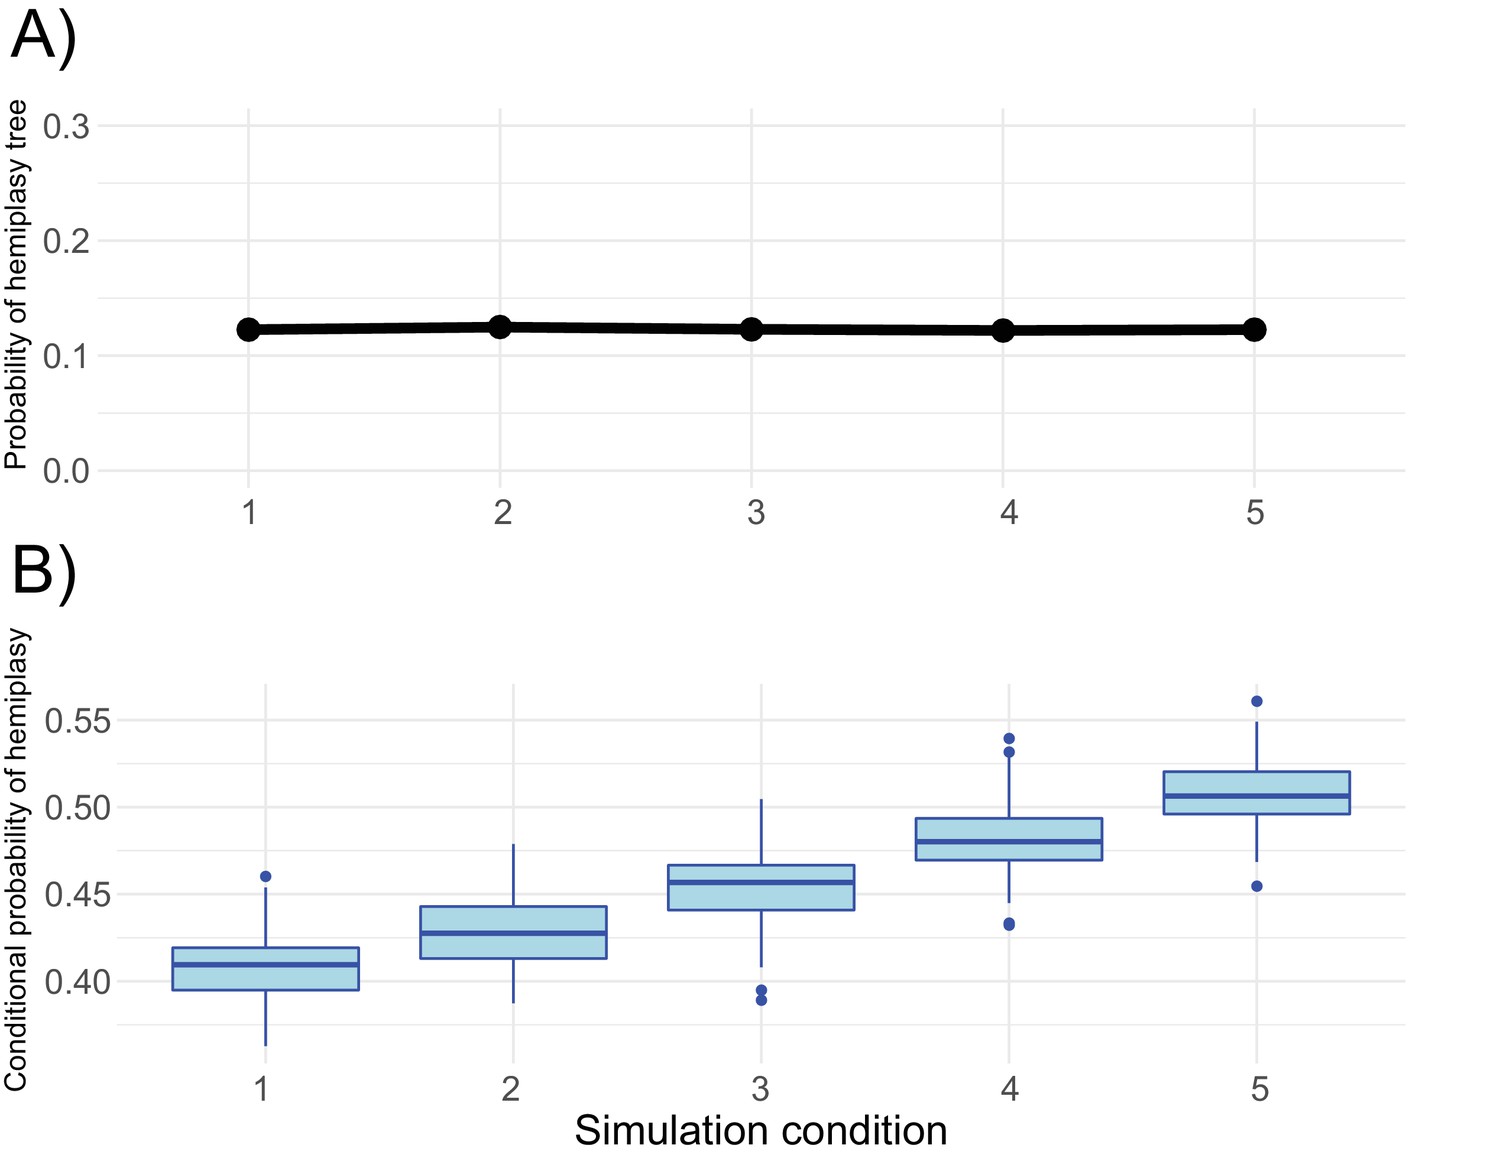
Trade-offs of different network parameters in HeIST.
(A) The expected probability of the gene tree that causes hemiplasy for each simulated condition shown in Figure 5—figure supplement 1. (B) The probability of hemiplasy conditional on observing the incongruent trait pattern, estimated from 100 replicate simulations of each condition in HeIST using a mutation rate per 2N generations of 0.05.
Figure 5—figure supplement 6
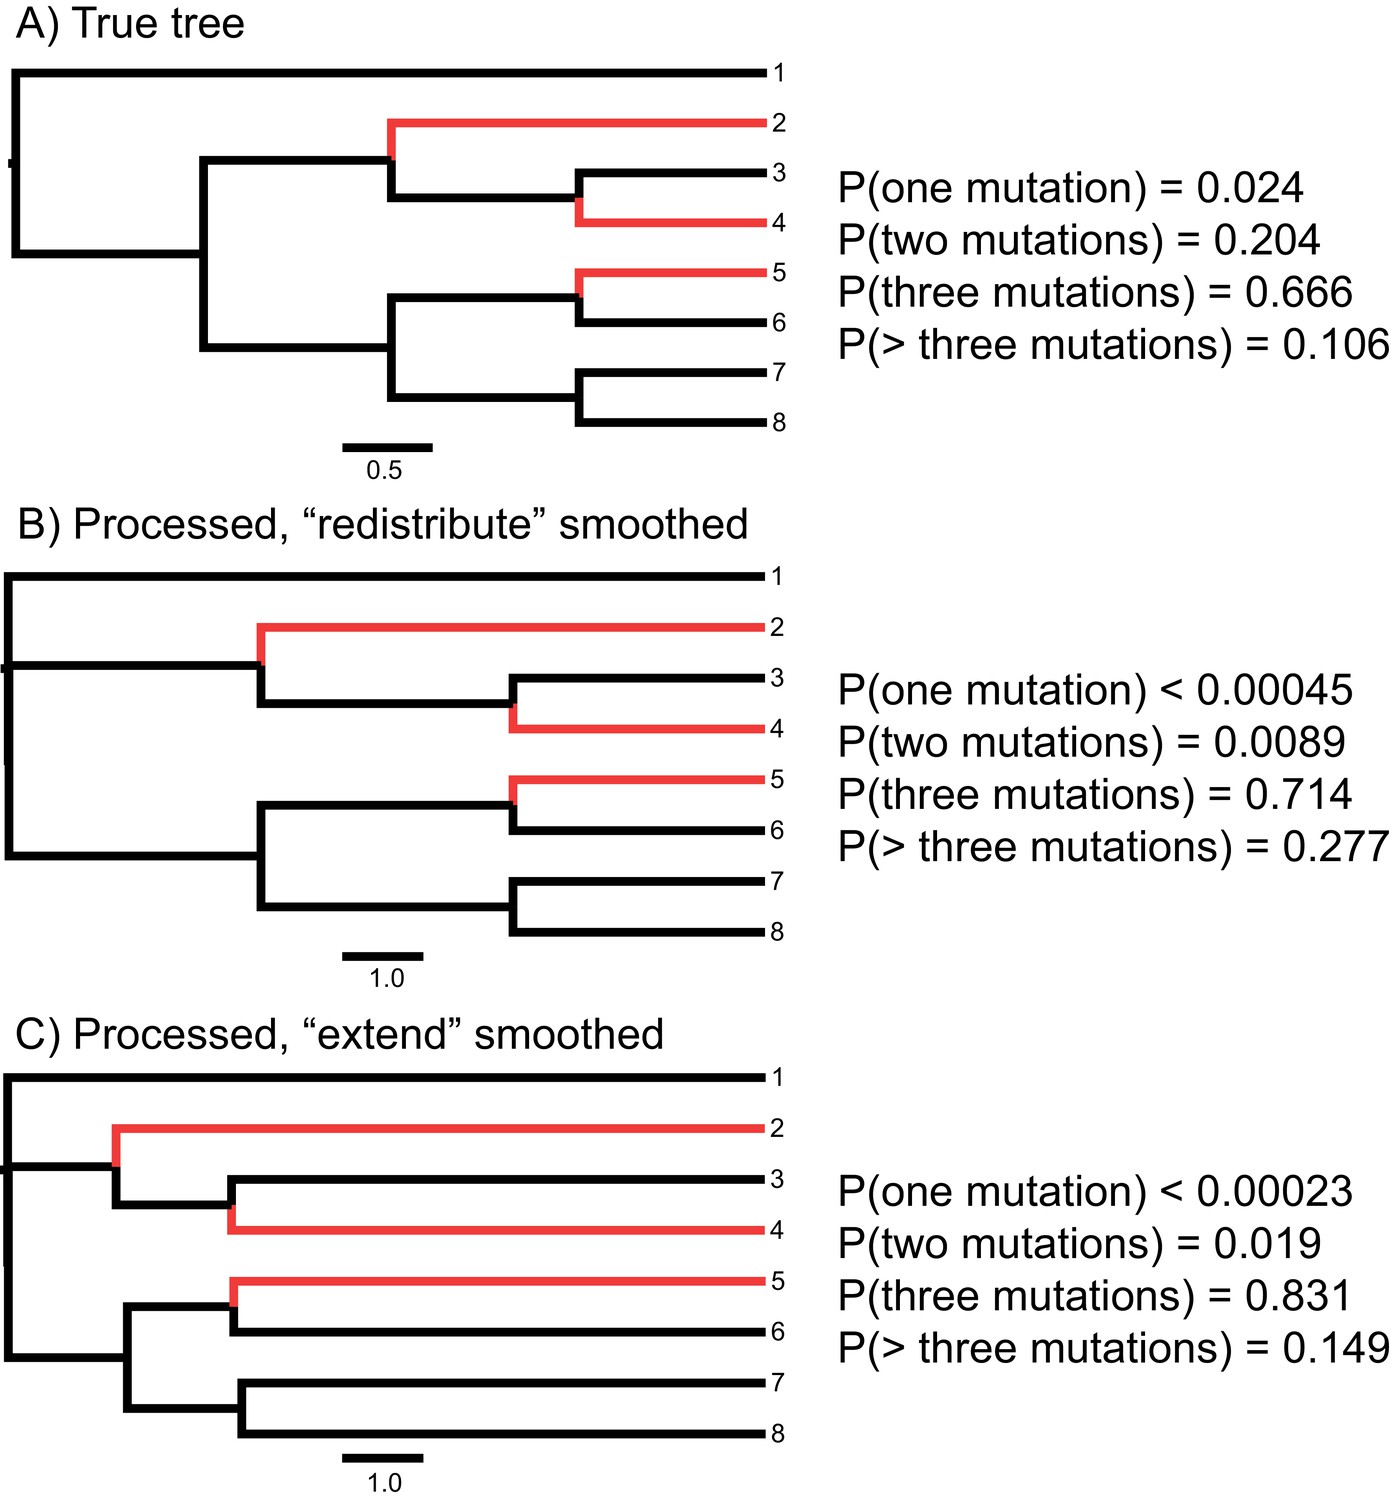
Effect of phylogenetic inference, branch length unit conversion, and smoothing on estimated probabilities of hemiplasy in HeIST.
Species sharing the derived state are highlighted in red. Panel A shows the true tree in units of 2N generations, with estimated conditional probabilities for each number of mutations. For panels B and C, gene trees were simulated from the tree in panel A and used to build a phylogeny with RAxML, which was then giving to the unit conversion module in HeIST. In panel B, smoothing was done by redistributing branch lengths, while in panel C it was done by extending the tip branches. Note the length scale is different in panels B and C than in panel A. The ancestral branch leading to the ingroup clade (all taxa except taxon 1) was originally inferred to be a polytomy in RAxML but has been assigned a very short internal branch in the trees in panels B and C.
Figure 6 with 2 supplements
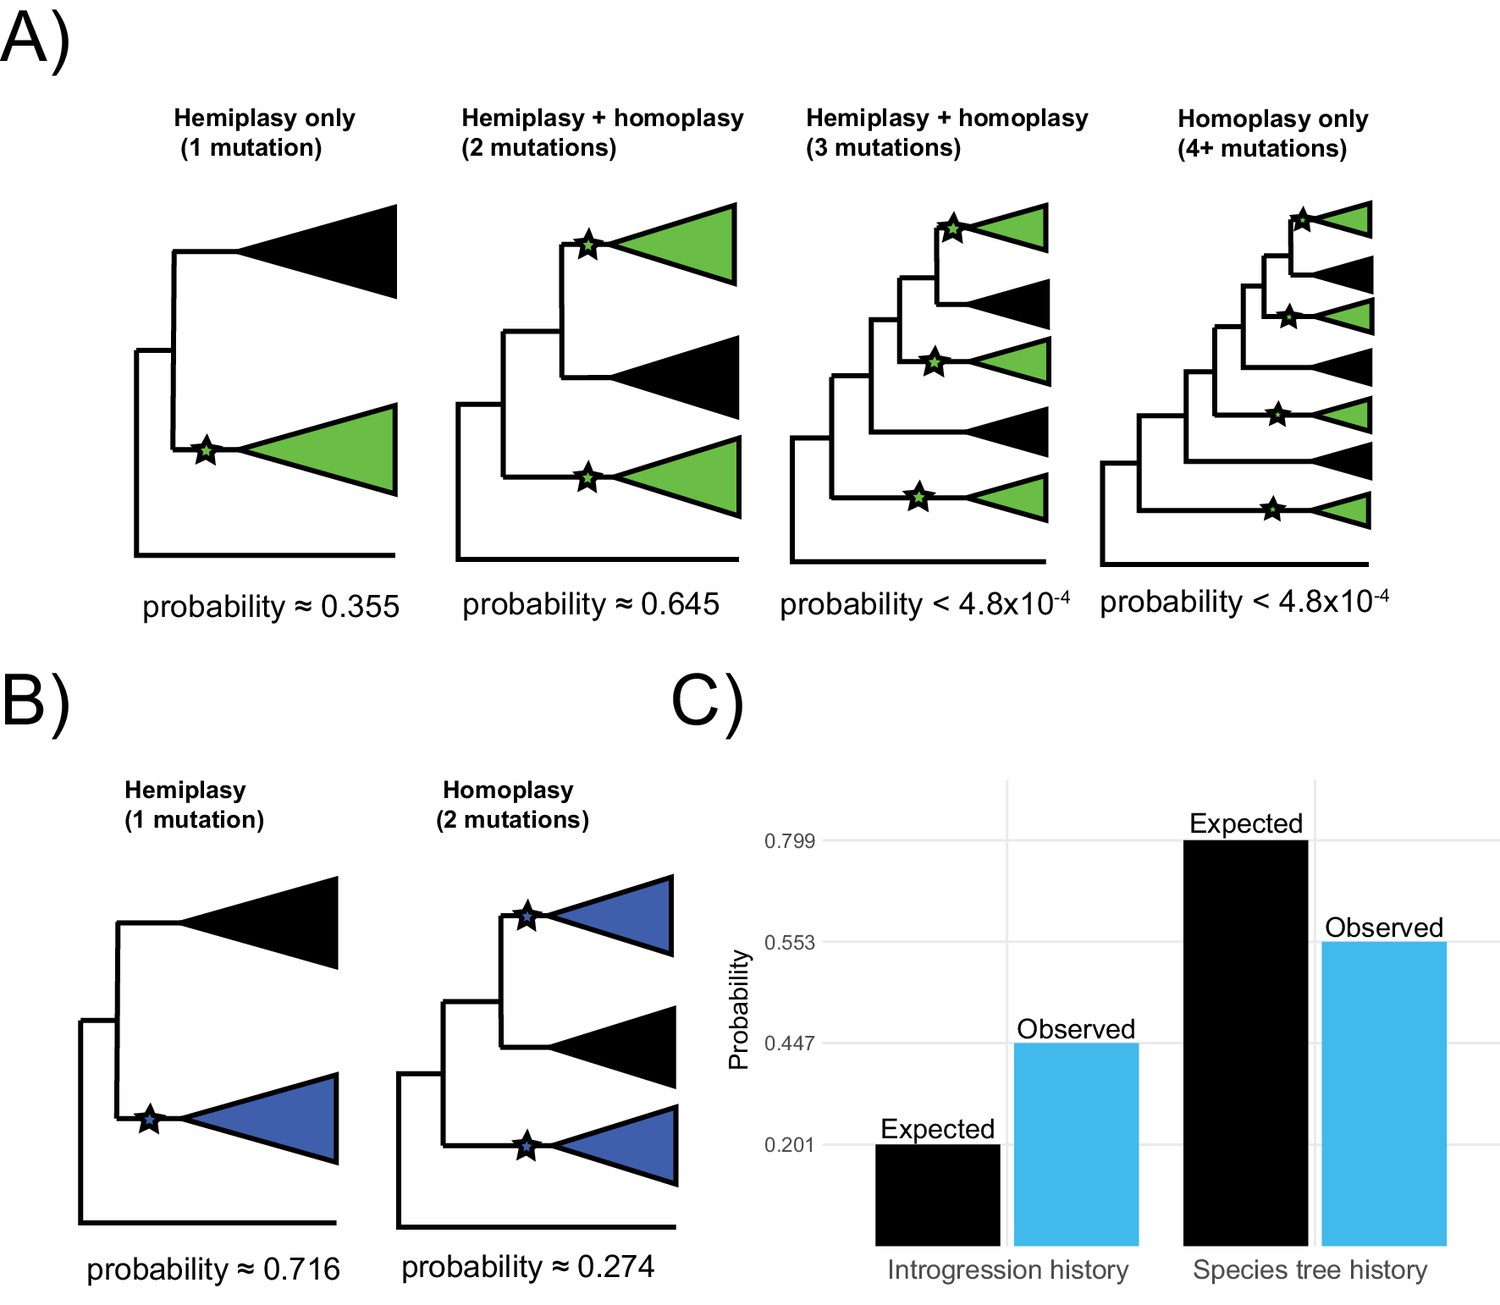
Probable histories for (A) the origin of green blood in New Guinea lizards and (B) the chromosomal inversion spanning the gene cortex in Heliconius, calculated using HeIST.
Trees depict the maximum number of clades expected for gene tree topologies under each scenario, with green-blooded clades in green and inversion clades in blue. Branches with proposed ancestral-to-derived transitions are labeled with stars. Exactly which species are sorted into these clades can vary, meaning many possible gene trees exist for each of the depicted scenarios. Correspondingly, any of the labeled hypothetical mutations could represent hemiplasy or homoplasy (except in the case of a single mutation, which must be hemiplasy), depending on the gene tree topology. Reported probabilities are based on 1010 simulated trees for New Guinea lizards and 107 trees for Heliconius, with probabilities conditional on matching the empirical trait distributions. Panel C shows what proportion of gene trees originate from a history of introgression vs. the species tree for the results summarized in panel B (blue) as compared to what would be expected based on the inferred network in Figure 1 (black).
-
Figure 6—source data 1
Output file from the HeIST lizard analysis, from which the probabilities are reported in Figure 6A.
- https://cdn.elifesciences.org/articles/63753/elife-63753-fig6-data1-v2.zip
-
Figure 6—source data 2
Output file from the HeIST butterfly analysis, from which probabilities are reported in Figure 6B and C.
- https://cdn.elifesciences.org/articles/63753/elife-63753-fig6-data2-v2.zip
Figure 6—figure supplement 1
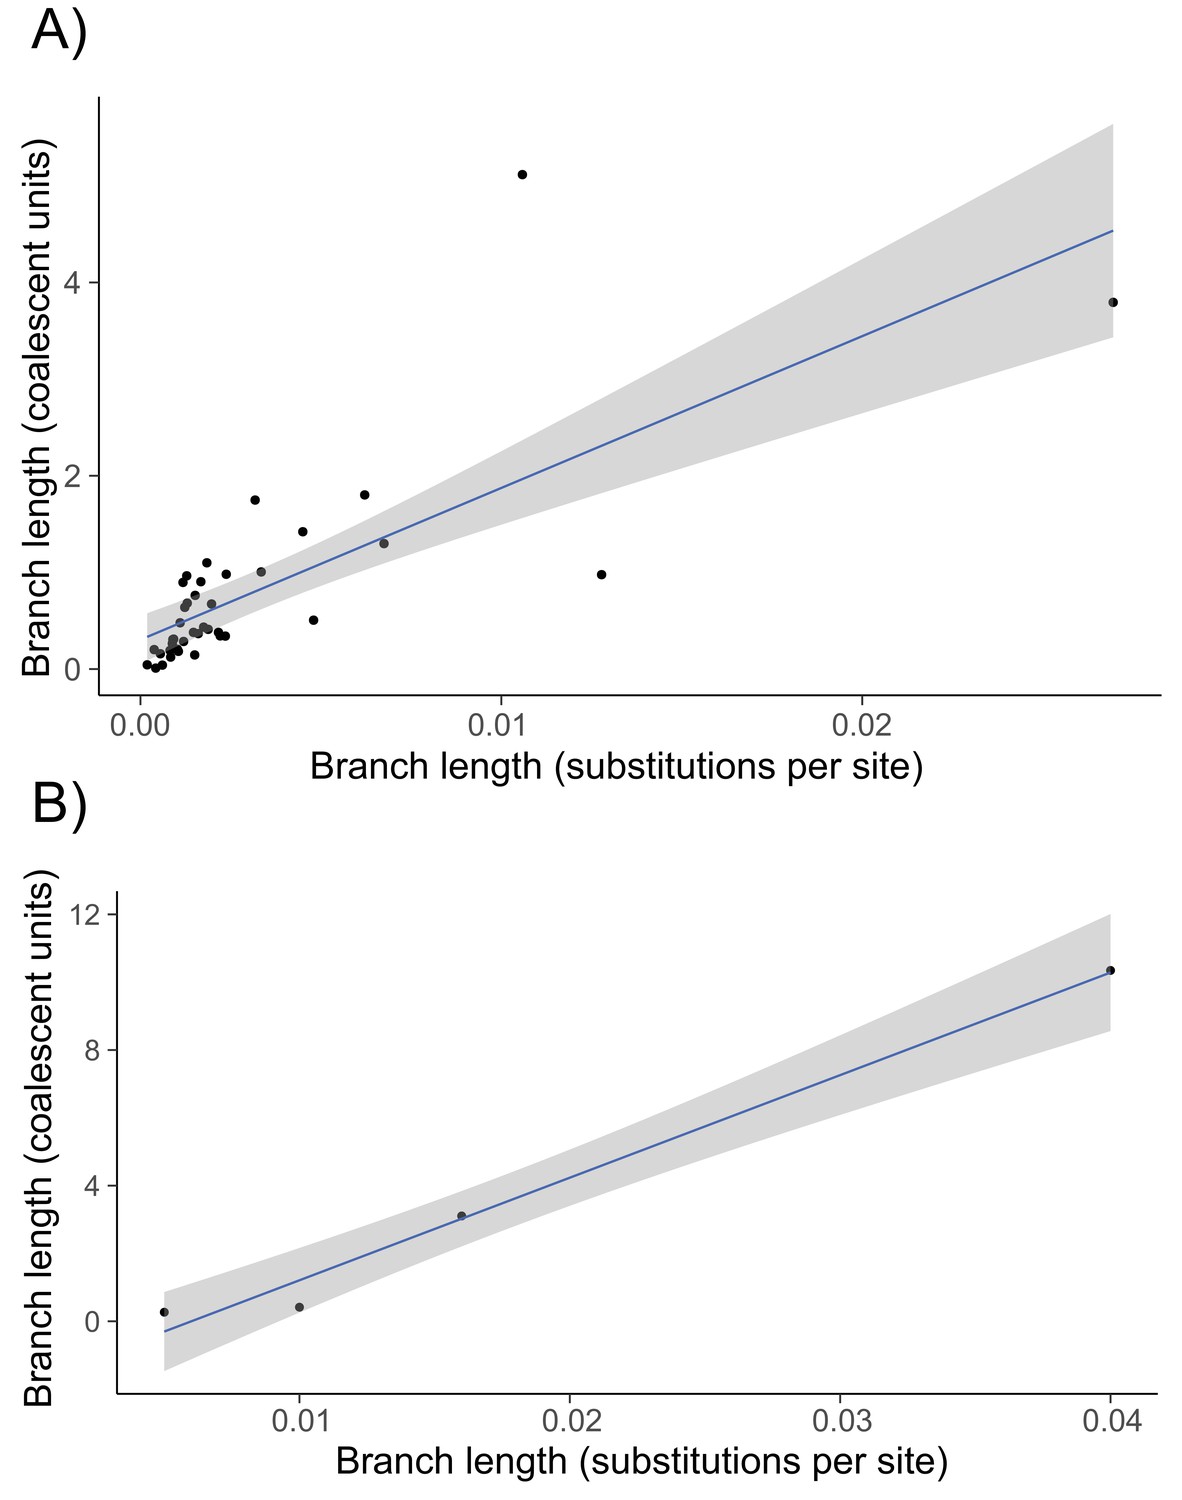
Regression of internal branch lengths in substitutions per site (x-axis) against the same branch estimated in coalescent units using concordance factors (y-axis) for the 43-species lizard phylogeny (panel A) and the 6-species Heliconius phylogeny (panel B).
Figure 6—figure supplement 2
Ultrametric phylogeny of green-blooded lizards, with branch lengths in units of 2N generations and green-blooded taxa labeled in green.
This tree was generated from the phylogeny in Figure 1 in the main text using our regression approach for unit conversion, followed by a smoothing step. Gene trees were simulated from this tree within HeIST.
Additional files
-
Supplementary file 1
Table 1: Site concordance factors from IQtree.
'ID’: the ID of the internalbranch in the full lizard phylogeny, as labeled in Figure 1 —figure supplement 1. 'sCF’: the value of the site concordance factor for the branch, averaged over 100 randomly sampled quartets.'sDF1’ and'sDF2’: the site discordance factors for the first and second most common discordant site patterns at each branch, respectively.'sN’: the average number of informative sites averaged across the sampled quartets at each branch.'Length’ is the length of the internal branch in substitutions per site. -Table 2: Trios involving green-blooded species which were evaluated for evidence of introgression using D statistics. Species are listed in the order P1, P2, P3, where an excess of shared P1/P3 or P2/P3 alleles would indicate evidence of introgression. Lygosoma sp was used as the outgroup for each trio. Table 3: D statistic results for the 12 trios listed in Table 1, estimated from the concatenated alignment of ultra-conserved elements (UCEs). Significance was evaluated for each trio by bootstrap-sampling the UCEs to generate a null distribution of alignments, and asking how often the bootstrap distribution of 1000 D statistics was at least as extreme as the observed value.
- https://cdn.elifesciences.org/articles/63753/elife-63753-supp1-v2.xlsx
-
Transparent reporting form
- https://cdn.elifesciences.org/articles/63753/elife-63753-transrepform-v2.docx
Download links
A two-part list of links to download the article, or parts of the article, in various formats.
Downloads (link to download the article as PDF)
Open citations (links to open the citations from this article in various online reference manager services)
Cite this article (links to download the citations from this article in formats compatible with various reference manager tools)
Determining the probability of hemiplasy in the presence of incomplete lineage sorting and introgression
eLife 9:e63753.
https://doi.org/10.7554/eLife.63753


