Infection with a newly designed dual fluorescent reporter HIV-1 effectively identifies latently infected CD4+ T cells
- Institute of Human Virology, Key Laboratory of Tropical Disease Control of Ministry of Education, Zhongshan School of Medicine, Sun Yat-sen University, China
- Department of Immunology, Zhongshan School of Medicine, Sun Yat-sen University, China
- Department of Infectious Diseases, Fifth Affiliated Hospital, Sun Yat-sen University, China
Figures
Figure 1
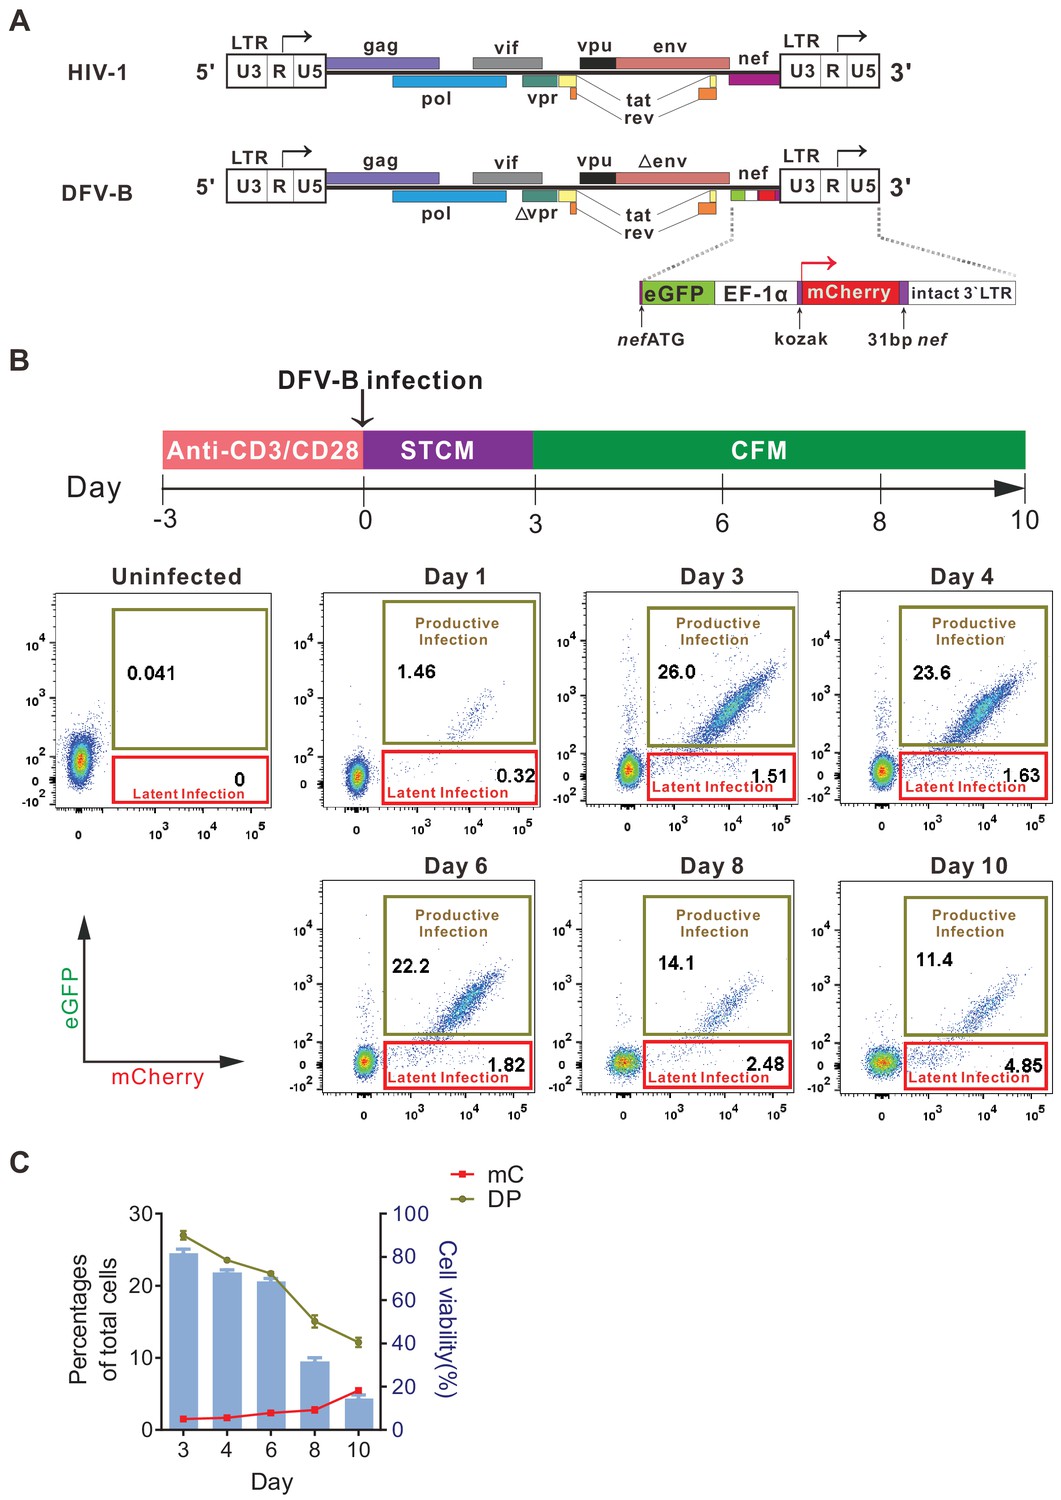
Infection with a newly designed dual fluorescent reporter HIV-1 identifies latently infected primary CD4+ T cells.
(A) Diagram of the derivation of DFV-B from the original NL4-3 strain of HIV-1. Top panel depicts the genomic structure of HIV-1 NL4-3; bottom panel shows the genomic structure of DFV-B and the major modifications comparing to NL4-3. (B) Representative experiment of DFV-B infection in activated primary CD4+ T cells. Top panel depicts the scheme of experimental procedure. Isolated primary CD4+ T cells from HIV naïve individuals were stimulated with αCD3/αCD28 antibodies in the presence of IL-2 and TCGF for 3 days, and the activated CD4+ T cells were then infected with DFV-B incorporating a CXCR4-tropic Env at the MOI of 0.1 to 1 for 3 days in STCM and were subsequently transferred to CFM. Bottom panel shows the infection profiles of stimulated primary CD4+ T cells by DFV-B at indicated time points. (C) Data from panel B are displayed graphically. Line charts show the percentages of latent infection (mC) and productive infection (DP). Histogram represents the cell viability. Data indicate mean ± SD from three different donors. TCGF: T cell growth factor; CFM: cytokine-free medium; STCM: super T cell medium, CFM with IL-2 and TCGF.
Figure 2 with 1 supplement
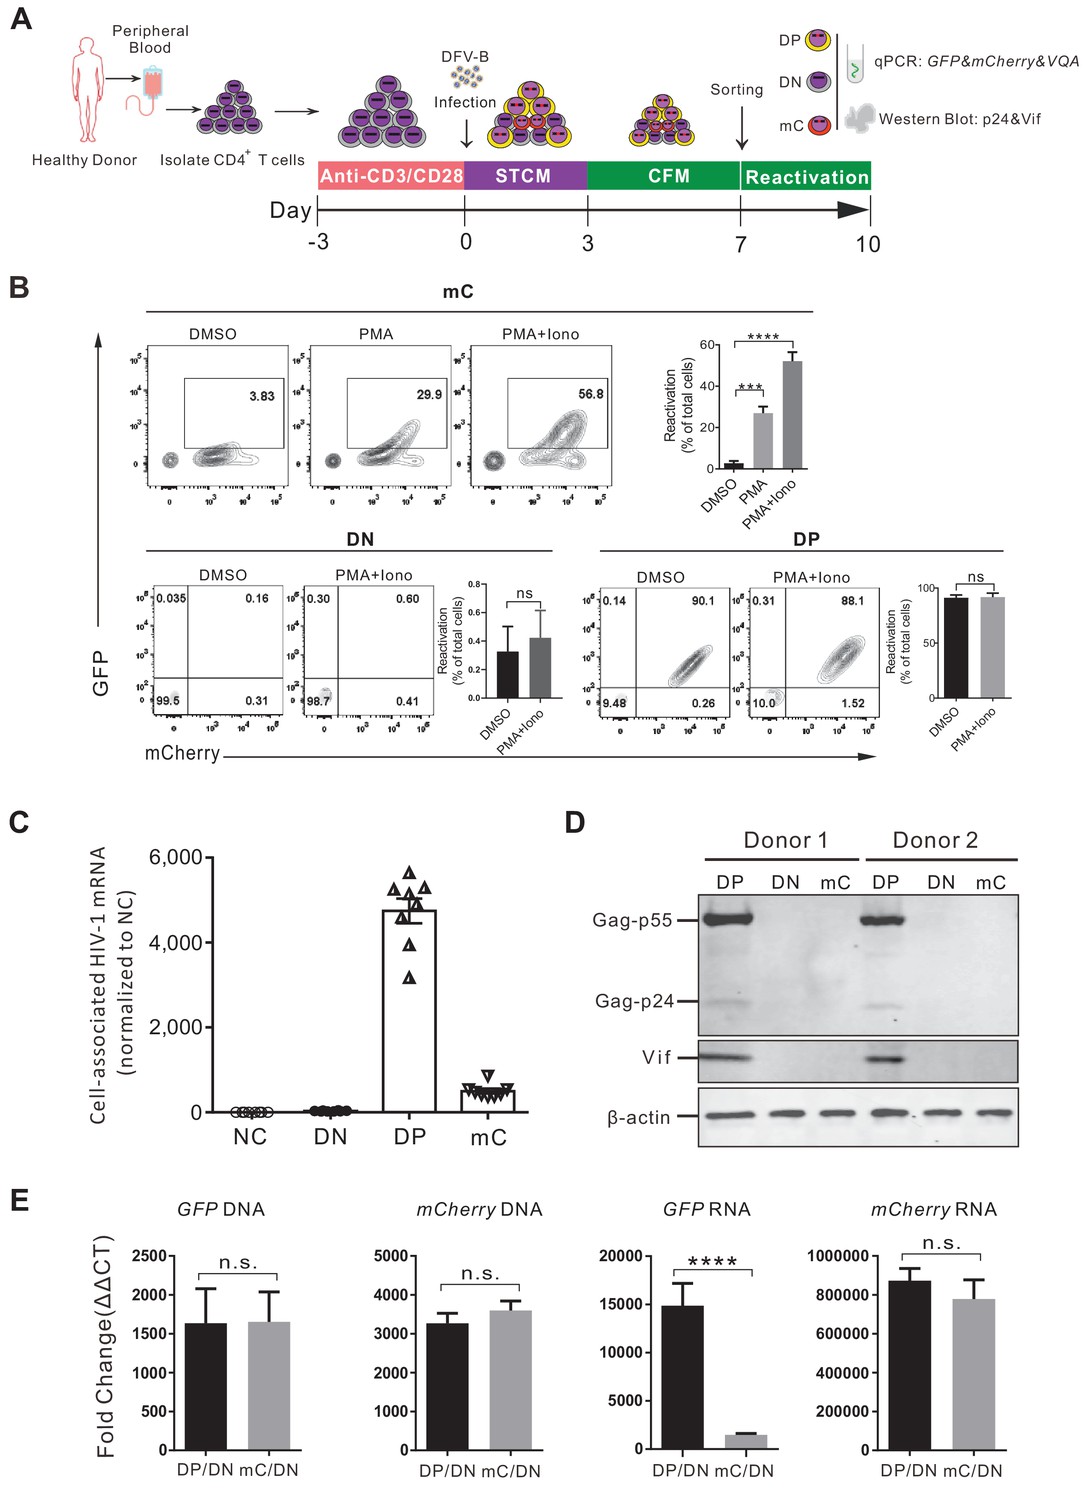
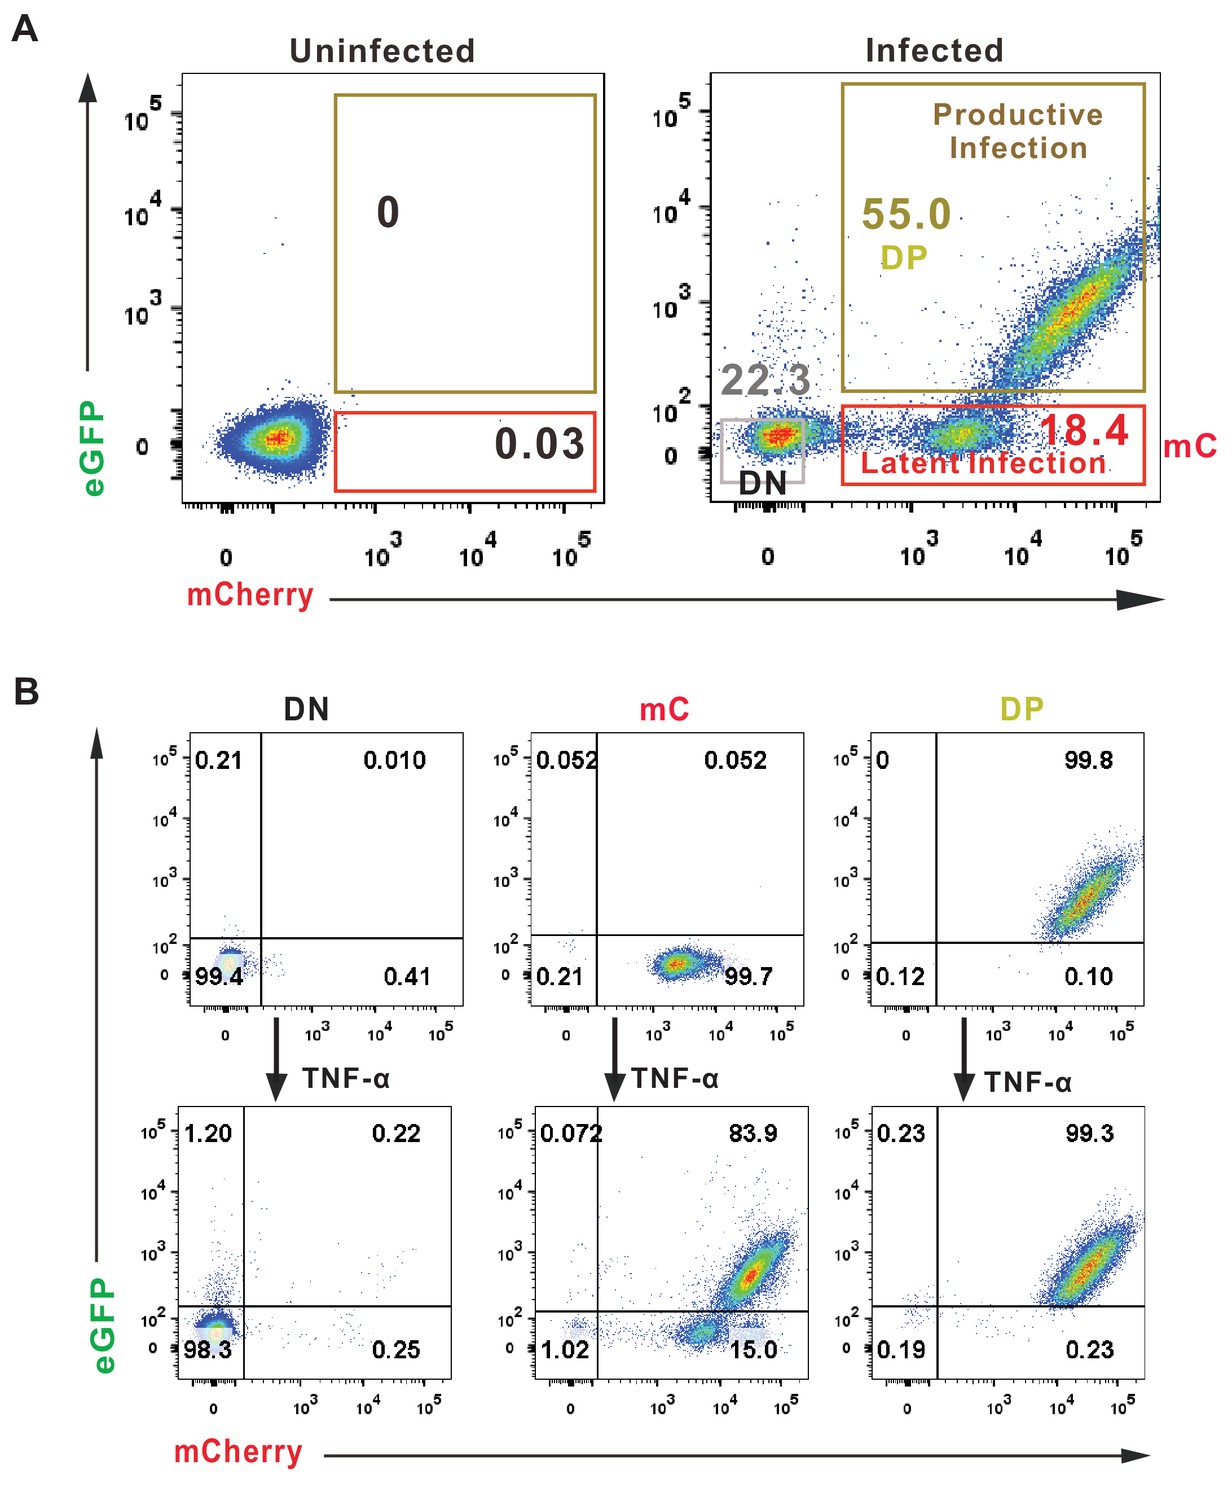
Validation of the DFV-B infected mC population as latently infected primary CD4+ T cells.
(A) Schematic of experimental design. (B) Reactivation of the sorted different cell populations. Cells were cultured in CFM with 50 ng/ml PMA and 1 μM ionomycin and measured by flow cytometry 3 days later. Data shown from three different donors (mean ± SD). p-values calculated using unpaired t-test, ***p<0.001; ****p<0.0001; ns, not significant. (C) Quantification of cell-associated HIV-1 mRNA of different sorted populations. HIV-1 mRNAs were measured by real-time qPCR. RNA copies were normalized to the uninfected group. Each symbol represents the mean of three replicates (n = 8). (D) Western blot analysis of HIV-1 protein production in different sorted cell populations. (E) Quantification of the cell-associated DNA and RNA of GFP and mCherry in the sorted populations. The DNA and mRNA of GFP and mCherry were quantified relative to cellular GAPDH, respectively. Data shown from three biological replicates (mean ± SD). p-values calculated using unpaired t-test, ns, not significant; ****p<0.0001.
Figure 2—figure supplement 1
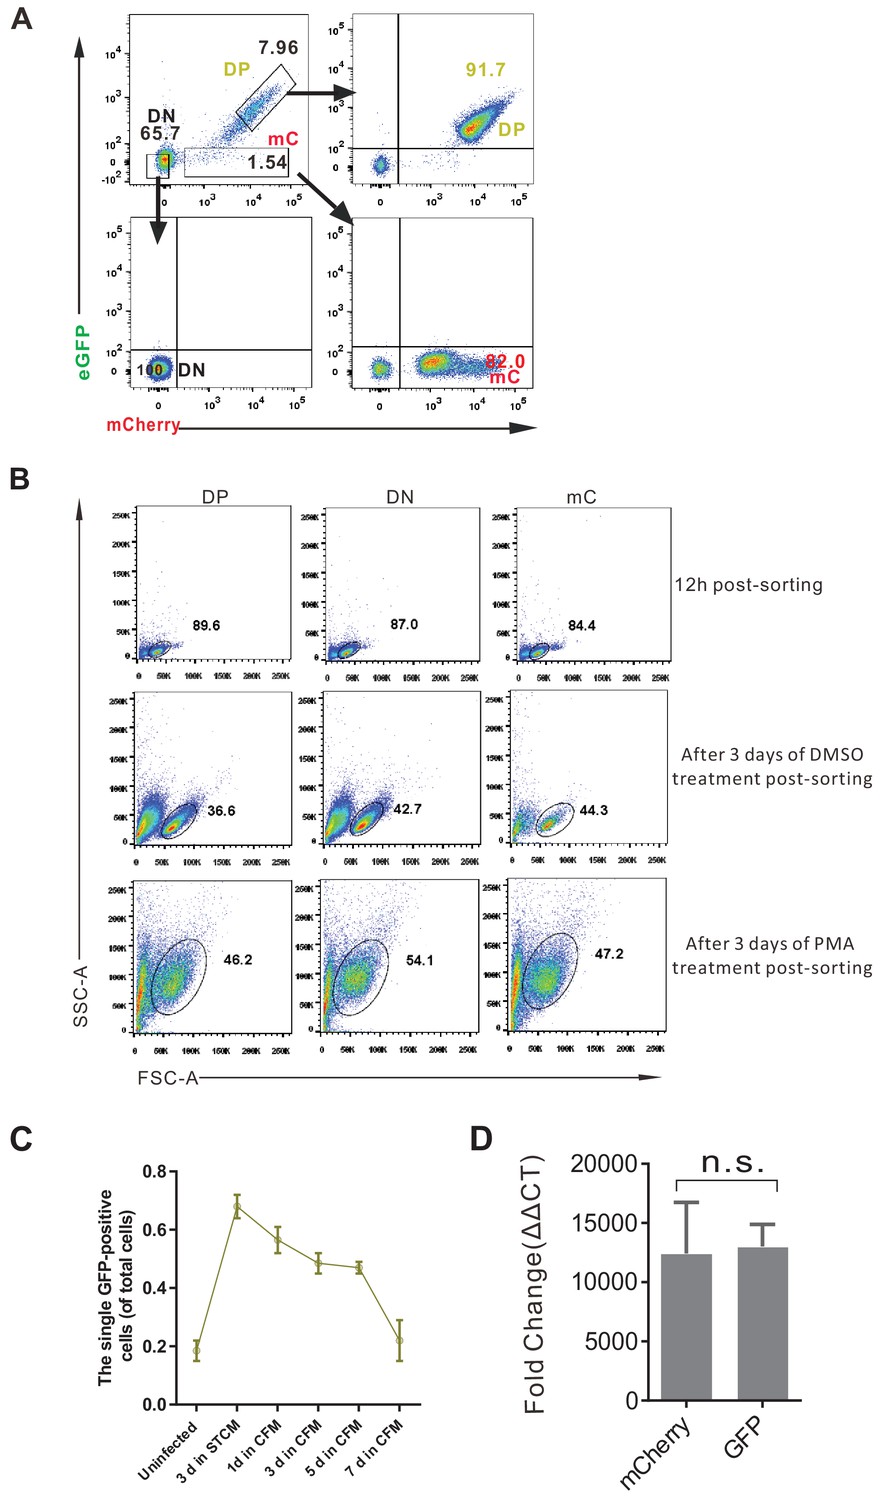
FACS sorting strategy and the viability of sorted cells.
(A) FACS sorting strategy of DFV-B infected primary CD4+ T cells. (B) Viability of sorted cells under different conditions. (C) The percentage of single GFP-positive cells in DFV-B infected CD4+ T cells. Data shown from three biological replicates (mean ± SD). (D) qPCR quantification of GFP-DNA and mCherry-DNA in the sorted single GFP positive cell population. DNA of GFP and mCherry were quantified relative to cellular GAPDH. Data shown from three biological replicates (mean ± SD). p-values calculated using unpaired t-test, ns, not significant.
Figure 3
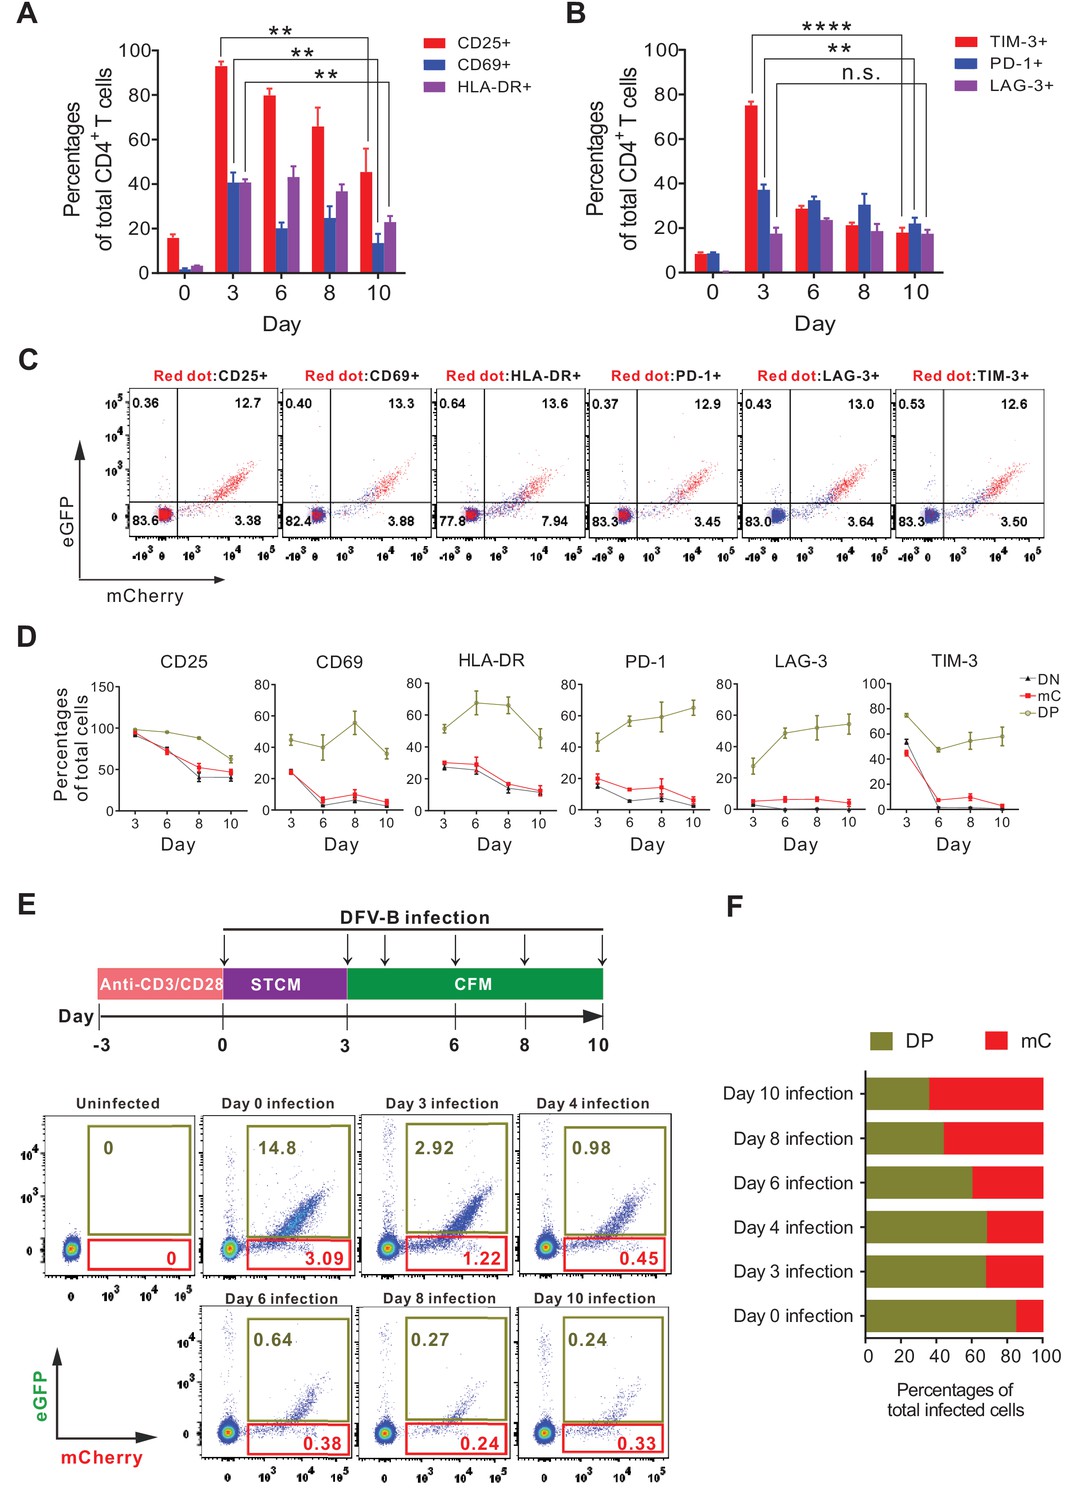
Effector-to-memory transitioning CD4+ T cells are the primary targets for HIV-1 latency establishment.
(A and B) Expression of activation markers (CD25, CD69, HLA-DR; panel A) and exhaustion markers (LAG-3, TIM-3, PD-1; panel B) of the DFV-B infected primary CD4+ T cells. Primary CD4+ T cells were infected as described in Figure 1B and the surface markers were measured by FACS at indicated time points. Data indicate mean ± SD for three different donors. p-values calculated using unpaired t-test, ns, not significant; **p<0.01; ***p<0.001. (C and D) Expression of activation markers and exhaustion markers in the DN, DP, and mC population from A and B of this figure. Panel C only shows the results of day 8 post-infection. Red dots represented marker-positive cells; blue dots represented negative cells. Panel D shows quantified values of markers expression. Data indicate mean ± SD for three different donors. (E) Infection profile of EMT CD4+ T cells when infected by DFV-B at indicated time points. Top panel depicts scheme of experimental procedure. Bottom panel shows the flow cytometric chart of infected EMT CD4+ T cells on day 5 post-infection. (F) Infected EMT CD4+ T cells are more likely to become latently infected cells. The ratios of DP cells or mC cells to total infected cells were calculated using data from panel E. Data represents the average of three donors.
Figure 4 with 1 supplement
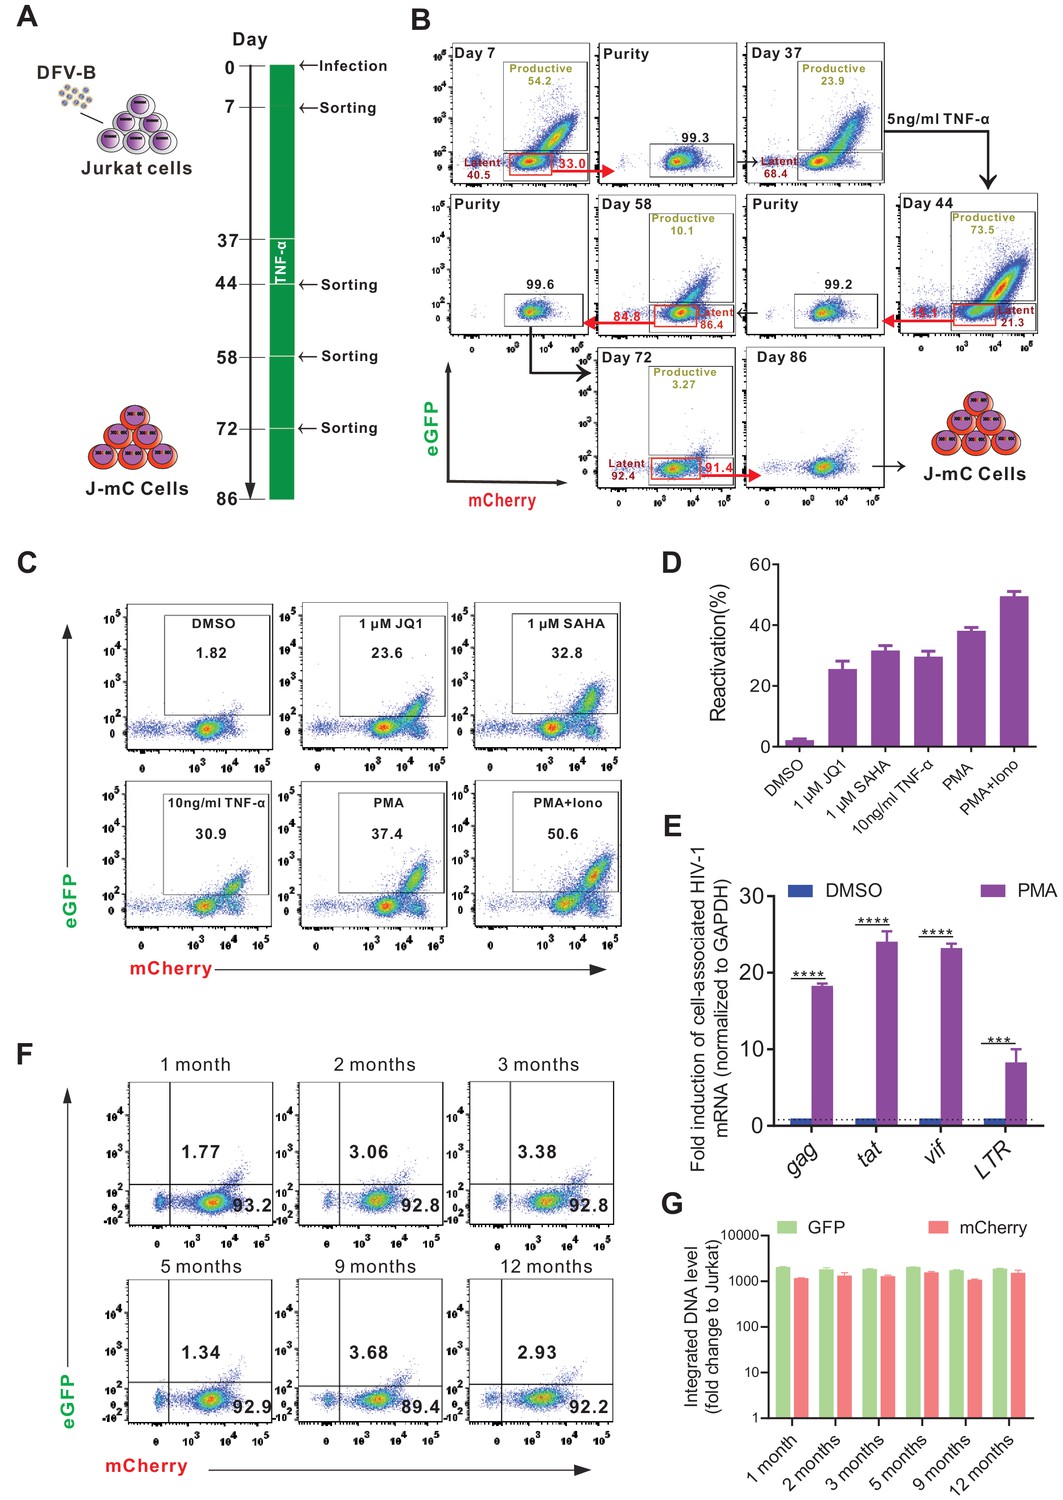
Generation of a novel cell line model of HIV-1 latency.
(A) The experimental procedure of generating a Jurkat-based cell line model of HIV-1 latency (J-mC). Jurkat cells were infected by DFV-B at day 0 in CFM. (B) Flow cytometric charts during the process of J-mC model generation. Detailed steps can be found in ‘Generation of J-mC cells’ in the Materials and methods section. (C) Reactivation of J-mC cells by different stimuli. J-mC cells were stimulated, respectively, with 1 μM JQ1, 1 μM SAHA, 10 ng/ml TNF-α, 50 ng/ml PMA, and 50 ng/ml PMA and 1 μM ionomycin for 48 hr prior to analysis by flow cytometry. (D) Data from panel C are displayed graphically. Data indicate mean ± SD for three different treatments. (E) Cell-associated HIV-1 mRNA in J-mC cells after reactivation. J-mC cells were treated with DMSO or 50 ng/ml PMA for 48 hr. HIV-1 gag, tat, vif, and LTR mRNAs were quantified relative to cellular GAPDH, and values within each group were normalized to the DMSO treatment. Error bars represent SDs of three technical replicates. p-values calculated using unpaired t-test, ***p<0.001; ****p<0.0001. (F) Long-term tracking of the phenotype of J-mC cells. J-mC cells were cultured in CFM and the expression of GFP and mCherry were monitored over the course of a year. (G) Long-term tracking of the integrated DNA level of GFP and mCherry in J-mC cells. J-mC cells were collected on the date indicated, and then total DNA were isolated. The DNA of GFP and mCherry were quantified relative to cellular GAPDH, respectively. Data shown from three biological replicates (mean ± SD).
Figure 4—figure supplement 1
FACS sorting strategy and reactivation of the DP, DN, and mC Jurkat cells.
(A) Jurkat cells were infected with DFV-B incorporating VSV-G in CFM. On day 7 post-infection, DP, DN, and mC Jurkat cells were sorted by flow cytometry. (B) Reactivation of DP, DN, and mC cells. DN, DP, and mC Jurkat cells were sorted according to panel A, purities of DN, DP, and mC population were measured by FACS. Then the sorted cells were stimulated by 10 ng/ml TNF-α for 3 days and the percentages of double positive subpopulations were measured by FACS.
Figure 5

The integration landscape of HIV-1 in J-mC cells.
(A and B) Validation of integration sites of J-Lat cell lines by LAM-HTGTS. J-Lat 8.4 and J-Lat 15.4 were mixed in equal amounts and subjected to LAM-HTGTS. A: Chromosome distribution of all integration sites. B: Integration sites analysis of J-Lat 8.4 and J-Lat 15.4. (C and D) Diversity of HIV-1 integration sites in J-mC cells. C: Chromosome distribution of all integration sites. A total of 5154 identified integration sites were obtained from J-mC cells. D: Distribution of integration sites on chromosome 17. The percentage of top 10 integration sites was shown. A total of 499 identified integration sites were obtained from chromosome 17. (E) Proportion of integration sites of J-mC cells in the indicated genomic regions. (F) The gene ontology analysis of HIV-1 integration sites detected in J-mC cells. (G) The GO pathway enrichment analysis of HIV-1 integration sites in J-mC cells.
Figure 6 with 3 supplements

High-throughput screening with the J-mC model identifies ACY-1215 as a potent latency reversing agent.
(A) Summary of screening results in J-mC cells. The results were shown as the percentage of the double positive cells and were normalized to the reactivation level of 50 ng/ml PMA. Each bar represents the average value of triplicates. (B) The chemical structure of ricolinostat (ACY-1215). (C) Reactivation effects of ACY-1215 on J-mC cells at the indicated concentrations. 0.5 million J-mC cells were stimulated with ACY-1215 for 3 days in each condition. Error bars represent SDs of three technical replicates. (D) Cell-associated HIV-1 mRNA expression of J-mC cells after ACY-1215 treatment. Data are representative of at least three independent experiments (mean ± SD). (E) ACY-1215 induced HIV-1 transcription in a primary CD4+ T cells model of HIV-1 latency. (F) Data from panel E are displayed graphically. Histograms show quantification of the percent population in the active gate. Values represent the mean ± SD, N = 3. **p<0.01. Results were analyzed by unpaired t-tests. (G) Quantification of ACY-1215 induced transcription of cell-associated HIV-1 mRNA in CD4+ T cells from ART-suppressed infected individuals. HIV-1 transcription was measured by HIV-1 viral quality assurance assay. 1 million CD4+ T cells were analyzed per condition. Data indicate mean ± SD for three technical replicates. p-values calculated using unpaired t-test, **p<0.01. (H) Fold induction of cell-associated HIV-1 mRNA was shown relative to the negative control (DMSO). Data indicate mean ± SD for three technical replicates. p-values calculated using unpaired t-test, **p<0.01.
-
Figure 6—source data 1
Characteristics of ART-suppressed, aviremic people living with HIV-1 (PLWH) in this study.
- https://cdn.elifesciences.org/articles/63810/elife-63810-fig6-data1-v2.docx
Figure 6—figure supplement 1
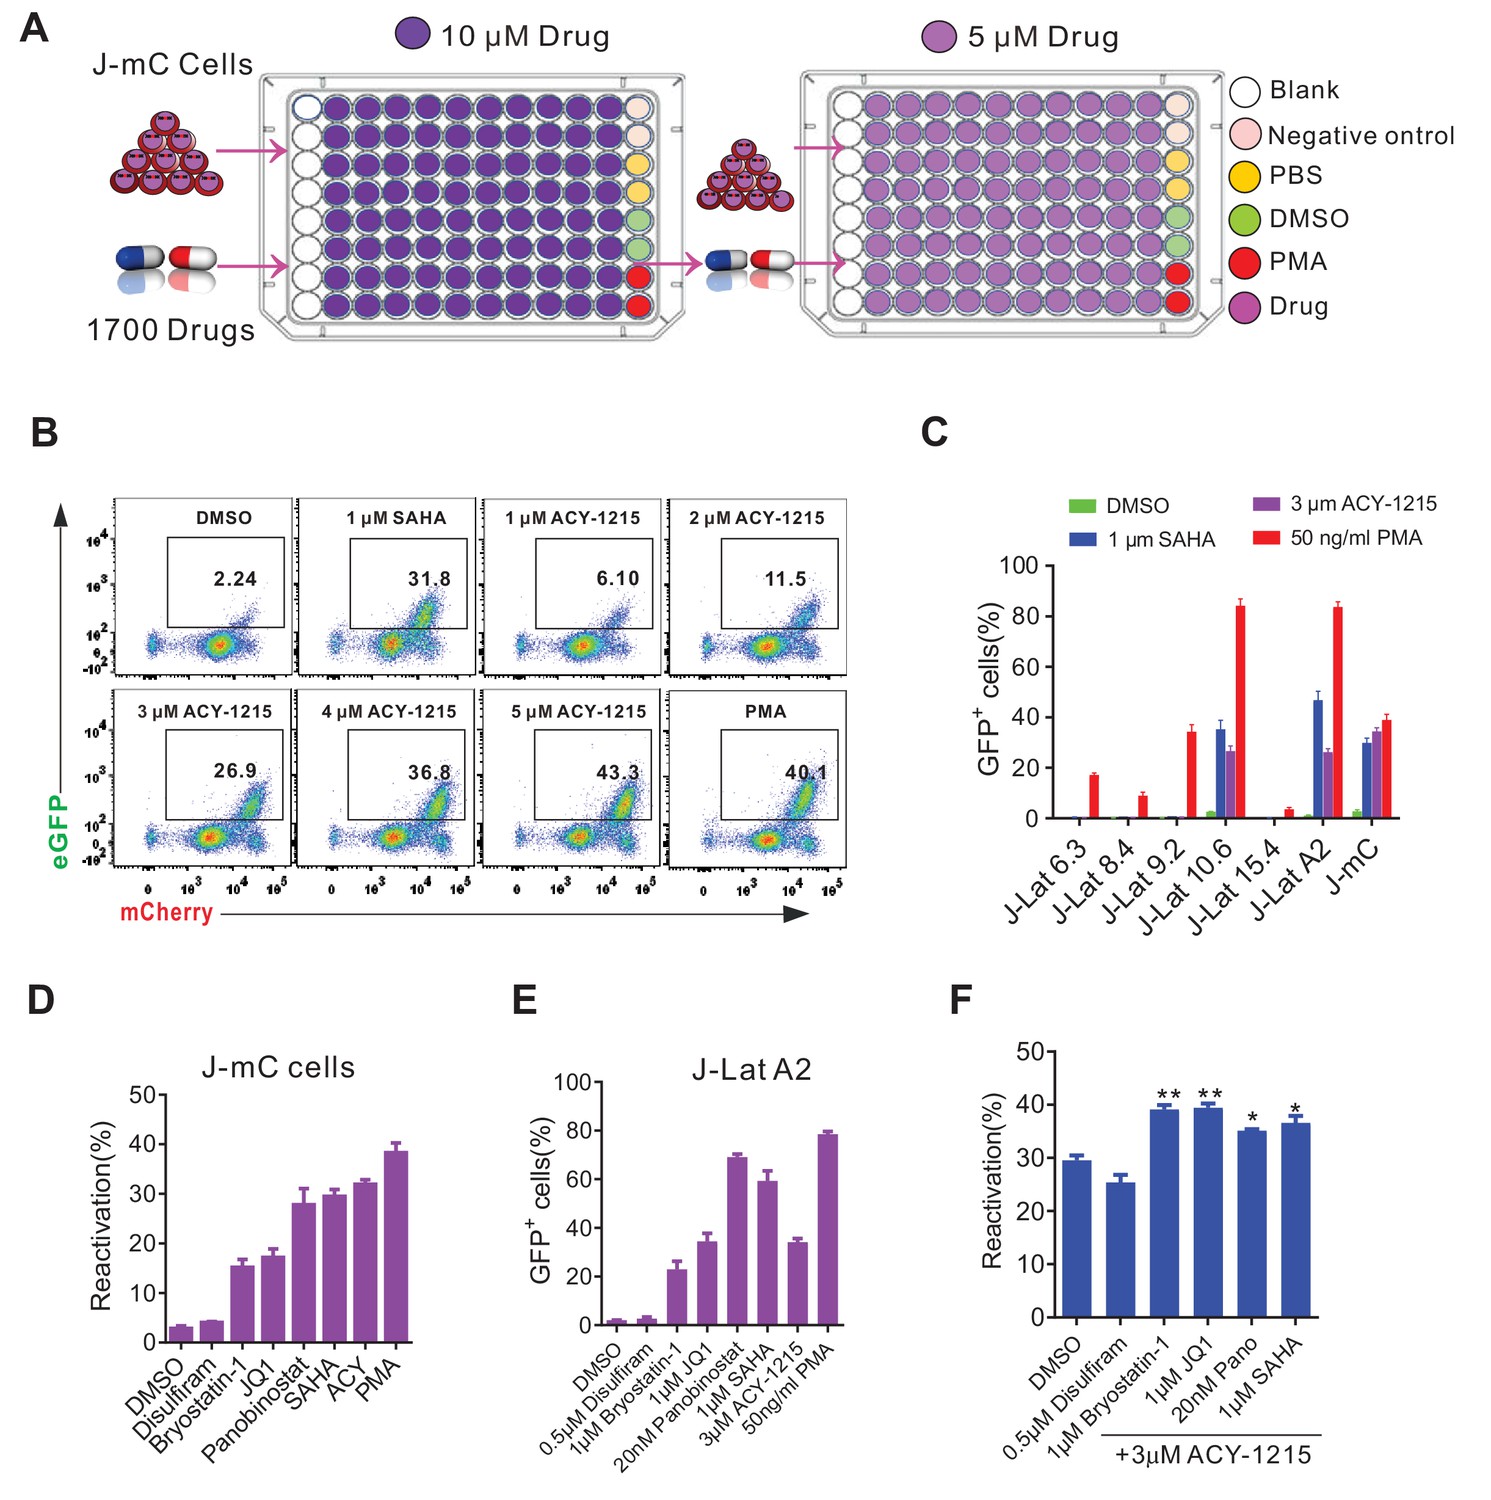
Reactivation effects of ACY-1215 on J-mC cells and J-Lat cells.
(A) Schematic layout of the compound screening. (B) Reactivation effects of ACY-1215 on J-mC cells at the indicated concentrations. (C) Reactivation potency of ACY-1215 in a series of J-Lat cell lines. Error bars represent SDs of three technical replicates. (D) Reactivation effects of ACY-1215 and other LRAs on J-mC cells. Error bars represent SDs of three technical replicates. (E) Reactivation effects of ACY-1215 and other LRAs on J-Lat A2 cells. Error bars represent SDs of three technical replicates. (F) Reactivation effects of ACY-1215 are synergistically enhanced by co-treatment with other LRAs in J-mC cells. Data are representative of three independent experiments. Error bars represent SDs of three technical replicates, p-values calculated using unpaired t-test, *p<0.05; **p<0.01.
Figure 6—figure supplement 2
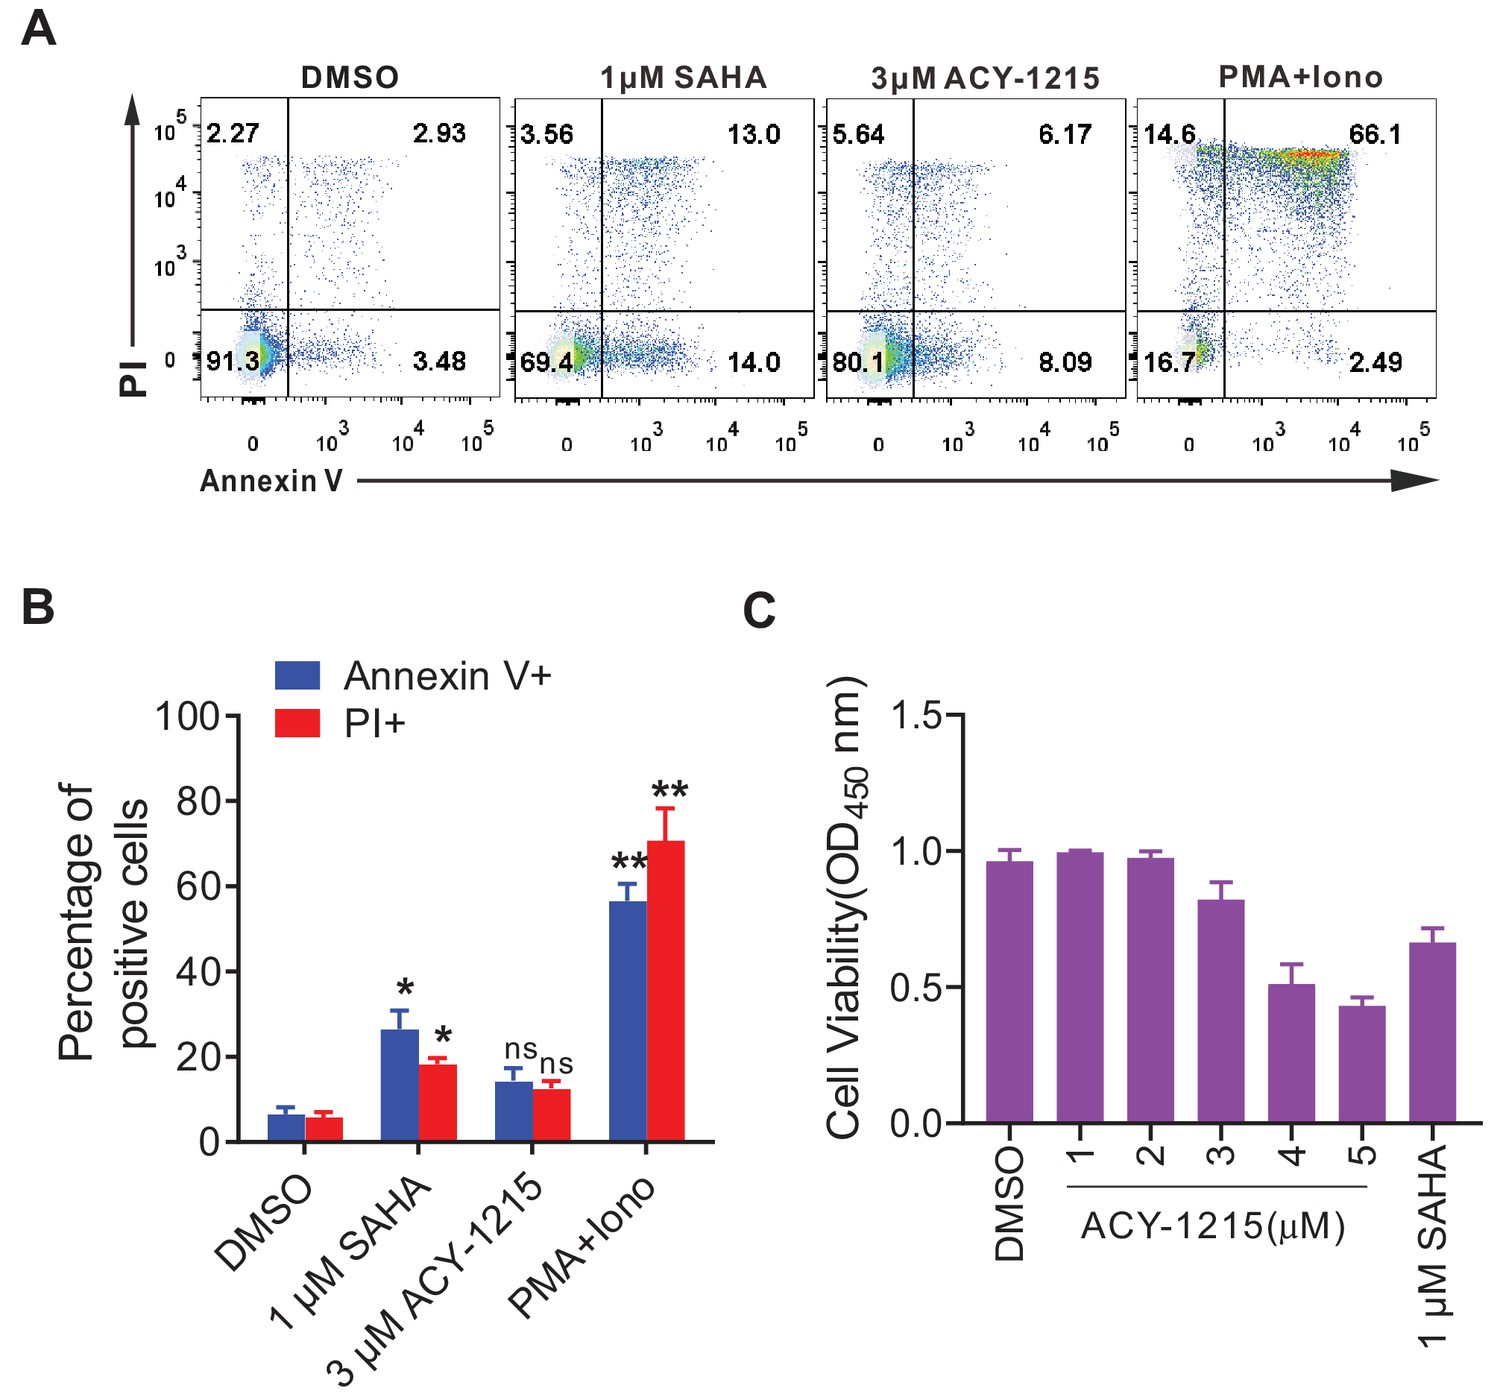
ACY-1215 did not cause apparent cytotoxicity.
(A) ACY-1215 did not significantly induce expression of apoptotic markers. Representative flow chart shows the expression of annexin V and propidium iodide (PI) in PBMCs. (B) Data from panel A is displayed graphically. Histograms show the percentage of positive cells. Error bars represent SDs of three technical replicates. p-values calculated using unpaired t-test, ns, not significant; *p<0.05, **p<0.01. (C) CCK-8 assays were used to determine cell viability in the ACY-1215 treated primary CD4+ T cells. Error bars represent SDs of three technical replicates.
Figure 6—figure supplement 3
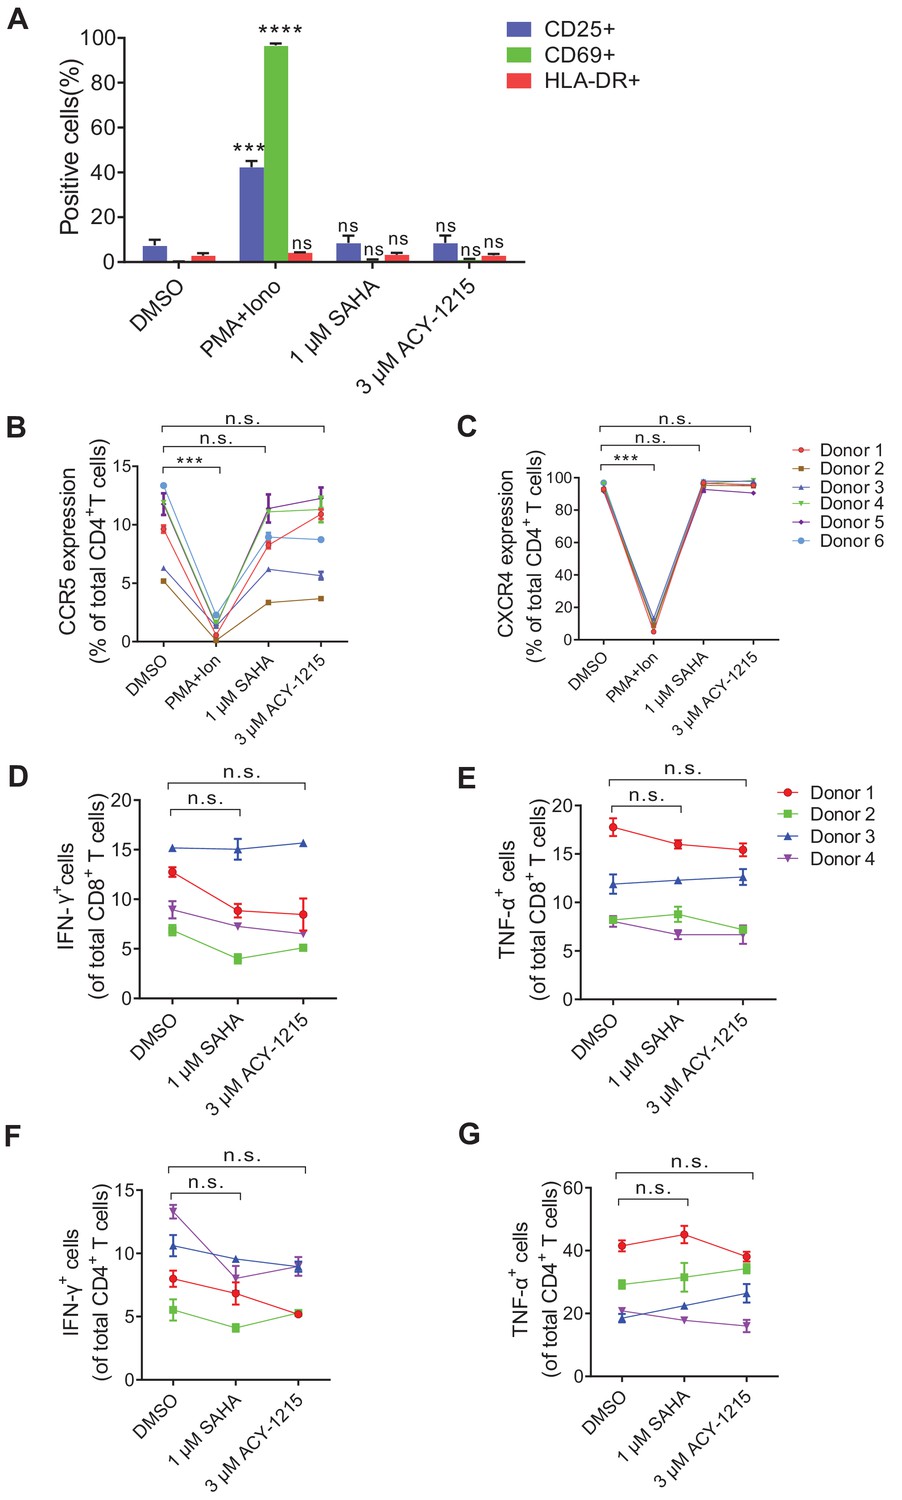
Effects of ACY-1215 on T cell biomarkers and function.
(A) ACY-1215 did not induce global activation of primary CD4+ T cells. Expressions of CD25, CD69, and HLA-DR were measured by flow cytometry. Data shown from three biological replicates (mean ± SD). p-values calculated using unpaired t-test, ns, not significant; ***p<0.001, ****p<0.0001. (B and C) ACY-1215 did not upregulate HIV-1 co-receptor CCR5 (B) and CXCR4 (C) expression. Data shown from three biological replicates (mean ± SD). p-values calculated using unpaired t-test, ns, not significant; ***p<0.001. (D and E) Effects of ACY-1215 on the cytokine secretion of CD8+ T cells. PBMCs isolated from HIV-1 naïve individuals were exposed to indicated treatment for 4 hr. Cells were then washed and cultured in fresh medium with PMA and ionomycin for 5 hr in the presence of brefeldin A. IFN-γ or TNF-α production in CD8+ T cells was measured by intracellular cytokine staining. Data is shown from three biological replicates (mean ± SD). p-values calculated using unpaired t-test, ns, not significant. (F and G) Effects of ACY-1215 on the cytokine secretion of CD4+ T cells. PBMCs isolated from HIV naïve individuals were exposed to indicated treatment for 4 hr. Cells were then washed and cultured in fresh medium with PMA and ionomycin for 5 hr in the presence of brefeldin A. IFN-γ or TNF-α production in CD4+ T cells was measured by intracellular cytokine staining. Data shown from three biological replicates (mean ± SD). p-values calculated using unpaired t-test, ns, not significant.
Author response image 1
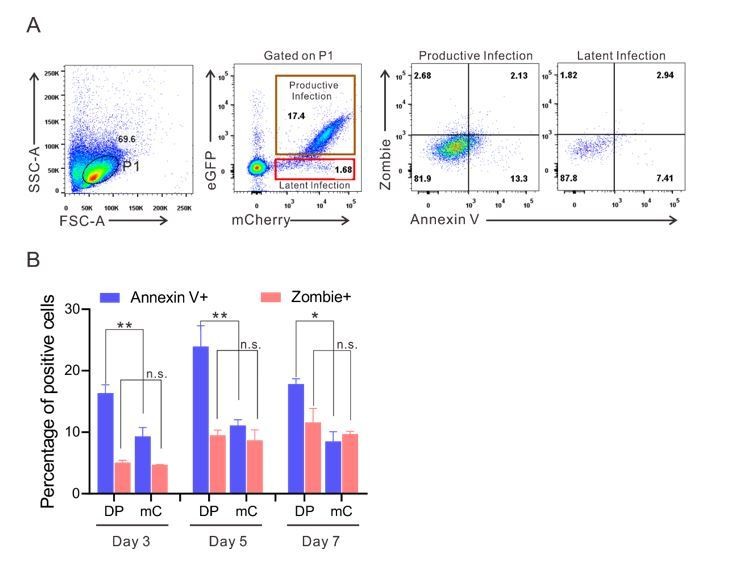
The expression of apoptotic markers on DP and mC cells during post-infection culturing of primary CD4+ T cells.
(A) The expression of apoptotic markers on DP and mC cells at 3 days post-infection. Flow cytometry chart shows the representative measurement of annexin V and zombie in DFV-B infected primary CD4+ T cells. (B) Data from Day 3, 5, 7 post-infection are displayed graphically on each indicated time point. Histograms show the percentage of positive cells. Error bars represent SDs of three technical replicates. p-values calculated using unpaired t test. ns, not significant; *p < 0.05, **p < 0.01.
Tables
Key resources table
| Reagent type (species) or resource | Designation | Source or reference | Identifiers | Additional information |
|---|---|---|---|---|
| Antibody | Anti-human CD4-FITC (mouse monoclonal) | Biolegend | Cat# 317408; RRID:AB_571951 | Dilution 1:1000 |
| Antibody | Anti-human CD8-APC (mouse monoclonal) | Biolegend | Cat# 301049; RRID:AB_2562054 | Dilution 1:1000 |
| Antibody | Anti-human Bcl2-AF647 (mouse monoclonal) | Biolegend | Cat# 658706; RRID:AB_2563280 | Dilution 1:1000 |
| Antibody | Anti-human CD69-APC (mouse monoclonal) | Biolegend | Cat# 310910; RRID:AB_314845 | Dilution 1:1000 |
| Antibody | Anti-human CD25-APC (mouse monoclonal) | Biolegend | Cat# 302610; RRID:AB_314280 | Dilution 1:1000 |
| Antibody | Anti-human HLA-DR-APC (mouse monoclonal) | Biolegend | Cat# 307610; RRID:AB_314688 | Dilution 1:1000 |
| Antibody | Anti-human PD-1-APC (mouse monoclonal) | Biolegend | Cat# 329908; RRID:AB_940475 | Dilution 1:1000 |
| Antibody | Anti-human LAG-3-APC (mouse monoclonal) | Biolegend | Cat# 369212; RRID:AB_2728373 | Dilution 1:1000 |
| Antibody | Anti-human CCR5-APC (mouse monoclonal) | Biolegend | Cat# 359122; RRID:AB_2564073 | Dilution 1:1000 |
| Antibody | Anti-human CXCR4-APC (mouse monoclonal) | Biolegend | Cat# 306510; RRID:AB_314616 | Dilution 1:1000 |
| Antibody | Anti-human IFN-γ-APC (mouse monoclonal) | Biolegend | Cat# 502512; RRID:AB_315237 | Dilution 1:1000 |
| Antibody | Anti-human TNF-α-APC (mouse monoclonal) | Biolegend | Cat# 502912; RRID:AB_315264 | Dilution 1:1000 |
| Antibody | Anti-HIV-1 p24 antibody (mouse monoclonal) | ABcam | Cat# ab9071; RRID:AB_306981 | Dilution 1:1000 |
| Antibody | Anti-HIV-1 Vif antibody (mouse monoclonal) | ABcam | Cat# ab66643; RRID:AB_1139534 | Dilution 1:1000 |
| Antibody | Anti-β-actin antibody (mouse monoclonal) | ABcam | Cat# ab8226; RRID:AB_306371 | Dilution 1:1000 |
| Antibody | Goat Anti-Mouse IgG H and L (Alexa Fluor 680) preadsorbed | ABcam | Cat# ab186694 | Dilution 1:20000 |
| Antibody | Purified anti-human CD3 Antibody (mouse monoclonal) | Biolegend | Cat# 300302; RRID:AB_314038 | Dilution 1:1000 |
| Antibody | Purified anti-human CD28 Antibody (mouse monoclonal) | Biolegend | Cat# 302902; RRID:AB_314304 | Dilution 1:1000 |
| Strain, strain background (Escherichia coli) | Stbl3 E. coli | ThermoFisher | Cat#C7381201 | |
| Biological sample (Homo sapiens) | Blood samples | Guangzhou Blood Center, Guangzhou | http://www.gzbc.org/ | Blood samples from healthy individuals |
| Biological sample (Homo sapiens) | Blood samples | The Fifth Affiliated Hospital, Sun Yat-sen University, Zhuhai, China | http://www.zsufivehos.com/ | Blood samples from HIV-1- infected individuals |
| Tissue culture media | RPMI 1640 | GIBCO | Cat# 11875093 | |
| Tissue culture media | DMEM | GIBCO | Cat# 11995065 | |
| Tissue culture media | Penicillin-Streptomycin Solution | BBI Life Sciences | Cat# E607011 | |
| Tissue culture media | 1 M Hepes Solution | BBI Life Sciences | Cat# E607018 | |
| Chemical compound, drug | DMSO | Sigma-Aldrich | Cat# D2650-100ML | |
| Chemical compound, drug | Disulfiram | Selleckchem | Cat# S1680 | |
| Chemical compound, drug | Bryostatin-1 | Sigma-Aldrich | Cat# B7431 | |
| Chemical compound, drug | Panobinostat | Selleckchem | Cat# S1030 | |
| Chemical compound, drug | ACY-1215 | Selleckchem | Cat# S8001 | |
| Chemical compound, drug | (+)-JQ-1 | Selleckchem | Cat#S7110 | |
| Chemical compound, drug | SAHA | Selleckchem | Cat#S1047 | |
| Chemical compound, drug | Approved Drug Library | TargetMOI | Cat# L1000 | |
| Chemical compound, drug | Phorbol 12-myristate 13-acetate (PMA) | Selleckchem | Cat#S7791 | |
| Chemical compound, drug | Ionomycin | MERCK | at#407952–5 MG | |
| Chemical compound, drug | Phytohemagglutinin-M(PHA-M) | Sigma-Aldrich | Cat#11082132001 | |
| Chemical compound, drug | TRIzol Reagent | ThermoFisher | Cat#15596018 | |
| Chemical compound, drug | Propidium Iodide (PI) | Biolegend | Cat# 421301 | |
| Chemical compound, drug | Annexin-V-APC | Biolegend | Cat# 640941; RRID:AB_2616657 | |
| Recombinant proteins | Recombinant Human TNF-a | PeproTech | Cat#300-01A | |
| Recombinant proteins | Recombinant Human IL-2 | R and D Systems | Cat#202-IL-500 | |
| Critical commercial assays | Human CD4+T Lymphocyte Enrichment Set-DM | BD Biosciences | Cat#557939 | |
| Critical commercial assays | HIV-1 p24 ELISA Kit | Abcam | Cat#ab218268 | |
| Critical commercial assays | Cell Counting Kit-8 | MedChemExpress | Cat# HY-K0301 | |
| Critical commercial assays | Plasmid Mini Kit | OMEGA | Cat# D6943-02 | |
| Critical commercial assays | Endo-free Plasmid Mini Kit | OMEGA | Cat# D6950-02 | |
| Critical commercial assays | Gel Extraction | OMEGA | Cat# D2500-02 | |
| Critical commercial assays | Cycle-Pure Kit | OMEGA | Cat# D6492-02 | |
| Critical commercial assays | Tissue DNA kit | OMEGA | Cat# D3396-02 | |
| Cell line (Homo sapiens) | HEK293T | ATCC | CRL-3216; RRID:CVCL_0063 | |
| Cell line (Homo sapiens) | J-Lat 6.3 | NIH AIDS Reagents Program (Jordan et al., 2003) | Cat# 9846; RRID:CVCL_8280 | |
| Cell line (Homo sapiens) | J-Lat 8.4 | NIH AIDS Reagents Program (Jordan et al., 2003) | Cat#9847; RRID:CVCL_8284 | |
| Cell line (Homo sapiens) | J-Lat 9.2 | NIH AIDS Reagents Program (Jordan et al., 2003) | Cat# 9848; RRID:CVCL_8285 | |
| Cell line (Homo sapiens) | J-Lat 10.6 | NIH AIDS Reagents Program (Jordan et al., 2003) | Cat#9849; RRID:CVCL_8281 | |
| Cell line (Homo sapiens) | J-Lat 15.4 | NIH AIDS Reagents Program (Jordan et al., 2003) | Cat# 9850; RRID:CVCL_8282 | |
| Cell line (Homo sapiens) | J-Lat A2 | NIH AIDS Reagents Program (Jordan et al., 2003) | Cat#9867; RRID:CVCL_1G43 | |
| Software | Prism 6 | GraphPad | https://www.graphpad.com/scientific-software/prism/; RRID:SCR_002798 | |
| Software | BD LSRFortessa cell analyzer | BD Biosciences | http://www.bdbiosciences.com/in/instruments/lsr/index.jsp; RRID:SCR_018655 | |
| Software | FlowJo V10 | Tree Star | https://www.flowjo.com/; RRID:SCR_008520 | |
| Software | GloMax 96 Microplate Luminometer Software | Promega | https://www.promega.com/resources/softwarefirmware/; RRID:SCR_018614 | |
| Sequence-based reagent | HIV-1-VQA-F | This paper | PCR primers | CAGATGCTGCATATAAGCAGCTG |
| Sequence-based reagent | HIV-1-VQA-R | This paper | PCR primers | TTTTTTTTTTTTTTTTTTTTTTTTGAAGCAC |
| Sequence-based reagent | HIV-1-VQA-Probe | This paper | PCR primers | FAM-CCTGTACTGGGTCTCTCTGG-MGB |
| Sequence-based reagent | qPCR-GFP-F | This paper | PCR primers | GTGCAGTGCTTCAGCCGCTACC |
| Sequence-based reagent | qPCR-GFP-R | This paper | PCR primers | ACCTCGGCGCGGGTCTTGTA |
| Sequence-based reagent | qPCR-mCherry-F | This paper | PCR primers | GTGGTGACCGTGACCCAGGACT |
| Sequence-based reagent | qPCR-mCherry-R | This paper | PCR primers | TGGTCTTGACCTCAGCGTCGTAGTG |
| Sequence-based reagent | qPCR-GAPDH-F | This paper | PCR primers | CTCTGCTCCTCCTGTTCGAC |
| Sequence-based reagent | qPCR-GAPDH-R | This paper | PCR primers | AGTTAAAAGCAGCCCTGGTGA |
| Sequence-based reagent | HIV-1-gag-F | This paper | PCR primers | ACATCAAGCAGCCATGCAAAT |
| Sequence-based reagent | HIV-1-gag-R | This paper | PCR primers | TCTGGCCTGGTGCAATAGG |
| Sequence-based reagent | HIV-1-tat-F | This paper | PCR primers | ATGGAGCCAGTAGATCCTAGAC |
| Sequence-based reagent | HIV-1-tat-R | This paper | PCR primers | CGCTTCTTCCTGCCATAGG |
| Sequence-based reagent | HIV-1-vif-F | This paper | PCR primers | CACACAAGTAGACCCTGACCT |
| Sequence-based reagent | HIV-1-vif-R | This paper | PCR primers | CCCTACCTTGTTATGTCCTGCT |
| Sequence-based reagent | HIV-1-LTR-F | This paper | PCR primers | CCACAAAGGGAGCCATACAATG |
| Sequence-based reagent | HIV-1-LTR-R | This paper | PCR primers | TTATGGCTTCCACTCCTGCC |
Additional files
-
Supplementary file 1
HIV-1 integration sites of J-Lat 8.4 and J-Lat 15.4.
- https://cdn.elifesciences.org/articles/63810/elife-63810-supp1-v2.xlsx
-
Supplementary file 2
HIV-1 integration sites of J-mC cells.
- https://cdn.elifesciences.org/articles/63810/elife-63810-supp2-v2.xlsx
-
Transparent reporting form
- https://cdn.elifesciences.org/articles/63810/elife-63810-transrepform-v2.pdf
Download links
A two-part list of links to download the article, or parts of the article, in various formats.
Downloads (link to download the article as PDF)
Open citations (links to open the citations from this article in various online reference manager services)
Cite this article (links to download the citations from this article in formats compatible with various reference manager tools)
Infection with a newly designed dual fluorescent reporter HIV-1 effectively identifies latently infected CD4+ T cells
eLife 10:e63810.
https://doi.org/10.7554/eLife.63810


