The tricuspid valve also maladapts as shown in sheep with biventricular heart failure
- Department of Biomedical Engineering, The University of Texas at Austin, United States
- Department of Mechanical Engineering, The University of Texas at Austin, United States
- Division of Cardiothoracic Surgery, Spectrum Health, United States
- Department of Cardiac Surgery, Medical University of Silesia, School of Medicine in Katowice, Poland
- Department of Cardiac, Vascular and Endovascular Surgery and Transplantology, Medical University of Silesia in Katowice, Silesian Centre for Heart Diseases, Poland
- Department of Chemical Engineering, Texas Tech University, United States
- Department of Aerospace Engineering and Engineering Mechanics, The University of Texas at Austin, United States
Figures
Figure 1 with 1 supplement
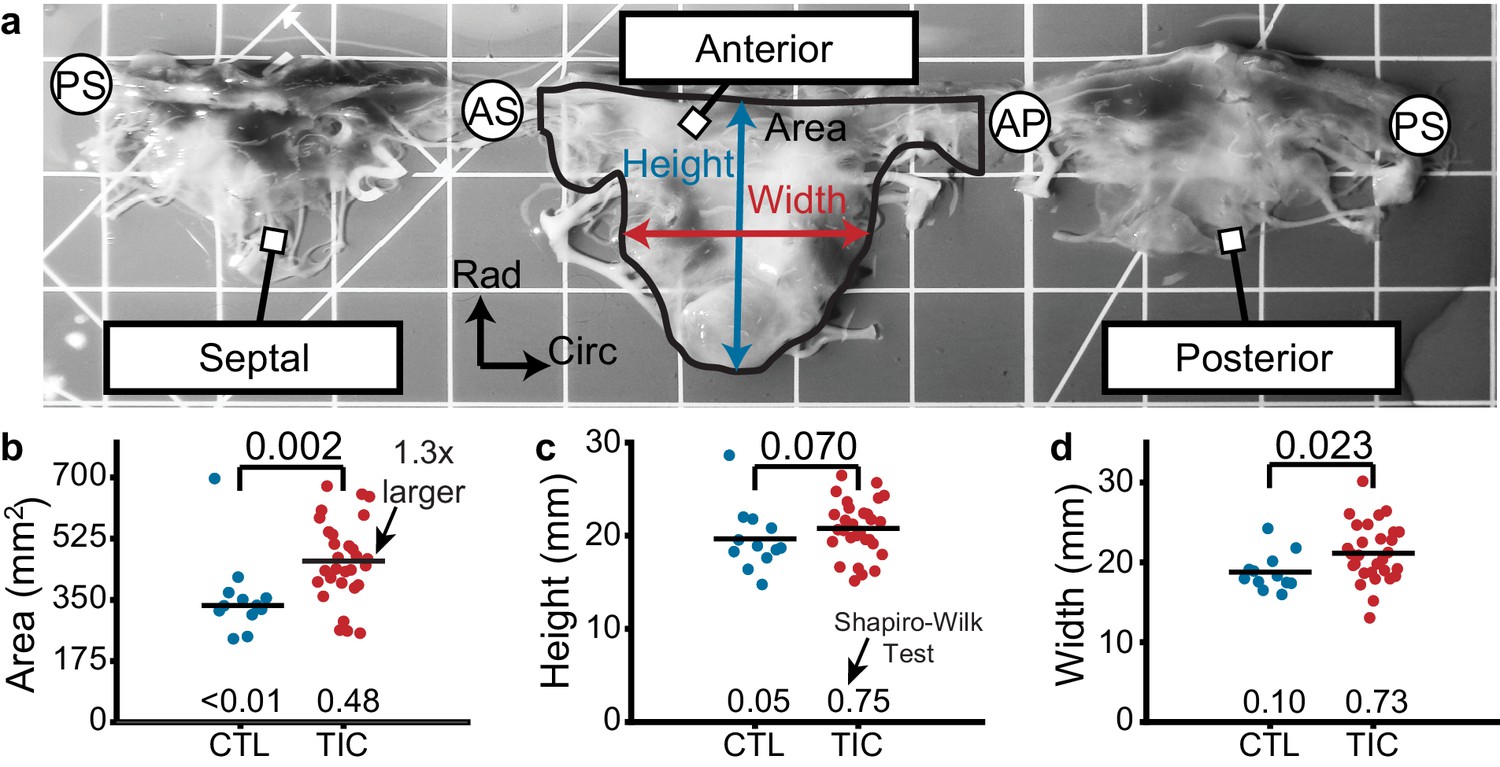
Tricuspid valve anterior leaflet area increases in sheep with tachycardia-induced cardiomyopathy (TIC).
(a) An ovine tricuspid valve separated at the posterior-septal commissure (PS). Located between the antero-septal (AS) and antero-posterior (AP) commissures, the anterior leaflet and its measured area (black), height (blue), and width (red) are shown. Grid scale = 1 cm. (b–d) Comparisons between control (CTL, blue, n = 12) and TIC (red, n = 29) anterior leaflet (b) area, (c) height, and (d) width. Black bars represent data mean if normal, and data median if non-normal as determined by Shapiro-Wilk test: p-values below data. Values above data represent p-values from Student’s t-test or Wilcoxon Rank-Sum test, as appropriate.
Figure 1—figure supplement 1

Tricuspid valve anterior leaflet area change does not correlate with animal weight.
Correlations between animal weight and anterior leaflet area with correlation coefficient, r, and p-value for tachycardia-induced cardiomyopathy (TIC, red, n = 12, Pearson), and control (CTL, blue, n = 29, Spearman) to ensure the changes we observed in leaflet area were not the result of animal weights.
Figure 2
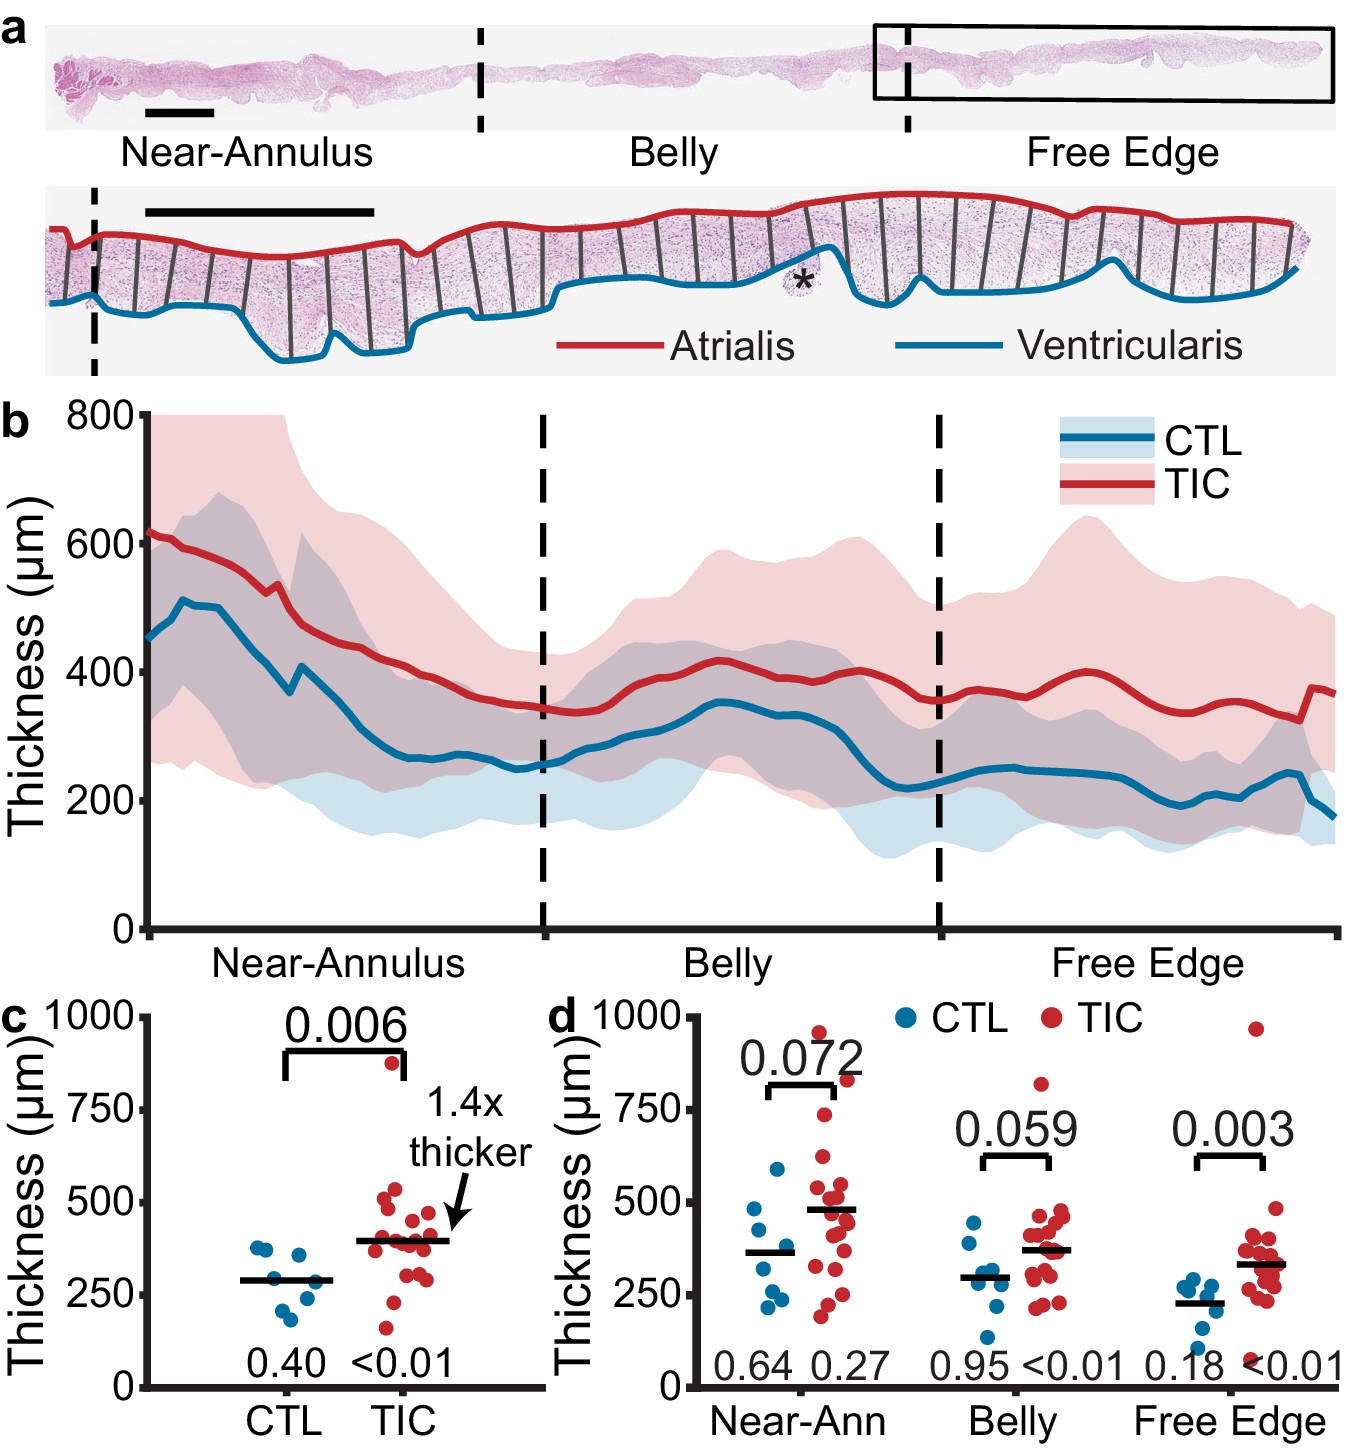
Anterior leaflet thickness increases in tachycardia-induced cardiomyopathy (TIC) are primarily driven by free edge thickening.
(a) (top) Representative fixed radial tissue strip approximated into regions of near-annulus, belly, and free edge. Inscribed box (black) is magnified (below) to show thickness measurement between atrialis (red) and ventricularis (blue) splines. Chordae tendineae (*) were excluded manually. Scale bars = 1 mm. (b) Profiles of control (CTL, blue, n = 8) and TIC (red, n = 19) anterior leaflet thickness approximated into equal-third regions of near-annulus, belly, and free edge. Pictured are mean (solid) +/- 1 standard deviation (shaded). (c–d) Thickness comparisons between CTL and TIC groups when data is (c) pooled across all regions and (d) pooled within regions. Black bars represent data mean if normal, and data median if non-normal as determined by Shapiro-Wilk’s test: p-values below data. Values above data represent p-values from Student’s t-test or Wilcoxon Rank-Sum test, as appropriate.
Figure 3 with 1 supplement
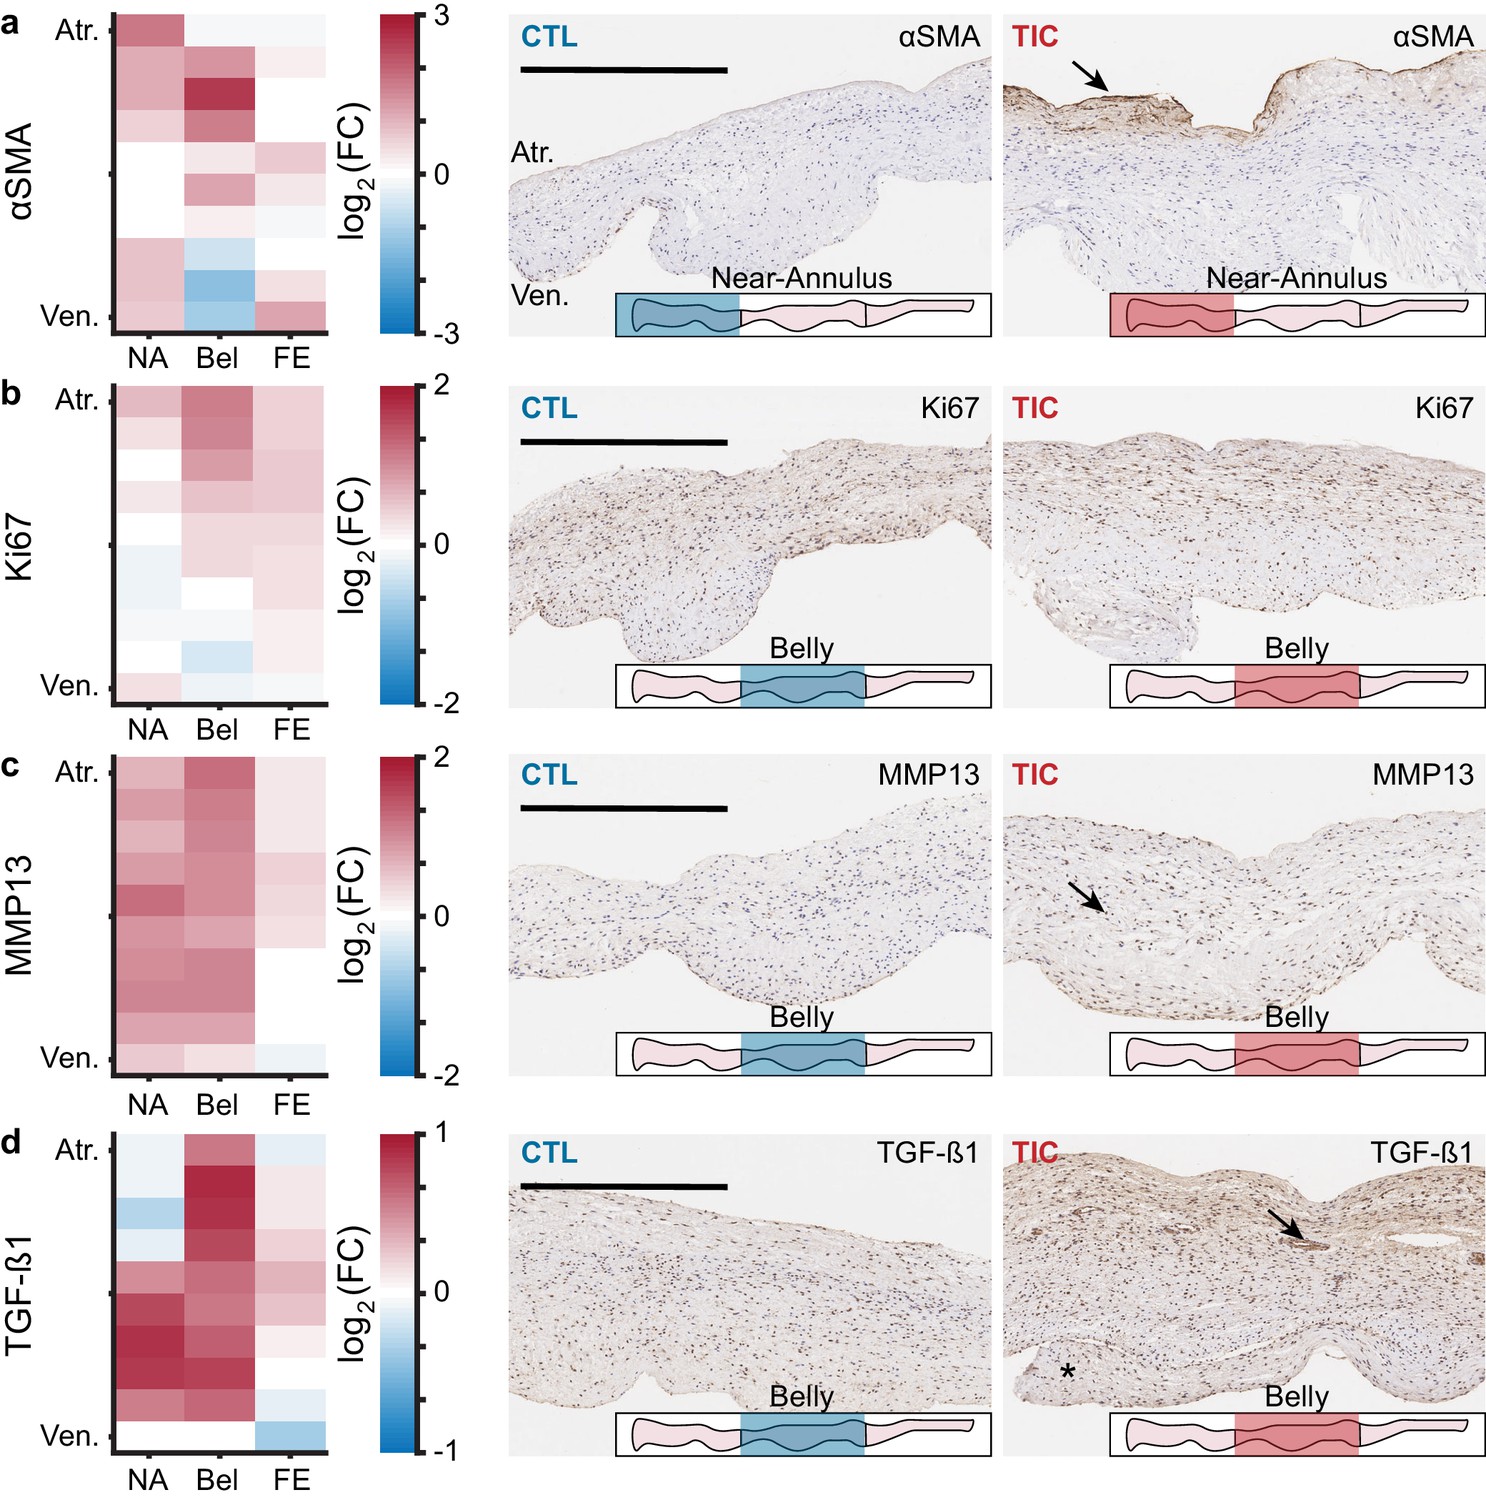
Remodeling cellular markers present in tarchycardia-induced cardiomyopathy (TIC) tissues.
(a–d) Heat maps (left) showing regional expression of (a) alpha smooth muscle actin (αSMA), (b) Ki67, (c) matrix metalloproteinase 13 (MMP13), (d) transforming growth factor beta 1 (TGF-β1). Heat maps are separated by regions in radial (near-annulus (NA), belly (Bel), and free edge (FE)) and thickness (atrialis (Atr.), and ventricularis (Ven.)) axes. Fold change (FC) between control (CTL, n = 6) and TIC (n = 6) was determined by the ratio of positively stained pixel percentage between TIC and CTL. Color map indicates the logarithm base 2 of the fold change, interpreted as (positive, red): TIC expression is higher than CTL, (0, white): TIC and CTL expression are approximately equal, and (negative, blue): TIC expression is less than CTL. Representative images of CTL (middle) and TIC (right) are shown with atrialis surface upward. Black arrows indicate (a) increased TIC αSMA expression near the atrialis, (c) increase in TIC positively stained nuclei for MMP13, and (d) ‘pocket’ may be a neo-microvessel. Note, positive TGF-β1 staining in this pocket may be related to angiogenic signaling. Asterisk (*) denotes chordae tendineae excluded from analysis. Scale bars = 500 μm.
Figure 3—figure supplement 1
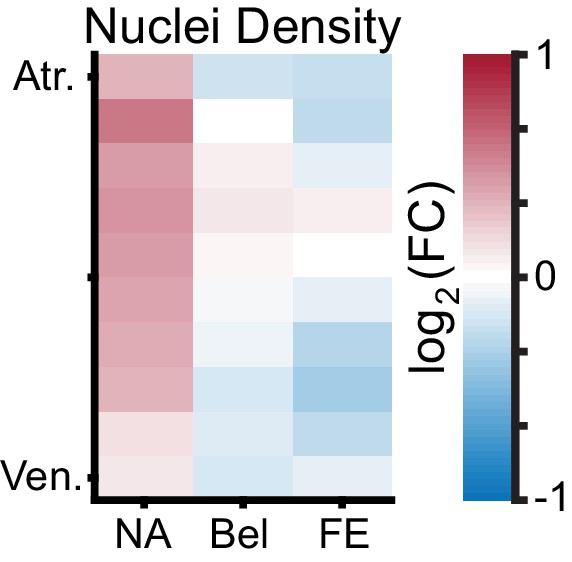
Marginal changes in TIC cellular nuclei density.
Heat maps showing regional changes in cell nuclei density. Heat map is separated by regions in radial (near-annulus (NA), belly (Bel), and free edge (FE)) and thickness (atrialis (Atr.), and ventricularis (Ven.)) axes. Fold change (FC) between control (CTL, n = 5) and TIC (n = 19) was determined by the ratio of nuclei densities for each group. Color map indicates the logarithm base 2 of the FC, interpreted as: (positive, red) TIC nuclei density is higher than CTL, (0, white) TIC and CTL nuclei density are approximately equal, and (negative, blue) TIC nuclei density is less than CTL.
Figure 4 with 1 supplement
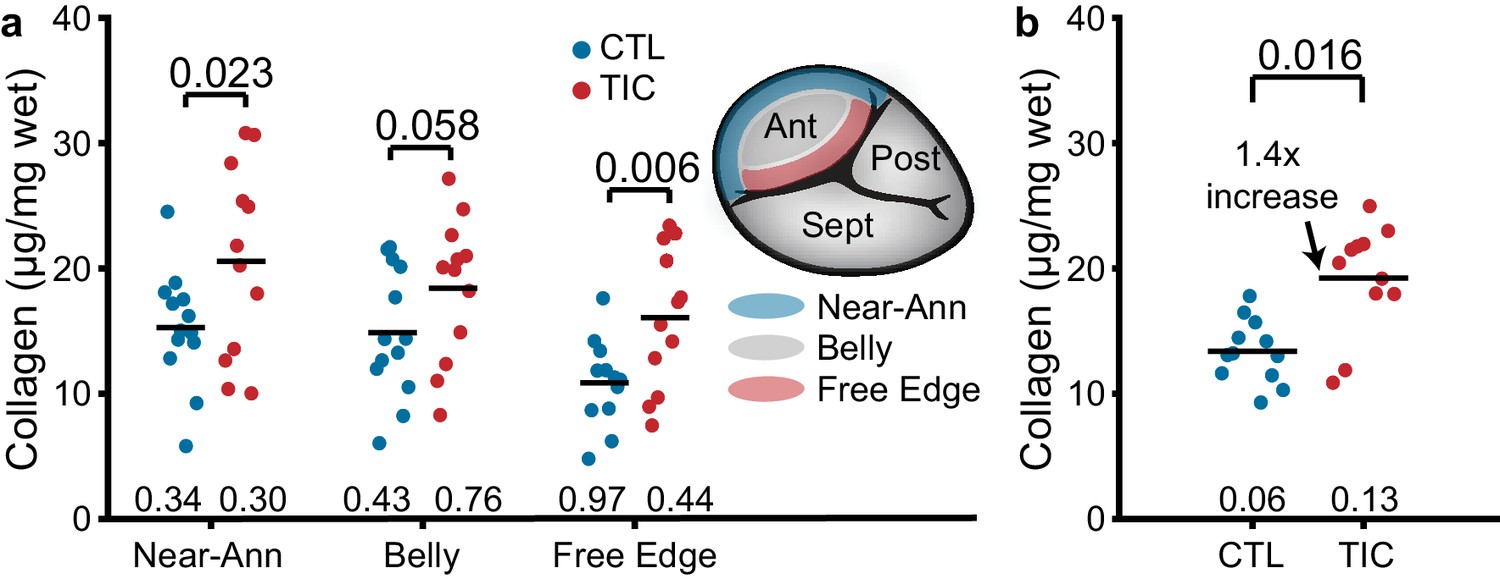
Increased collagen content in tachycardia-induced cardiomyopathy (TIC) anterior leaflets is primarily driven by increases in the near-annulus and free edge.
(a) Wet weight collagen content from quantitative collagen assay comparisons between control (CTL, blue, n = 12) and TIC (red, n = 12) groups with tissue samples from near-annulus, belly, and free edge regions with inscribed region visualization on tricuspid valve anterior leaflet, and (b) when regions are averaged across subjects. Black bars represent data mean if normal, and data median if non-normal as determined by Shapiro-Wilk test: p-values below data. Values above data represent p-values from Student’s t-test.
Figure 4—figure supplement 1
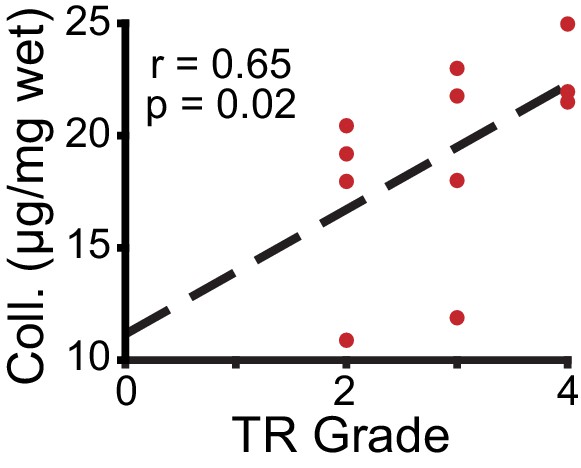
Collagen content positively correlates with clinical echocardiographic metric of tricuspid regurgitation (TR) severity.
Spearman correlation between echocardiography acquired TR grade (i.e., severity) with wet weight collagen content (Coll.) in tachycardia-induced cardiomyopathy (TIC, n = 12) subjects. Correlation coefficients (r) and p-values are inscribed along with a linear fit (black, dashed) for visualization.
Figure 5 with 1 supplement
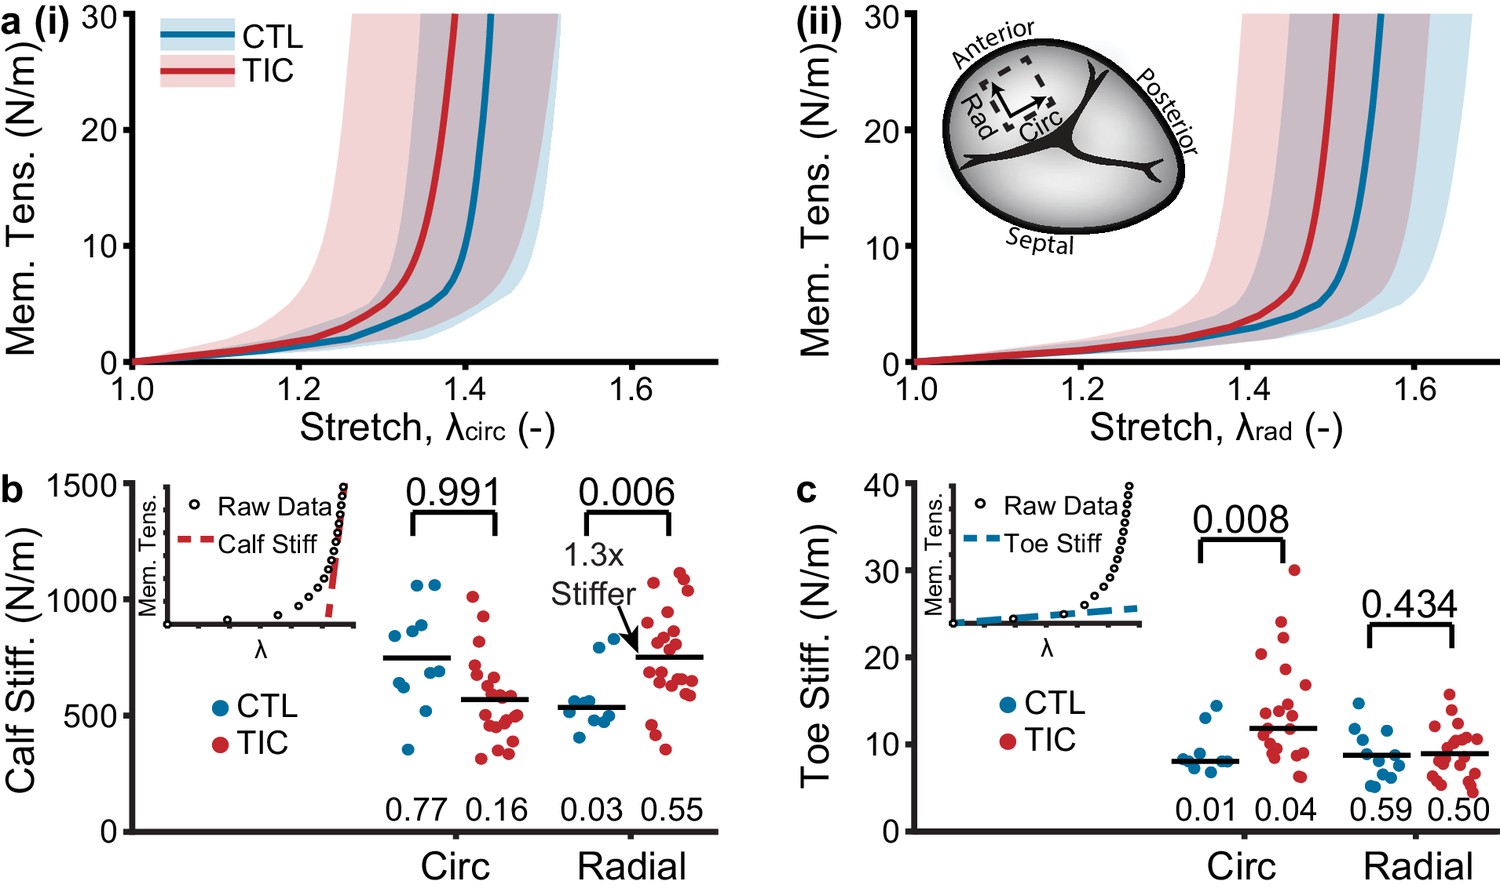
Tachycardia-induced cardiomyopathy (TIC) anterior leaflets are stiffer in circumferential (circ) and radial (rad) directions.
(a) Control (CTL, blue, n = 11) and TIC (red, n = 23) membrane tension (Mem. Tens.) vs. stretch average curves (solid) with standard deviation (shaded) in (i) circumferential and (ii) radial directions. Inset in (a) is a visualization of where biaxial samples were acquired (dotted line) from anterior leaflets. (b–c) Comparisons of the (b) stiffness at large stretches (calf stiffness) and (c) stiffness at small stretches (toe stiffness) in circumferential and radial directions. Inset in (b) and (c) is the definition of calf stiffness (red, dashed) and toe (blue, dashed) we use to characterize a nonlinear material stiffness. Black bars represent data mean if normal and data median if non-normal as determined by Shapiro-Wilk test: p-values below data. Values above data represent p-values from Student’s t-test or Wilcoxon Rank-Sum test, as appropriate.
Figure 5—figure supplement 1
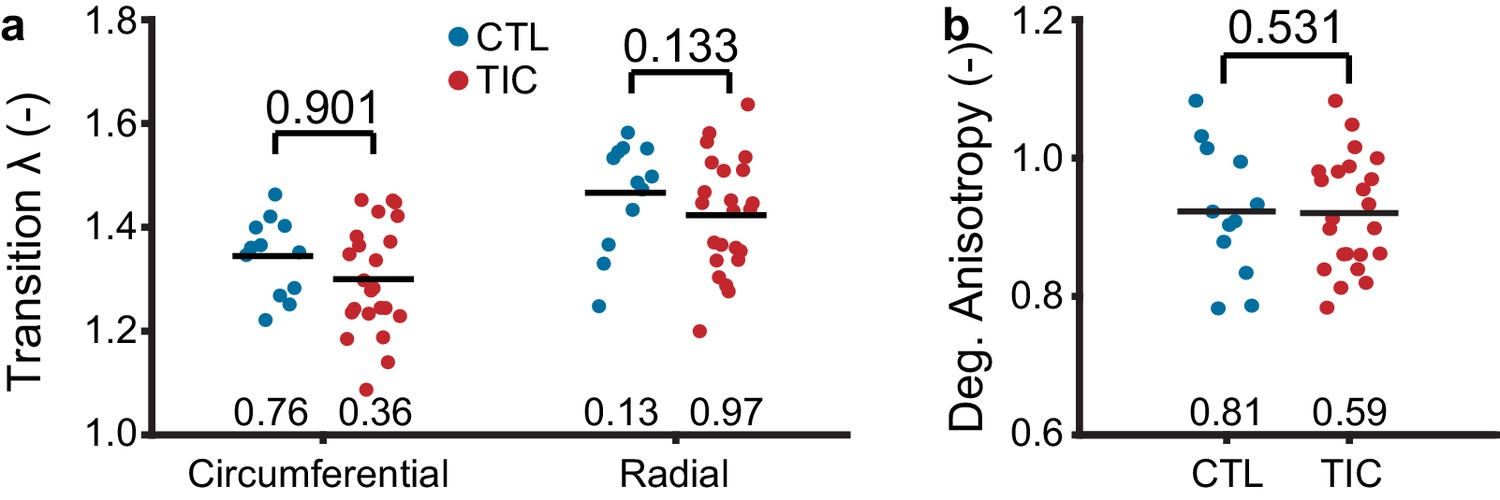
Biaxial curves between control (CTL, blue, n = 11) and tachycardia-induced cardiomyopathy (TIC, red, n = 23) exhibited comparable anisotropies.
(a) Comparisons of the transition stretch in circumferential and radial directions, defined as the stretch at which collagen engagement begins (i.e, the heel stretch). (b) Comparisons of the degree of anisotropy, defined as the ratio between circumferential and radial stretches at which 20 N/m membrane tensions are achieved under equibiaxial loading. Black bars represent data mean if normal, and data median if non-normal as determined by Shapiro-Wilk test: p-values below data. Values above data represent p-values from Student’s t-test.
Figure 6 with 1 supplement
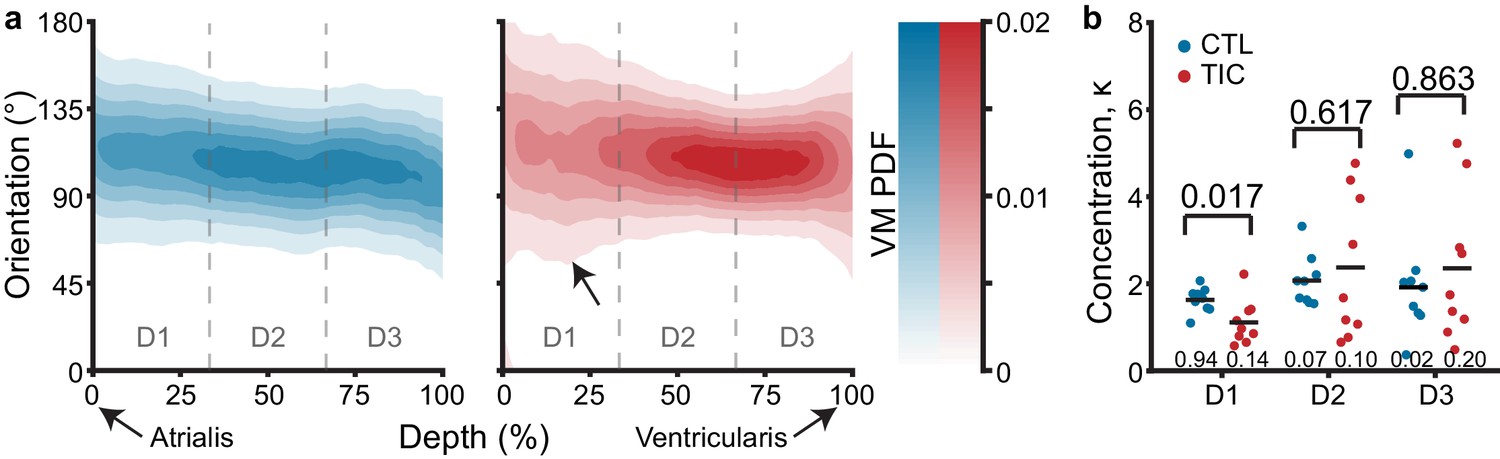
Through-depth collagen microstructure reveals similar mean orientations and regional concentration changes throughout depth between control (CTL) and tachycardia-induced cardiomyopathy (TIC).
(a) Heat map visualizations of von Mises probability distribution functions (VM PDF) fit to the collagen fiber orientation histograms of two-photon acquired images throughout the entire depth (0% - Atrialis surface, 100% - Ventricularis surface) of averaged CTL (blue, n = 9) and TIC (red, n = 9) tissue samples. Orientations of 90° align circumferentially, while 0°/180° align radially. We observed qualitative regional concentration (i.e., heat map width) differences (arrow), which we quantified by (b) averaging VM concentration parameter, κ, across depth regions D1, D2, and D3, by subject. Black bars represent data mean if normal, and data median if non-normal as determined by Shapiro-Wilk test: p-values below data. Values above data represent p-values from Student’s t-test, Welch’s t-test or Wilcoxon Rank-Sum, as appropriate.
Figure 6—figure supplement 1
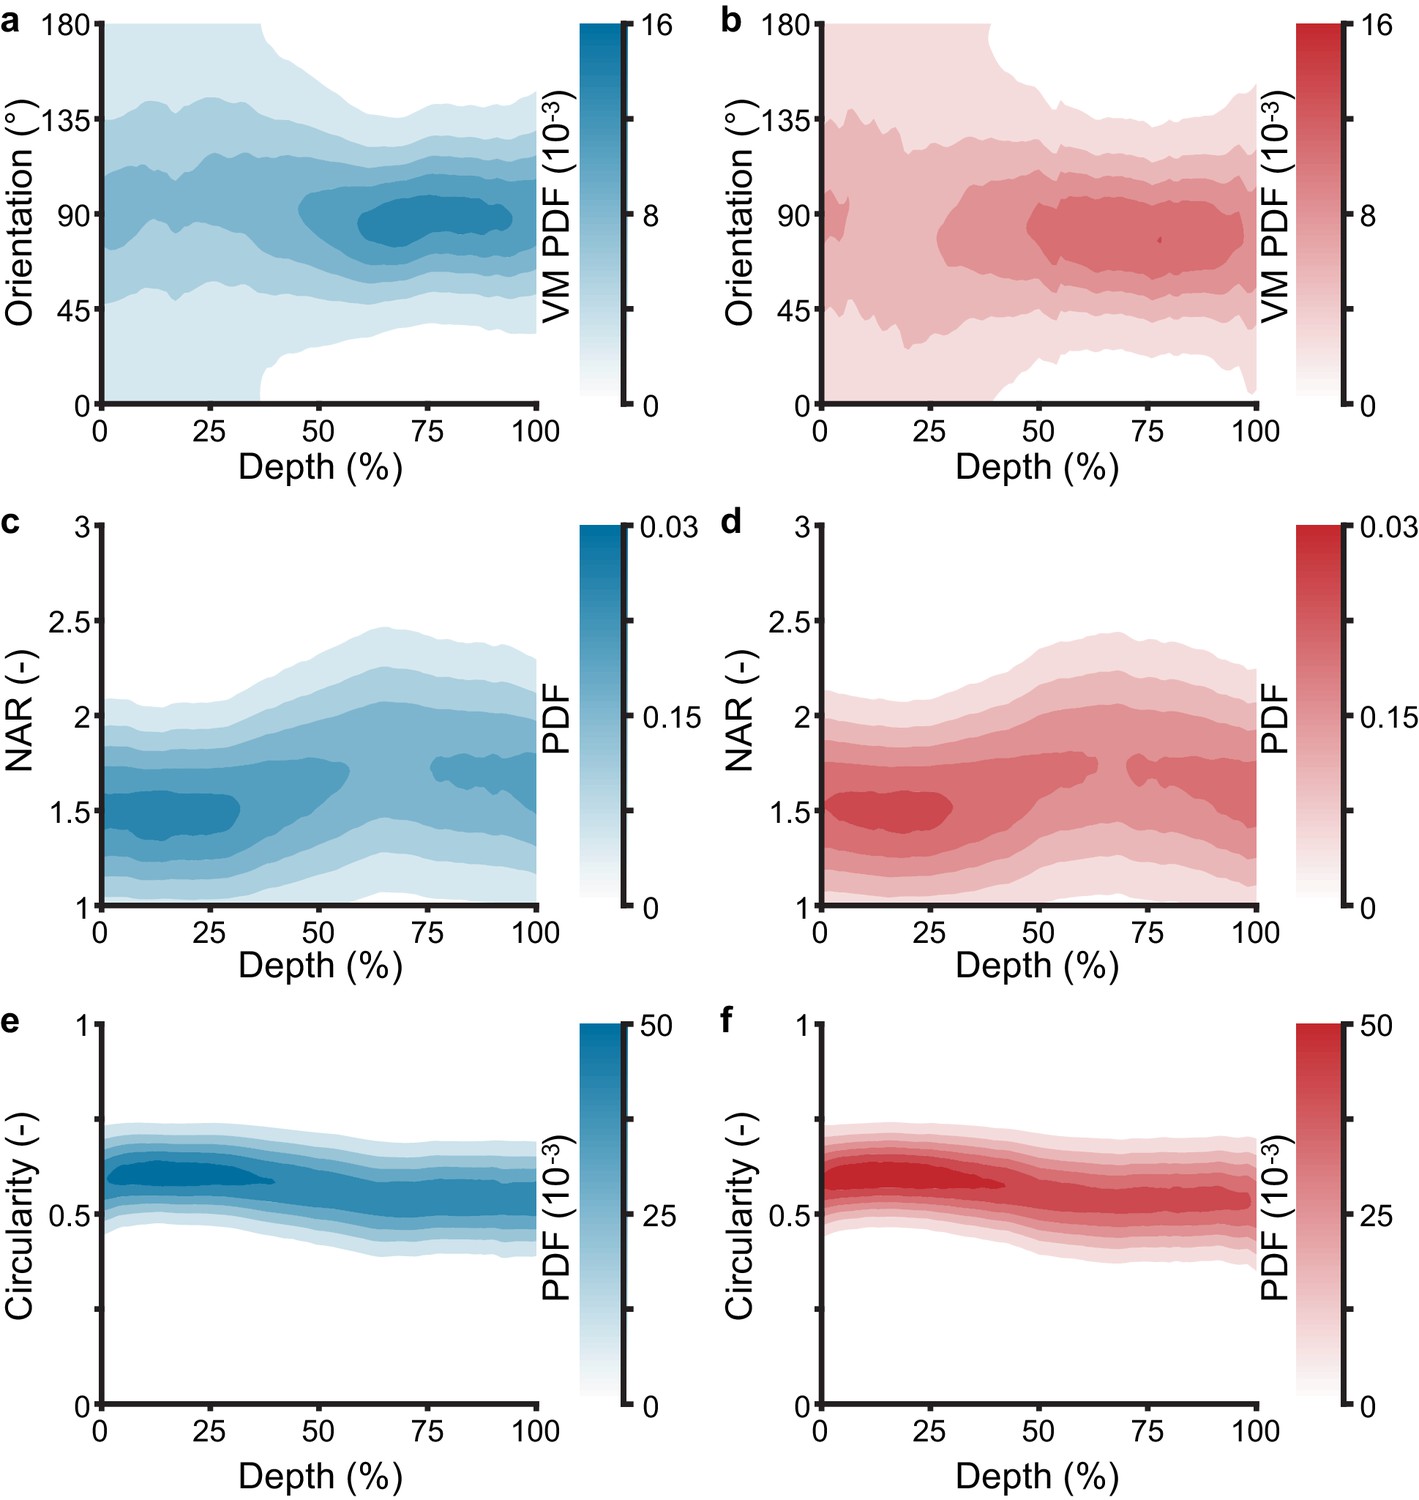
Through-depth nuclei microstructure reveals similar nuclei orientation, nuclear aspect ratio (NAR) and circularity throughout depth between control (blue, n = 9) and tachycardia-induced cardiomyopathy (red, n = 9).
(a-f) Heat map visualizations of von Mises probability distribution functions (VM PDF) and normal probability distribution functions (PDF) fit to the nuclei (a,b) orientation, (c,d) NAR, and (e,f) circularity histograms of two-photon acquired images throughout the entire depth (0% - Atrialis surface, 100% - Ventricularis surface) of averaged (a,c,e) control and (b,d,f) tachycardia-induced cardiomyopathy tissue samples. Orientations of 90° align circumferentially, while 0°/180° align radially. Nuclei microstructure remained qualitatively similar between groups with no significant findings.
Appendix 1—figure 1
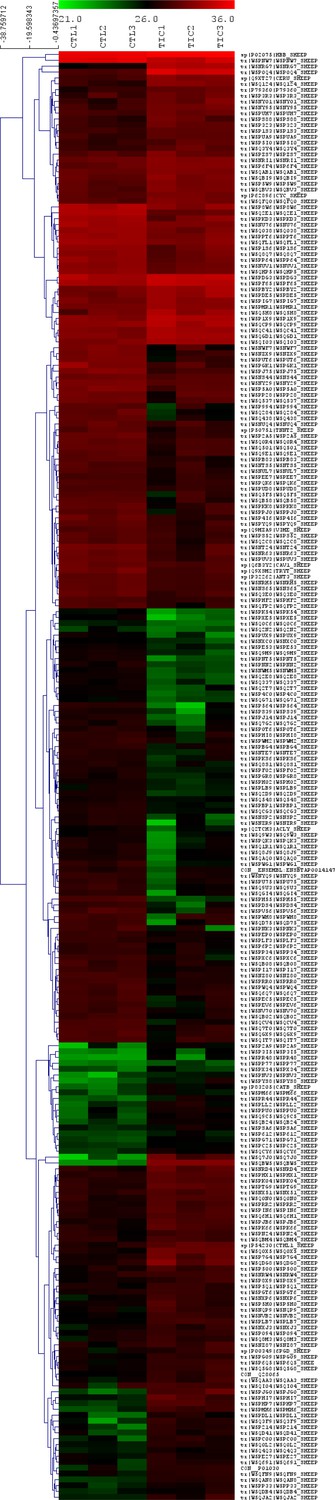
Proteomics revealed 247 differentially expressed proteins in tachycardia-induced cardiomyopathy (TIC) tricuspid anterior leaflets.
Heat map showing expression of significant (p<0.05, fold change >2) differentially expressed proteins between control (CTL, left three columns, n = 3) and TIC (right three columns, n = 3) groups. Each column represents a biological replicate within each group. Each row represents a protein, as marked by their uniport identifiers. Red, black and green correspond to high, medium and low intensity values, respectively. Proteins are clustered according to similarities in expression patterns and total intensities.
Appendix 1—figure 2
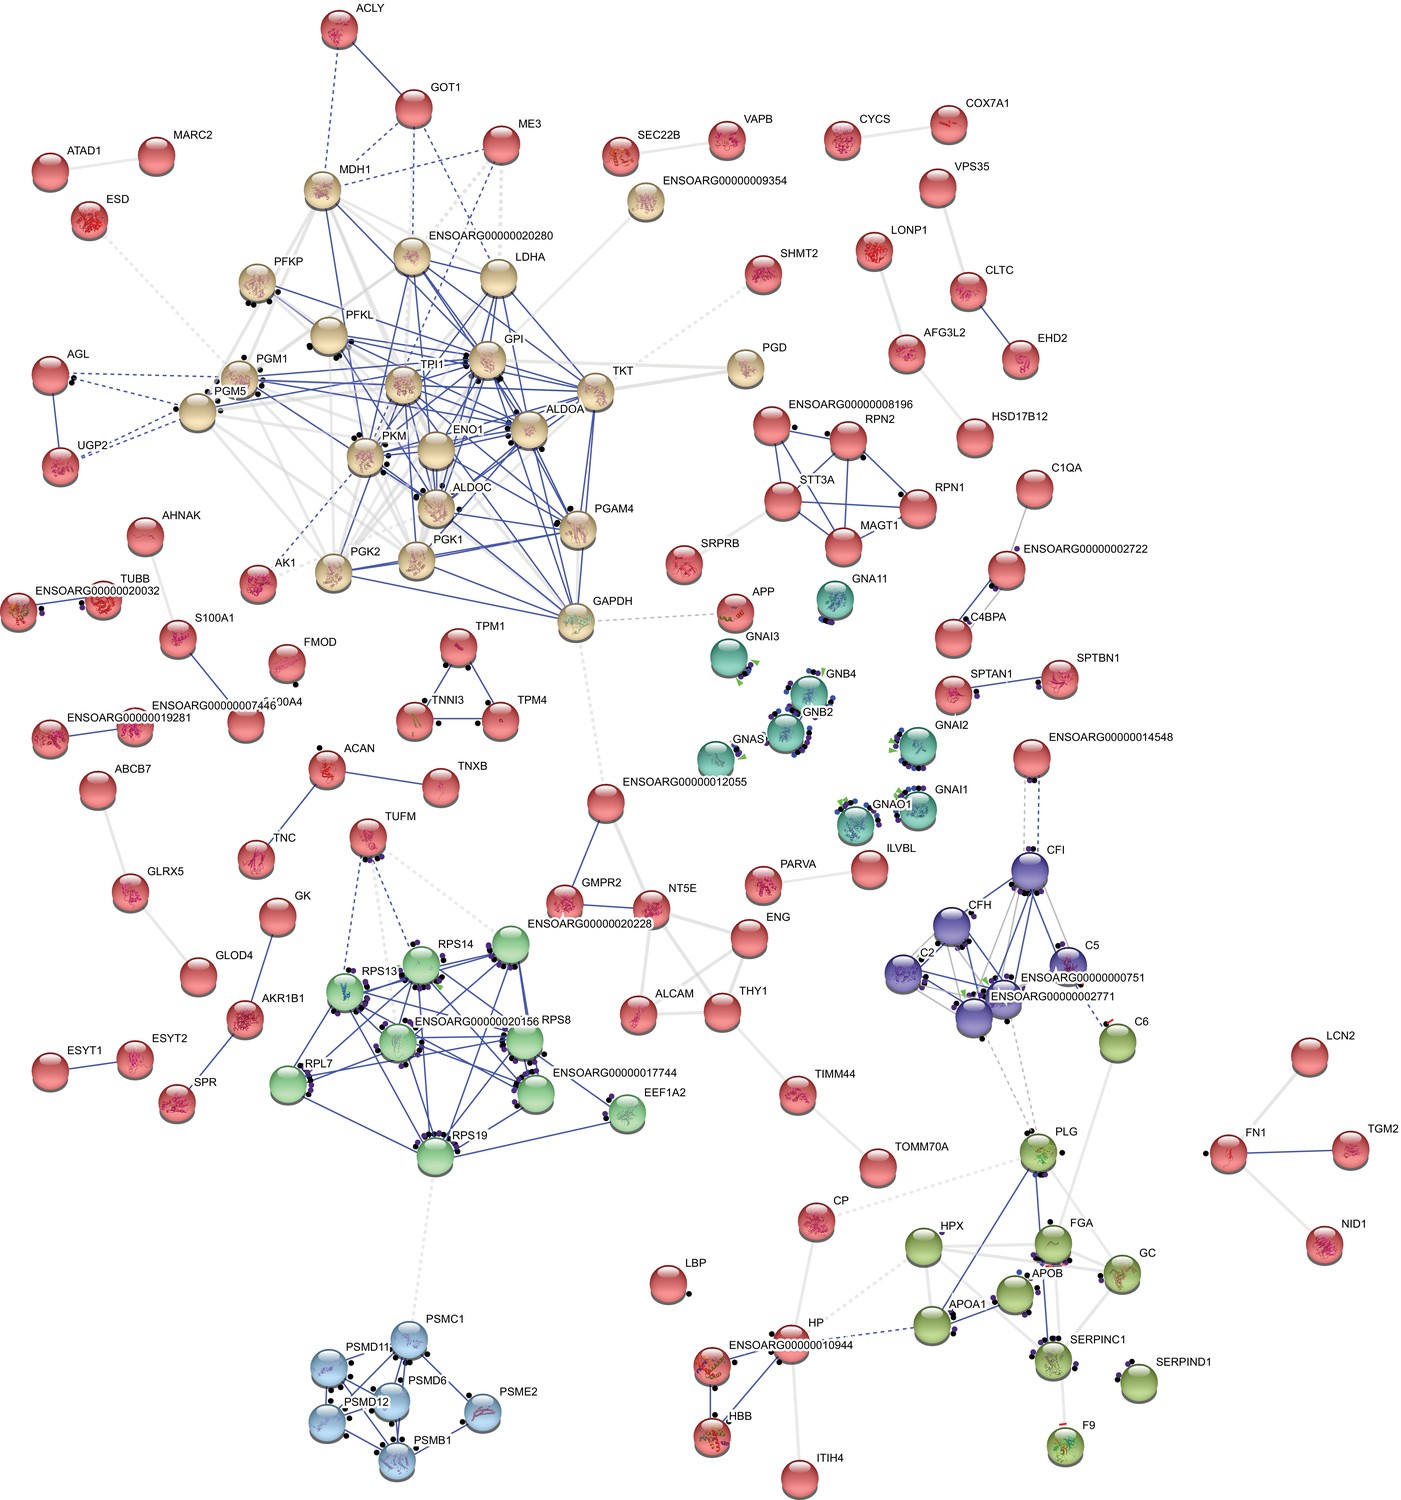
Interactome of 247 differentially expressed proteins showing clusters of shared action.
Proteins are interconnected on the basis of their molecular action upon each other. Clusters (marked with the same colors) were generated based on protein functional similarities. The nodes represent individual proteins while molecular action is represented by blue (binding) or black (reaction). Dashed associations represent low confidence interactions, grey associations indicate an undetermined molecular action. Distance between nodes are automatically generated based on functions. Disconnected nodes were hidden for simplicity. From top left, rotating clockwise, the clusters are metabolic, G proteins, complement proteins, serpins, proteasome and ribosomal proteins.
Author response image 1
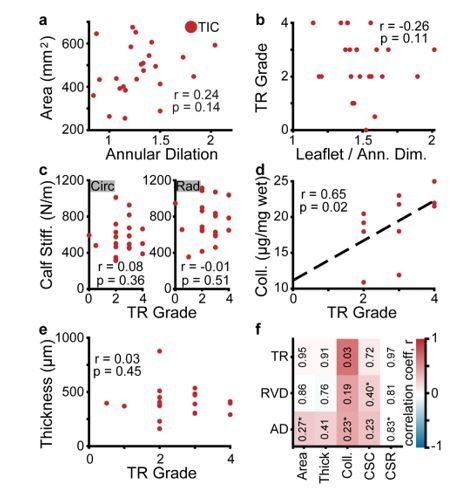
Experimental findings do not correlate well with clinical echocardiographic metrics of disease severity.
(a-e) Correlations between echocardiography acquired metrics with experimental findings in tachycardia-induced cardiomyopathy (TIC) subjects included (a) tricuspid anterior leaflet area v. annular dilation (Pearson), (b) tricuspid regurgitation (TR) grade v. the ratio of anterior leaflet area to annular dimension (Spearman), (c) circumferential (Circ, left) and radial (Rad, right) calf stiffness v. TR grade (Spearman), (d) collagen content (Coll.) v. TR grade (Spearman), and (e) leaflet thickness v. TR grade (Spearman). Correlation coefficients (r) and p-values are inscribed in each panel, along with a linear fit (black, dashed) for visualization, if significant correlation exists. All statistical analyses here were based on specific hypotheses, and p-values thus reflect one-sided tests. (f) A correlation matrix of all combinations of TR grade, right ventricular dilation (RVD), annular dilation (AD) v. area, thickness (Thick), collagen content, calf stiffness in the circumferential (CSC) and radial (CSR) directions. Values within plot are p-values, while color map indicates the correlation coefficient (right). Correlations were Spearman’s correlation tests, unless p-value contains an asterisk (*), denoting use of a Pearson’s correlation test. Here, our significance threshold of 0.003 (Bonferroni correction) did not result in any significant correlations.
Tables
Table 1
Echocardiographic and hemodynamic data of animal model.
| Parameter | CTL | TIC (baseline) | TIC (terminal) |
|---|---|---|---|
| Echocardiographic data | |||
| TR grade (i.e., severity) | 1.0 (0.0) | 0.0 (0.0) | 2.0 (1.0) * † |
| RV EF, % | 67.0 ± 8.6 | 58.8 (20.5) | 48.4 ± 12.9 * † |
| RV FAC, % | 52.1 ± 6.0 | 53.9 ± 8.0 | 37.4 ± 8.7 * † |
| RV IDd, cm | 2.5 ± 0.4 | 2.6 (0.6) | 2.9 ± 0.7 * |
| TV annulus dimension, cm | 2.5 (0.3) | 2.5 ± 0.4 | 3.2 ± 0.5 * † |
| MR grade (i.e., severity) | 0.0 (0.0) | 0.0 (0.0) | 2.0 (1.0) * † |
| LV EF, % | 55.8 ± 4.4 | 61.3 ± 6.2 | 30.0 (11.2) * † |
| LV IDd, cm | 4.2 ± 0.3 | 3.7 ± 0.6 | 4.6 ± 0.4 * † |
| Hemodynamic data | |||
| HR, bpm | 108 (11) | - | 126 ± 23 * |
| RV PMax, mmHg | 28.8 (11.4) | - | 44.0 ± 11.5 * |
| RV PES, mmHg | 22.3 ± 5.6 | - | 35.7 ± 11.0 * |
| RA PMean, mmHg | 10.5 (3.2) | - | 10.6 (5.6) |
| LV PMax, mmHg | 96.1 ± 9.7 | - | 92.9 ± 13.8 |
| LV PES, mmHg | 63.1 ± 17.8 | - | 64.4 ± 13.6 |
-
Values are mean ± standard deviation or median (interquartile range).
CTL = control, EF = ejection fraction, ES = end systolic, FAC = fractional area change, HR = heart rate, IDd = inner dimension at diastole, LV = left ventricular, Max = maximal, MR = mitral regurgitation, P = pressure, RA = right atrial, RV = right ventricular, TIC = tachycardia-induced cardiomyopathy, TR = tricuspid regurgitation, TV = tricuspid valve.
-
*p<0.05 vs. CTL, † p<0.05 vs TIC (baseline).
Key resources table
| Reagent type (species) or resource | Designation | Source or reference | Identifiers | Additional information |
|---|---|---|---|---|
| Biological sample (Ovis aries, male) | Dorset Sheep | Hunter Dorsets (http://www.hunterdorsets.com) | ||
| Antibody | (Rabbit polyclonal) anti- αSMA | Abcam | Cat#:Ab5694; RRID:AB_2223021 | IHC (1:600) |
| Antibody | (Rabbit polyclonal) anti- Ki67 | Thermo Scientific | Cat#:Rb1510-P0; RRID:AB_60158 | IHC (1:200) |
| Antibody | (Rabbit polyclonal) anti-MMP13 | Abcam | Cat#:Ab39012; RRID:AB_776416 | IHC (1:1000) |
| Antibody | (Rabbit polyclonal) anti-TGFβ−1 | Abcam | Cat#:Ab9758; RRID:AB_296604 | IHC (1:100) |
| Chemical compound, drug | Hoechst 33342 | Invitrogen | Cat#:H3570 | (5 μg/mL) |
| Commercial assay or kit | Total Collagen Assay Kit (Perchlorate-Free) | BioVision Incorporated | Cat#:K406 | |
| Commercial assay or kit | Pierce Microplate BCA Protein Assay Kit | Thermo Scientific | Cat#:23252 | |
| Software, algorithm | ImageJ (OrientationJ) | ImageJ (http://imagej.nih.gov/ij); PMID:21744269 | RRID:SCR_003070; RRID:SCR_014796 |
Additional files
-
Supplementary file 1
(Sheet A) List of FASTA headers, gene names, family information and expression levels for each of the 247 proteins. (Sheet B) Protein families identified, and their molecular functions, biological processes, cellular components, and protein class. (Sheet C) Chart summary of protein families identified and their common roles.
- https://cdn.elifesciences.org/articles/63855/elife-63855-supp1-v1.xlsx
-
Transparent reporting form
- https://cdn.elifesciences.org/articles/63855/elife-63855-transrepform-v1.docx
Download links
A two-part list of links to download the article, or parts of the article, in various formats.
Downloads (link to download the article as PDF)
Open citations (links to open the citations from this article in various online reference manager services)
Cite this article (links to download the citations from this article in formats compatible with various reference manager tools)
The tricuspid valve also maladapts as shown in sheep with biventricular heart failure
eLife 9:e63855.
https://doi.org/10.7554/eLife.63855


