A cell atlas of the chick retina based on single-cell transcriptomics
- Center for Brain Science and Department of Molecular and Cellular Biology, Harvard University, United States
Figures
Figure 1 with 1 supplement
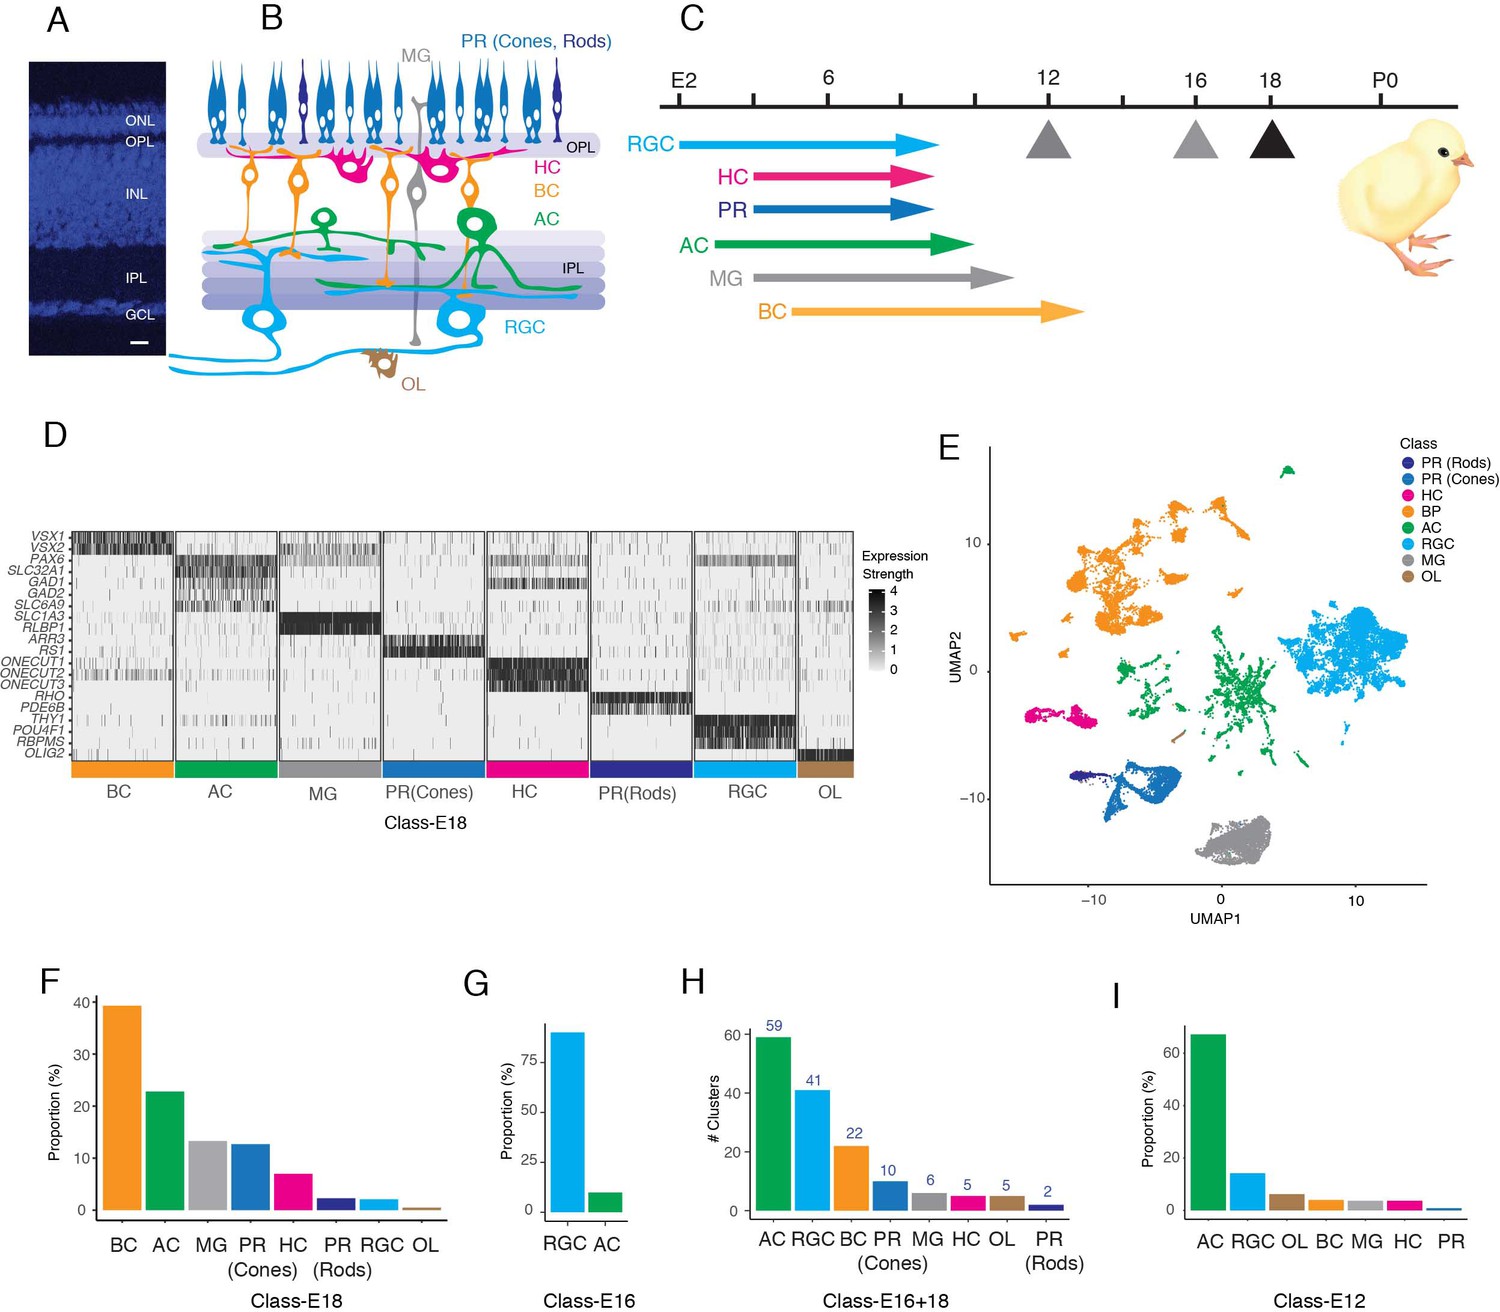
Datasets used to generate a chick retinal atlas.
(A) Cross-section of chick retina stained with NeuroTrace to mark somata. The retina consists of three cellular layers: outer nuclear layer (ONL), inner nuclear layer (INL), and ganglion cell layer (GCL) separated by two synaptic layers, outer plexiform (OPL) and inner plexiform (IPL). Bar, 10 µm. (B) Sketch showing retinal cell classes. The ONL contains photoreceptors (PR): double cones, single cones, and rods. The INL contains horizontal, bipolar, and amacrine cells (HC, BC, and AC) and Müller glia (MG). The GCL contains retinal ganglion cells (RGCs) and ACs. Oligodendrocytes (OL) are present in an axonal layer beneath the GCL. (C) Birthdates of each class, from Prada et al., 1991. Hatching (P0) is at embryonic day (E)21. Arrows denote ages at which cells were obtained for scRNA-seq. To generate the cell atlas, E16 data were used for RGCs and E18 data for all other classes. (D) Expression of a subset of marker genes used to allocate E18 retinal cells to classes. Plot shows scaled expression level in a randomly down-sampled subset of all cells. (E) UMAP of E16+18 scRNA-seq data with class names based on D. (F) Fraction of E18 cells in each cell class, as determined by expression of canonical markers in D. (G) Fraction of E16 RGC-enriched cells in each cell class, determined as in D, F. (H) Number of clusters (putative cell types) in each retinal cell class, based on reclustering each class separately. (I) Fraction of E12 RGC-enriched cells in each cell class, determined as in D, F.
Figure 1—figure supplement 1
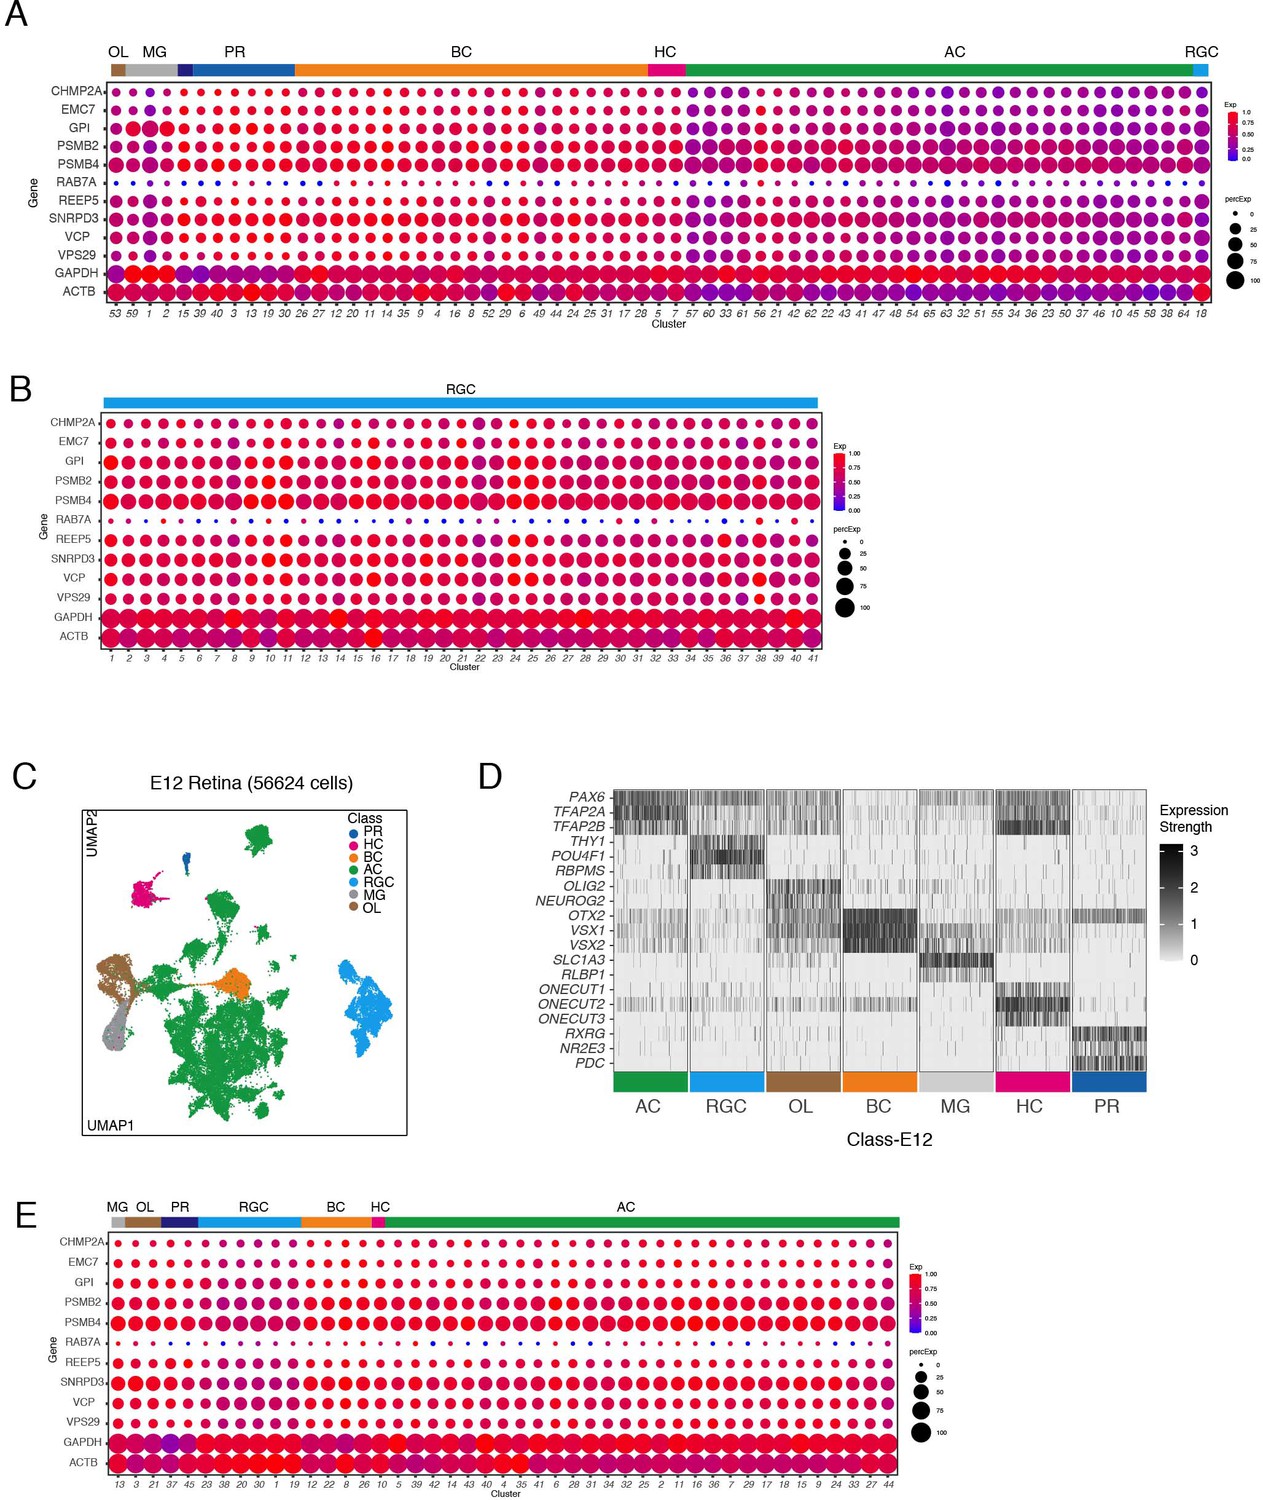
Quality control metrics for datasets used in this paper .
(A) Expression of housekeeping genes (Eisenberg and Levanon, 2013) in E18 retina. Clusters generated from initial unsupervised analysis are shown; following division into classes (Figure 1D,E), each class was reanalyzed to maximize the computational power in identifying clusters used in the remainder of the paper. Similar expression of these genes across clusters shows relatively uniform quality of cells analyzed. (B) Expression of house-keeping genes for E16 RGCs. (C) UMAP of E12 scRNA-seq data. (D) Expression patterns of a subset of marker genes used to allocate E12 retinal cells to classes, similar to Figure 1D. (E) Expression of house-keeping genes for E12 clusters.
Figure 2
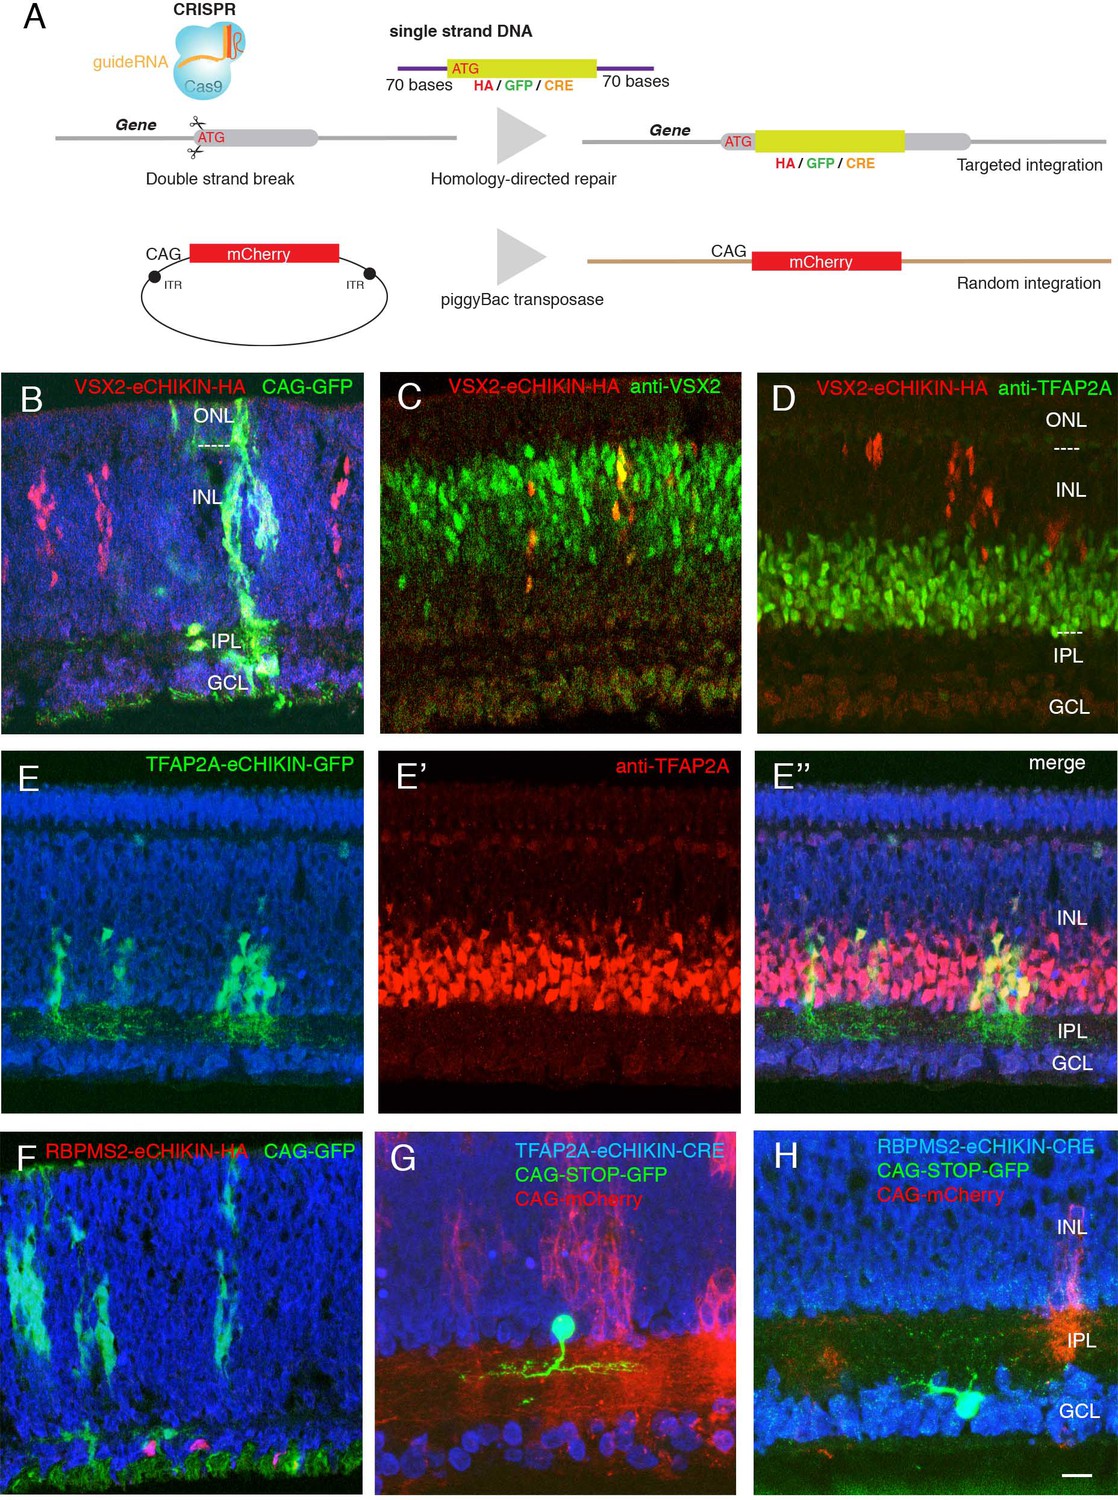
Introduction of tags and reporters to specific loci using eCHIKIN.
(A) The eCHIKIN method. In ovo electroporation of Cas9/guideRNA ribonucleoprotein complexes edits the gene specified by the guide RNA, inserting a sequence encoding HA tag, GFP, or CRE. To identify transfected areas in tissues, a second fluorescent protein (GFP or mCherry) is expressed using the piggyBac transposon system. (B–D) Insertion of HA epitope tag into the nuclear protein encoded by VSX2. Cells stained by the anti-HA antibody are in the inner (upper) portion of the INL where bipolar cells (labeled with anti-VSX2 in C) are located at E12. CAG-driven GFP is expressed in all the layers. No HA-labeled cells are present in the lower portion of the INL, which contains TFAP2-positive amacrine cells (D), and all HA-positive cells are TFAP2-negative. In this and subsequent figures, sections were stained with NeuroTrace (blue) during mounting. (E, E’, E’’) GFP with a termination codon was inserted at the initiation codon of TFAP2A, an amacrine cell (AC) marker. In this case, GFP is not fused to TFAP2A protein, resulting in filling cytoplasm including neurites in the IPL at E12. TFAP2A protein is expressed by GFP-expressing cells, all of which are TFAP2A-positive ACs. (Note that the eCHIKIN construct disrupts the TFAP2A open-reading frame, so double labeling results from expression of endogenous TFAP2A and indicates that only a single TFAP2A allele was edited). (F) Insertion of HA epitope tag into the cytoplasmic protein encoded by RGC-specific RBPMS2 gene. Labeled cells are in the GCL at E10. (G) Insertion of Cre recombinase into the TFAP2A gene. The insertion construct was coelectroporated with a CAG- loxP-STOP-loxP-GFP construct, labeling a small number of ACs with GFP at E14. (H) Insertion of Cre recombinase into the RBPMS2 gene. The insertion construct was coelectroporated with CAG- loxP-STOP-loxP-GFP as in F, labeling a small number of RGCs with GFP at E14. Bar in H, 10 µm for B-E,G; 5 µm for F, H.
Figure 3 with 2 supplements
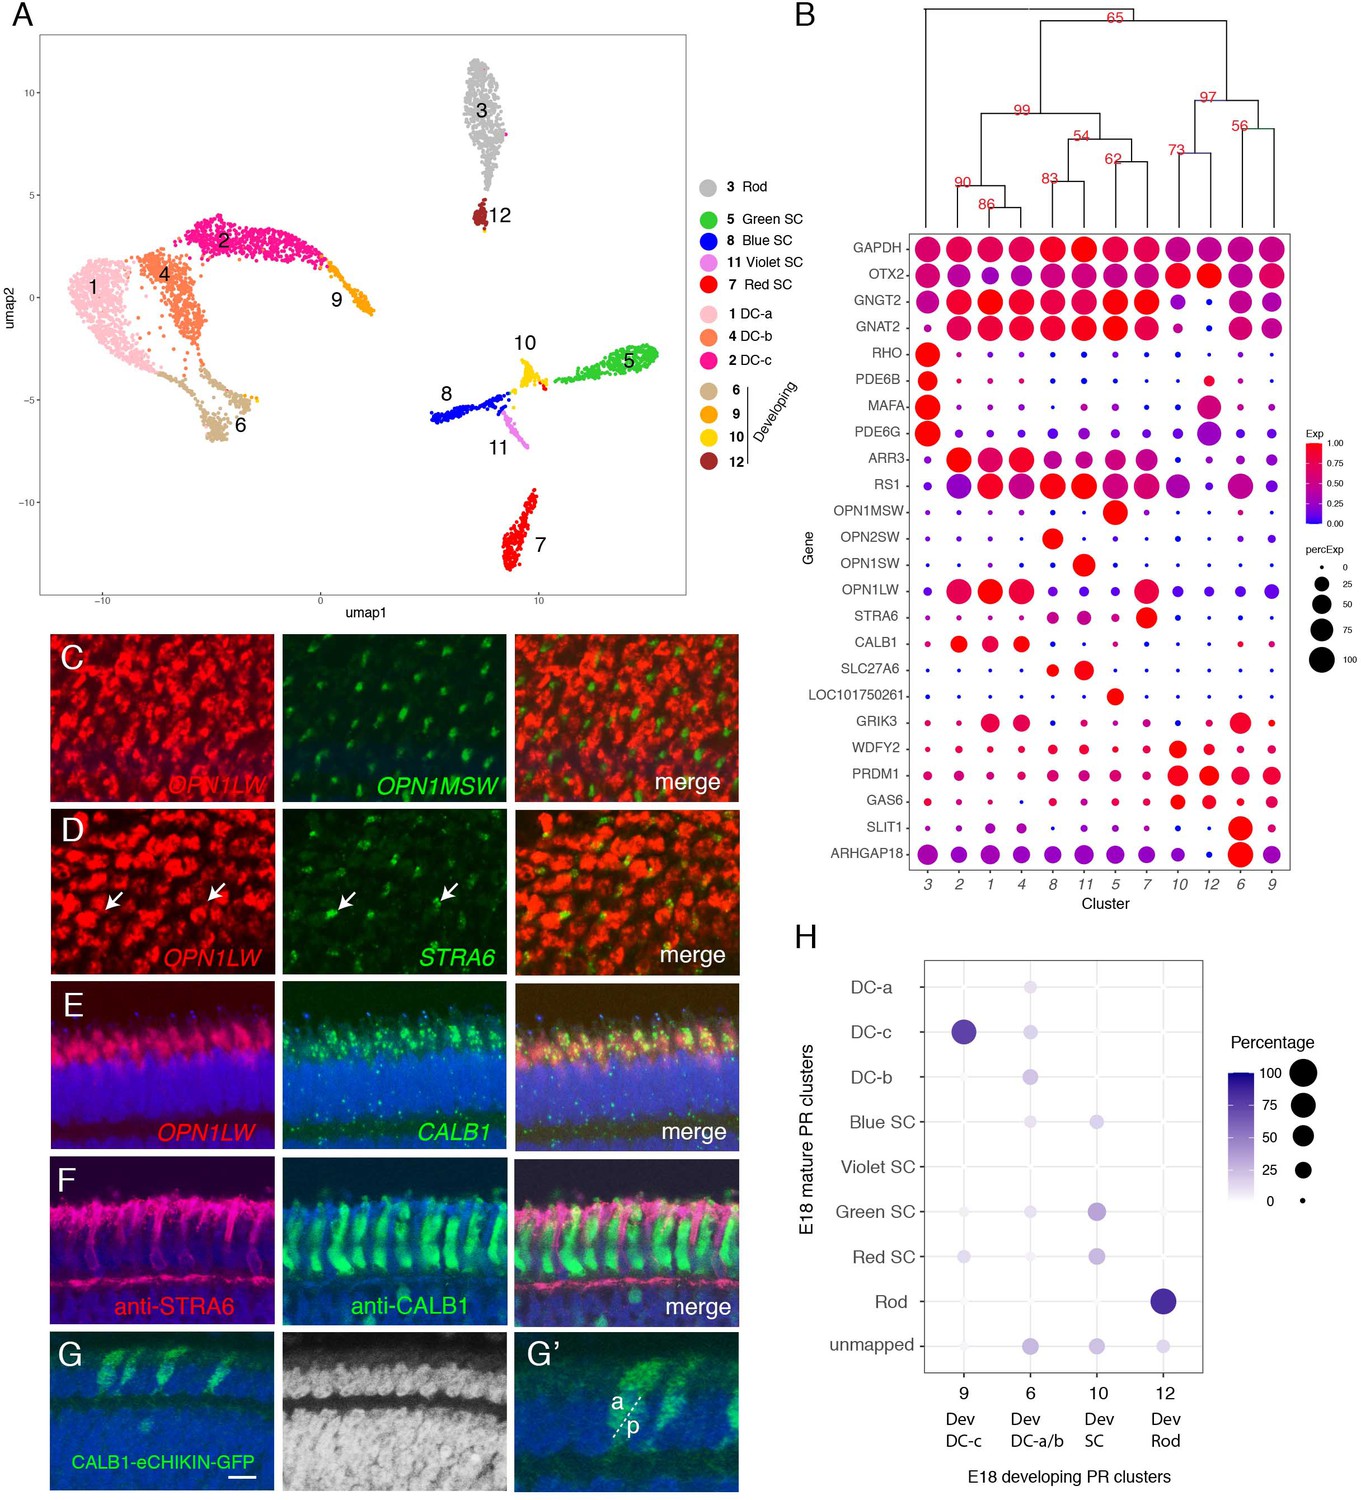
Classification and characterization of photoreceptors (PRs).
(A) Clustering of E18 PRs displayed in UMAP. Identities of each cluster are indicated to the right. (B) Dot plots showing expression of selected genes expressed in all or subsets of PRs. In this and subsequent figures, dot size indicates the proportion of cells that express each gene, and color indicates expression level normalized to its max value among clusters. Numbers correspond to clusters in A. Dendrogram above dots shows transcriptional relationships of clusters. In this and subsequent figures, numbers labeled on the tree are p-values computed by multiscale bootstrap resampling, ranging from 0 to 100, higher value indicates higher reliability. (C–E) In situ hybridization of E16 sections (en face in C,D; vertical in E,F) with probes for cluster-specific genes. (C) OPN1LW and OPN1MSW. (D) OPN1LW and STRA6. Arrows show coexpression. (E) OPN1LW and CALB1. (F) Immunostaining of E16 section with antibodies to STRA6 and CALB1. (G) Double cones (DCs) labeled by eCHIKIN-mediated insertion of GFP into the CALB1 locus. Section is from E17 retina. G' is a high-power picture of a part of G, showing an accessary DC (a) and principal DC (p) based on their position in outer nuclear layer (ONL). Bar in F, 10 µm for C and D; 5 µm for E–G. (H) Relationship between immature and mature PR clusters assessed by XGBoost. Annotation of clusters is indicated in A. Dev, developing.
Figure 3—figure supplement 1
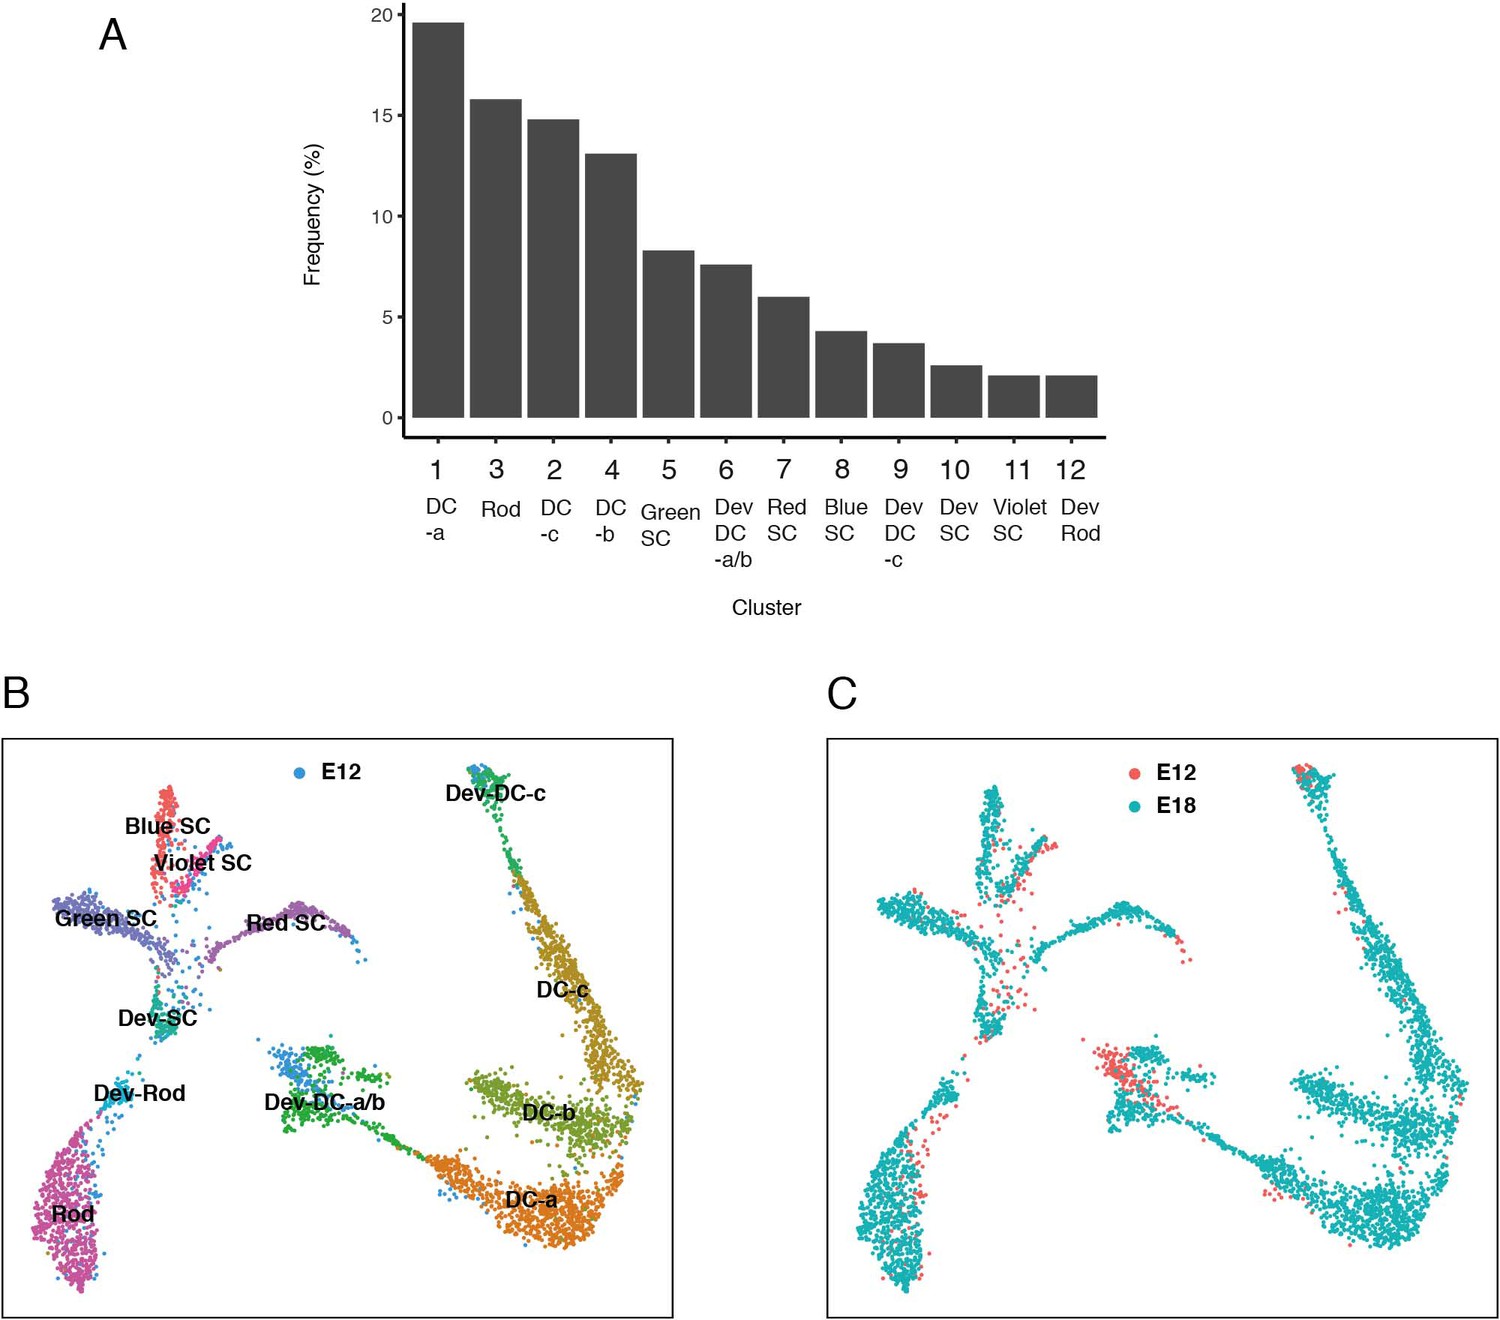
Frequency distribution of photoreceptors and comparison of E12 and E18 data .
(A) Frequency distribution of photoreceptor (PR) types. Cluster numbers are from Figure 3A. (B, C) Clustering of PRs from E12 and E18 together and visualized in the same UMAP, showing that the majority of E12 cells are immature types while the majority of E18 cells are mature types. In B, colors represent annotations from E18 PRs as shown in Figure 3A. In C, distinct colors show E12 and E18 cells.
Figure 3—figure supplement 2
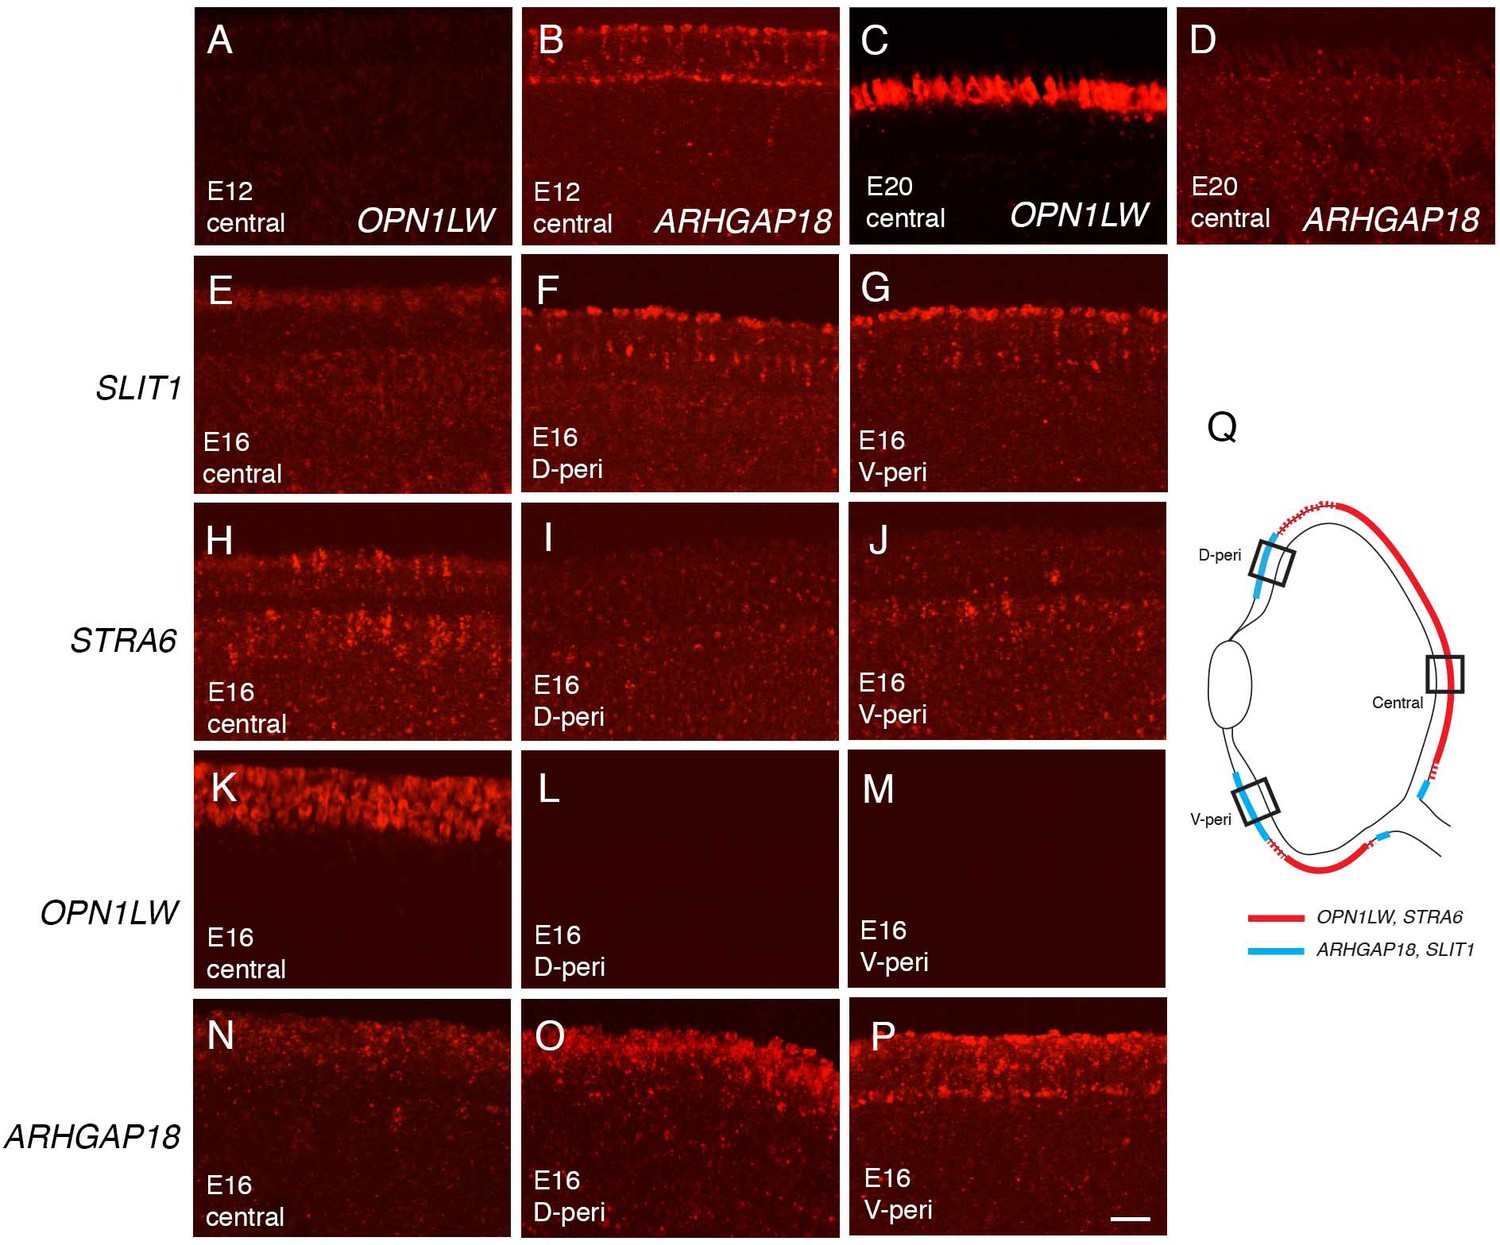
Regional distribution of developing photoreceptor cell types.
(A–D) In situ hybridization of E12 retina (A,B) and E20 retina (C,D) for OPN1LW and ARGHAP18. (E–P) Central and peripheral staining of SLIT1 (E–G), STRA6 (H–J), OPN1LW (K–M), ARGHAP18 (N–P) at E16. D-peri, dorsal peripheral; V-peri, ventral peripheral. Bar, 10 µm. (Q) Summary sketch, showing expression of indicated genes at E16 and E18.
Figure 4 with 1 supplement

Classification and characterization of horizontal cells (HC).
(A) Clustering of E18 HCs viewed by UMAP. (B) Dot plots showing expression of selected genes expressed in all or subsets of HCs. Numbers correspond to clusters in A. Dendrogram above dots shows transcriptional relationships of clusters. (C–L) In situ hybridization with indicated probes at E16. C–I are cross-sections; J–L are en face sections. Arrowheads in C–I mark OPL. (C) Double color in situ hybridization shows coexpression of OXT and IPCEF1. (D–F) Expression of NTRK (D), EGFR (E), and LTK (F) in subsets of HCs. (G–I) Double color in situ hybridization for NTKR/ EGFR (G), LTK/ NTRK (H), and LTK /EGFR (I). (J–L) In situ hybridization of E16 en face sections for NTRK (J), EGFR (K), and LTK (L) showing mosaics of each type. Bar in L, 5 µm for C, G–I; 10 µm for D–F, J–L.
Figure 4—figure supplement 1
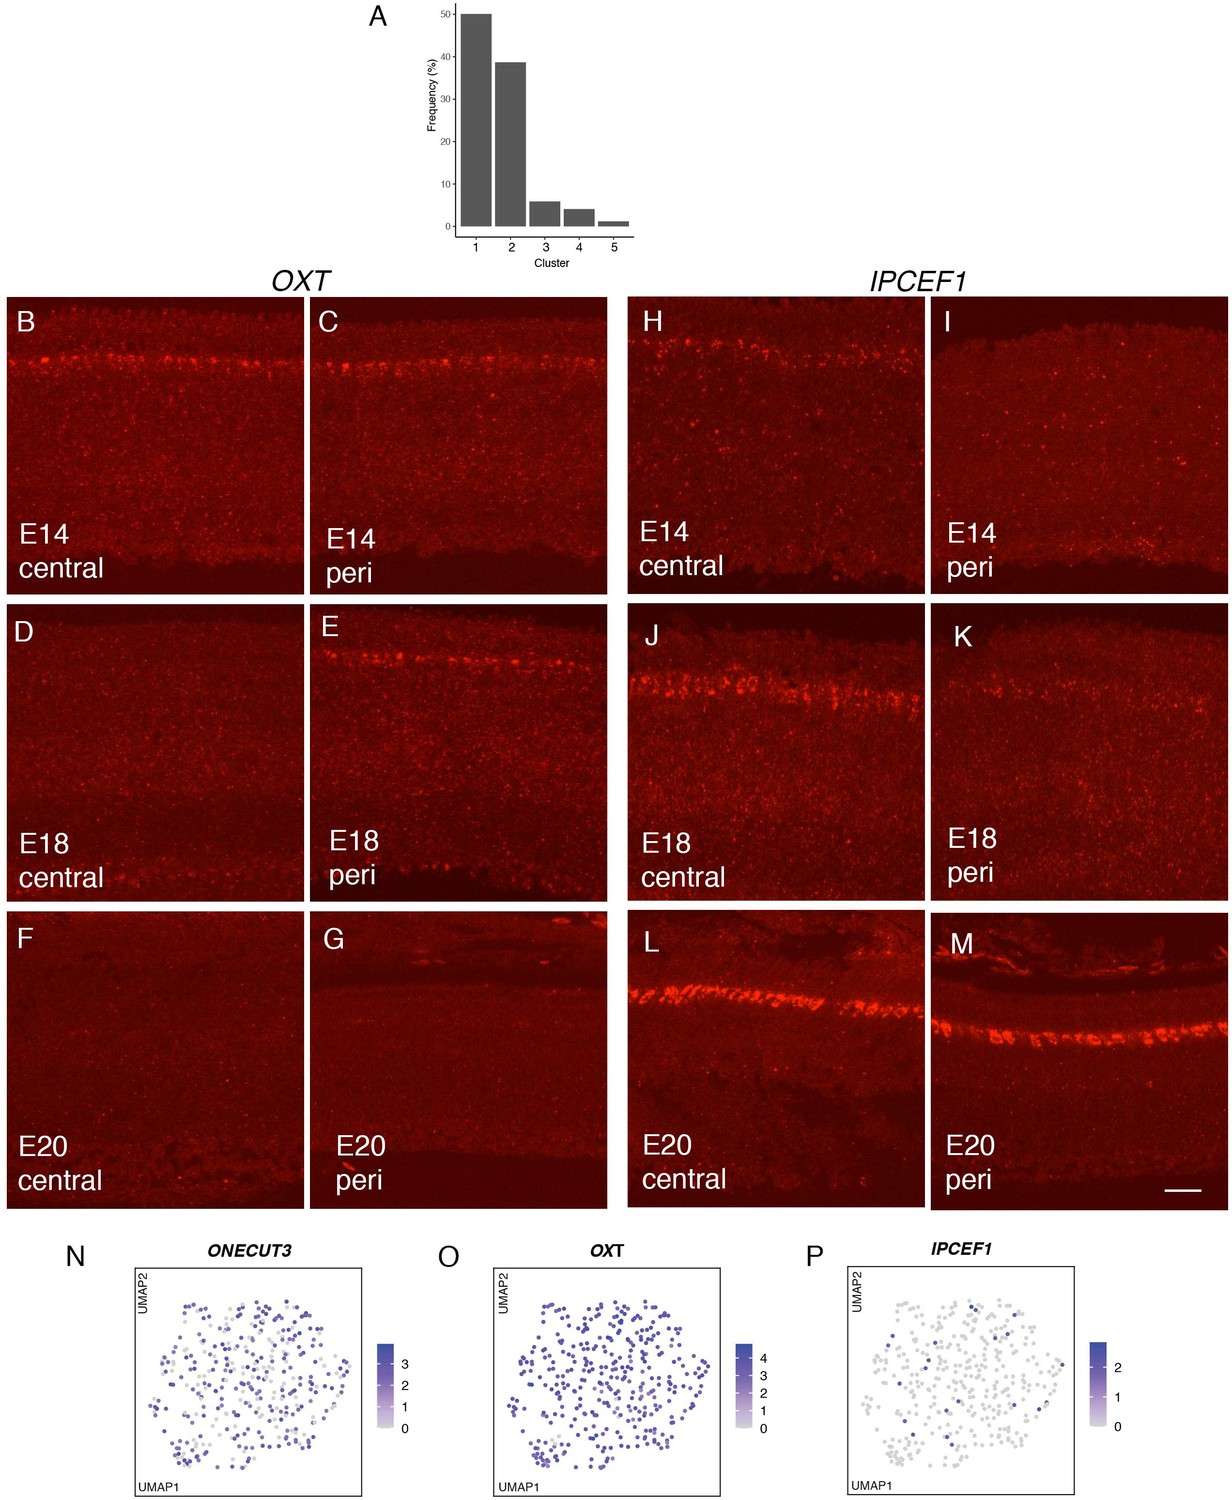
Frequency and regional distributions of horizontal cell types.
(A) Frequency distribution of horizontal cells (HCs). Cluster numbers are from Figure 4A,B. (B–M) In situ hybridization for OXT and IPCEF1 in central and peripheral retina at E14, E18, and E20. Bar in M, 10 µm for all parts. (N, O, P) Feature plots of E12 HCs, showing expression of markers that label HC types at E18.
Figure 5 with 1 supplement
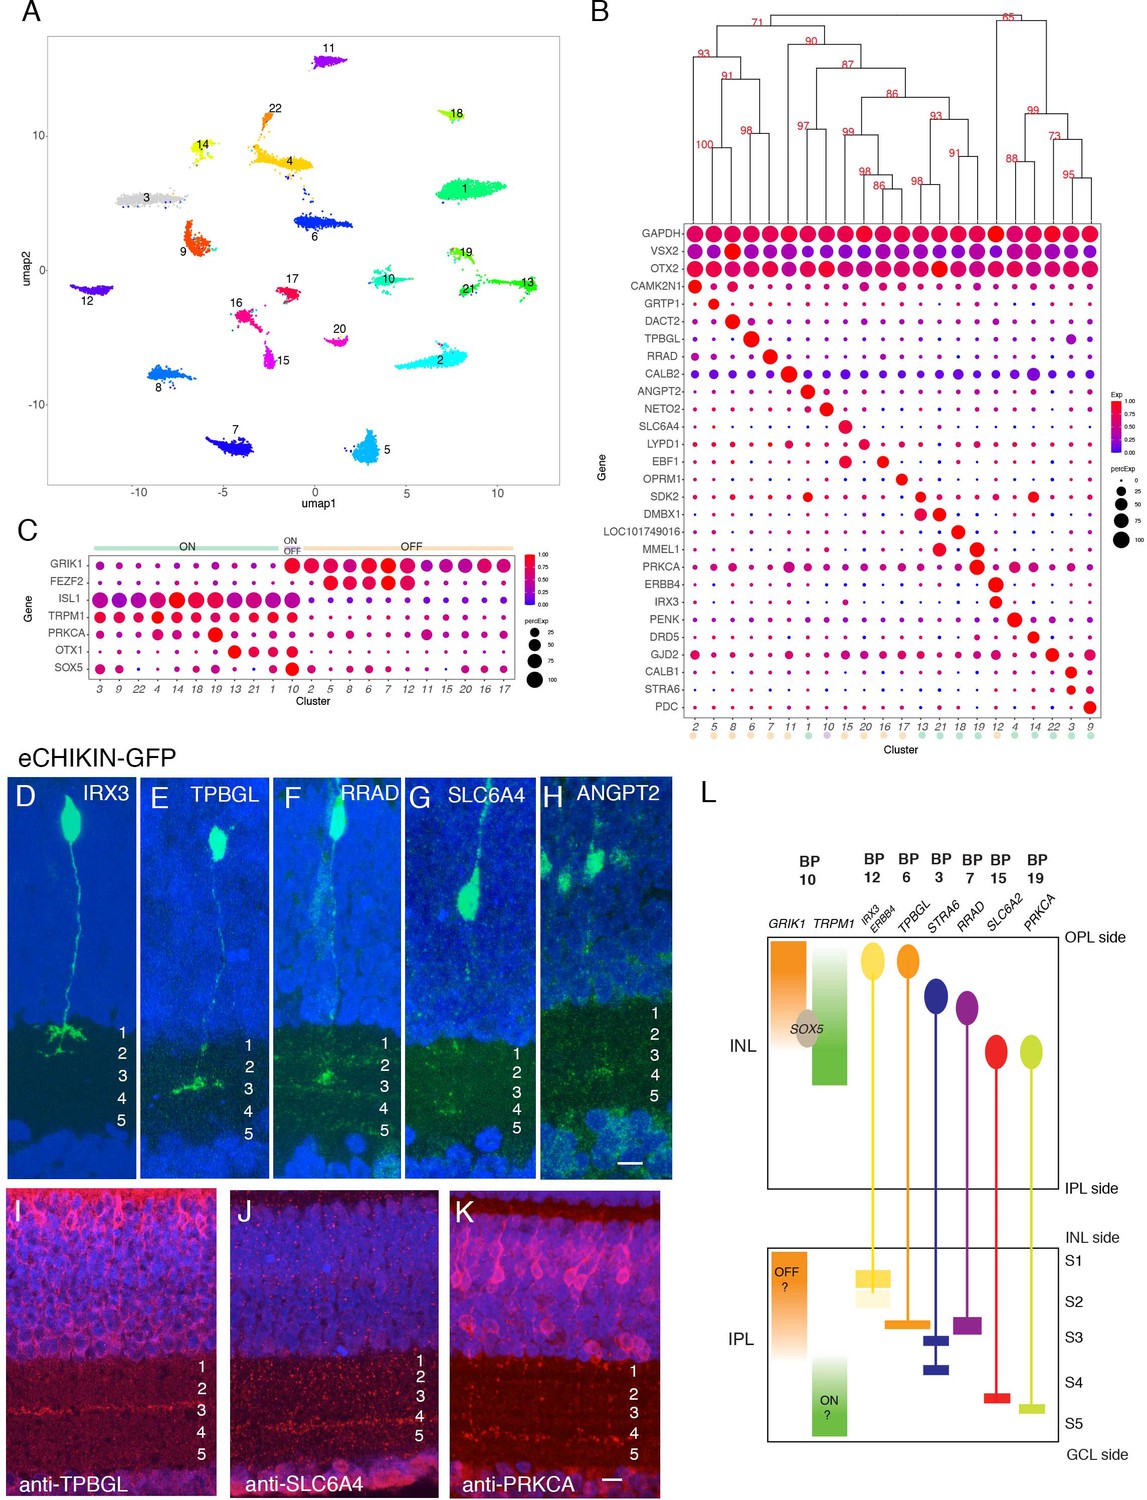
Classification and characterization of bipolar cells (BCs).
(A) Clustering of E18 BCs visualized by UMAP. (B) Dot plots showing expression of selected genes expressed in all or subsets of BCs. Numbers correspond to clusters in A. Dendrogram above dots shows transcriptional relationships of clusters. Putative ON and OFF types, based on markers in C, are indicated by color. (C) Expression of genes selectively expressed by ON (TRPM1, ISL1), OFF (GRIK1, FEZF1) and rod (PRKCA) BCs in rodents. OTX1 and SOX5 are uniquely expressed in putative ON clusters. (D–H) eCHIKIN-mediated labeling of cells expressing IRX3 (BC12, (D)), TPBGL (BC6, (E)), RRAD (BC7, (F)), SLC6A4 (BC15, (G)), and ANGPT2 (BC1, (H)). E14 sections at E14 were stained with anti-GFP. Each lamination was confirmed in 3–10 cases. Bar 10 µm. (I–K) Immunostaining with anti-TBBGL (I), anti-SLC6A4 (J), and anti-PRKCA (K). Bar 10 µm. (L) Summary of BC soma positions in INL and terminal positions in IPL.
Figure 5—figure supplement 1
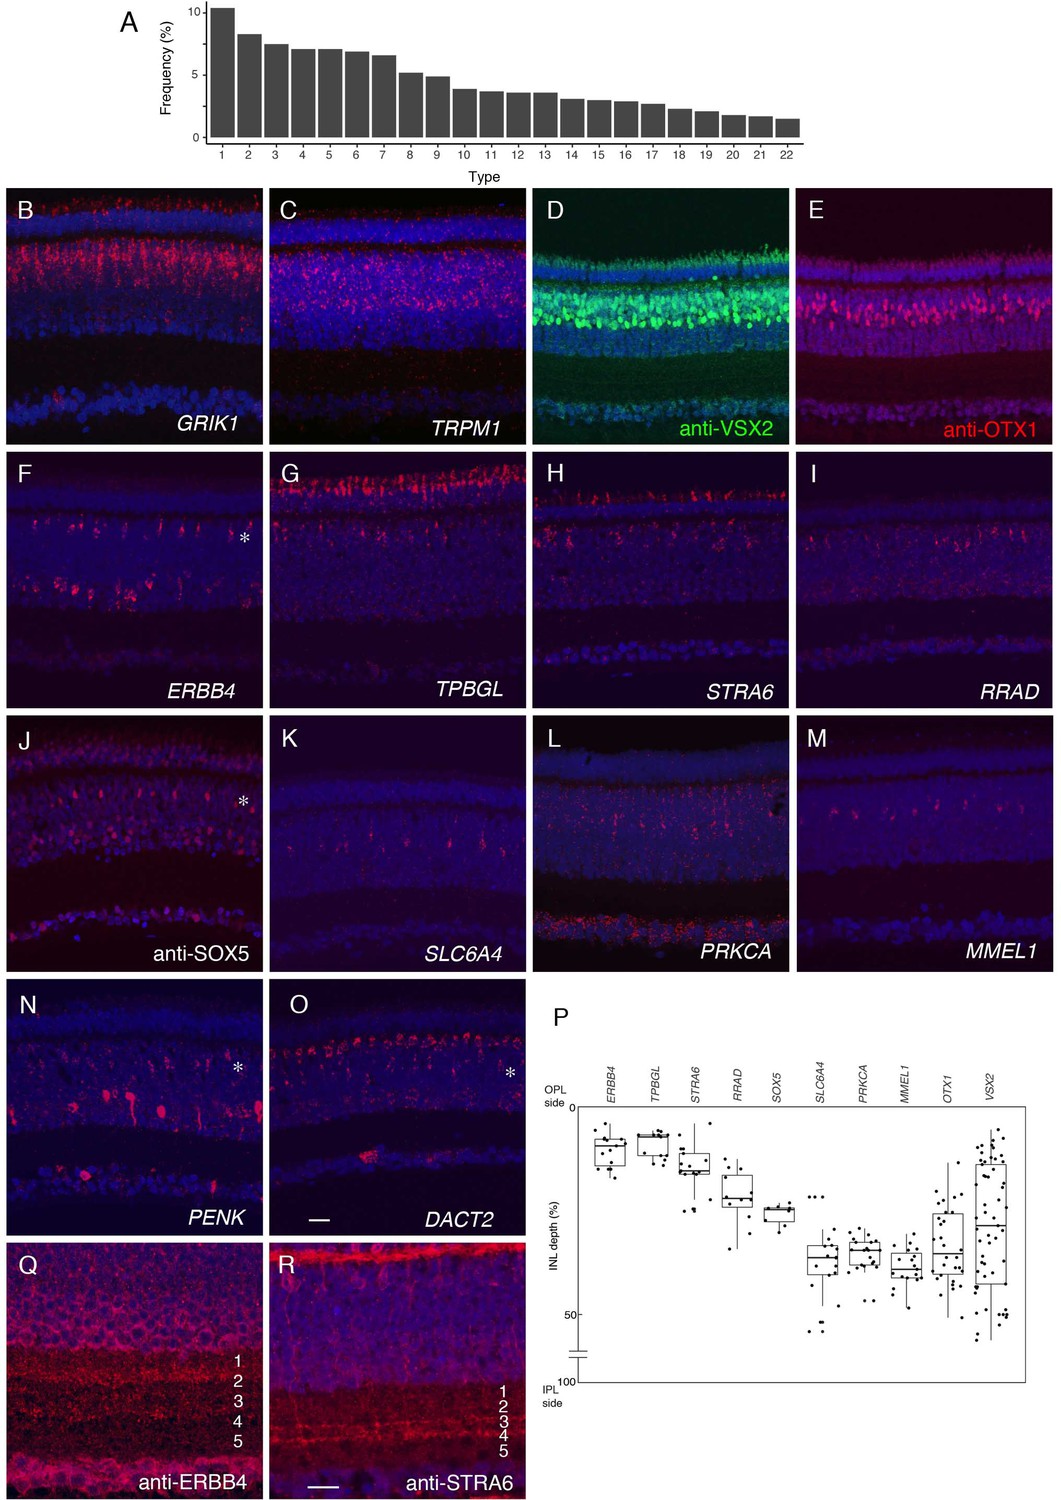
Frequency distribution and laminar position of bipolar cell types.
(A) Frequency distribution of bipolar cells (BCs). Cluster numbers are from Figure 5A,B. (B–O) In situ hybridization or immunostaining of E16 retina with indicated probes. (B,C) GRIK1 (B) and TRPM1 (B), which mark OFF and ON BC populations, respectively, in mammals. (D,E) Double staining with anti-VSX2 (D) and anti-OTX1 (E). (F–O) Expression of markers for BC subsets. In situ hyridization for ERBB4 (F), TPBGL (G), STRA6 (H), RRAD (I), SLC6A4 (K), PRKCA (L), MMEL1 (M), PENK (N), DACT2 (O). Immunostaining with anti-SOX5 (J). Positions of the BCs expressing ERBB4, SOX5, PENK, and DACT2 are indicated by asterisk because these are also expressed by amacrine cells (ACs) or horizontal cells (HCs). (P) Position of BC somata in the INL, calculated from micrographs such as those in B–Q. Positions of soma (dots) were measured, and plotted using the ggplot2 (R) showing the five number summary (the sample minimum, the lower quartile, the median, the upper quartile, and the sample maximum). Edge of OPL is 0% and edge of IPL is 100%. (Q, R) Section (E16) stained with anti-ERBB4 (Q), anti-STRA6 (R). Bar in O, 10 µm for A–O. Bar in R, 5 µm for Q, R.
Figure 6 with 2 supplements

Classification and characterization of amacrine cells (ACs).
(A) Clustering of E18 ACs using UMAP. (B) Dot plots showing expression of the housekeeping gene, GAPDH; pan-AC genes PAX6 and SLC32A1; genes diagnostic of GABAergic ACs (SLC6A1, GAD1, GAD2) and glycinergic ACs (SLC6A9); and TFAP2 isoforms, TFAP2A and TFAP2B. Numbers correspond to clusters in A. Dendrogram above dots shows transcriptional relationships of clusters. (C) Genes expressed by subsets of ACs. (D,E) Immunostaining of E16 retina for TFAP2A (D) and TFAP2B (E). TFAP2A is expressed by multiple amacrine types in INL but not in GCL. (F) Immunostaining of E16 retina for CHAT, which is expressed by ON and OFF starburst ACs. Bar in E is 10 µm for D,E. Bar in F is 10 µm for F.
Figure 6—figure supplement 1
Frequency distribution and morphological analysis of amacrine cell types.
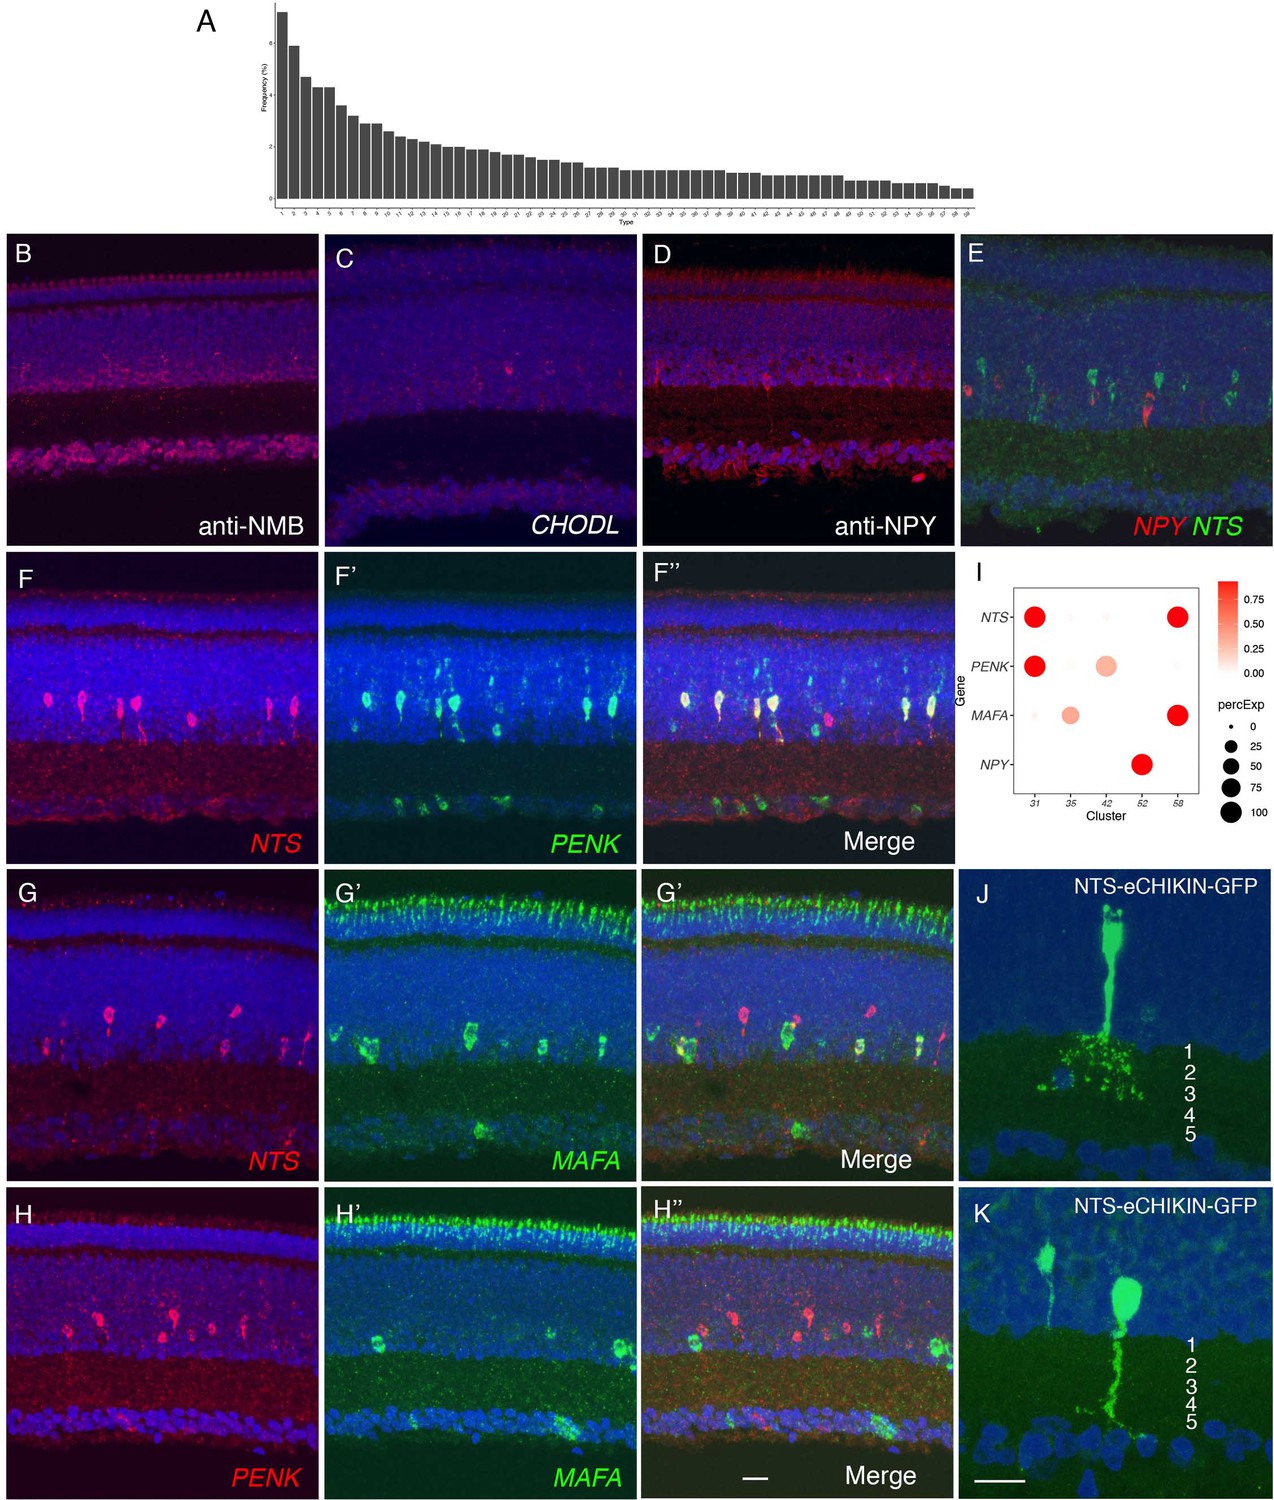
(A) Frequency distribution of amacrine cells (ACs). Cluster Numbers are from Figure 6A,B. B–D, Immunostaining for NMB in AC17 (B), CHODL in AC40 (C), NPY in AC52 (D). (E–H) Double color in situ hybridization for NPY and NTS (E). NTS and PENK (F), NTS and MAFA (G) and PENK and MAFA (H). (I) Expression of NTS, PENK, MAFA, and NPY in selected AC clusters. (J,K) eCHIKIN-mediated labeling of NTS ACs. Two types of cells are labeled: PENK-expressing AC31 populate the top of the AC layer, and send arbors in S1–S3 (I), and MAFA-expressing AC58 is at the edge of IPL, and ramifies along S5 (J). Retinas are from E16 (B–H) or E14 (J,K). Bar in H is 10 µm for B–H. Bar in K is 10 µm for J and K.
Figure 6—figure supplement 2
Molecular and morphological analysis of key amacrine cell types.
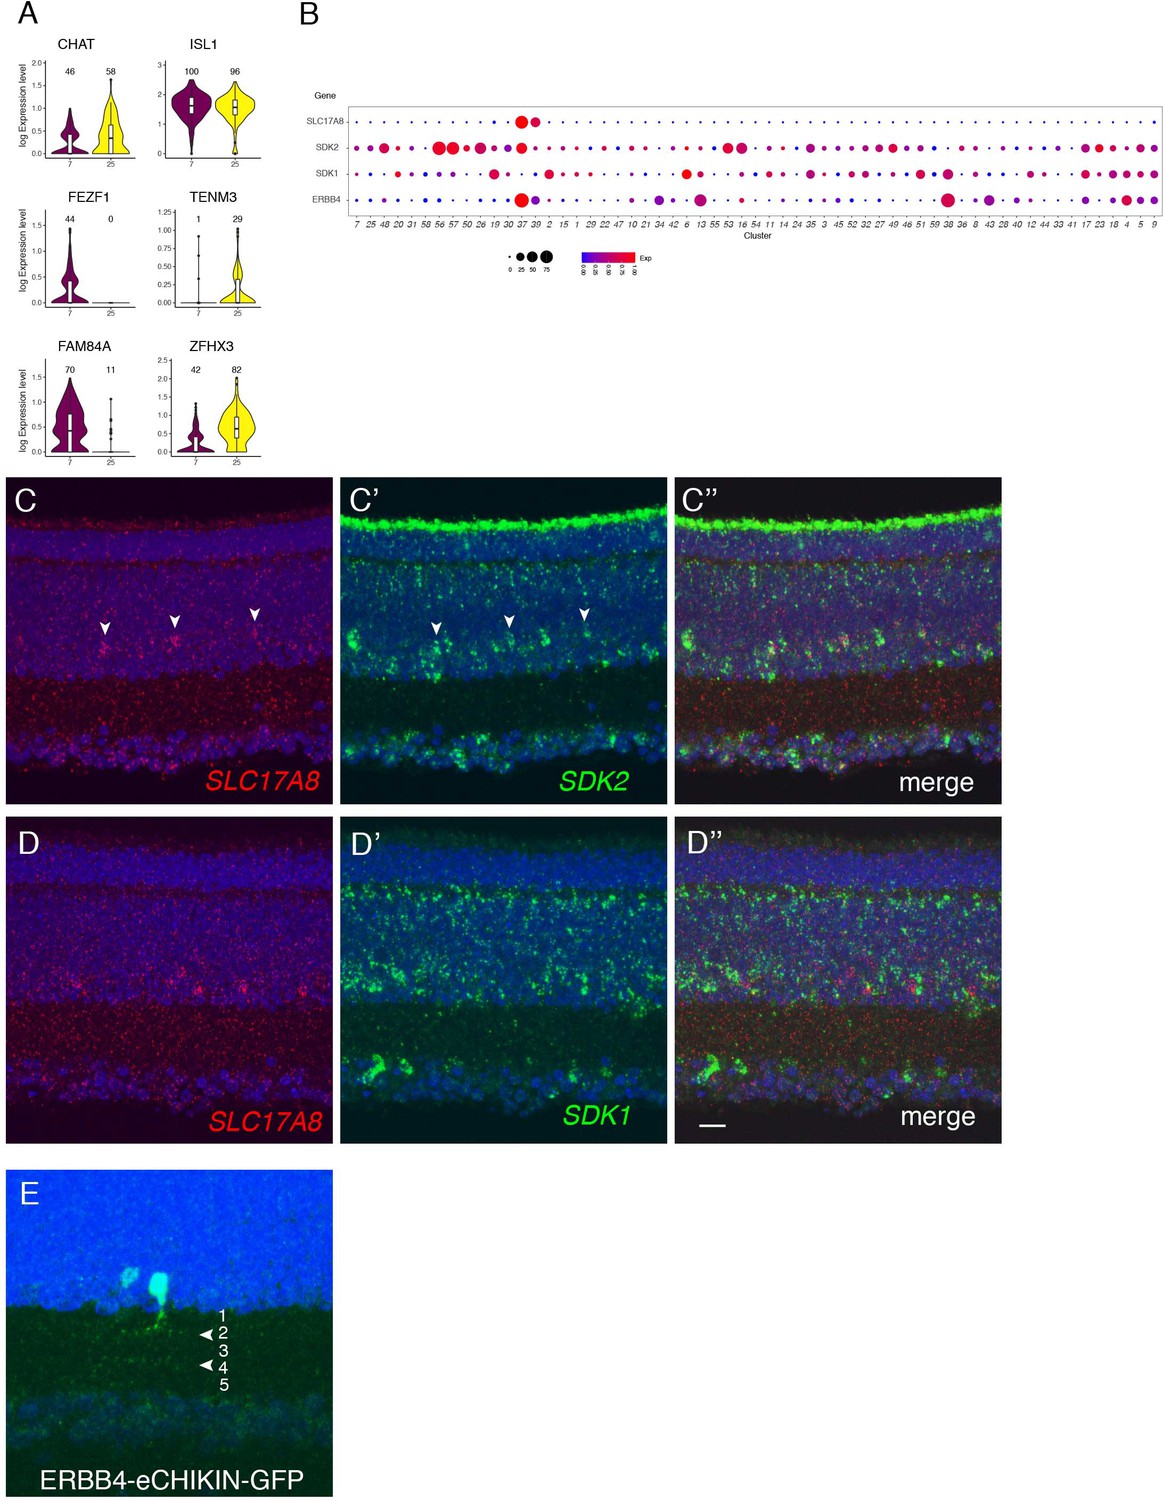
(A) Violin plots showing differentially expressed genes in two clusters of E18 chick starburst ACs which are characterized by similar expression of CHAT and ISL1. (B) Dot plots of SLC17A8 (VGLUT3), SDK2, SDK1, and ERBB4 expression in amacrine cells (ACs). (C,D) Double-color in situ hybridization of E16 retina for SLC17A8 (arrowheads) plus SDK2 (C), or SDK1 (D). (E) eCHIKIN-mediated GFP insertion in ERBB4 at E14. The visualized cell stratifies along S2/S4 (arrowheads) which correspondes to SDK2 localization (Yamagata et al., 2002). See Figure 5—figure supplement 1F for overall expression pattern of ERBB4. Bar in D is 5 µm for C,D. Bar in E is 10 µm.
Figure 7 with 2 supplements
Classification and characterization of RGCs.
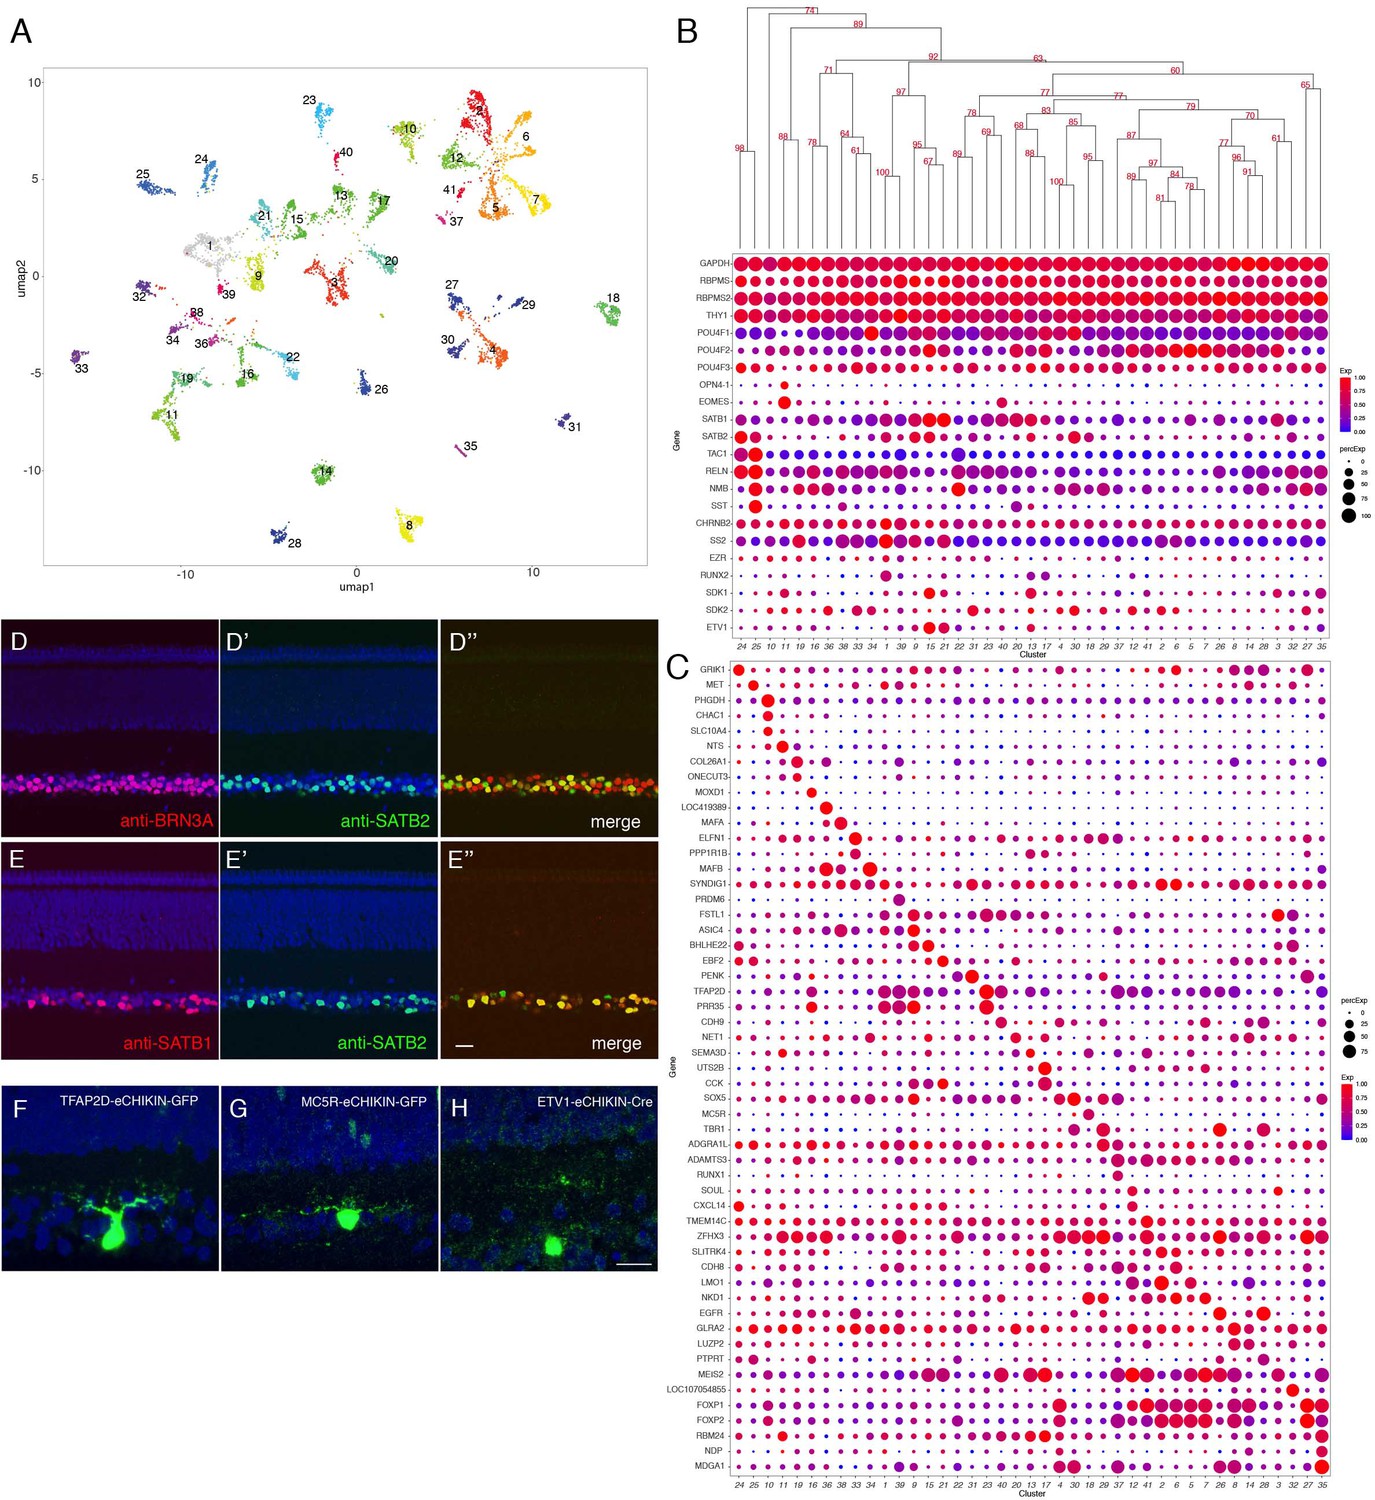
(A) Clustering of E16 RGCs using UMAP. (B) Dot plots showing expression of selected genes expressed in all or subsets of RGCs. Numbers correspond to clusters in A. Dendrogram above dots shows transcriptional relationships of clusters. (C) Dot plots showing expression of genes selectively expressed in RGC clusters. (D, E) Immunostaining of E16 retina for SATB2 and BRN3A/POU4F1 (D) and for SATB1 and SATB2 (E). (F–H) RGCs labeled by eCHIKIN-mediated GFP insertion in TFAP2D (GC23; F), MC5R (GC18; G), and ETV1 (GC15; H). Bars in E and H, 10 µm.
Figure 7—figure supplement 1
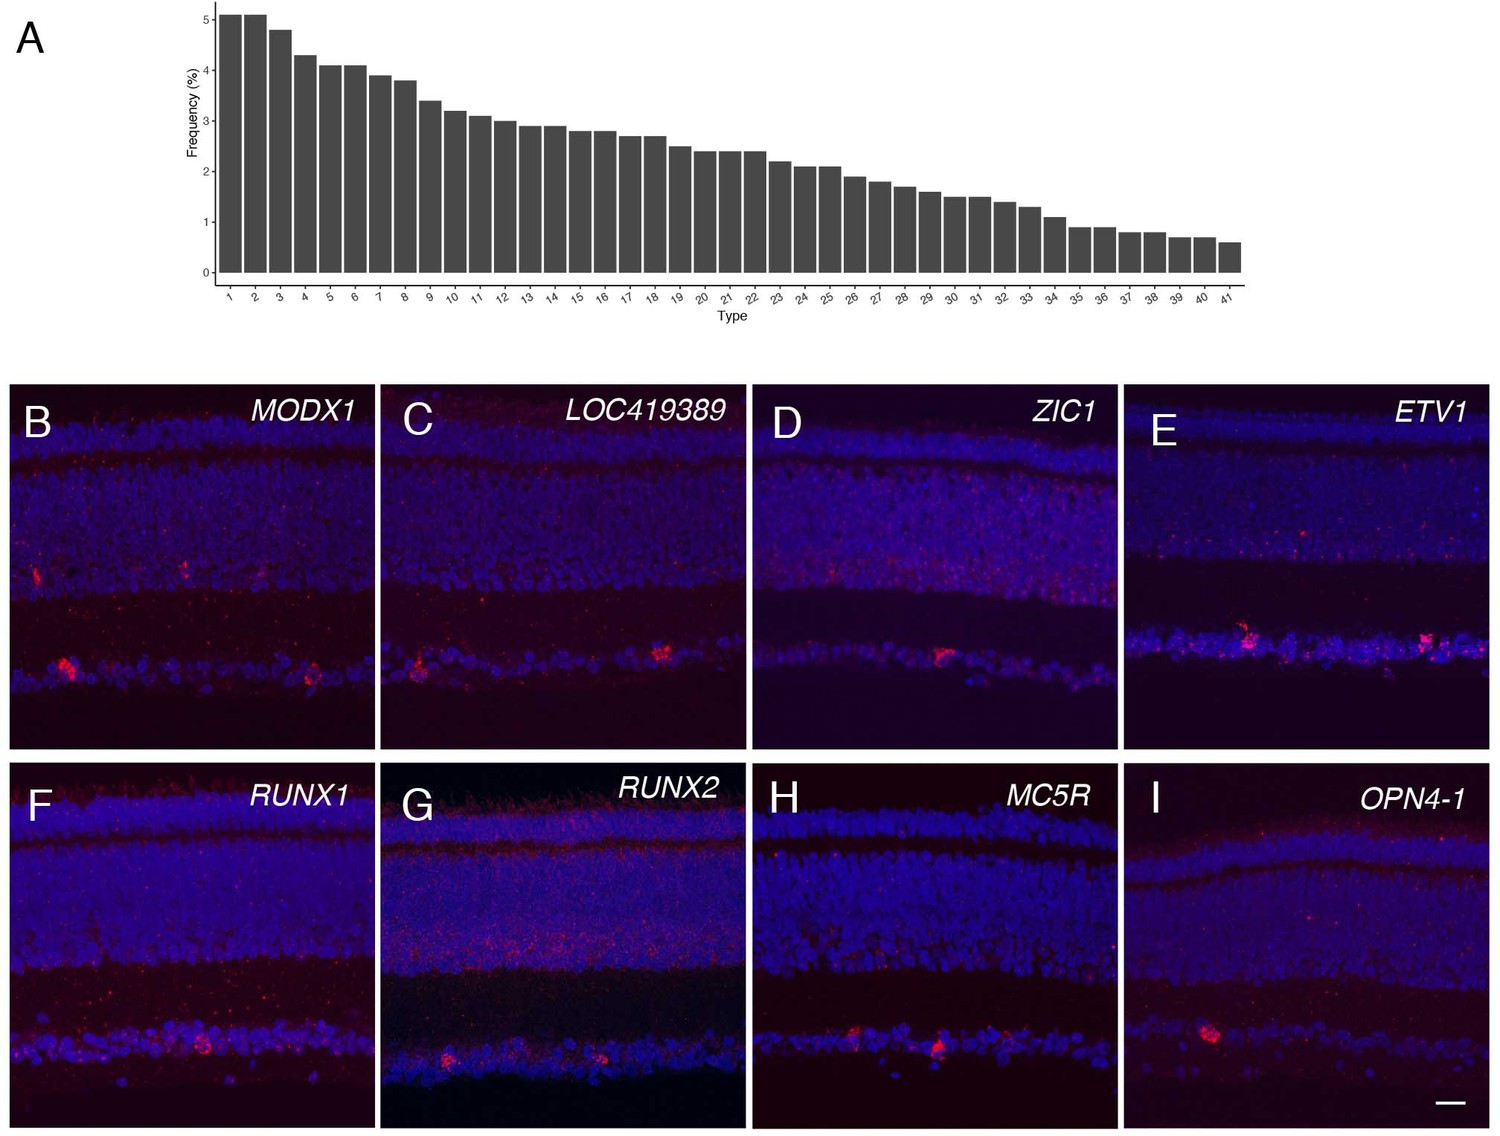
Frequency distribution and morphological analysis of retinal ganglion cell types.
(A) Frequency distribution of RGCs. Cluster numbers are from Figure 7A,B. (B–I) In situ hybridization of E16 retina for MODX1 in GC34 (B), LOC419389 in GC32 (C), ZIC1 in GC3 (D), ETV1 in GC15 or 21 (E), RUNX1 in GC36 (F), RUNX2 in GC1 (G), MC5R in GC23 (H), and OPN4.1 in GC41 (I). Bar, 10 µm.
Figure 7—figure supplement 2

Markers expressed and co-expressed by key retinal ganglion cell types.
Double-color in situ hybridization on E16 retina for RGC markers. Blue, DAPI.
Figure 8 with 3 supplements
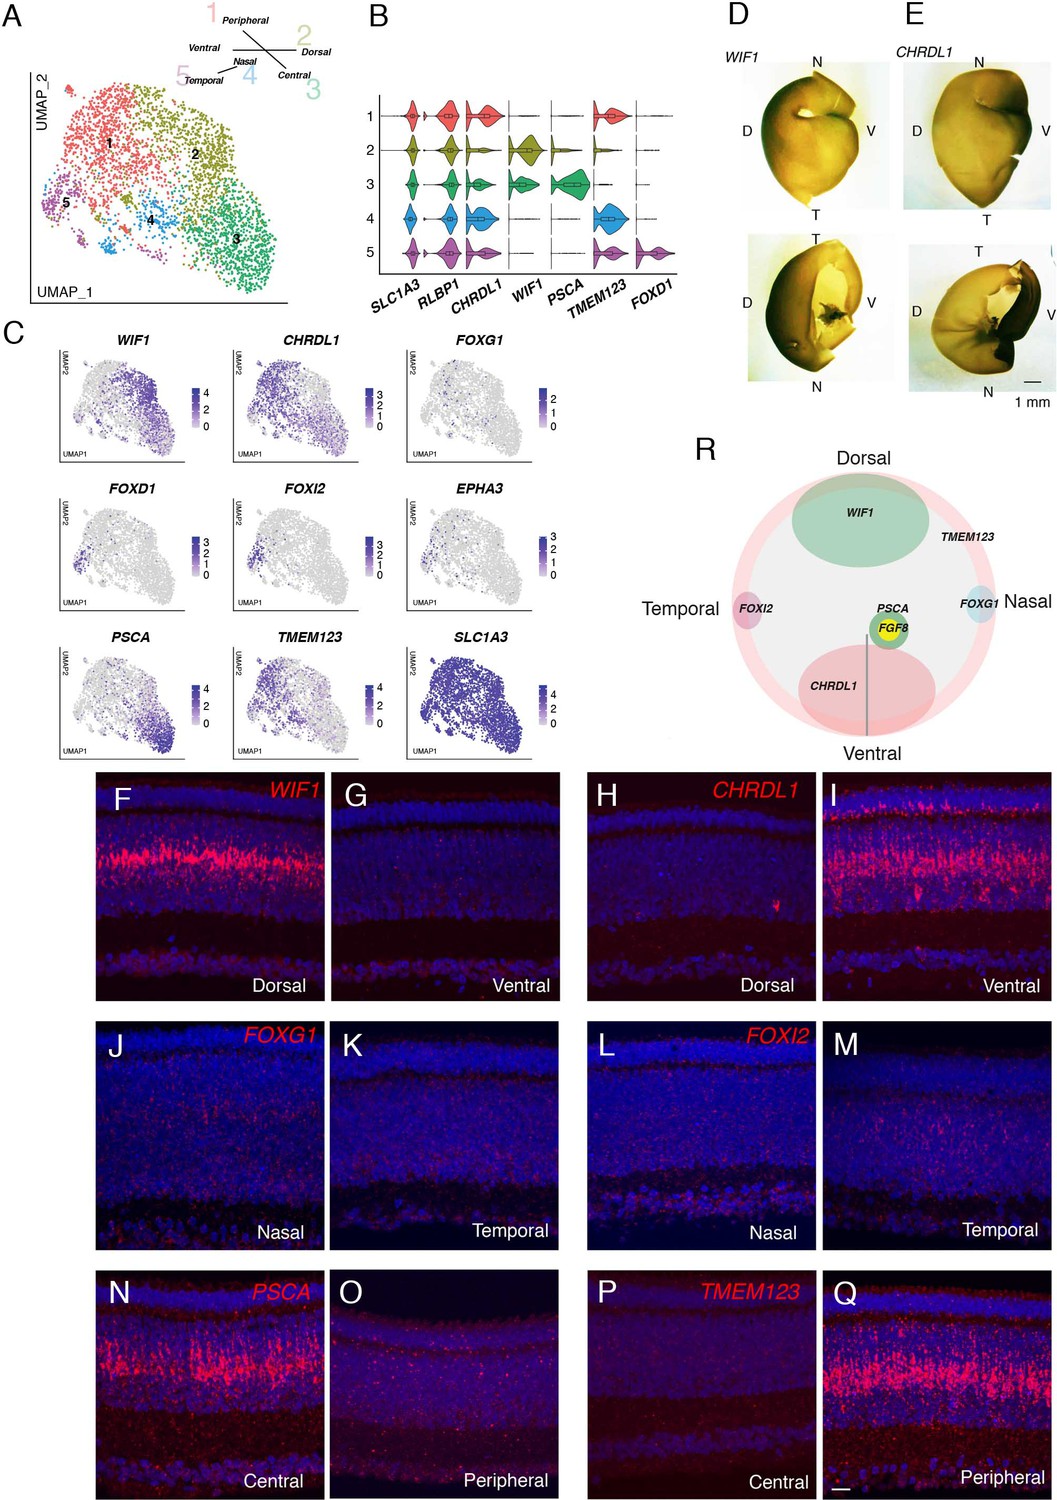
Transcriptomic map of topographic position in Müller glia.
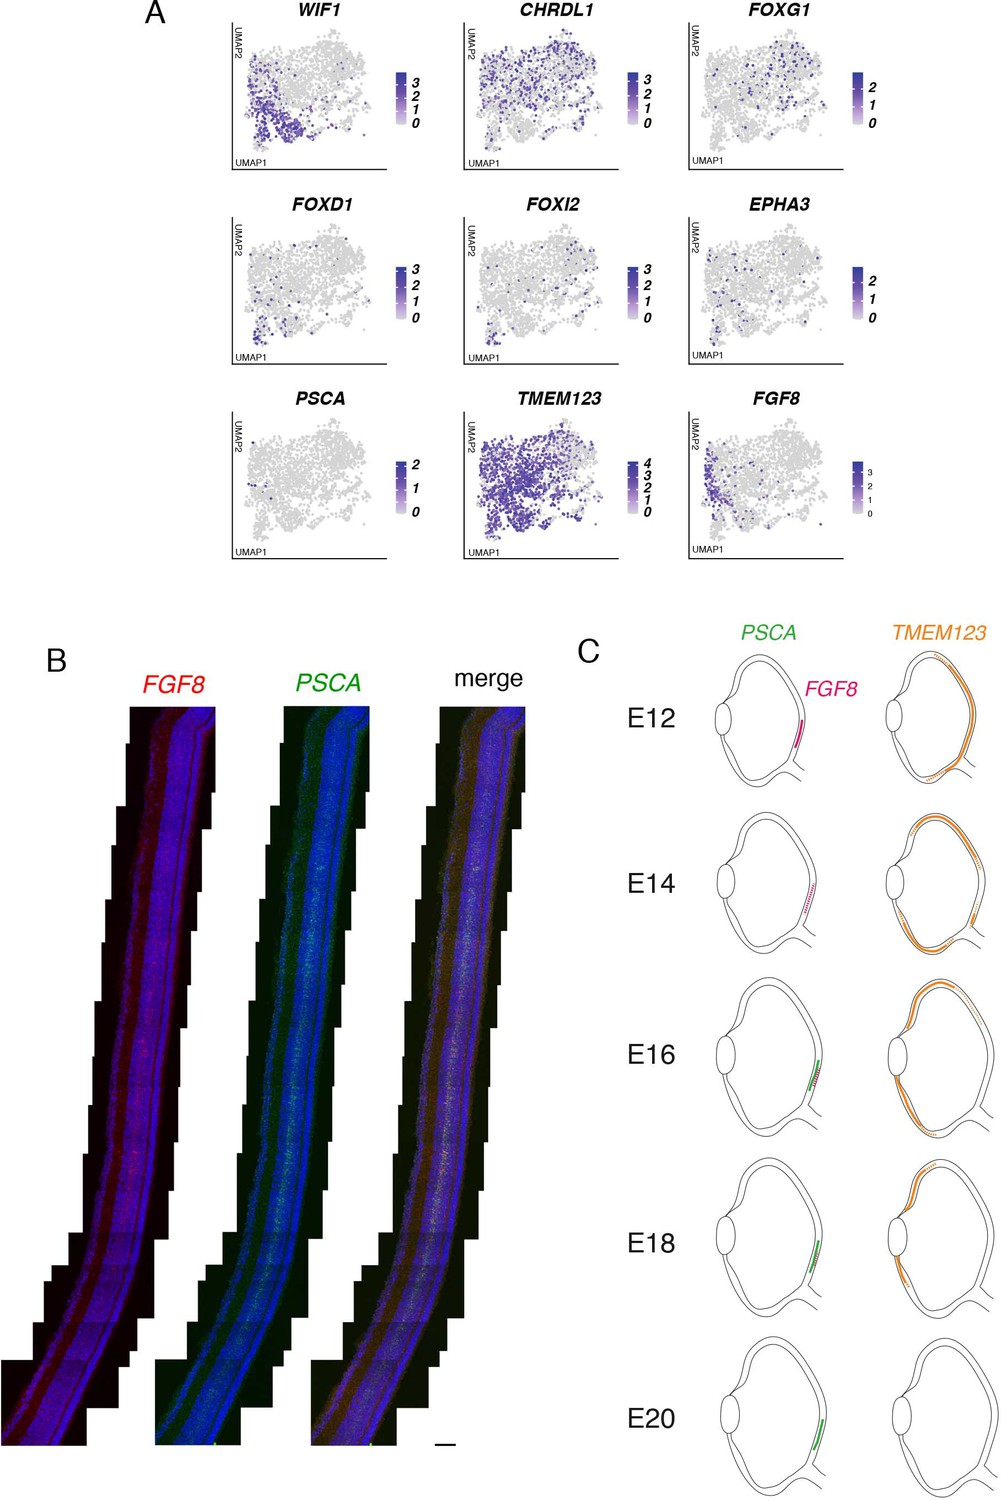
(A) Clustering of E18 MGs using UMAP. Inset shows relationship between clusters and retinal position. (B,C) Violin (B) and feature (C) plots of genes differentially expressed among MG clusters. B also shows that pan-MG genes SLC1A3 and RLBP1 are expressed at similar levels among clusters. (D, E) In situ hybridization for WIF1 (D) and CHRDL1(E) on whole mounts at E13 photographed from the posterior (top panels) or anterior (bottom panels). The black structure at the ventral edge in the bottom panels is the intrinsically pigmented pecten oculi. Bar, 1 mm. (F–Q) In situ hybridization on sections from indicated retinal regions to show position-selective of genes from C in Müller glia. F-I WIF1 and CHRDL1 on E16 dorsal and ventral sections. CHRDL1 is also in a subset of amacrine cells throughout the retina. (J–M) FOXG1 and FOXI2 on E14 nasal and temporal sections. (N–Q) PSCA and TMEM123 on E16 central and peripheral sections. Bar, 10 µm. (R) Summary of position-dependent expression of genes in Müller glia at E16, based on images such as those in D-Q.
Figure 8—figure supplement 1
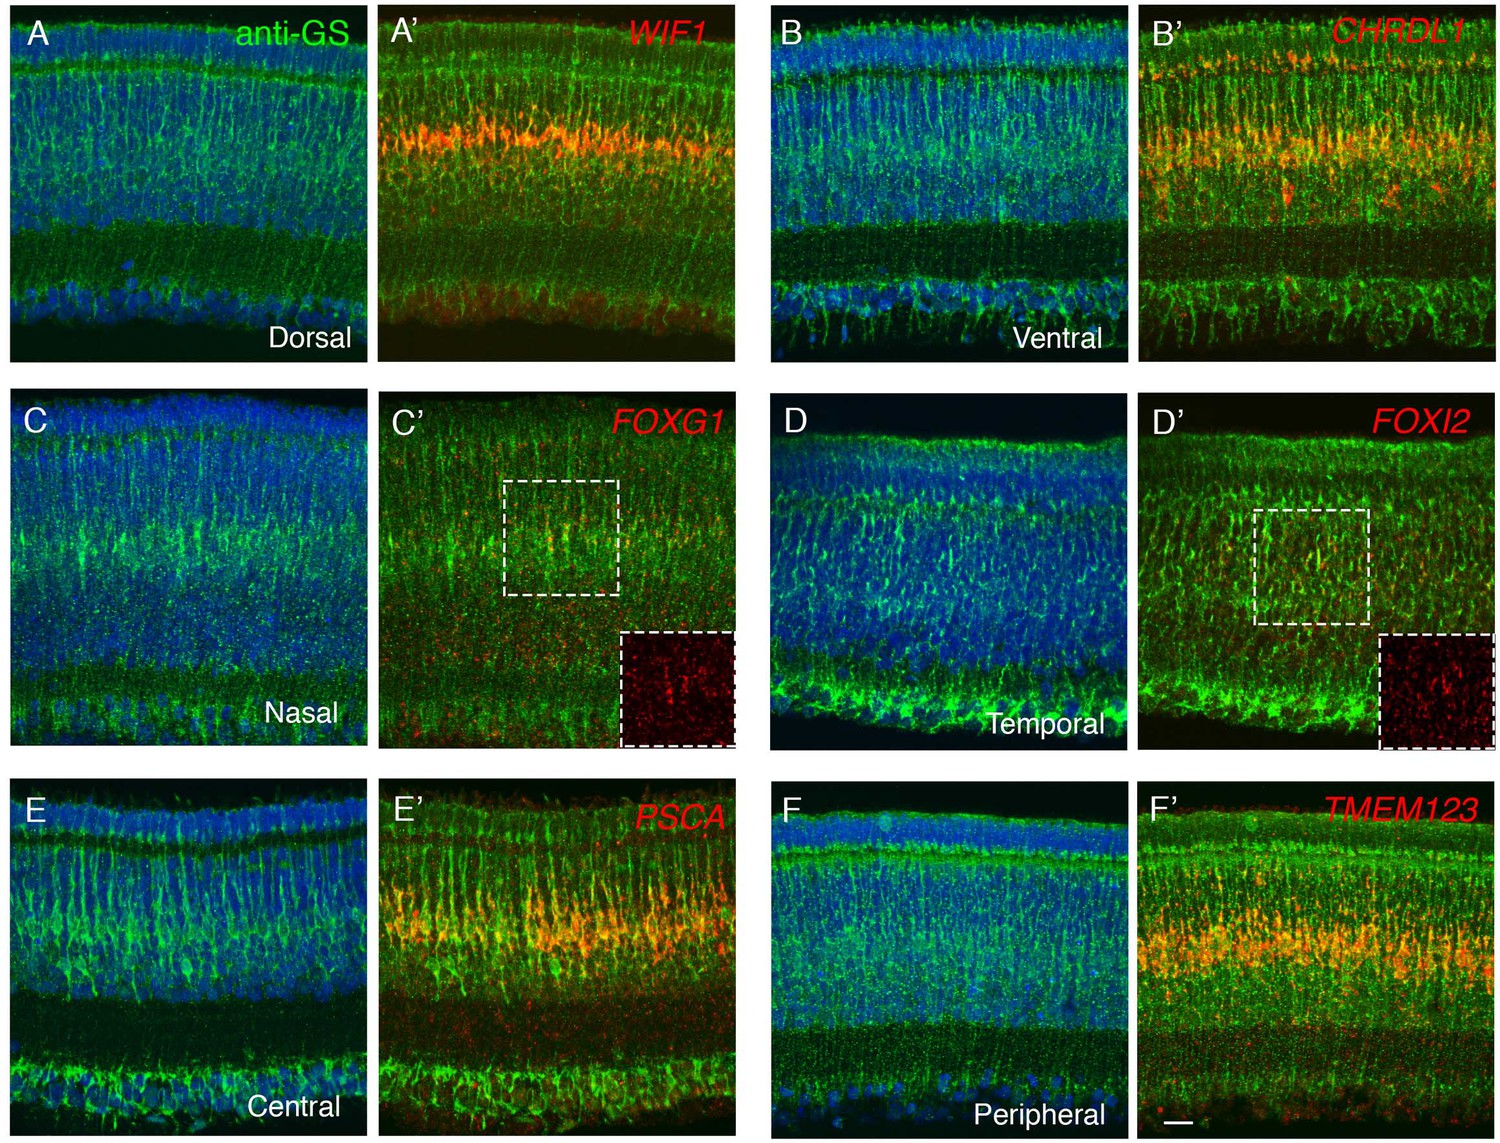
Regional distributions of Müller glial cell positional variants.
(A–F) In situ hybridization for WIF1 (A), CHRDL1(B) at E16, FOXG1 (C), FOXI2 (D) at E14, PSCA (E), TMEM123 (F) at E16. Sections were co-stained with anti-glutamate synthetase (anti-GS), showing that these genes are selectively expressed in Muller glia. Bar, 10 µm.
Figure 8—figure supplement 2
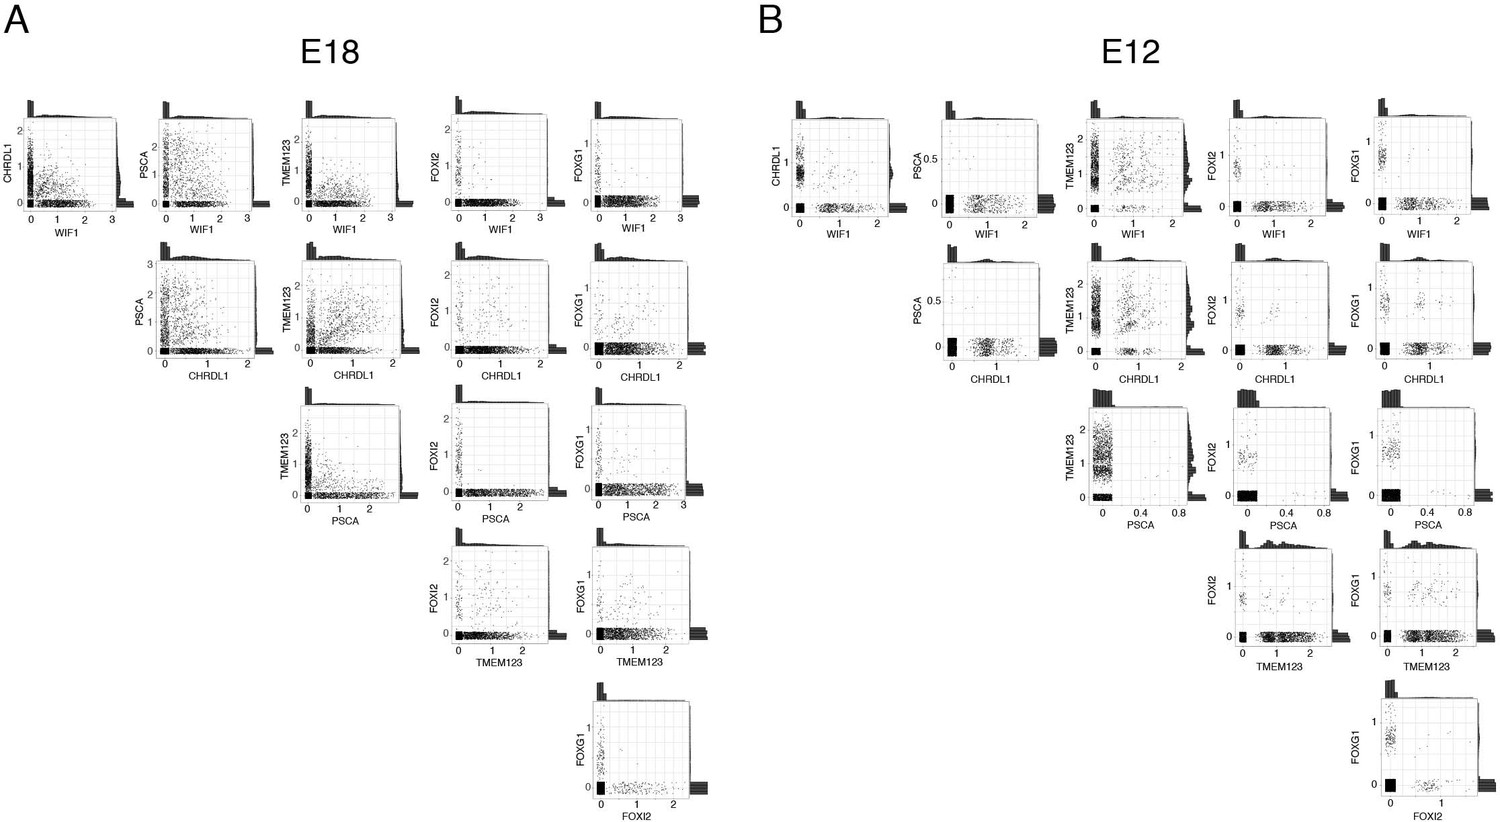
Co-expression of positional markers in Müller glia.
Co-expression in E18 (A) and E12 (B) retina. The x-axis and y-axis are the expression level of the marker genes, and each dot represents one Müller glial cell. Histogram plots on the top and right of each panel show the overall expression level of the two genes.
Figure 8—figure supplement 3
Developmental trajectories of Müller glial cell variants.
(A) Feature plots with a set of positional genes at E12 (see Figure 8C for expression at E18). (B) In situ hybridization for FGF8 and PSCA at E16, showing co-expression of FGF8 and PSCA at the high acuity area (area centralis). The PSCA+ domain is broader than the FGF8 domain (arrowheads). Bar, 20 µm. (C) Schematic representation for expression of PSCA, FGF8, and TMEM123. Between E12 and E20, TMEM123 is progressively restricted to peripheral retina and is then downregulated; FGF8 is present in central retina then downregulated; and PSCA appears in central retina between E14 and E16.
Figure 9 with 1 supplement
Developmental trajectory of oligodendrocytes.
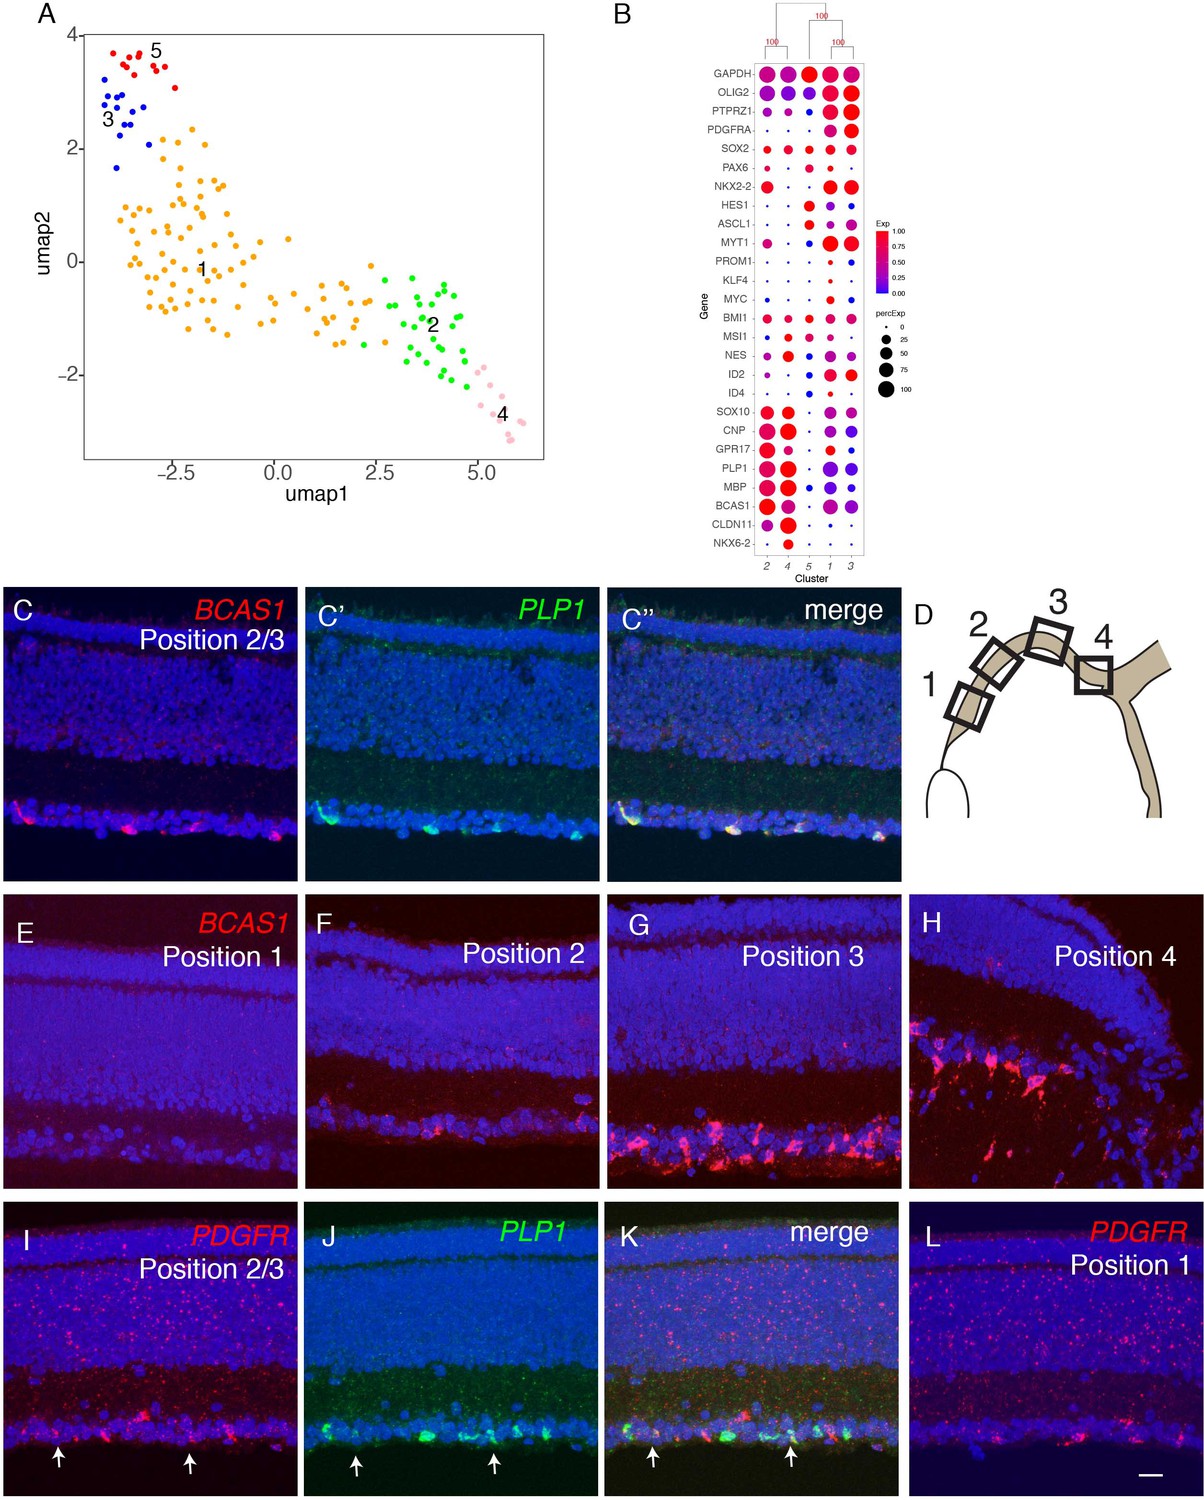
(A) Clustering of E18 oligodendrocytes viewed in UMAP. (B) Dot plots showing expression of selected genes expressed in all or subsets of oligodendrocytes. Numbers correspond to clusters in A. (C-K) Double-label in situ hybridization showing that BCAS1 and PLP1 are co-expressed in the ganglion cell layer (C) while PDGFR and PLP1 exhibit nonoverlapping expression (I-K). (E-L) Graded distribution of BCAS1+ and PDGFR+ oligodendrocytes along the central-to-peripheral axis at E16. Positions of sections (E–L) are shown in D.
Figure 9—figure supplement 1
Frequency distribution and molecular analysis of oligodendrocyte variants.
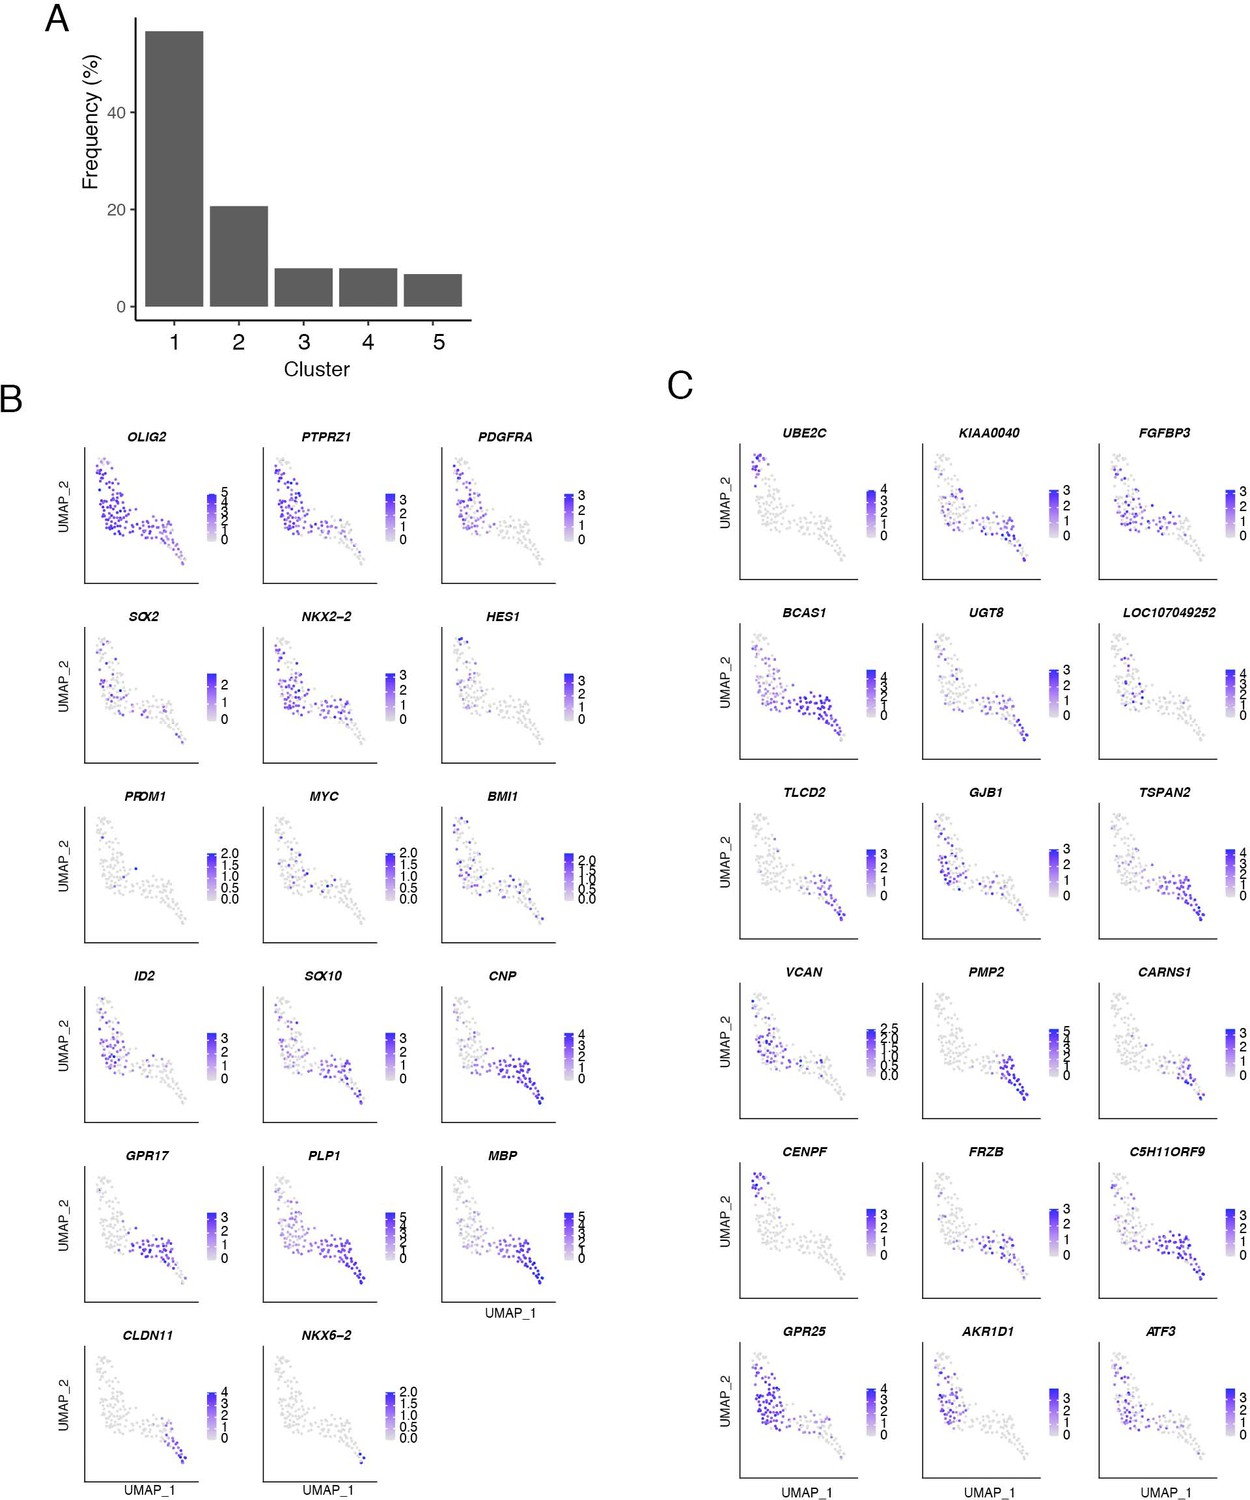
(A) Frequency distribution of oligodendrocytes. Cluster Numbers are from Figure 9A,B. (B,C) Feature plots showing expression of oligodendrocyte-characteristic genes that have been studied in mammals (B) and that we found to be selectively expressed in chicks (C).
Figure 10

Conserved transcriptomic identity of cell classes in mammals and chicks.
(A) UMAP visualization of pooled cells from chick, mouse, macaque following unsupervised clustering. Colors distinguish classes identified by reference to canonical markers (C) and labels previously assigned to each species separately (D). (B) The same as A, but colors indicate species. (C) Feature plot showing the canonical markers of each retina cell class. (D) Confusion matrix comparing the class identity by clustering of pooled cells (on y-axis) to the class annotation when each dataset was analyzed individually (x-axis). (E) Dendrogram based on the transcriptomic similarity of cell classes from each species. (F) Dendrogram based on overall retinal cell transcriptomic similarity among the four species.
Figure 11 with 2 supplements
Conserved transcriptomic identity of photoreceptor (PR), horizontal (HC), and bipolar cell (BC) types in mammals and chicks.
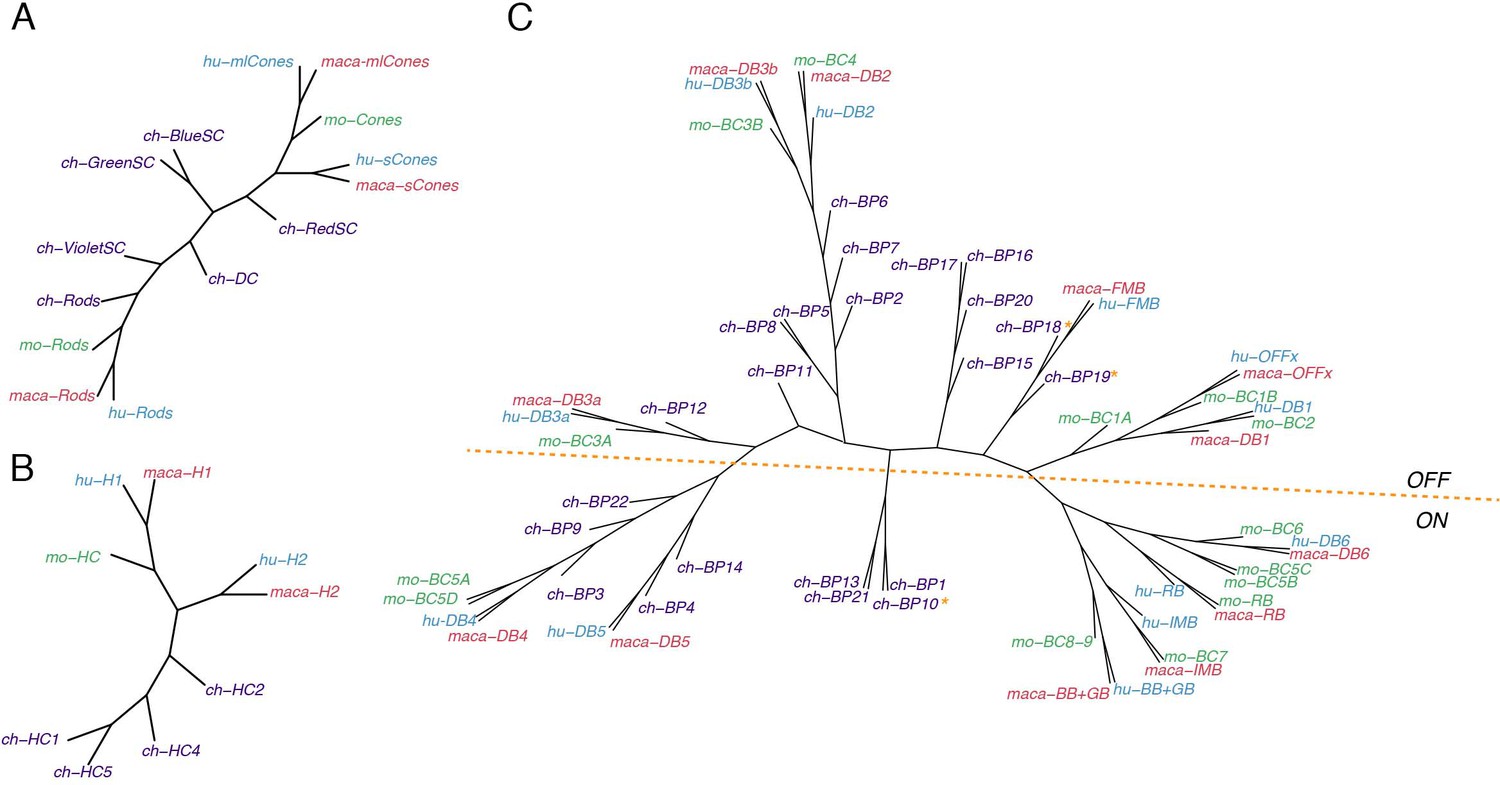
Consensus dendrogram tree for PR (A), HC (B), and BC (C) types from chick, mouse, macaque, and human single-cell dataset. In C, ON and OFF types are globally separated by a dotted line, but three exceptions from chick BC types are indicated by asterisk.
Figure 11—figure supplement 1

Cross-species comparisons of amacrine cell types.
(A) UMAP visualization of pooled amacrine cells (ACs) from chick, mouse, macaque, and human retina following unsupervised clustering. (B) The same as A, but colors code for species. (C) Relationship of clusters from A to AC types identified in each species separately. Consensus dendrogram tree, built as in Figure 11, is shown at the left. Three groups (VG3, SEG, and SAC) conserved between chick and mammals are highlighted.
Figure 11—figure supplement 2
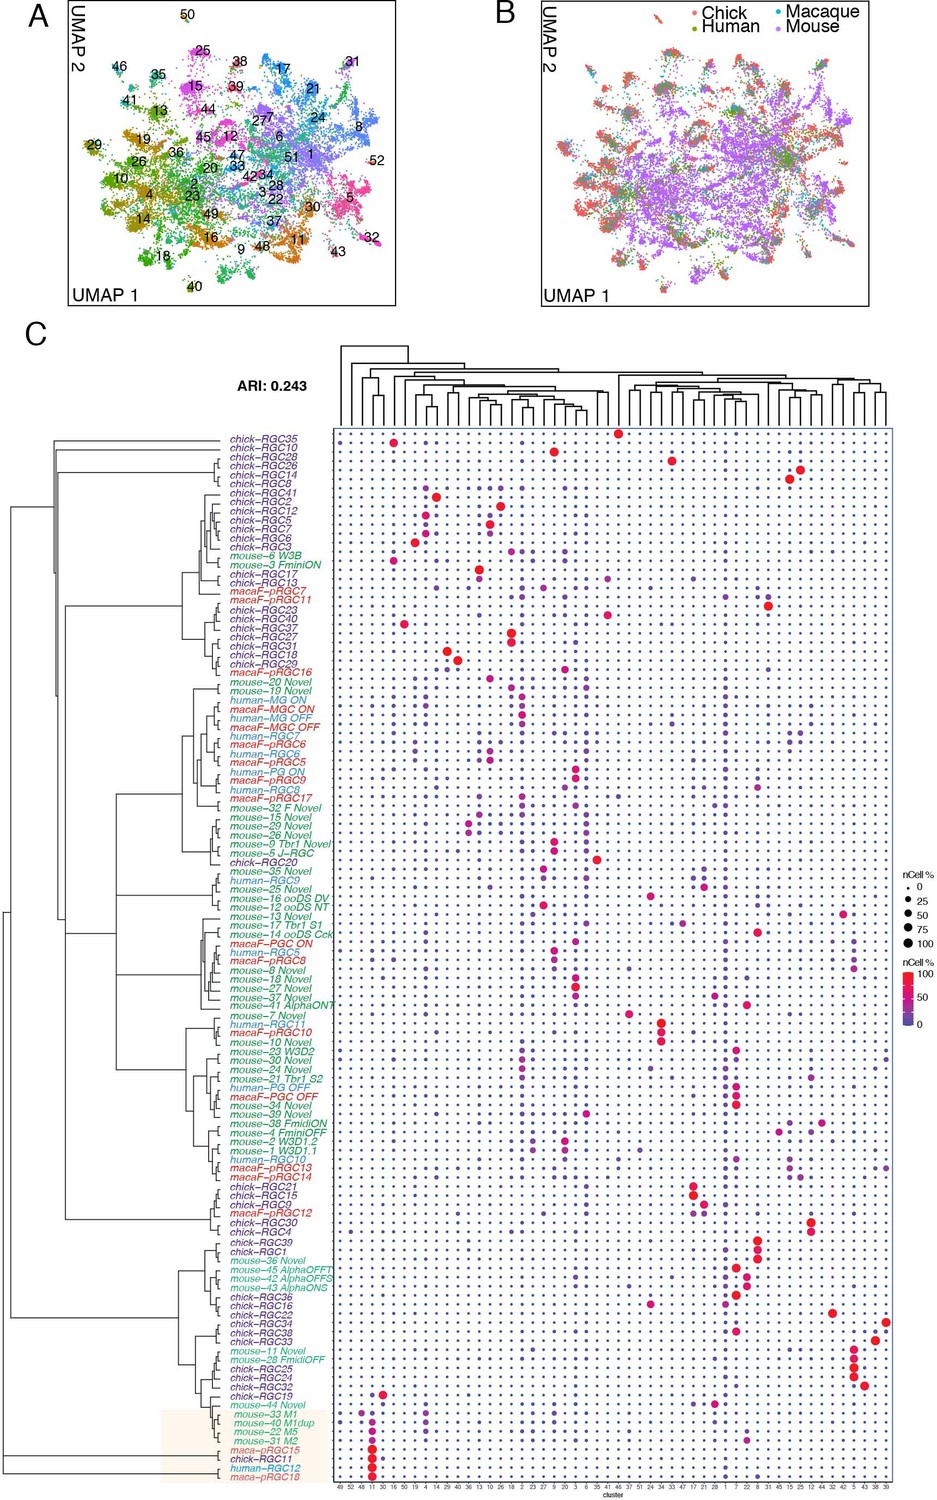
Cross-species comparisons of retinal ganglion cell types.
(A) UMAP visualization of pooled RGCs from chick, mouse, macaque and human retina following unsupervised clustering. (B) The same as A, but colors code for species. (C) Relationship of clusters from A to RGC types identified in each species separately. Consensus dendrogram tree, built as in Figure 11, is shown at the left. A group of ipRGC types conserved among chick and mammals is highlighted.
Figure 12
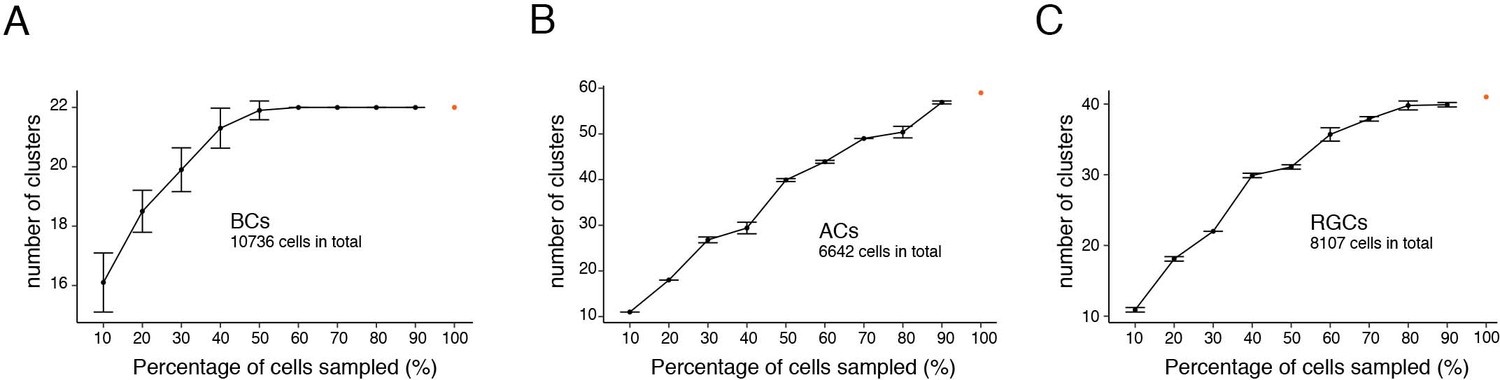
Down-sampling test of chick bipolar cells (BCs), amacrine cells (ACs), and RGCs.
Graphs show the number of cell clusters identified when using 10–90% of total cells, 10 repeats each (Mean ± SD). (A) BCs. (B) ACs. (C) RGCs.
Tables
Table 1
Numbers of cell types in mouse, primate (Macaque), and chick retina.
| Cell class | Mouse | Macaque* | Chick (mature) | Chick (developing or topographic) |
|---|---|---|---|---|
| Photoreceptors | 3 | 4 | 8 | 4 |
| Horizontal cells | 1 | 2 | 4 | 1 |
| Bipolar cells | 15 | 12 | 22 | - |
| Amacrine cells | 63 | 34 | 59 | - |
| RGCs | 46 | 18 | 41 | - |
| Müller glia | 1 | 1 | 1 | 6† |
| Oligodendrocytes | 0 | 0 | 1 | 4 |
| Astrocytes | 1 | 1 | 0 | 0 |
| Total | 129 | 72 | 136 | 15† |
-
Mouse: Macosko et al., 2015; Shekhar et al., 2016; Tran et al., 2019; Yan et al., 2020a.
Macaque: Peng et al., 2019.
-
*Peripheral retinal types plus foveal types not found in periphery.
†We found six positional variants of a single MG type, so the number of MG groups is 6, not 5 and the total number of groups is 150 (136+14) not 151 (136+15).
Key resources table
| Reagent type (species) or resource | Designation | Source or reference | Identifiers | Additional information |
|---|---|---|---|---|
| Genetic reagent (Gallus gallus) | GRCg6a | International Chicken Genome Consortium | GCF_000002315.5 | |
| Species | Fertilized chicken eggs (specific pathogen free) | Charles River Laboratories | Cat# 10100326 | |
| Sequenced-based reagent | Sequences of probes used for in situ hybridization | IDT | Supplementary file 1 in this study | |
| Sequenced-based reagent | Sequences of homology arms used to generate eCHIKIN probes | IDT, this study | Supplementary file 2 in this study | |
| Sequenced-based reagent | Alt-R CRISPR-Cas9 crRNA (specific to each gene) | IDT | Supplementary file 2 in this study | |
| Recombinant DNA reagent | pXL-BacII-CAG-Zeocin-3xF2A | Martell et al., 2016 (doi:10.1038/nbt.3563) | ||
| Recombinant DNA reagent | pCAG-PBorf | Yamagata and Sanes, 2012 (doi:10.1523/JNEUROSCI.3193-12.2012) | ||
| Recombinant DNA reagent | pXL-BacII-CAG-mCherry | This study | ||
| Recombinant DNA reagent | pXL-BacII--loxP-STOP-loxP-Venus | This study | ||
| Recombinant DNA reagent | pXL-BacII-CAG-Venus | Yamagata and Sanes, 2012 (doi:10.1523/JNEUROSCI.3193-12.2012) | ||
| Recombinant DNA reagent | pCAG-Cre:GFP | Addgene | Addgene#13776 | |
| Antibody | Anti-chicken Thy1 (Mouse monoclonal) | BSJ-1 (French and Jeffrey, 1986, doi:10.1002/jnr.490160304) | 0.01 µ /ml for cell purification | |
| Antibody | Anti-Calbindin (Rabbit polyclonal) | Swant | Cat# CB-38a; RRID:AB_10000340 | IF(1/1000) |
| Antibody | Anti-GFP (Rabbit polyclonal) | Millipore | Cat# AB3080P; RRID:AB_2630379 | IF(1/1000) |
| Antibody | Anti-Brn3a (Mouse monoclonal) | Millipore | Cat# MAB1585; RRID:AB_94166 | IF(1/1000) |
| Antibody | Anti-Calretinin (Rabbit polyclonal) | Millipore | Cat# AB5054; | IF(1/1000) |
| RRID:AB_2068506 | ||||
| Antibody | Anti-Calbindin (Rabbit polyclonal) | Swant | Cat# CB38; RRID:AB_10000340 | IF(1/1000) |
| Antibody | Anti-Protein kinase C- α (Rabbit polyclonal) | Sigma | Cat# P4334 | IF(1/10000) |
| Antibody | Anti-VSX2 (Rabbit polyclonal) | GeneTex | Cat# GTX114143 | IF(1/1000) |
| Antibody | Anti-HA tag (Rat monoclonal) | Roche | Clone name: 3F10 | IF(1/1000) |
| Antibody | Anti-Satb1 (Rabbit polyclonal) | Abcam | Cat# ab109122; RRID:AB_10862207 | IF(1/1000) |
| Antibody | Anti-Satb2 (Mouse monoclonal) | Abcam | Cat# ab51502; RRID:AB_882455 | IF(1/1000) |
| Antibody | Anti-Neuropeptide Y (Rabbit polyclonal) | Abcam | Cat# ab10980 | IF(1/1000) |
| Antibody | Anti-AP2A (Mouse monoclonal) | Developmental Studies Hybridoma Bank | Clone name: 3B5 | IF(1/100) |
| Antibody | Anti-AP2B (Mouse monoclonal) | Developmental Studies Hybridoma Bank | Clone name: 2A4 | IF(1/100) |
| Antibody | Anti-OTX1 (Mouse monoclonal) | Developmental Studies Hybridoma Bank | Clone name: 5F5 | IF(1/100) |
| Antibody | Anti-SOX5 (Mouse monoclonal) | Developmental Studies Hybridoma Bank | Clone name: 1C12 | IF(1/100) |
| Antibody | Anti-PAX6 (Mouse monoclonal) | Developmental Studies Hybridoma Bank | Clone name: PAX6 | IF(1/100) |
| Antibody | Anti-NMB (Mouse monoclonal) | Developmental Studies Hybridoma Bank | Clone name: NMB1 | IF(1/10) |
| Antibody | Anti-STRA6 (Mouse polyclonal) | This study | IF (1:1000) | |
| Antibody | Anti-TPBGL (Mouse polyclonal) | This study | IF (1:500) | |
| Antibody | Anti-SLC6A4 (Mouse polyclonal) | This study | IF (1:200) | |
| Antibody | Anti-chicken choline acetyltransferase (Rabbit polyclonal) | Johnson and Epstein, 1986 (doi:10.1111/j.1471-4159.1986.tb13064.x) | IF (1:1000) | |
| Antibody | Anti-chicken glutamate synthetase (Rabbit polyclonal) | Linser and Moscona, 1979 (doi: 10.1073/pnas.76.12.6476) | IF (1:1000) | |
| Commercial assay or kit | Papain Dissociation System, Without EBSS | Worthington | Cat# LK003160 | |
| Commercial assay or kit | Chromium Single Cell 30Library and Gel Bead Kit v2, 10X Genomics Cat#120237 16rxns | 10 X Genomics | Cat# 120237 | |
| Chemical compound, drug | Goat anti-mouse IgG conjugated magnetic beads | Miltenyi Biotec | Cat# 484–02 | |
| Chemical compound, drug | Alt-R CRISPR-Cas9 tracrRNA | IDT | Cat# 1072533 | |
| Chemical compound, drug | Alt-R S.p. Cas9 Nuclease V3 | IDT | Cat# 1081058 | |
| Chemical compound, drug | Alt-R Cas9 Electroporation Enhancer | IDT | Cat# 1075915 | |
| Chemical compound, drug | Alt-R HDR Enhancer | IDT | Cat# 1081072 | |
| Chemical compound, drug | Fast Green FCF | Sigma-Aldrich | Cat# F7252 | |
| Commercial assay or kit | TSA Cyanine 3 Plus Evaluation Kit | Perkin Elmer | Cat# NEL744E001KT (FP1170) | |
| Commercial assay or kit | TSA Fluorescein Plus Evaluation Kit | Perkin Elmer | Cat# NEL741E001KT (FP1168) | |
| Chemical compound, drug | Anti-Digoxigenin-POD, Fab fragments | Roche | Cat# 11207733910 | |
| Commercial assay or kit | EconoTaq PLUS GREEN 2X Master Mix | Lucigen | Cat# 30033–1 | |
| Commercial assay or kit | CIAquick-Gel Extraction Kit | Oiagen | Cat# 28704 | |
| Commercial assay or kit | MiniMACS Separation Unit | Miltenyi Biotec | Cat# 421–02 | |
| Other | MACS Multistand | Miltenyi Biotec | Cat# 423–03 | |
| Other | Type WHM large cell separation columns | Miltenyi Biotec | Cat# 422–02 | |
| Other | BTX 830 | BTX | Cat# 45–0662 | |
| Other | Genetrode | BTX | Cat# 45–0116 | |
| Software, algorithm | ImageJ (Fiji) Version 2.1.0 | Fiji | https://imagej.net/Fiji | |
| Software, algorithm | R 3.6.2 | The R foundation | https://www.r-project.org/ | |
| Software, algorithm | RStudio 1.3.1056 | Rstudio | https://rstudio.com | |
| Software, algorithm | Adobe Photoshop 20.0.9 release | Adobe | https://www.adobe.com |
Additional files
-
Supplementary file 1
Sequences of probes used for in situ hybridization.
- https://cdn.elifesciences.org/articles/63907/elife-63907-supp1-v2.xlsx
-
Supplementary file 2
Sequences of homology arms used to generate eCHIKIN probes.
- https://cdn.elifesciences.org/articles/63907/elife-63907-supp2-v2.xlsx
-
Supplementary file 3
Basic quality measures of each cluster.
- https://cdn.elifesciences.org/articles/63907/elife-63907-supp3-v2.zip
-
Transparent reporting form
- https://cdn.elifesciences.org/articles/63907/elife-63907-transrepform-v2.docx
Download links
A two-part list of links to download the article, or parts of the article, in various formats.
Downloads (link to download the article as PDF)
Open citations (links to open the citations from this article in various online reference manager services)
Cite this article (links to download the citations from this article in formats compatible with various reference manager tools)
A cell atlas of the chick retina based on single-cell transcriptomics
eLife 10:e63907.
https://doi.org/10.7554/eLife.63907


