Neural basis of corruption in power-holders
- Key Laboratory of Brain, Cognition and Education Sciences, Ministry of Education, China; School of Psychology, Center for Studies of Psychological Application, and Guangdong Key Laboratory of Mental Health and Cognitive Science, South China Normal University, China
- Laboratory of Neuroeconomics, Institut des Sciences Cognitives Marc Jeannerod, CNRS, France
- Motivation, Brain & Behavior (MBB) Team, Institut du Cerveau et Moelle Epiniere, Hôpital de la Pitié-Salpêtrière, France
- Sorbonne Université, France
- Université Claude Bernard Lyon 1, France
- EmLyon, France
Figures
Figure 1
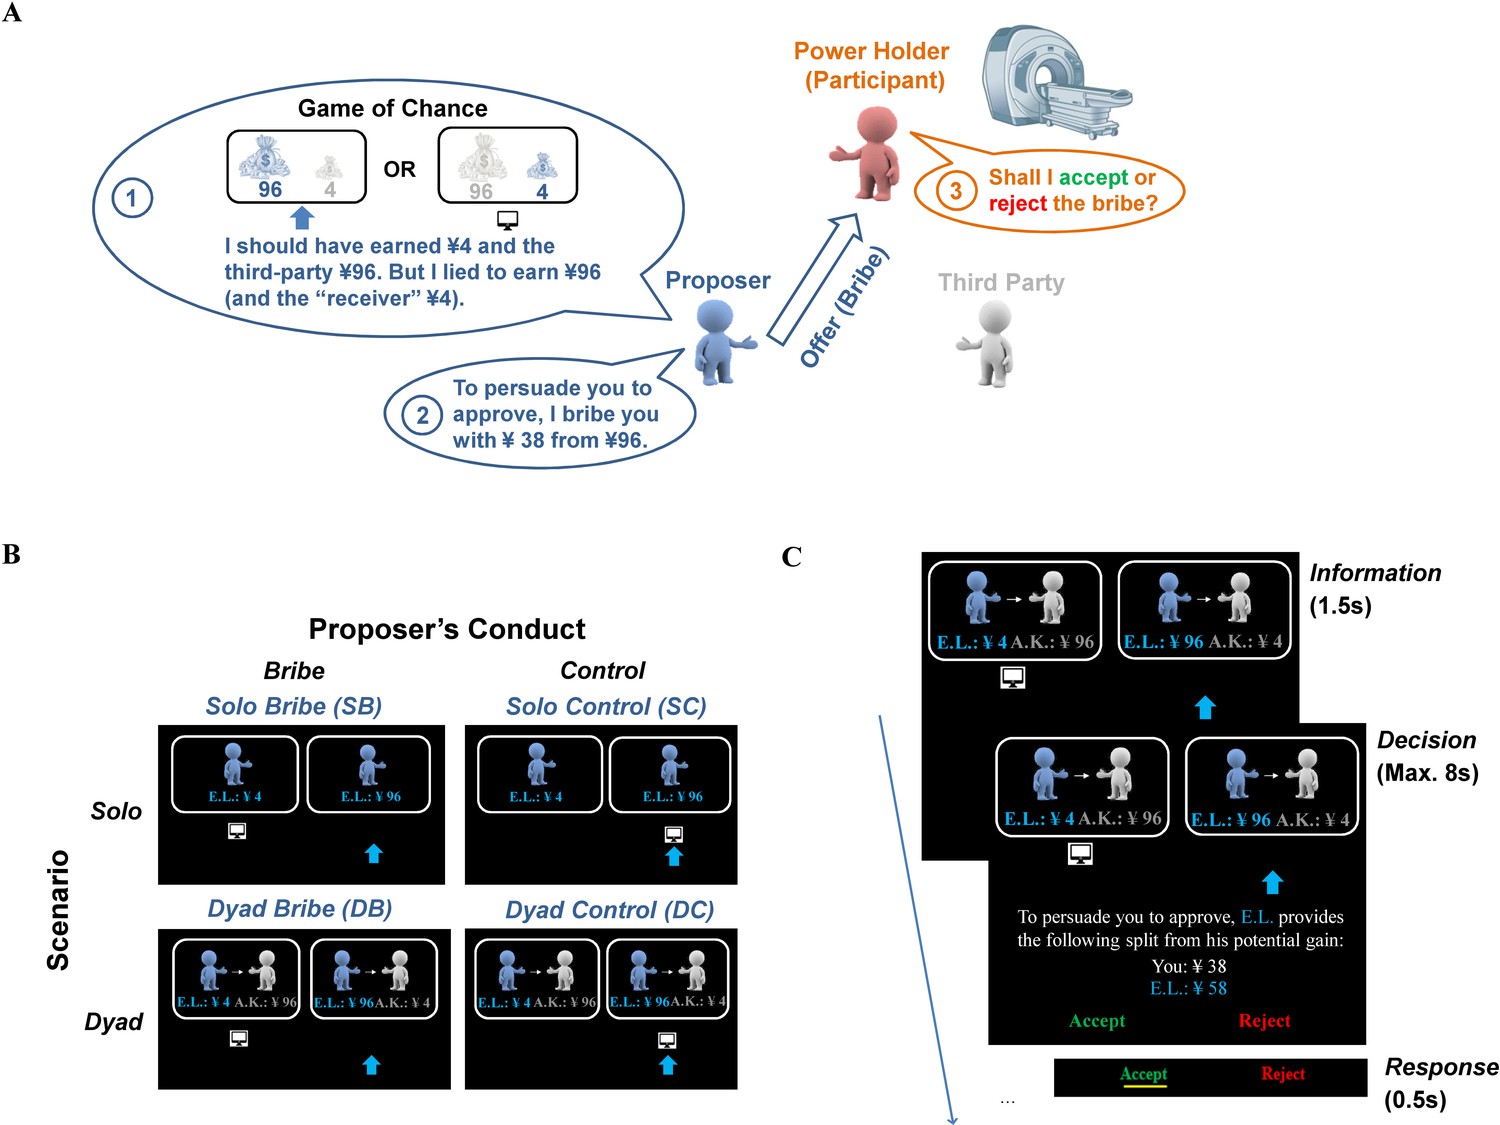
Task and design.
(A) Schematic illustration of the behavioral paradigm. Here, we show the bribe case in the Dyad scenario (i.e., the Dyad Bribe condition [DB]). This condition consists of three roles: a proposer, a third party, and a power-holder (the real participant). Participants were endowed with the power to decide whether the proposer would earn a higher profit by lying, which also caused financial losses to a third party in a previous online study. The proposer hence bribes the power-holder, whose task was to decide whether to take the bribe. Notably, all proposers and third parties were framed as participants in a previous online study (‘Game of Chance’), which was actually fictitious. (B) Illustration of all experimental conditions. We manipulated two factors, that is, scenario (Solo or Dyad) and proposer’s conduct (Bribe or Control), which yielded four experimental conditions. (C) Trial procedure in the DB condition. In this example, a proposer (E.L.) lied by reporting the non-selected payoff option, which additionally harmed the interest of an innocent third party (A.K.), and bribed the power-holder with a certain amount of money from his/her potential gain (i.e., 38 out of 96 CNY). The participant needed to decide whether to accept or reject the bribe within 8 s (s). Once the decision was made (i.e., accepting the bribe here), a yellow bar appeared on the corresponding option to highlight the choice for 0.5 s, which was followed by a jittered fixation (i.e., 3–7 s with a mean of 5 s).
Figure 2 with 5 supplements
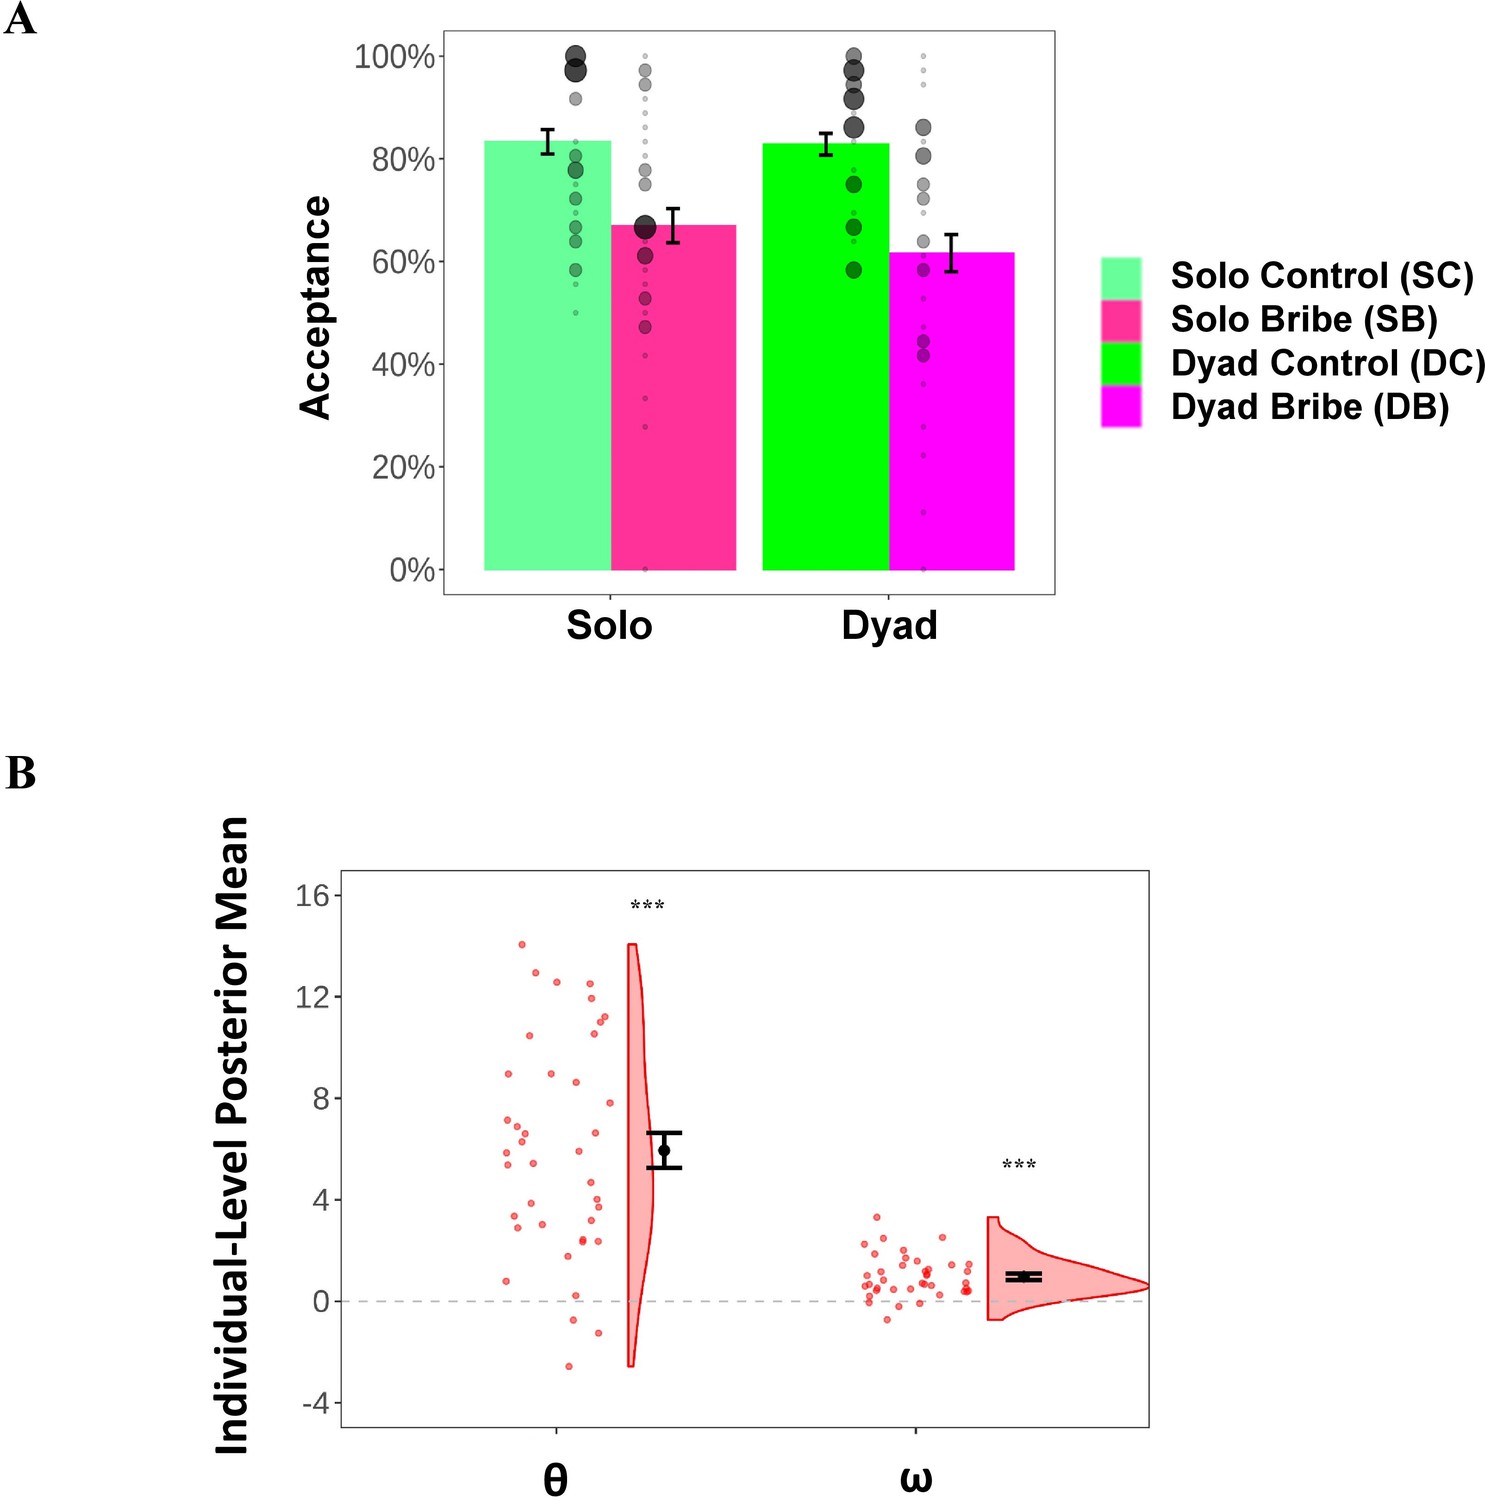
Results of behaviors and computational modeling.
(A) Acceptance rate (%) as a function of context (Solo/Dyad) and the proposer’s conduct (Control/Bribe). The significance was not marked because we did not perform statistical tests directly on these two dependent variables. Individual acceptance rates in each experimental condition are denoted by the black dots; the size of the dots represents the relevant sample size. (B) Posterior mean of individual-level key parameters characterizing moral costs (θ and ω) based on the winning model. Each black filled dot represents the group-level mean; each red dot represents the data of a single participant; the density curve represents the distribution of the data across all participants. Error bars represent the SEM; Significance: ***p<0.001.
Figure 2—figure supplement 1
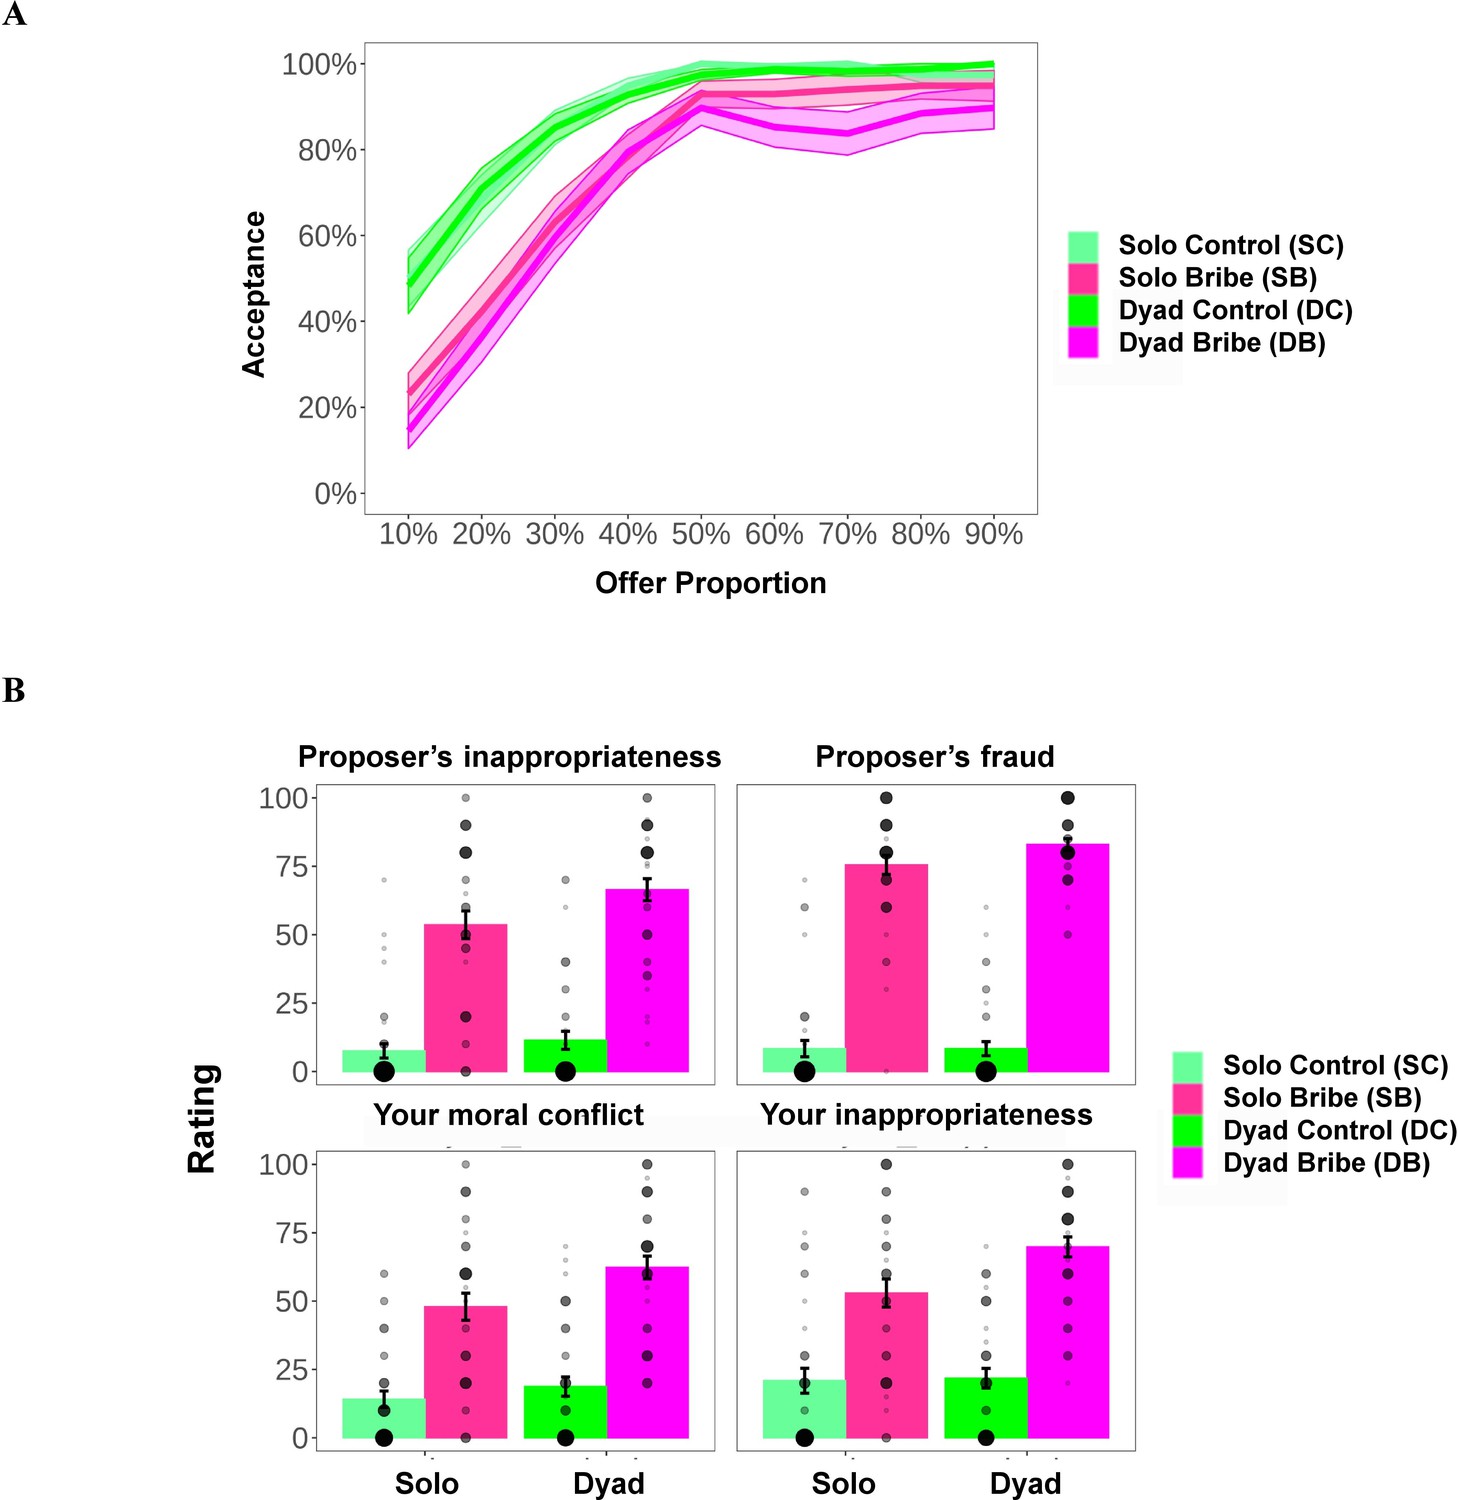
Results of acceptance rate and subjective ratings.
(A) Acceptance rate as a function of offer proportion (%) in all experimental conditions. Shaded areas represent SEM. (B) Post-task subjective rating. After completing the main task, participants reported the subjective feeling towards (1) the moral inappropriateness of the proposer’s behavior in the previous online test, (2) the seriousness of the fraud committed by the proposer, (3) the degree of their own moral conflict during decision-making, and (4) the moral inappropriateness when they accepted offers in the four experimental conditions, respectively. A Likert scale was used (0–100; the degree increases with the score). Individual ratings are denoted by the black dots; the size of the dots represents the relevant sample size.
Figure 2—figure supplement 2
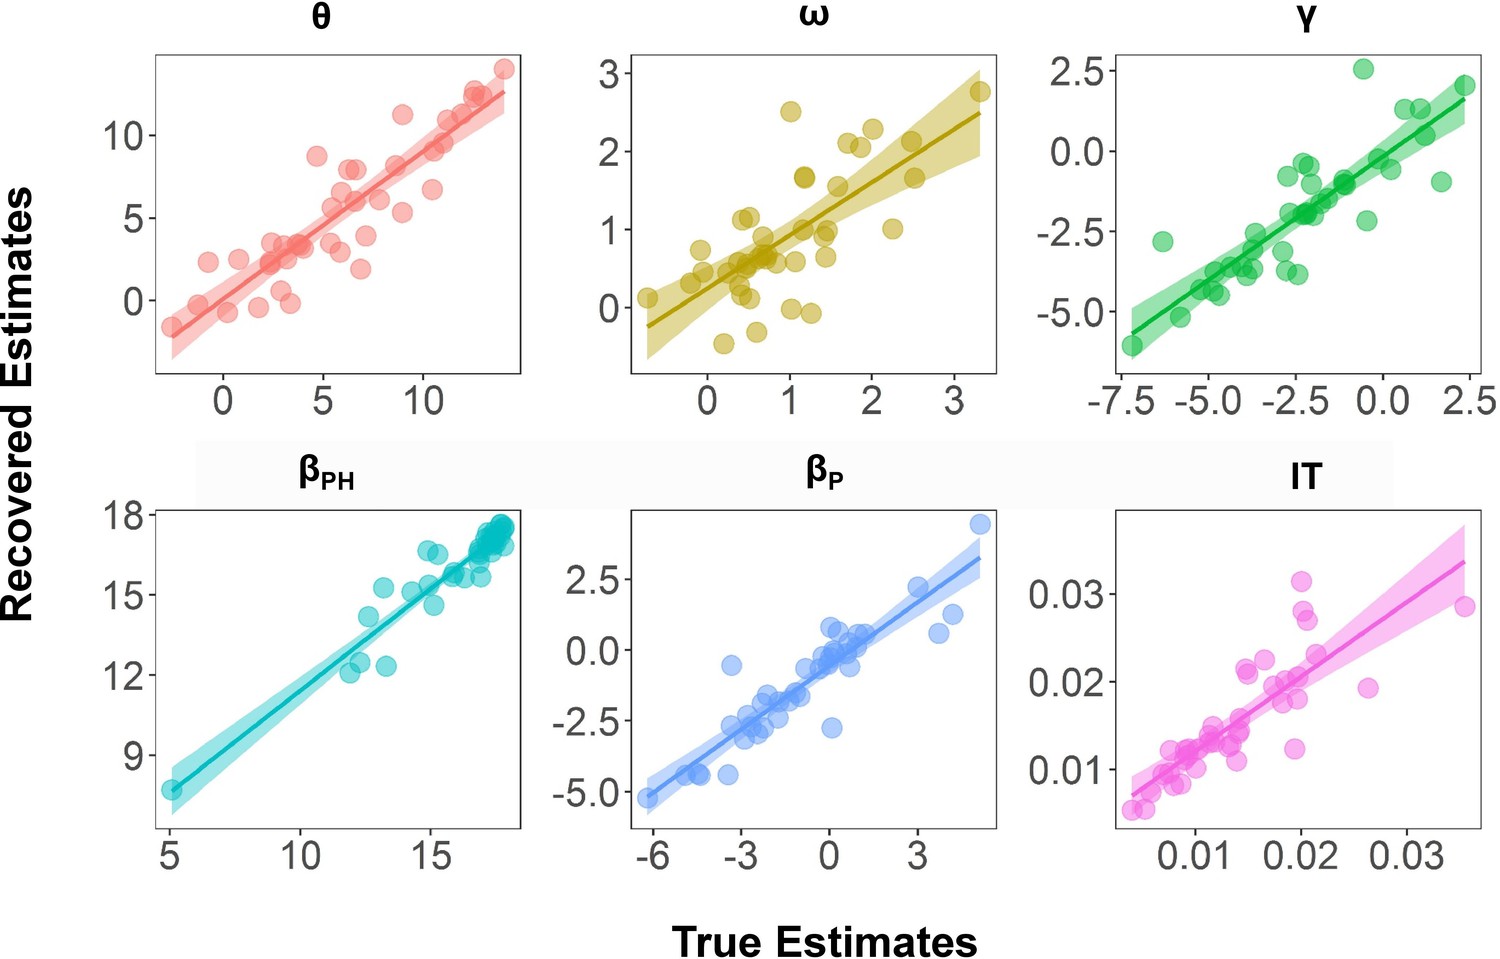
Results of parameter recovery analysis for each parameter in the winning model.
The individual-level posterior mean was used to refer to the parameter estimate with the hierarchical Bayesian approach. Each dot represents the data of a single participant. P: proposer; PH: power-holder.
Figure 2—figure supplement 3
Posterior predictive check of the winning model.
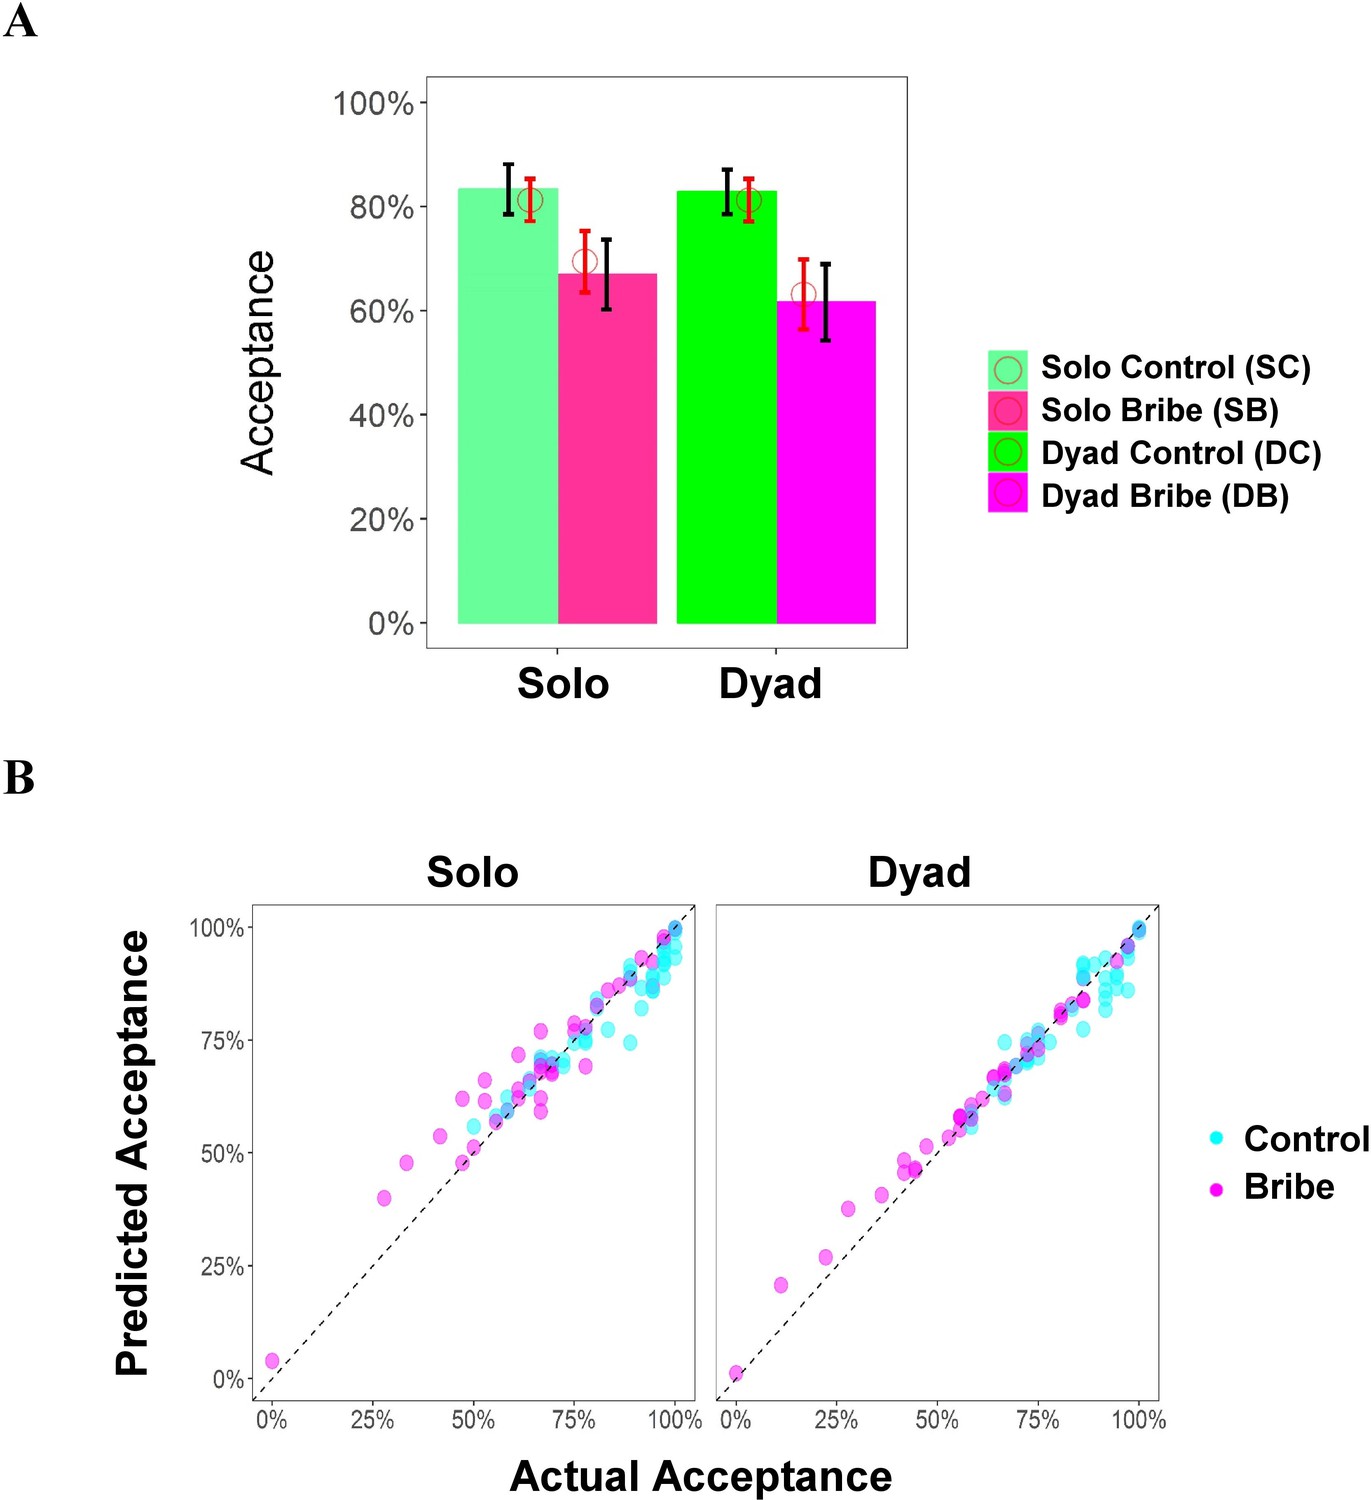
The model prediction (i.e., mean predicted proportion of acceptance) was calculated based on the posterior distribution of the parameters estimated based on the winning model in each experimental condition. (A) The bar plot of the average actual proportion of acceptance (%; indicated by the filled bar; the black bars indicate the SEM) and the average predicted proportion of acceptance (%; indicated by the red circle; red bars indicate 95% CI). (B) The scatter plot describing the actual proportion of acceptance (%) and the average predicted proportion of acceptance (%) across individuals. Each dot represents the data of a single participant.
Figure 2—figure supplement 4
Cross-validated posterior predictive check of the winning model.
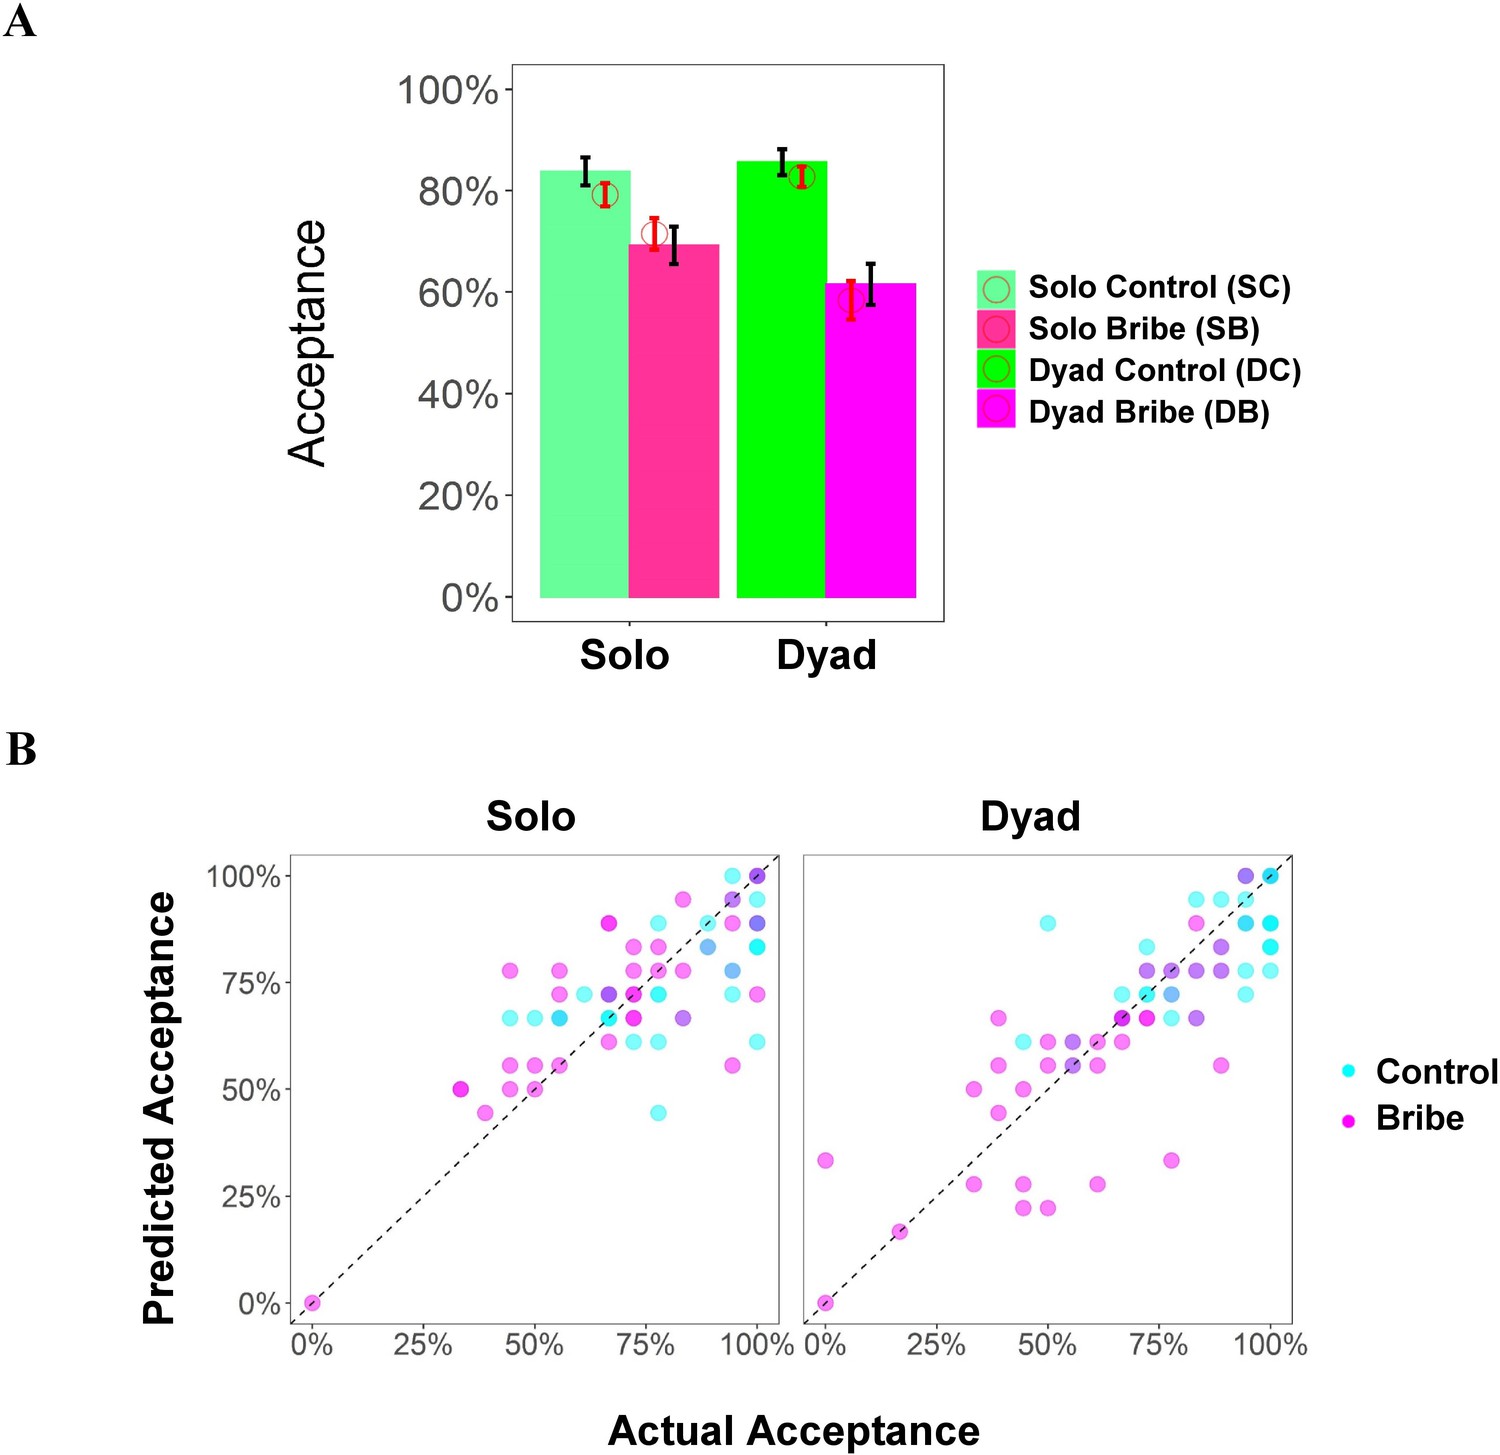
The model prediction (i.e., mean predicted proportion of acceptance) in Run 2 was calculated based on the posterior distribution of the parameters estimated based on the winning model using the data of Run 1 in each experimental condition. (A) The bar plot of the average actual proportion of acceptance (%; indicated by the filled bar; the black bars indicate the SEM) and the average predicted proportion of acceptance (%; indicated by the red circle; red bars indicate 95% CI). (B) The scatter plots describing the actual proportion of acceptance (%) and the average predicted proportion of acceptance (%) across individuals. Each dot represents the data of a single participant.
Figure 2—figure supplement 5
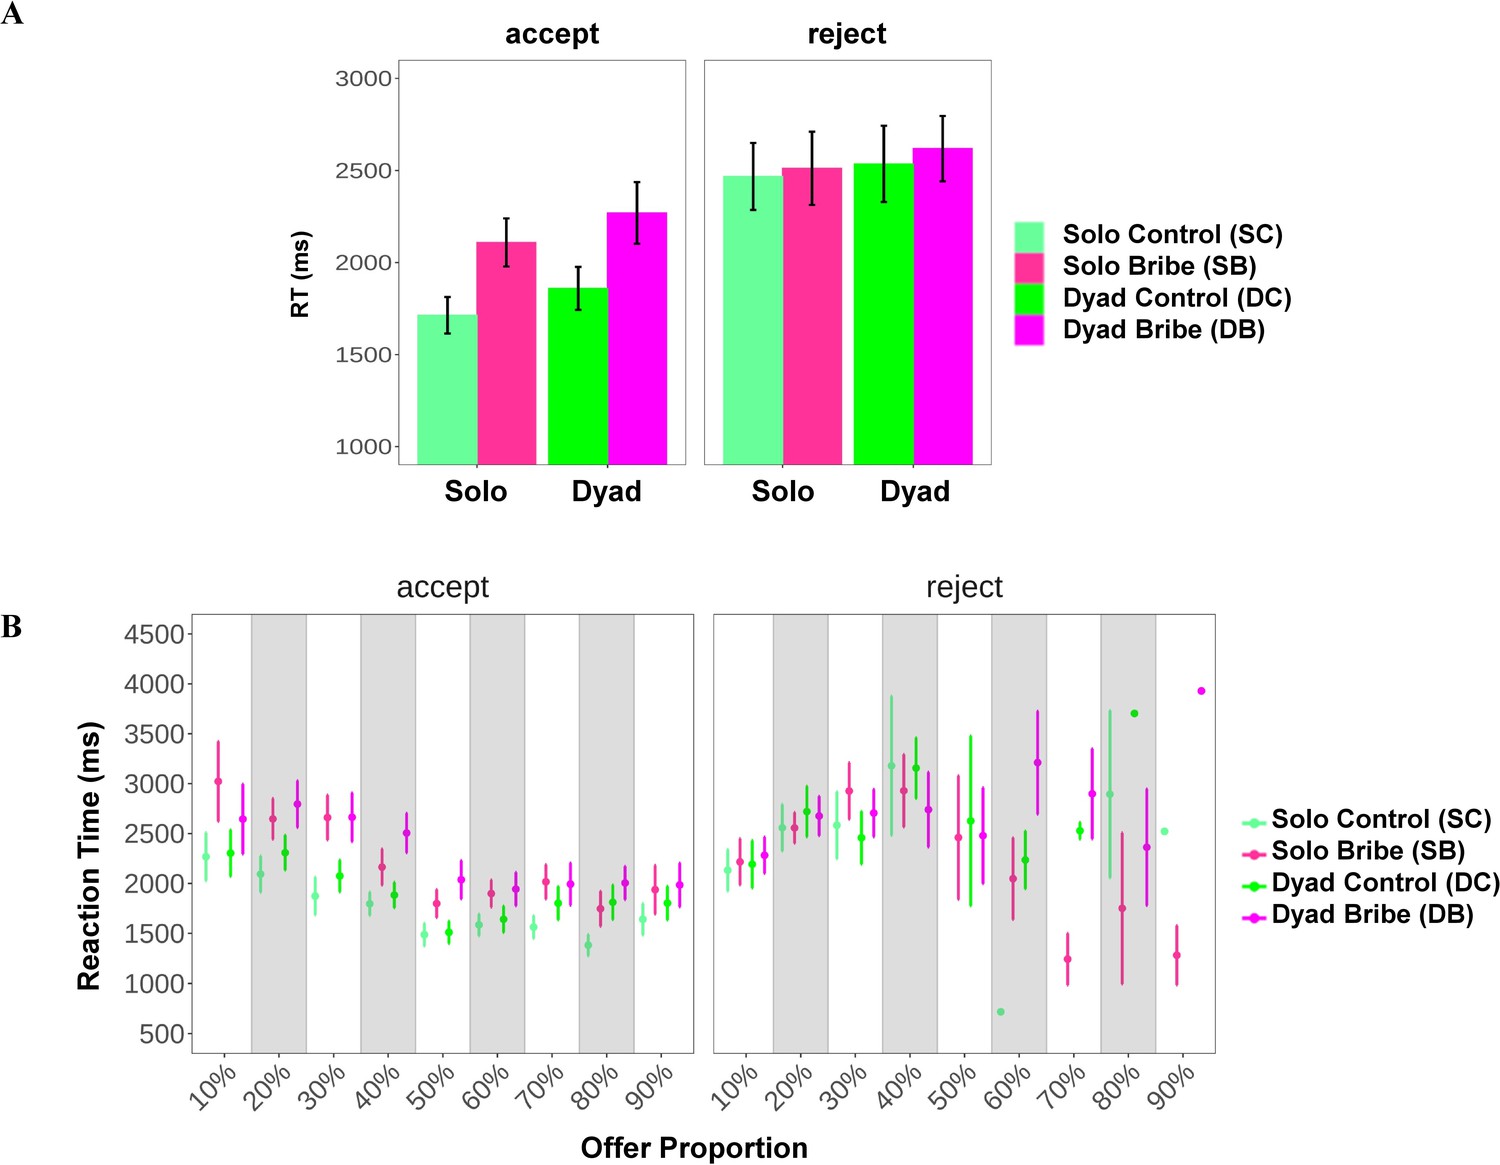
Results of reaction time (in ms).
(A) Reaction time (ms; the right panel) as a function of the scenario (Solo/Dyad), and the proposer’s conduct (Bribe/Control) depending on specific choice (accept or reject). (B) Reaction time as a function of above factors together with offer proportion (%). Error bars represent SEM.
Figure 3 with 3 supplements

Parametric modulation of expected personal gains and potential loss for the third-party during bribery-related decision-making.
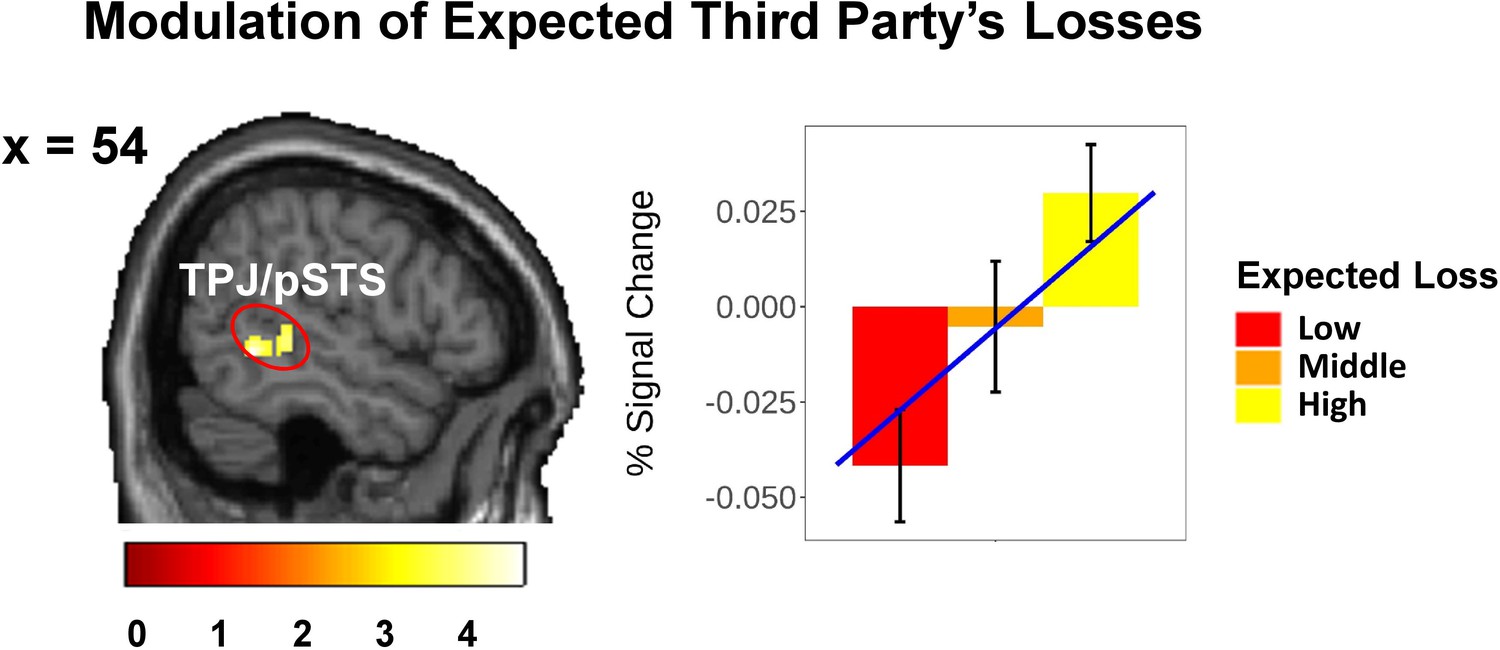
(A) Enhanced ventral part of anterior insula (vAI) signal by the modulation of the expected personal gain during bribery-related decision-making (Bribe vs. Control; GLM1a). The contrast values of the activated cluster were extracted for visualization. (B) The parametric modulation of the expected potential loss for the third party in the temporoparietal junction/posterior superior temporal sulcus (TPJ/pSTS) (GLM1b). Notably, this parametric modulation only exists in the Dyad Bribe condition due to the experimental design. To visualize the effect of parametric modulation, we split these continuous parameters into three bins (low: 0–33%; medium: 33–67%; and high: 67–100%), re-estimated the general linear model and extracted the percent signal change (PSC) in relevant activated clusters via rfxplot (http://rfxplot.sourceforge.net/; Gläscher, 2009). Each line refers to the linear fit between the bin and the PSC. (C) Multivariate patterns of TPJ/pSTS distinguished bribe (vs. Control) only in the Dyad scenario. The regions of interest (ROI) of TPJ/pSTS was defined based on a whole-brain parcellation map from the Neurosynth database (left). The receiver operating characteristic curve showed that the multivoxel TPJ/pSTS activity pattern during decision-making can distinguish the Bribe condition from the Control condition only in the Dyad scenario but not in the Solo scenario (middle). Permutation test (N = 5000) further illustrated that the two-choice forced alternatives decoding accuracy in TPJ/pSTS in the Dyad scenario were unlikely achieved by chance (p=0.020; right). The violin plot (right) describes the null distribution of decoding accuracy of the multivoxel TPJ patterns during decision-making that distinguishes the bribe from the Control condition in the Solo and Dyad scenarios, respectively, obtained via 5000 times of permutation. Significance: *p<0.05. Error bars refer to SEM. Display threshold: voxel-level p (uncorrected) <0.005 (A, B). L: left; R: right.
Figure 3—figure supplement 1
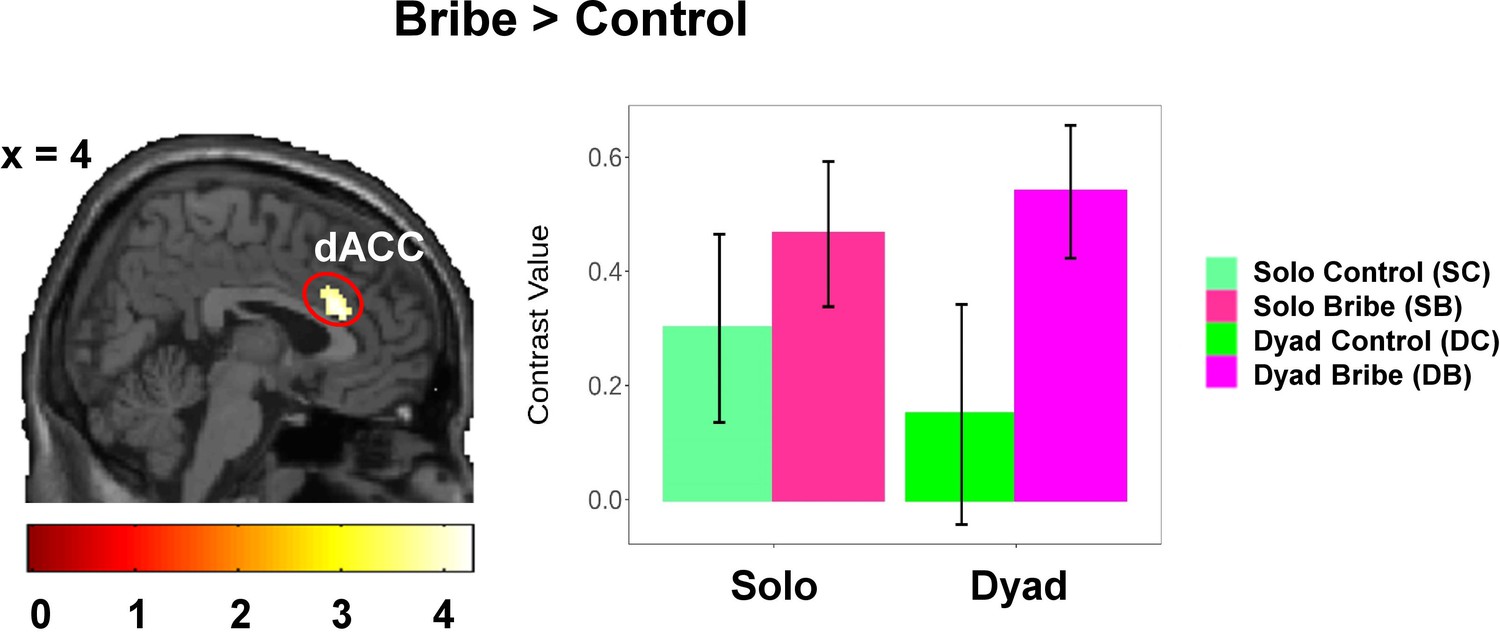
Enhanced dorsal part of anterior cingulate cortex (dACC) activity during bribery-related decision-making (Bribe vs. Control; GLM1c).
The contrast values of the activated cluster were extracted for the visualization; error bars refer to SEM. Display threshold: voxel-level p (corrected) <0.001. L: left; R: right.
Figure 3—figure supplement 2
Parametric modulation of the expected loss to the third party in the temporoparietal junction/posterior superior temporal sulcus (TPJ/pSTS) after controlling for the effect of expected gains either for the proposer or the participant (GLM1b-s).
Notably, this parametric modulation only exists in the Dyad Bribe condition due to the experimental design. Display threshold: voxel-level p (corrected) <0.005. To visualize the effect of parametric modulation, we split these continuous parameters into three bins (low: 0–33%; medium: 33–67%; and high: 67–100%), re-estimated the general linear model and extract the percent signal change (PSC) in relevant activated clusters via rfxplot (http://rfxplot.sourceforge.net/; Gläscher, 2009). Each line refers to the linear fit between the bin and the PSC. Error bars refer to SEM.
Figure 3—figure supplement 3
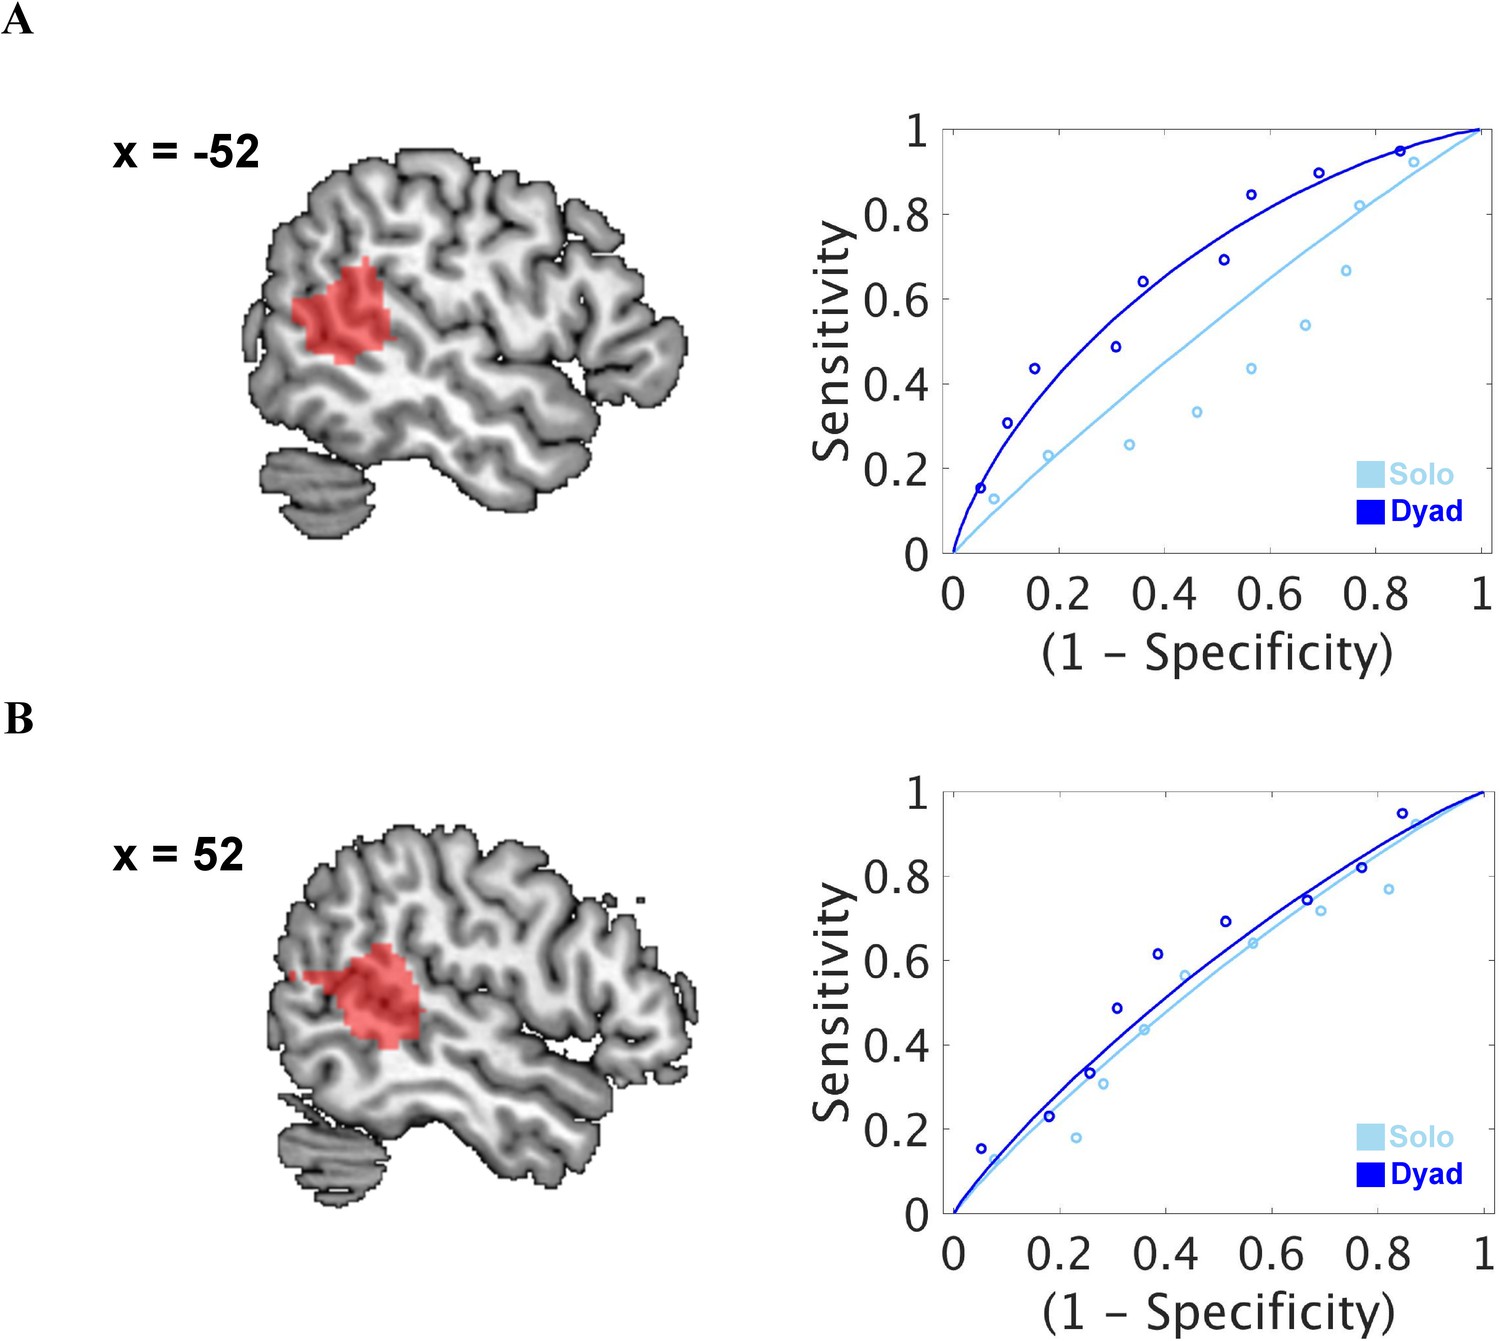
Results of decoding analyses using decision-related multivoxel neural patterns of (A) the left and (B) the right temporoparietal junction/posterior superior temporal sulcus (TPJ/pSTS).
The regions of interest of TPJ was defined based on a whole-brain parcellation map from the Neurosynth database. The receiver operating characteristic curve showed a trend that the decision-related multivoxel neural patterns of either side of the TPJ can slightly better distinguish the Bribe condition (two-choice forced-alternatives decoding accuracy ± SE of Dyad Bribe (DB) vs. Dyad Control (DC): left TPJ/pSTS: 64.1 ± 10.3%; right TPJ: 61.5 ± 9.9%) from the Control condition in the Dyad scenario than the Solo scenario (Solo Bribe [SB] vs. Solo Control [SC]: left TPJ/pSTS: 38.5 ± 6.2%; right TPJ/pSTS: 59.0 ± 9.4%). However, none of these decoding tests reached statistical significance (DB vs. DC: left TPJ/pSTS: p=0.108; right TPJ/pSTS: p=0.200; SB vs. SC: left TPJ/pSTS: p=0.200; right TPJ/pSTS: p=0.337). .
Figure 4 with 1 supplement
Value computation in the ventromedial prefrontal cortex (vmPFC) during bribery-related decision-making.
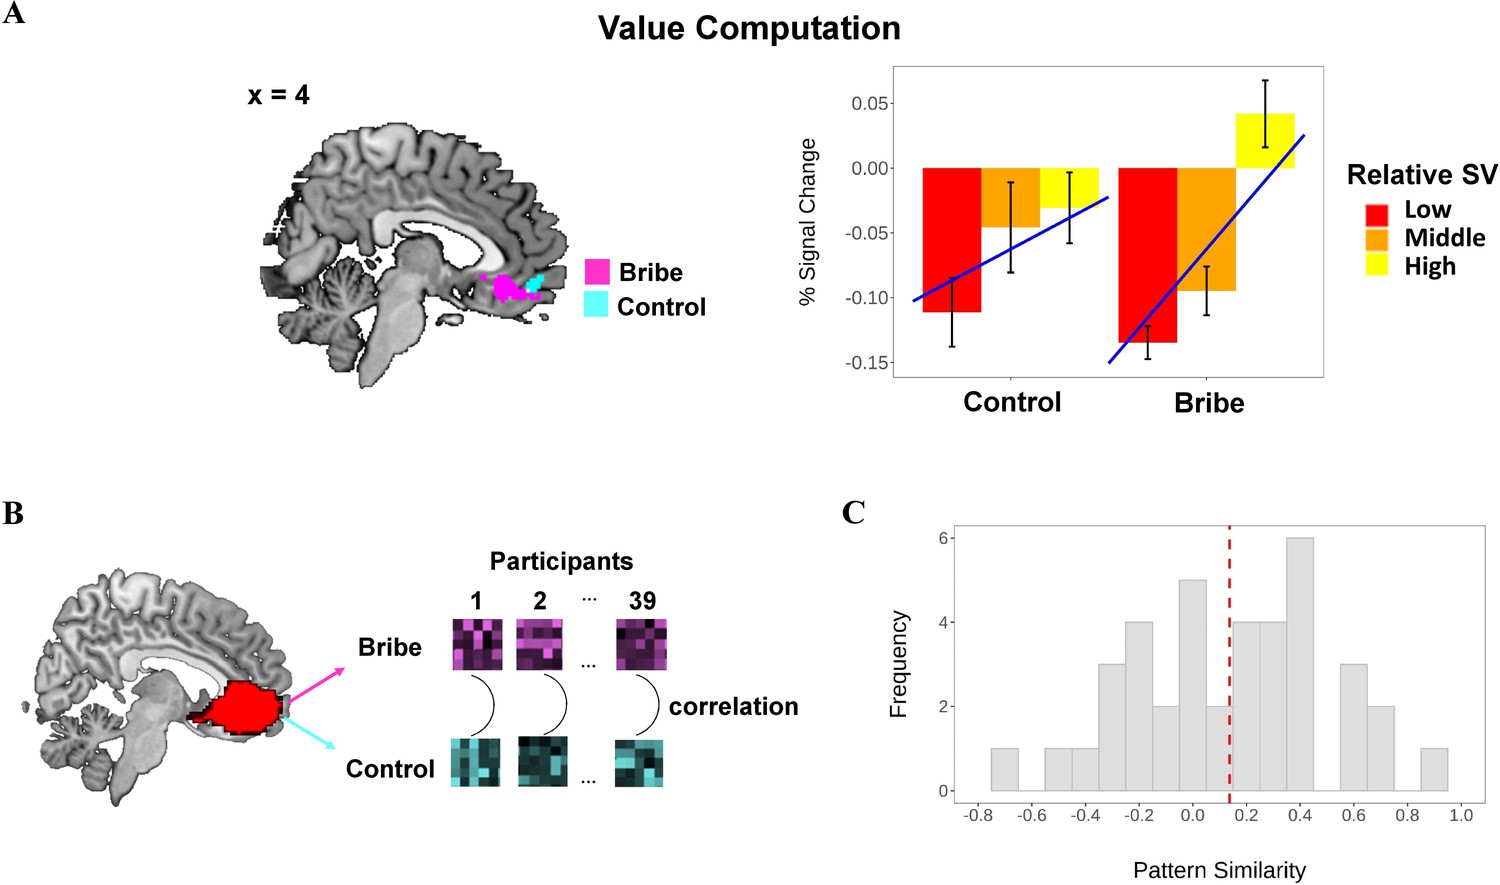
(A) Ventromedial prefrontal cortex (vmPFC) encodes relative subjective value (SV) in the Bribe and the Control conditions, respectively. Relative SV was defined as the SV difference between the chosen and the non-chosen option. To visualize the effect of parametric modulation, we split the relative SV into three bins, that is, low (0–33%), medium (33–67%), and high (67–100%), re-estimated the general linear model and extracted the percent signal change (PSC) in the activated cluster via rfxplot (http://rfxplot.sourceforge.net/). The line refers to the linear fit between the bin and the PSC. (B) Procedure of pattern similarity analyses. For each participant, we extracted the multivoxel neural patterns (i.e., those heat maps; only for illustration) within the vmPFC mask from the parametric contrast of relative SV in Bribe and Control conditions, respectively (pooling the Solo and Dyad scenarios). Next, we computed the similarity (correlation) between these neural patterns in the two conditions. For statistical analysis, all correlation coefficients were transformed to Fisher’s z value. (C) Histogram of the distribution of pattern similarity across all participants. The vertical dashed line refers to the mean of the pattern similarity.
Figure 4—figure supplement 1
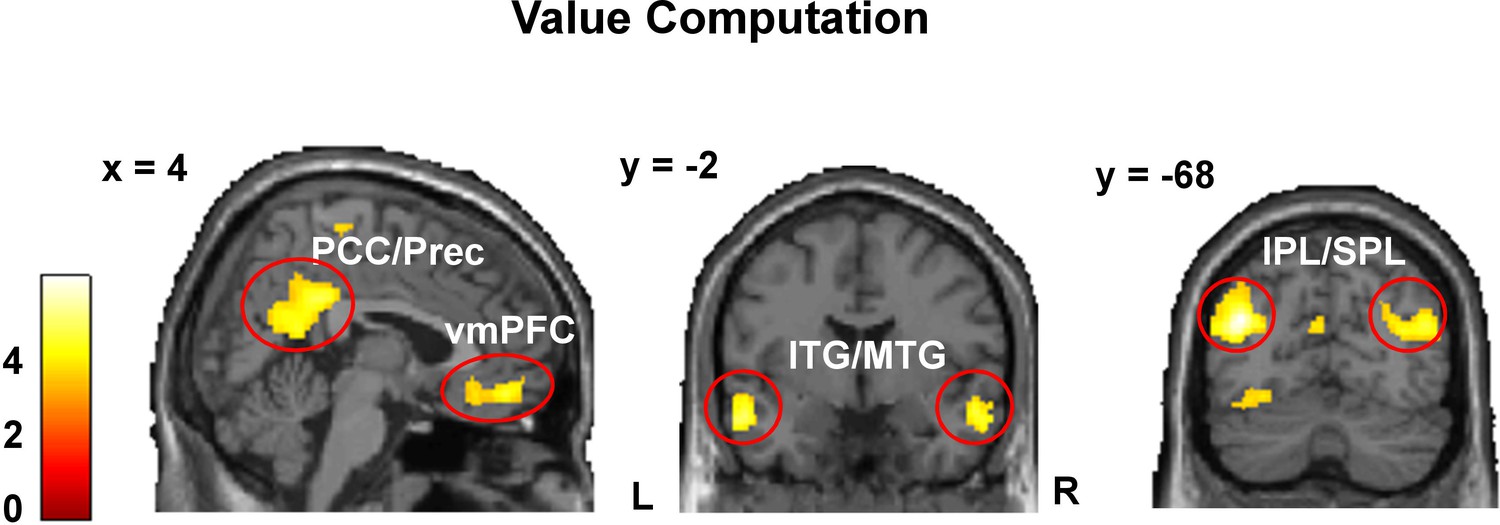
Brain regions positively correlate relative subjective value (SV) during decision period regardless of experimental conditions (GLM2b).
Relative SV was defined as the SV difference between the chosen and the non-chosen option. Display threshold: voxel-level p (corrected) <0.001. L: left; R: right; DB: Dyad Bribe; dACC: dorsal anterior cingulate cortex; IPL/SPL: inferior/superior parietal lobule; ITG/MTG: inferior/middle temporal gyrus; PCC/Prec: posterior cingulate cortex/precuneus; vmPFC: ventromedial prefrontal cortex.
Figure 5 with 1 supplement

Context-dependent anti-corruption signal and the functional connectivity results.
(A) Anti-corruption signal in dorsolateral prefrontal cortex (dlPFC) was specifically enhanced in the Dyad scenario. We defined the anti-corruption signal as the activities (i.e., contrast value) of rejection (vs. acceptance) choice that were specific to the Bribe (vs. Control) condition. Post-hoc analyses on anti-corruption signals within the activated clusters of bilateral dlPFC showed that the interaction was mainly driven by increased anti-corruption signals in the Dyad scenario. Display threshold: voxel-level p (uncorrected) <0.001. Error bars represent the SEM; significance: ***p<0.001. (B) Individual differences in θ negatively modulate the functional connectivity between ventromedial prefrontal cortex (vmPFC) and right dlPFC during bribery-related decision-making (i.e., Bribe vs. Control). The seed region of vmPFC was defined based on a whole-brain parcellation given a meta-analytic functional coactivation map of the Neurosynth database (http://neurovault.org/images/39711/). To visualize the relationship, we extracted the contrast value (cv) of the psycho-physiological interaction regressors of the Bribe and Control conditions within the activated cluster and plotted the correlation between the cv and the individual parameter. Each gray dot represents the data of a single participant; the blue line represents the linear fit using robust correlation (r = −0.54, 95% CI: −0.88,–0.19, p=0.003); the gray density curve indicates the distribution of each variable, respectively.
Figure 5—figure supplement 1
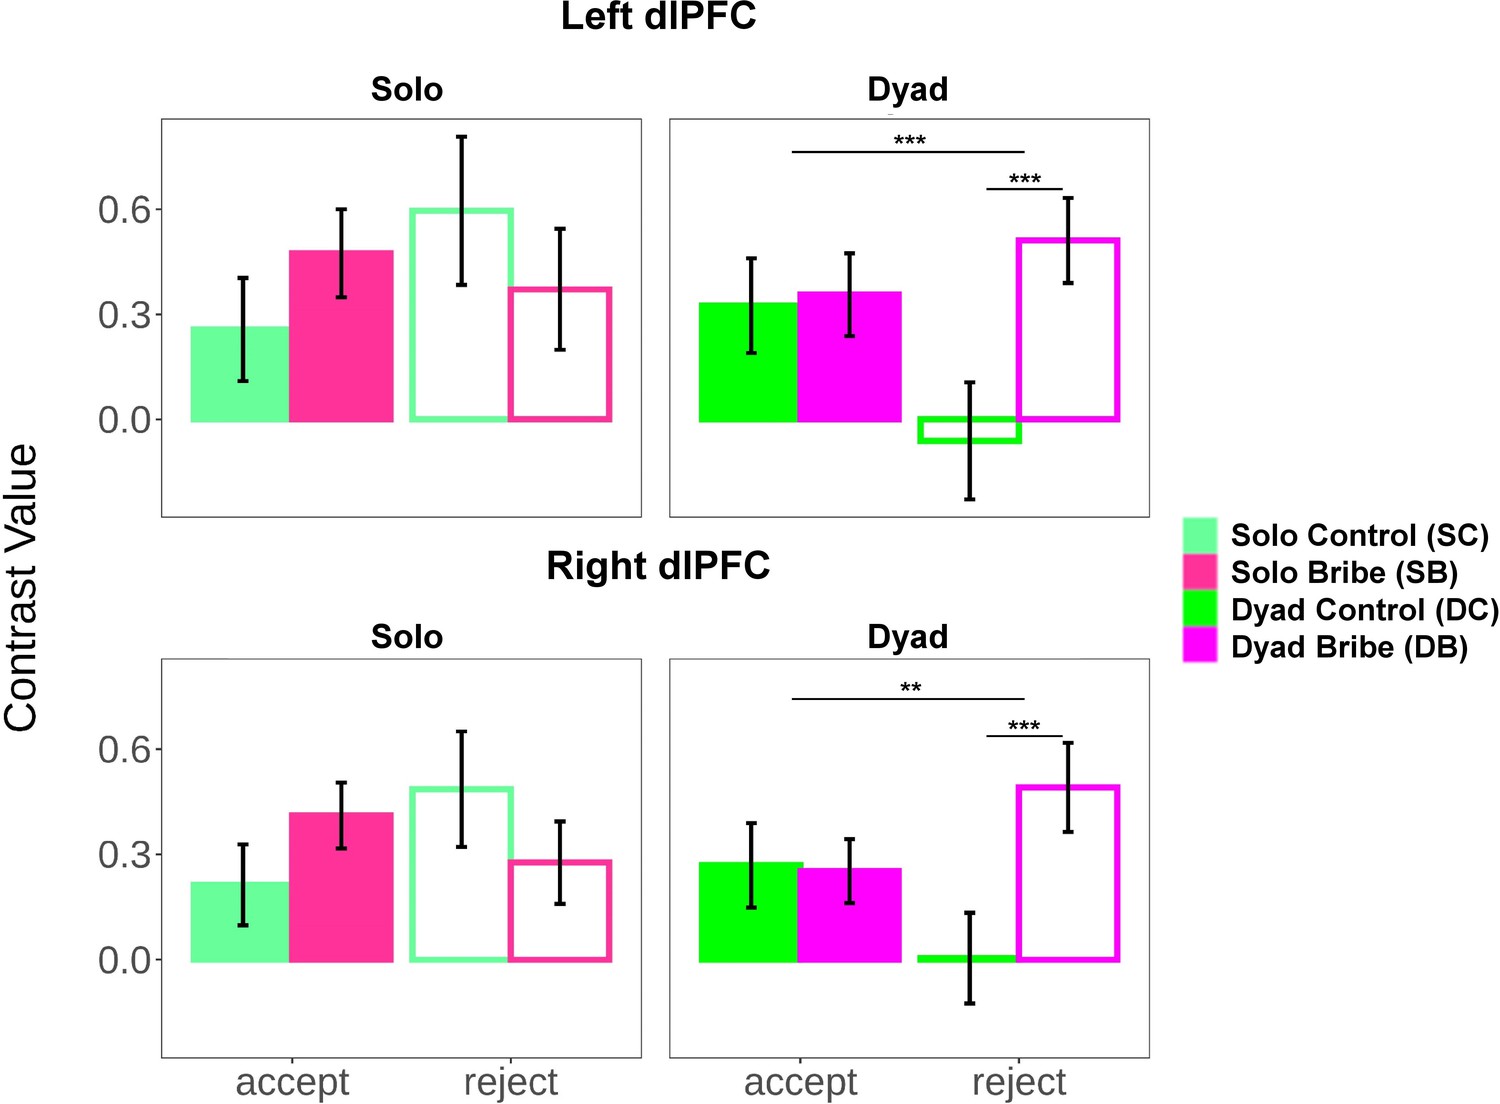
Modulation of scenario on the dorsolateral prefrontal cortex (dlPFC) activity during bribery-related decision-making regarding specific choice.
For each participant, we extracted the contrast value within the activated clusters of dlPFC (see Figure 5A) in four experimental conditions in terms of two choices. Two-way repeated analysis of variance revealed a significant interaction between Choice (accept/reject) and Proposer’s Conduct (Bribe/Control) on dlPFC signal (i.e., contrast value) only in the Dyad scenario (left dlPFC: F(1, 32)=16.03, p<0.001; right dlPFC: F(1, 32)=12.95, p=0.001) but not in the Solo scenario (left dlPFC: F(1, 32)=2.92, p=0.097; right dlPFC: F(1, 32)=3.94, p=0.056). Post-hoc analyses showed that dlPFC activity was selectively enhanced when participants rejected an offer in the Bribe condition (Bribe vs. Control: left dlPFC: t(32) = 4.09, p<0.001; right dlPFC: t(32) = −3.64, p<0.001), but not when accepting an offer (left dlPFC: t(32) = 0.30, p=0.769; right dlPFC: t(32) = −0.22, p=0.826), which drove the interaction. Error bars represent SEM. Significance: **p < 0.01, ***p < 0.001.
Figure 6
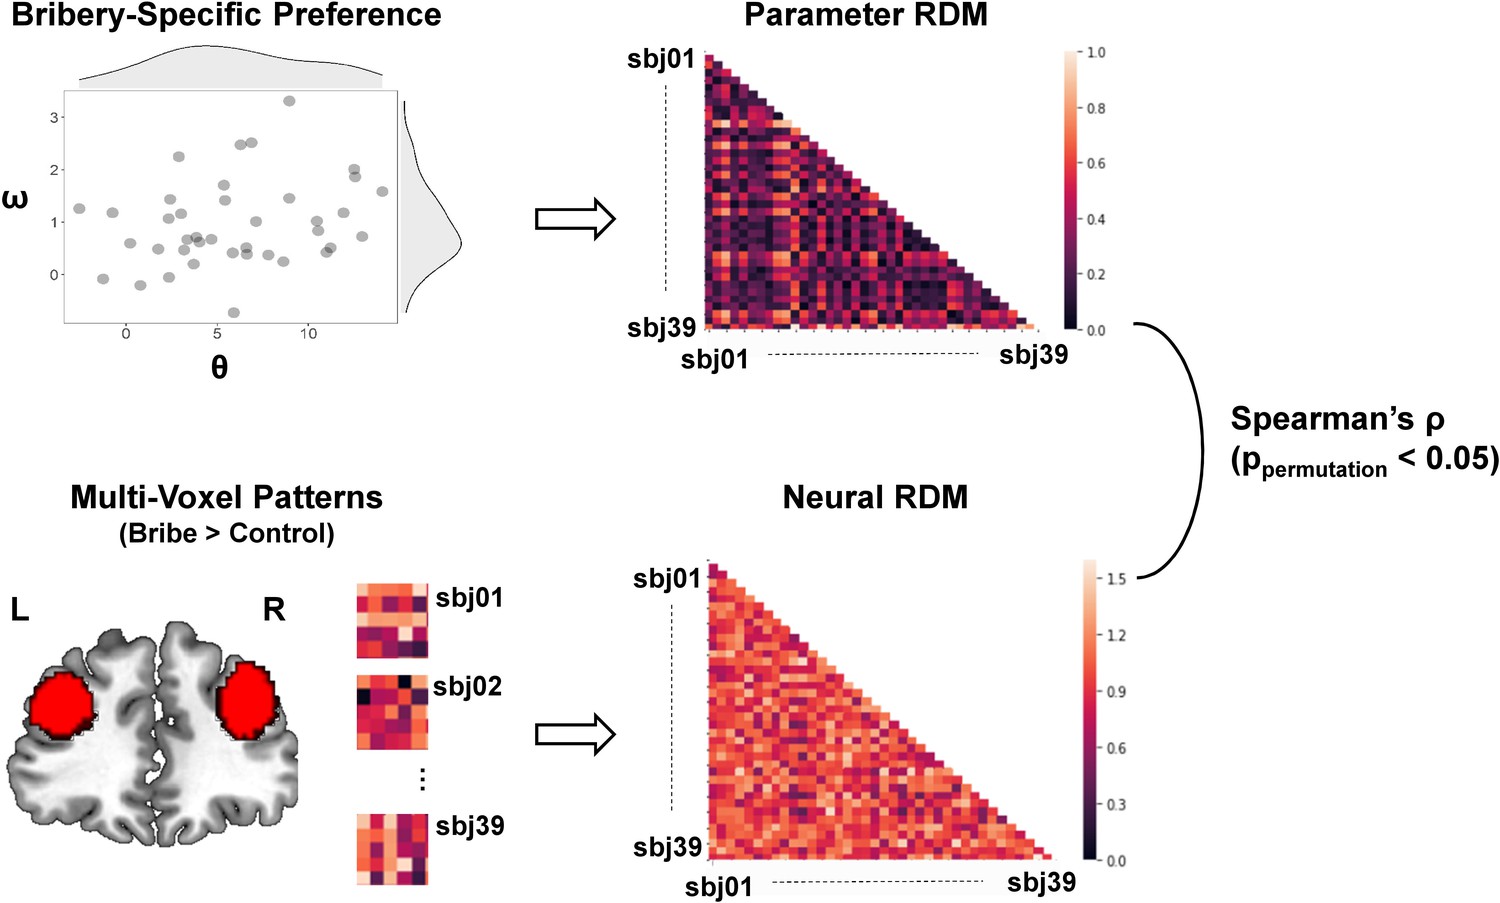
Illustration of the inter-subject representational similarity analysis.
We created a parameter representational dissimilarity matrix (RDM), which measures the dissimilarity across participants in the bribery-specific preference that is calculated by the Euclidean distance between each pair of participants in θ and ω driven from the winning model. Both parameters together characterize the individual differences in bribery-specific preference (see the scatter plot: each dot represents the data of a single participant; the density curve indicates the distribution of each parameter, respectively). We also created a neural RDM, which measures the dissimilarity across participants in the neural activities within bilateral dorsolateral prefrontal cortex (dlPFC) during bribery-related decision-making (i.e., Bribe vs. Control) that is measured by the correlation distance between the multivoxel patterns of each pair of participants (i.e., those heat maps; only for illustration). The region of dlPFC was defined based on a whole-brain parcellation given a meta-analytic functional coactivation map of the Neurosynth database (http://neurovault.org/images/39711/). We then calculated the Spearman rank-order correlation between these two RDMs and implemented a permutation test to confirm the statistical significance.
Tables
Author response table 1
Relationship between decision-related NAcc activity specific to corrupt decision-making with acceptance rate of bribes across individuals.
| Brain Contrast (Y) | Predictor (X) | Results |
|---|---|---|
| SB – SC | Acceptance rate of offers in the SB condition | Positive: No activated voxels Negative: No activated voxels |
| DB – DC | Acceptance rate of offers in the DB condition | Positive: Peak MNI: 12/2/2 t(37) = 3.28, p(SVC-FWE) = 0.157 Negative: No activated voxels |
| bribe – control | Mean acceptance rate of offers across SB and DB conditions | Positive: Peak MNI: 6/10/0, t(37) = 2.72, p(SVC-FWE) = 0.243 Negative: No activated voxels |
Additional files
-
Supplementary file 1
Supplementary tables.
- https://cdn.elifesciences.org/articles/63922/elife-63922-supp1-v1.docx
-
Transparent reporting form
- https://cdn.elifesciences.org/articles/63922/elife-63922-transrepform-v1.docx
Download links
A two-part list of links to download the article, or parts of the article, in various formats.
Downloads (link to download the article as PDF)
Open citations (links to open the citations from this article in various online reference manager services)
Cite this article (links to download the citations from this article in formats compatible with various reference manager tools)
Neural basis of corruption in power-holders
eLife 10:e63922.
https://doi.org/10.7554/eLife.63922


