TRex, a fast multi-animal tracking system with markerless identification, and 2D estimation of posture and visual fields
- Max Planck Institute of Animal Behavior, Germany
- Centre for the Advanced Study of Collective Behaviour, University of Konstanz, Germany
- Department of Biology, University of Konstanz, Germany
Figures
Figure 1
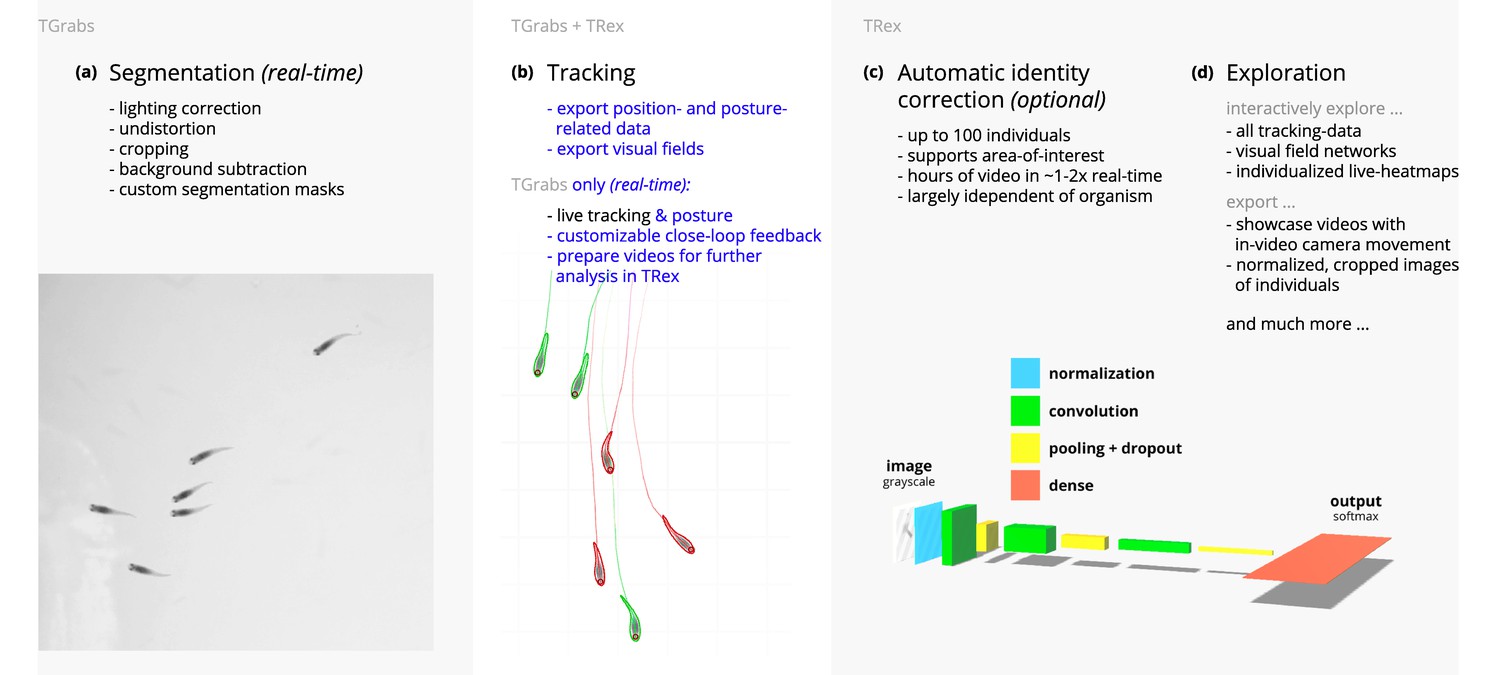
Videos are typically processed in four main stages, illustrated here each with a list of prominent features.
Some of them are accessible from both TRex and TGrabs, while others are software specific (as shown at the very top). (a) The video is either recorded directly with our software (TGrabs), or converted from a pre-recorded video file. Live-tracking enables users to perform closed-loop experiments, for which a virtual testing environment is provided. (b) Videos can be tracked and parameters adjusted with visual feedback. Various exploration and data presentation features are provided and customized data streams can be exported for use in external software. (c) After successful tracking, automatic visual identification can, optionally, be used to refine results. An artificial neural network is trained to recognize individuals, helping to automatically correct potential tracking mistakes. In the last stage, many graphical tools are available to users of TRex, a selection of which is listed in (d).
Figure 2 with 1 supplement
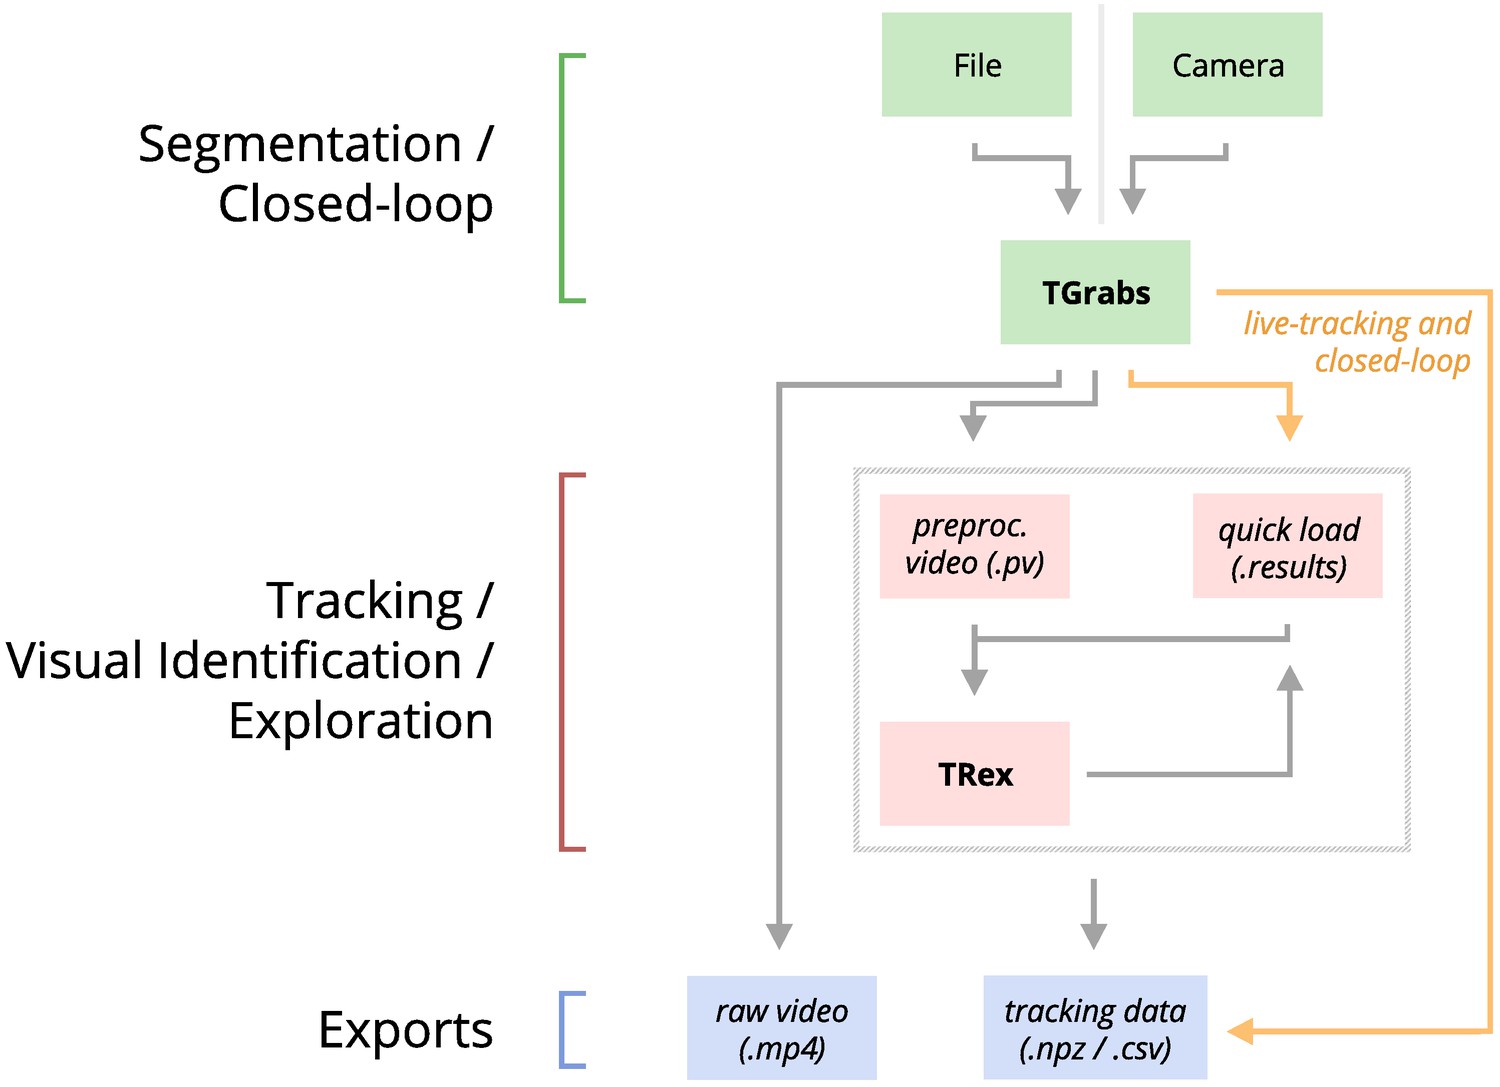
An overview of the interconnection between TRex, TGrabs and their data in- and output formats, with titles on the left corresponding to the stages in 1.
Starting at the top of the figure, video is either streamed to TGrabs from a file or directly from a compatible camera. At this stage, preprocessed data are saved to a .pv file which can be read by TRex later on. Thanks to its integration with parts of the TRex code, TGrabs can also perform online tracking for limited numbers of individuals, and save results to a .results file (that can be opened by TRex) along with individual tracking data saved to numpy data-containers (.npz) or standard CSV files, which can be used for analysis in third-party applications. If required, videos recorded directly using TGrabs can also be streamed to a .mp4 video file which can be viewed in commonly available video players like VLC.
Figure 2—video 1
This video shows an overview of the typical chronology of operations when using our software.
Starting with the raw video, segmentation using TGrabs (Figure 2a) is the first and only step that is not optional. Tracking (Figure 2b) and posture estimation (both also available for live-tracking in TGrabs) are usually performed in that order, but can be partly parallelized (e.g. performing posture estimation in parallel for all individuals). Visual identification (Figure 1c) is only available in TRex due to relatively long processing times. All clips from this composite video have been recorded directly in TRex. https://youtu.be/g9EOi7FZHM0.
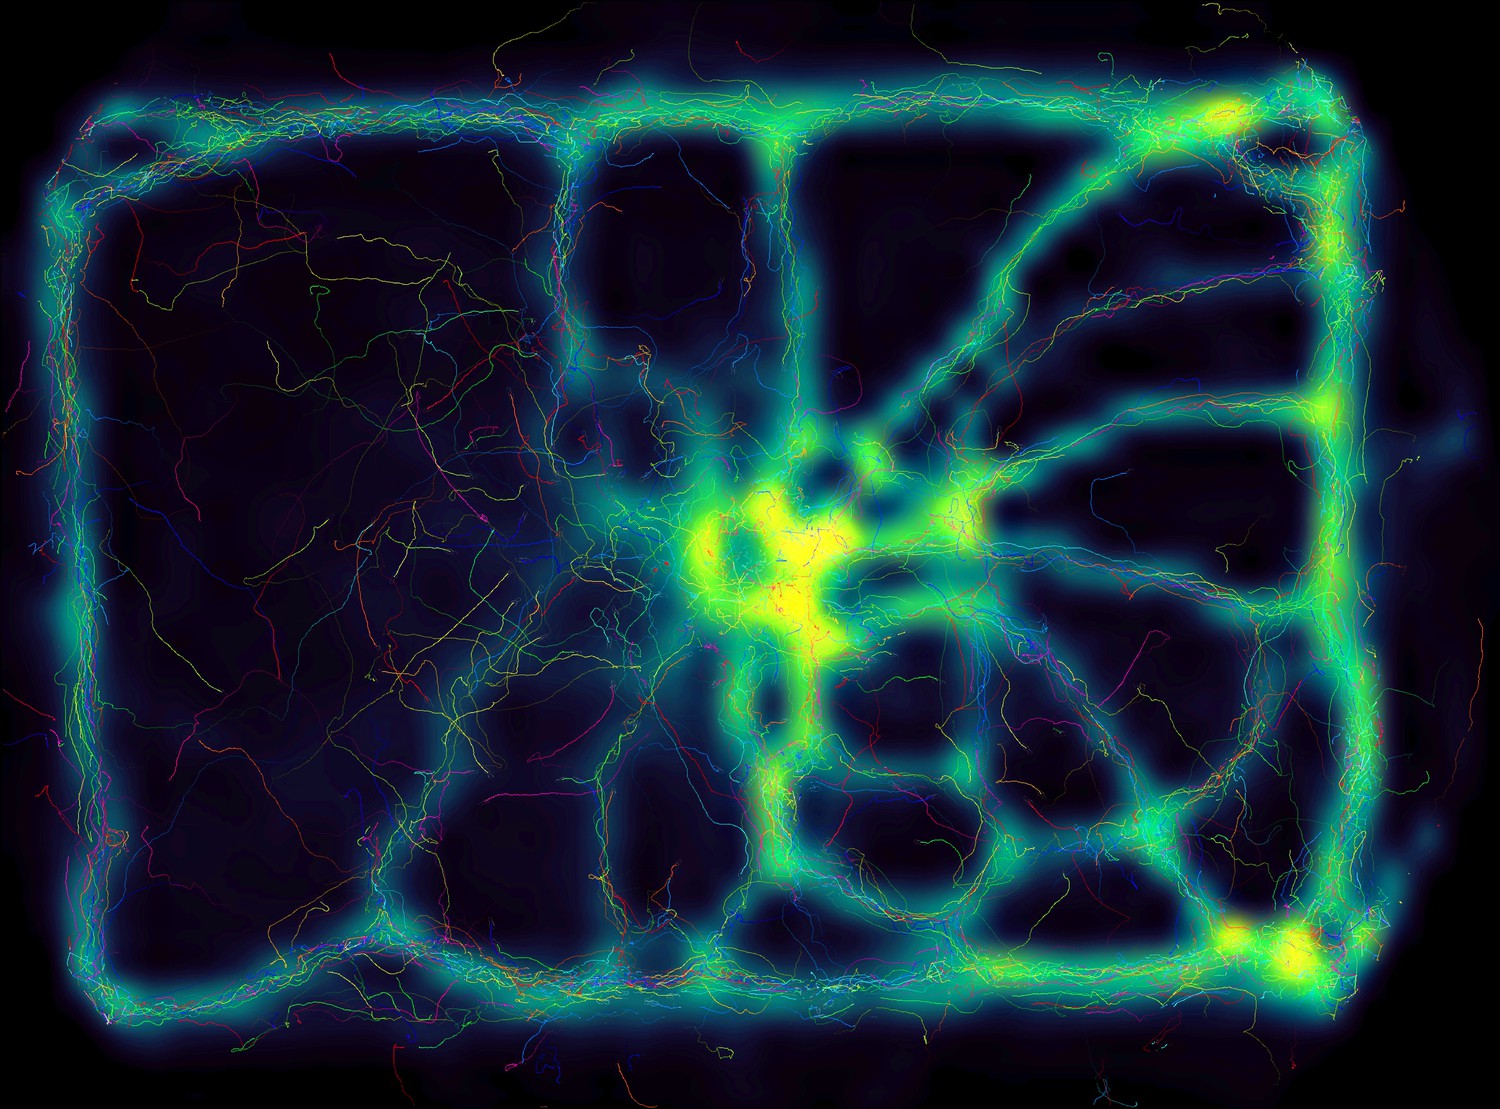
Figure 3
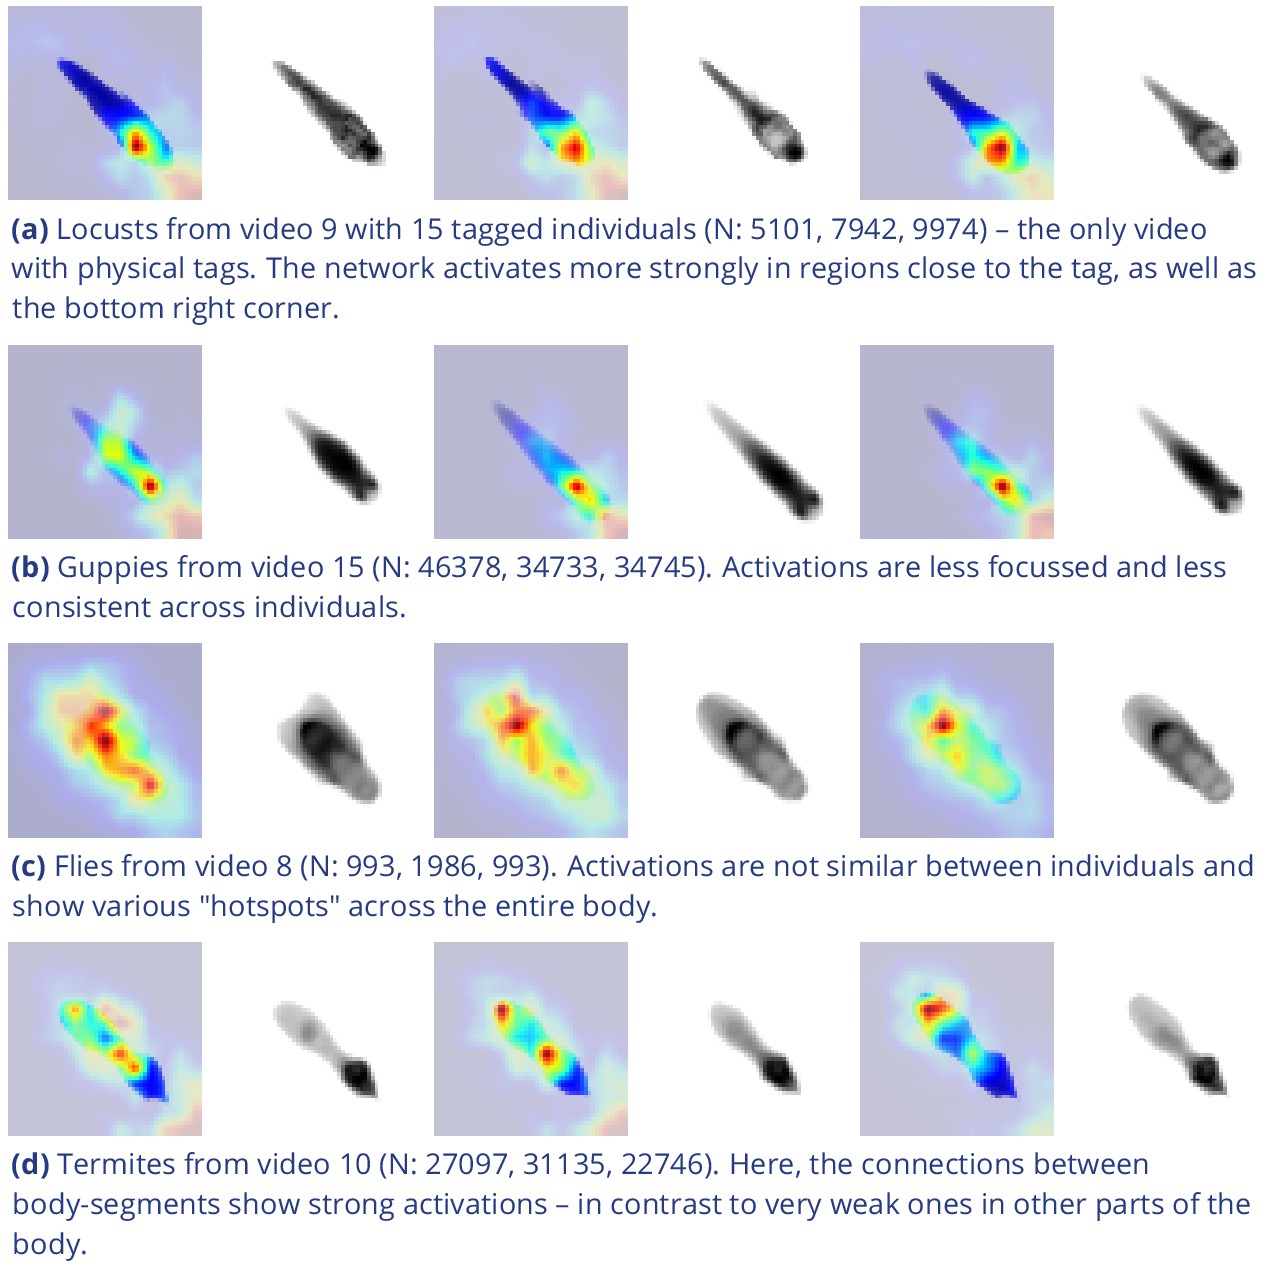
Activation differences for images of randomly selected individuals from four videos, next to a median image of the respective individual – which hides thin extremities, such as legs in (a) and (c).
The captions in (a-d) detail the species per group and number of samples per individual. Colors represent the relative activation differences, with hotter colors suggesting bigger magnitudes, which are computed by performing a forward-pass through the network up to the last convolutional layer (using keract). The outputs for each identity are averaged and stretched back to the original image size by cropping and scaling according to the network architecture. Differences shown here are calculated per cluster of pixels corresponding to each filter, comparing average activations for images from the individual’s class to activations for images from other classes.
-
Figure 3—source data 1
Code, as well as images/weights needed to produce this figure (see README).
- https://cdn.elifesciences.org/articles/64000/elife-64000-fig3-data1-v2.zip
Figure 4
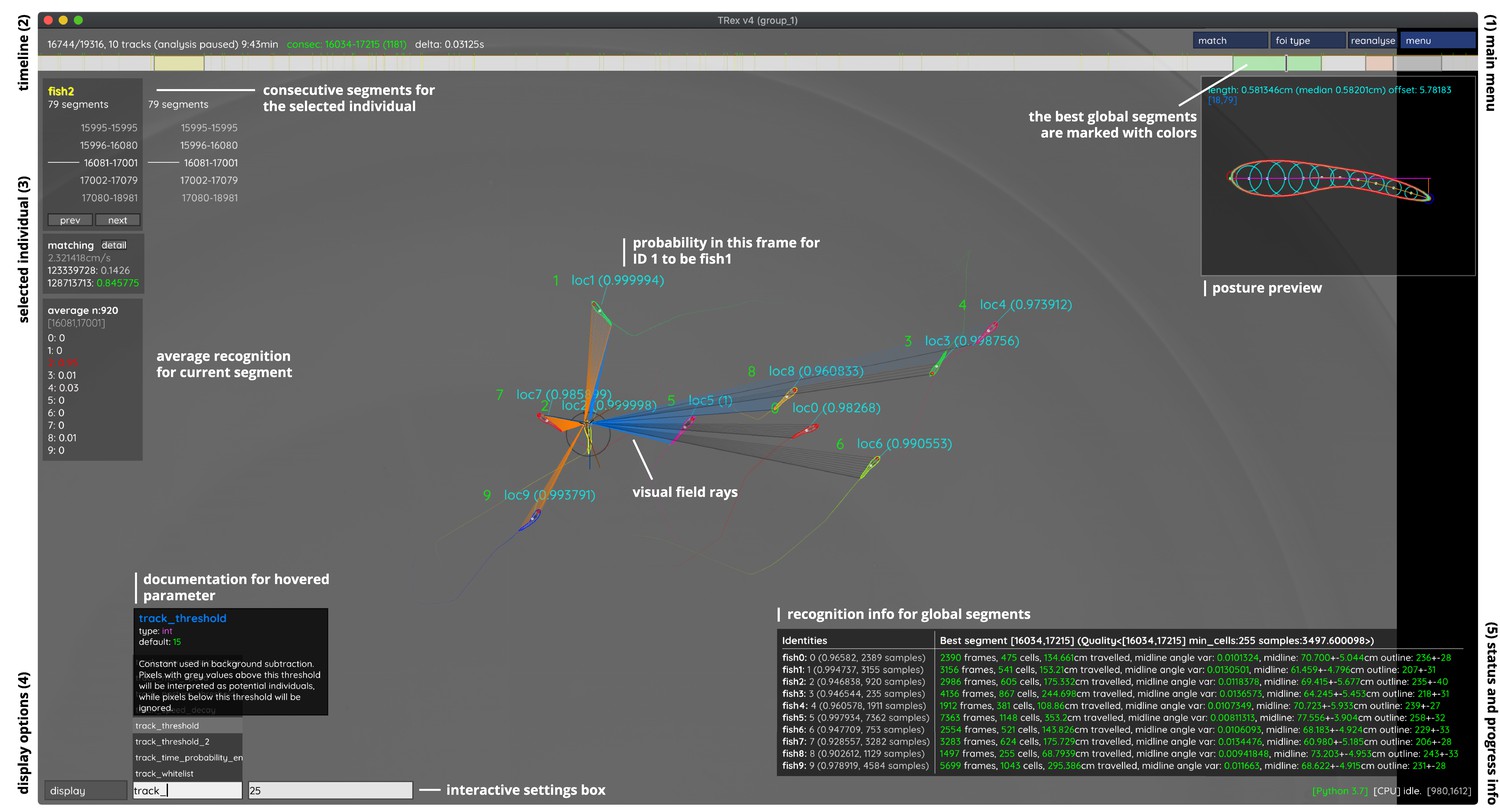
An overview of TRex’ the main interface, which is part of the documentation at trex.run/docs.
Interface elements are sorted into categories in the four corners of the screen (labelled here in black). The omni-box on the bottom left corner allows users to change parameters on-the-fly, helped by a live auto-completion and documentation for all settings. Only some of the many available features are displayed here. Generally, interface elements can be toggled on or off using the bottom-left display options or moved out of the way with the cursor. Users can customize the tinting of objects (e.g. sourcing it from their speed) to generate interesting effect and can be recorded for use in presentations. Additionally, all exportable metrics (such as border-distance, size, x/y, etc.) can also be shown as an animated graph for a number of selected objects. Keyboard shortcuts are available for select features such as loading, saving, and terminating the program. Remote access is supported and offers the same graphical user interface, for example in case the software is executed without an application window (for batch processing purposes).
Figure 5
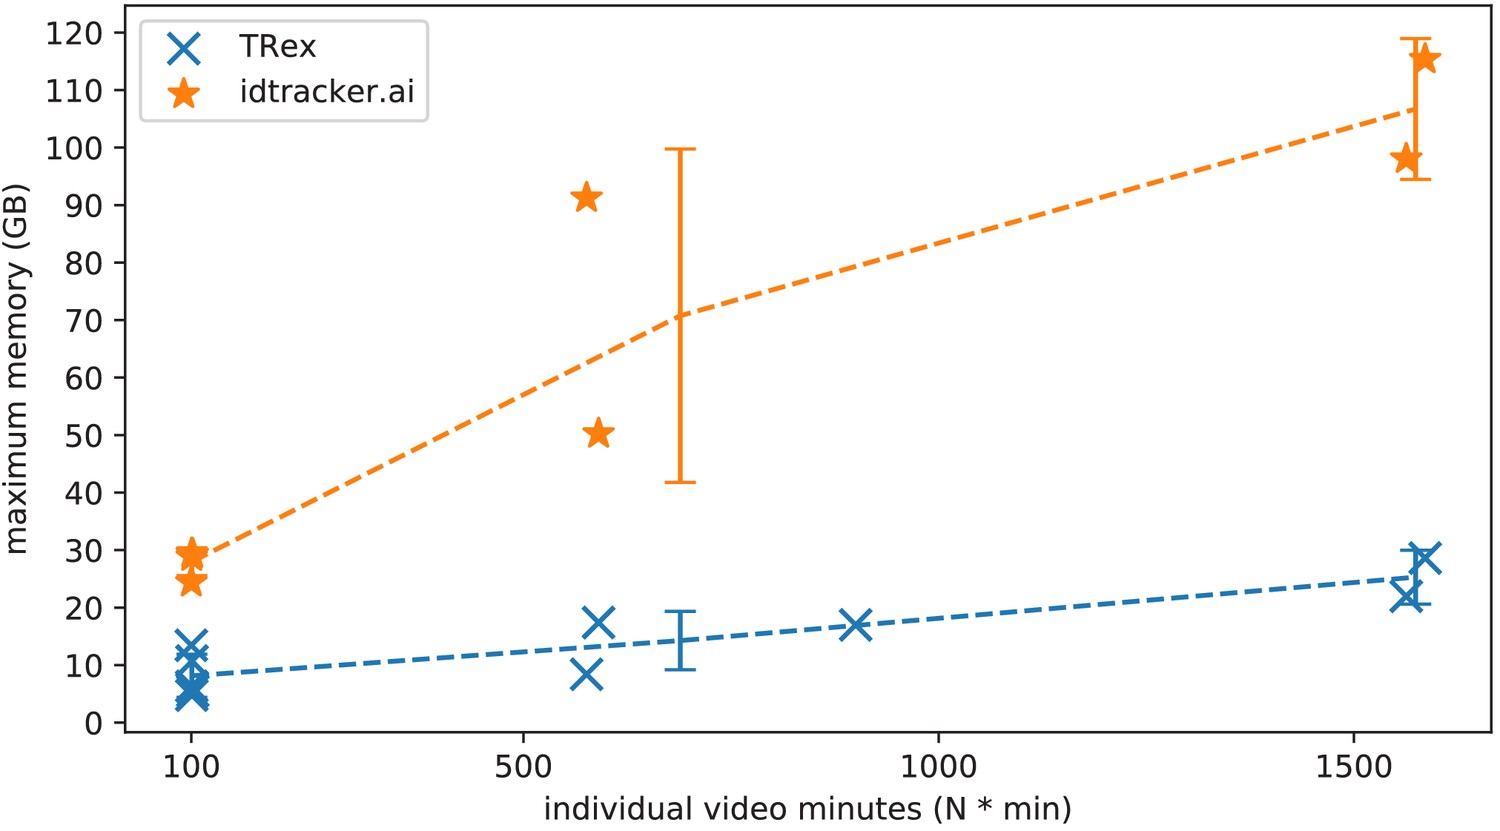
The maximum memory by TRex and idtracker.ai when tracking videos from a subset of all videos (the same videos as in Table 3).
Results are plotted as a function of video length (min) multiplied by the number of individuals. We have to emphasize here that, for the videos in the upper length regions of multiple hours (2, 2), we had to set idtracker.ai to store segmentation information on disk – as opposed to in RAM. This uses less memory, but is also slower. For the video with flies we tried out both and also settled for on-disk, since otherwise the system ran out of memory. Even then, the curve still accelerates much faster for idtracker.ai, ultimately leading to problems with most computer systems. To minimize the impact that hardware compatibility has on research, we implemented switches limiting memory usage while always trying to maximize performance given the available data. TRex can be used on modern laptops and normal consumer hardware at slightly lower speeds, but without any fatal issues.
-
Figure 5—source data 1
Each data-point from Figure 5 as plotted, indexed by video and software used.
- https://cdn.elifesciences.org/articles/64000/elife-64000-fig5-data1-v2.csv
Figure 6
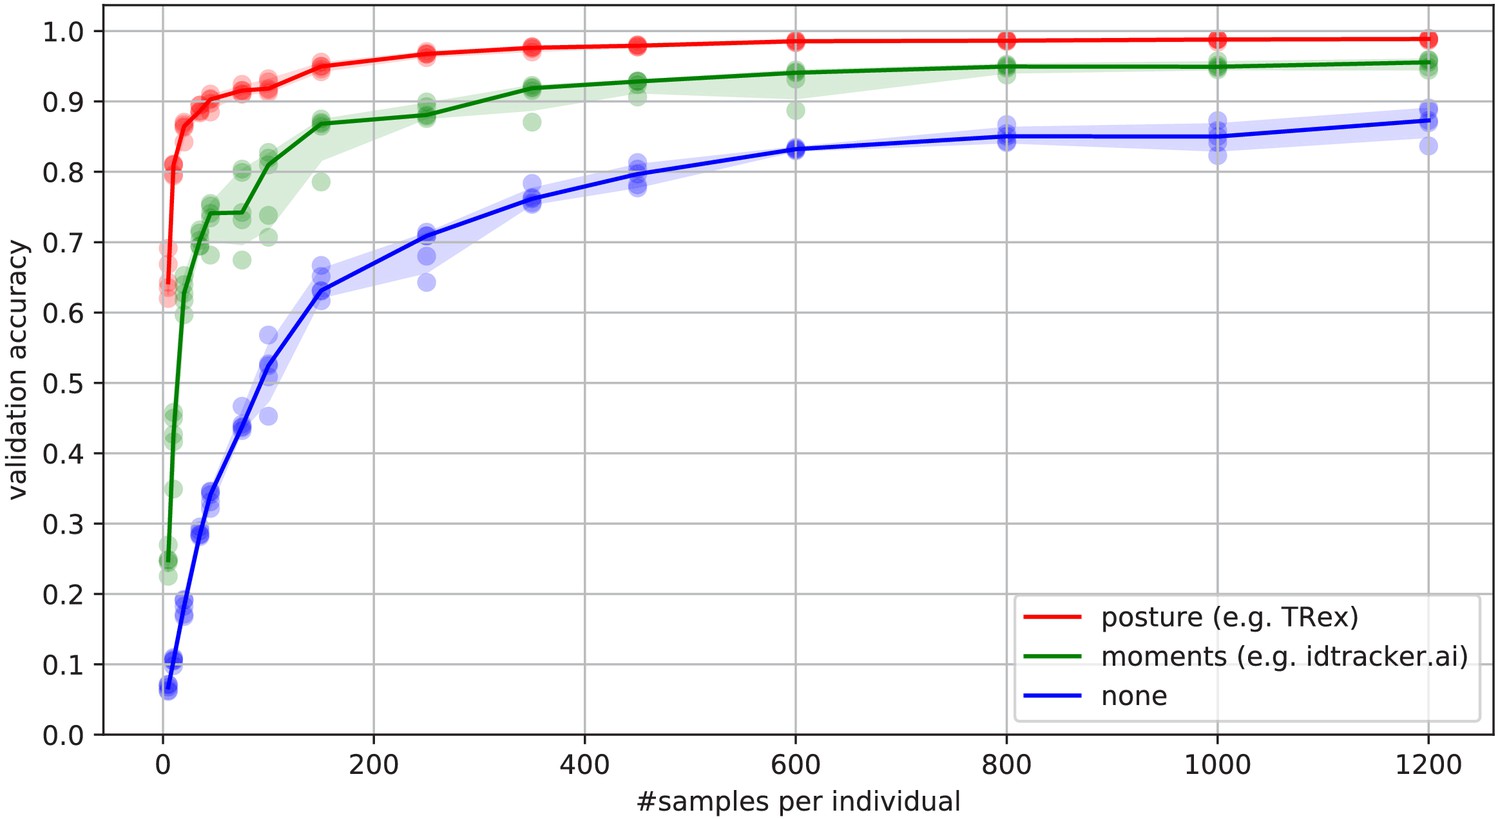
Convergence behavior of the network training for three different normalization methods.
This shows the maximum achievable validation accuracy after 100 epochs for 100 individuals (Video 7), when sub-sampling the number of examples per individual. Tests were performed using a manually corrected training dataset to generate the images in three different ways, using the same, independent script (see Figure 8): Using no normalization (blue), using normalization based on image moments (green, similar to idtracker.ai), and using posture information (red, as in TRex). Higher numbers of samples per individual result in higher maximum accuracy overall, but – unlike the other methods – posture-normalized runs already reach an accuracy above the 90 % mark for ≥75 samples. This property can help significantly in situations with more crossings, when longer global segments are harder to find.
-
Figure 6—source data 1
Raw data-points as plotted in Figure 6.
- https://cdn.elifesciences.org/articles/64000/elife-64000-fig6-data1-v2.zip
Figure 7 with 1 supplement
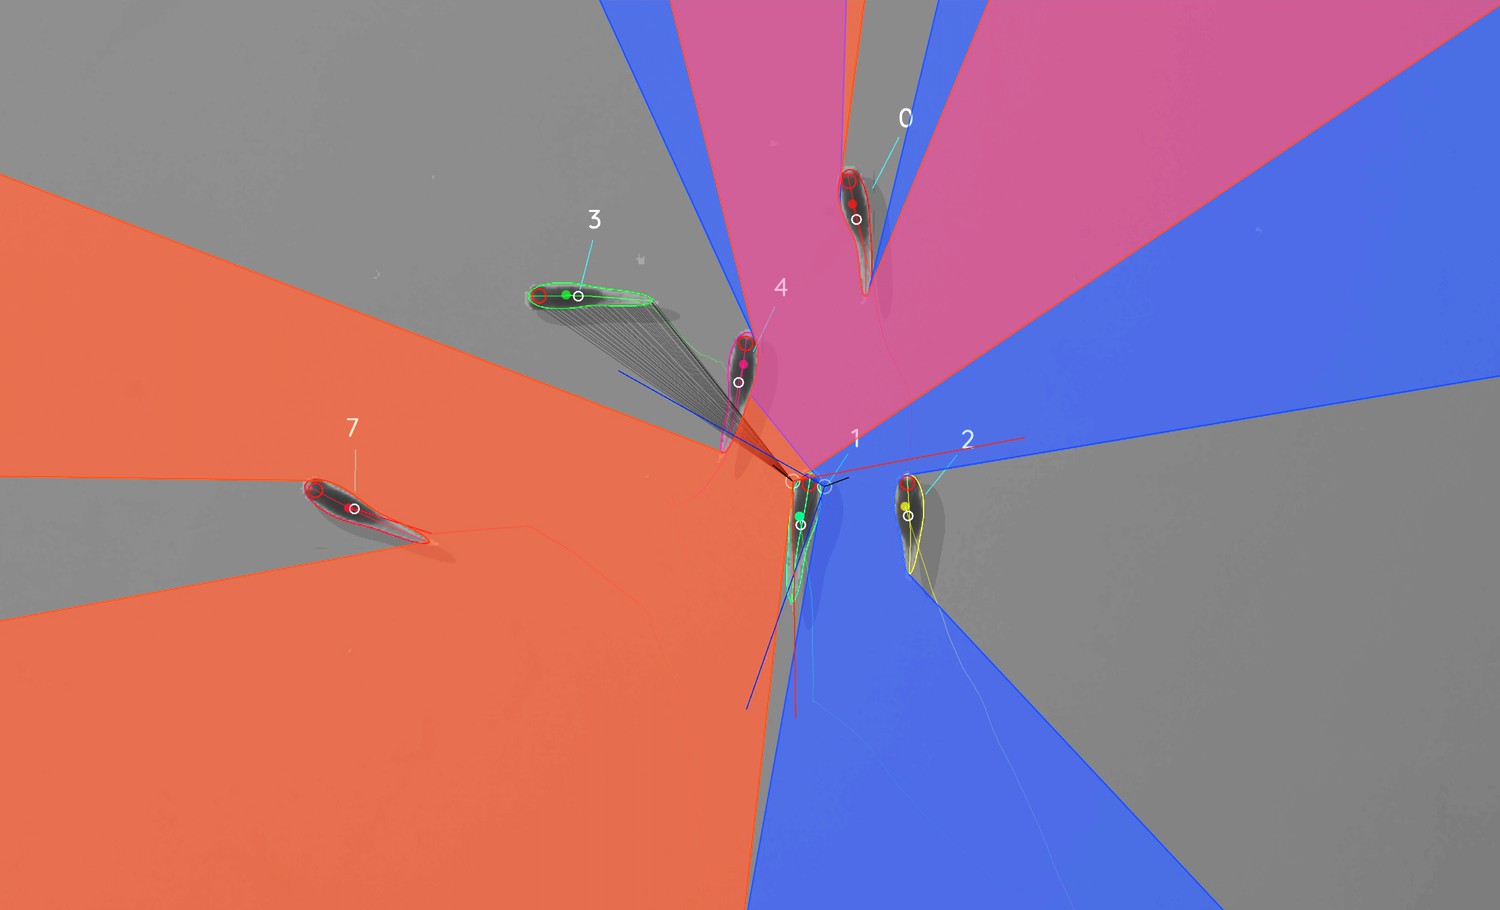
Visual field estimate of the individual in the center (zoomed in, the individuals are approximately 2 – 3 cm long, Video 15).
Right (blue) and left (orange) fields of view intersect in the binocular region (pink). Most individuals can be seen directly by the focal individual (1, green), which has a wide field of view of per eye. Individual three on the top-left is not detected by the focal individual directly and not part of its first-order visual field. However, second-order intersections (visualized by gray lines here) are also saved and accessible through a separate layer in the exported data.
Figure 7—video 1
A clip from Video 15, showing TRex’ visual-field estimation for Individual 1 https://youtu.be/yEO_3lpZIzU.
Figure 8
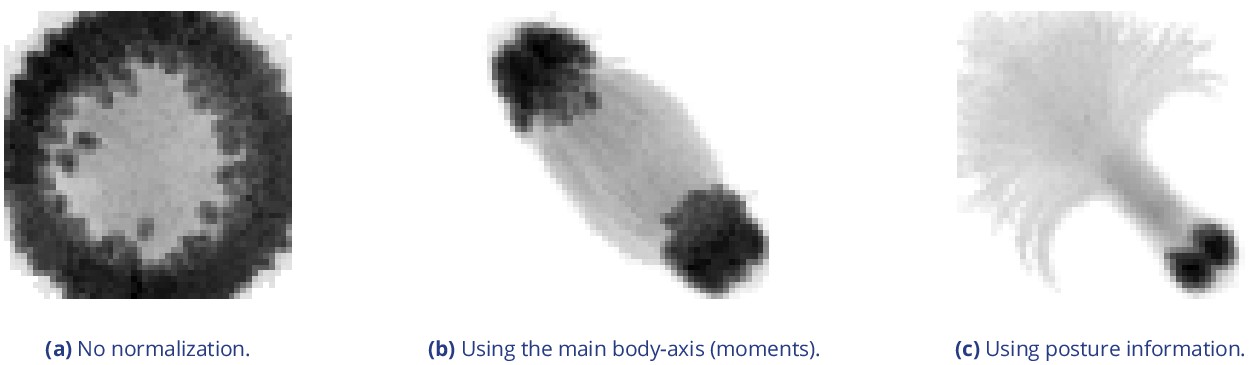
Comparison of different normalization methods.
Images all stem from the same video and belong to the same identity. The video has previously been automatically corrected using the visual identification. Each object visible here consists of N images that have been accumulated into a single image using , with min being the element-wise minimum across images. The columns represent same samples from the same frames, but normalized in three different ways: In (a), images have not been normalized at all. Images in (b) have been normalized by aligning the objects along their main axis (calculated using image-moments), which only gives the axis within 0– 180 degrees. In (c), all images have been aligned using posture information generated during the tracking process. As the images become more and more recognizable to us from left to right, the same applies to a network trying to tell identities apart: Reducing noise in the data speeds up the learning process.
Appendix 1—figure 1
Using the interactive heatmap generator within TRex, the foraging trail formation of Constrictotermes cyphergaster (termites) can be visualized during analysis, as well as other potentially interesting metrics (based on posture- as well basic positional data).
This is generalizable to all output data fields available in TRex, for example also making it possible to visualize ‘time’ as a heatmap and showing where individuals were more likely to be located during the beginning or towards end of the video. Video: H. Hugo.
Appendix 1—figure 2
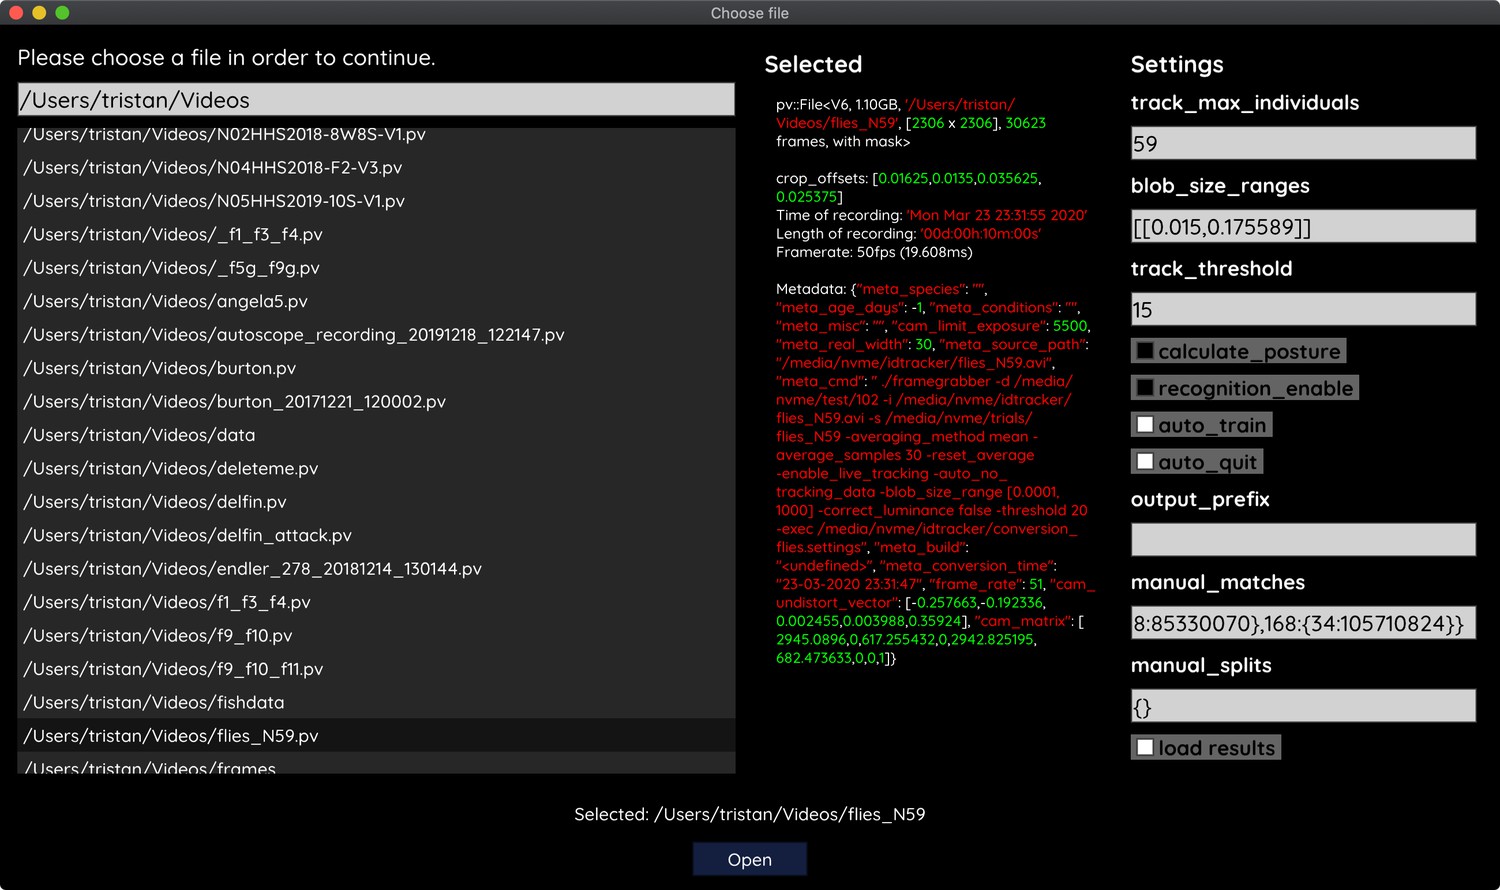
The file opening dialog.
On the left is a list of compatible files in the current folder. The center column shows meta-information provided by the video file, including its frame-rate and resolution – or some of the settings used during conversion and the timestamp of conversion. The column on the right provides an easy interface for adjusting the most important parameters before starting up the software. Most parameters can be changed later on from within TRex as well.
Appendix 2—figure 1
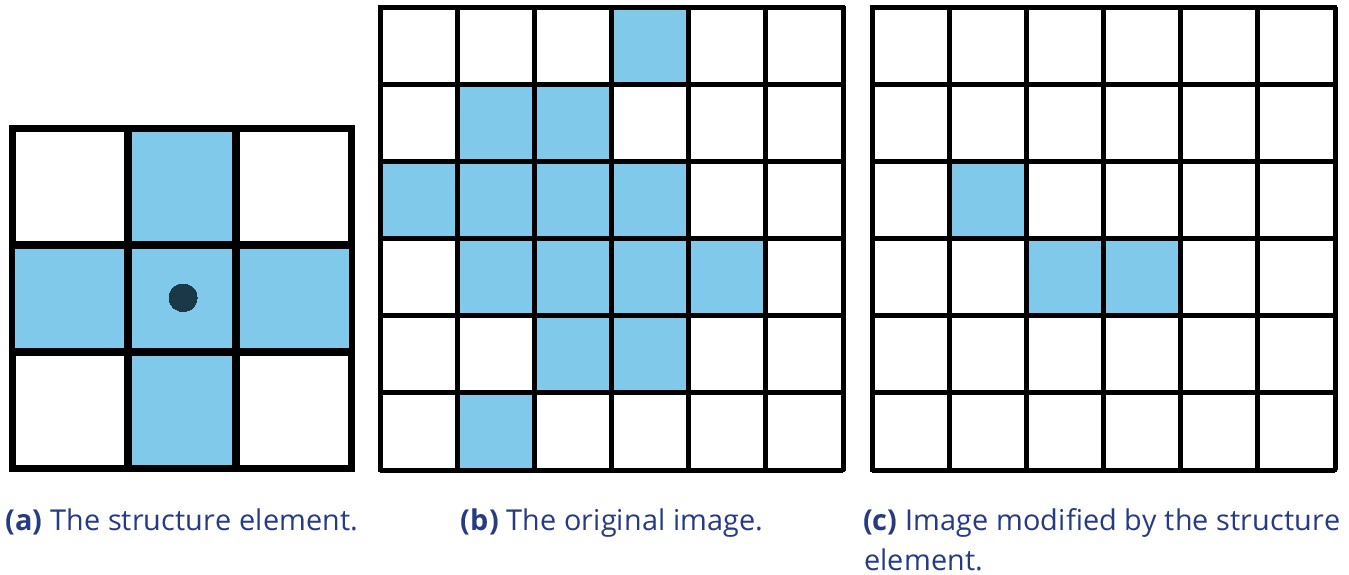
Example of morphological operations on images: ‘Erosion’.
Blue pixels denote on-pixels with color values greater than zero, white pixels are ‘off-pixels’ with a value equal to zero. A mask is moved across the original image, with its center (dot) being the focal pixel. A focal pixel is retained if all the on-pixels within the structure element/mask are on top of on-pixels in the original image. Otherwise the focal pixel is set to 0. The type of operation performed is entirely determined by the structure element.
Appendix 3—figure 1
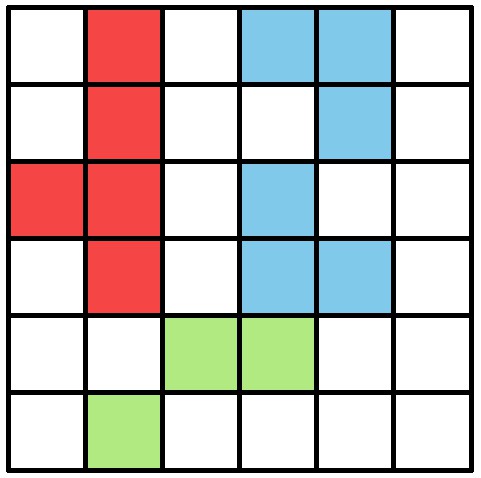
An example array of pixels, or image, to be processed by the connected components algorithm.
This figure should be read from top to bottom, just as the connected components algorithm would do. When this image is analyzed, the red and blue objects will temporarily stay separate within different ‘blobs’. When the green pixels are reached, both objects are combined into one identity.
Appendix 4—figure 1
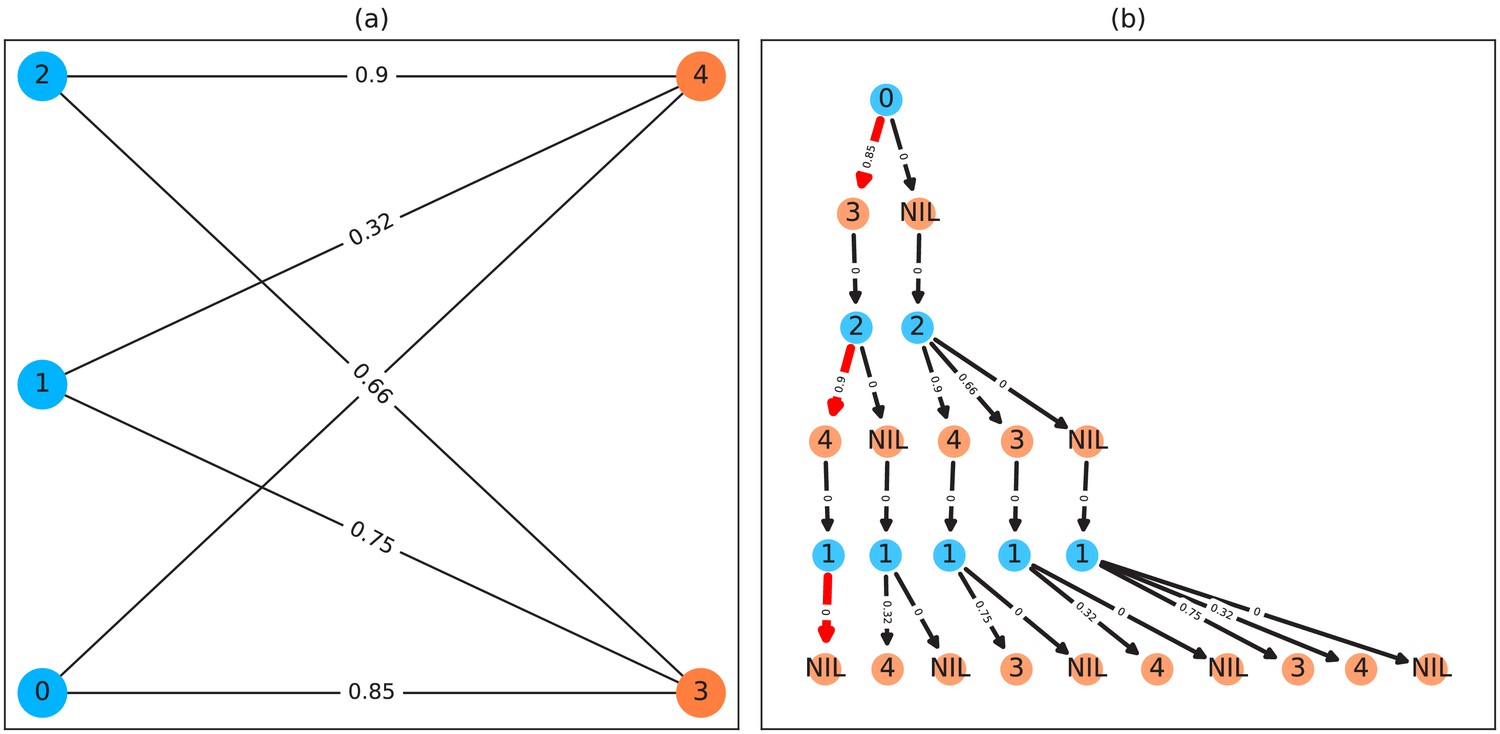
A bipartite graph (a) and its equivalent tree-representation (b).
It is bipartite since nodes can be sorted into two disjoint and independent sets ( and ), where no nodes have edges to other nodes within the same set. (a) is a straight-forward way of depicting an assignment problem, with the identities on the left side and objects being assigned to the identities on the right side. Edge weights are, in TRex and this example, probabilities for a given identity to be the object in question. This graph is also an example for an unbalanced assignment problem, since there are fewer objects (orange) available than individuals (blue). The optimal solution in this case, using weight-maximization, is to assign and leave one unassigned. Invalid edges have been pruned from the tree in (b), enforcing the rule that objects can only appear once in each path. The optimal assignments have been highlighted in red.
Appendix 4—figure 2
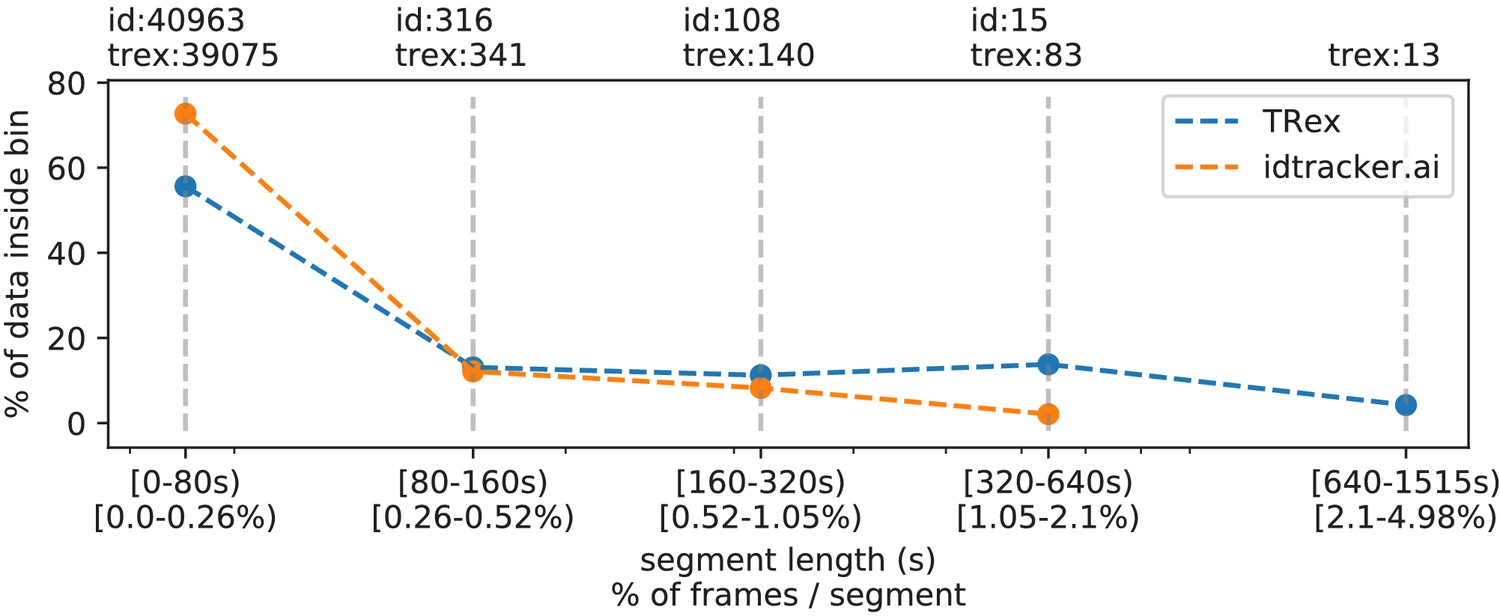
The same set of videos as in Table 5 pooled together, we evaluate the efficiency of our crossings solver.
Consecutive frame segments are sequences of frames without gaps, for example due to crossings or visibility issues. We find these consecutive frame segments in data exported by TRex, and compare the distribution of segment-lengths to idtracker.ai's results (as a reference for an algorithm without a way to resolve crossings). In idtracker.ai's case, we segmented the non-interpolated tracks by missing frames, assuming tracks to be correct in between. The Y-axis shows the percentage of in V videos that one column makes up for – the overall coverage for TRex was 98%, while idtracker.ai was slightly worse with 95.17%. Overall, the data distribution suggests that, probably due to it attempting to resolve crossings, TRex seems to produce longer consecutive segments.
-
Appendix 4—figure 2—source data 1
A list of all consecutive frame segments used in Appendix 4—figure 2.
In the table, they are indexed by their length, the software they were produced by, the video they originate from, as well as they bin they belong to.
- https://cdn.elifesciences.org/articles/64000/elife-64000-app4-fig2-data1-v2.csv
-
Appendix 4—figure 2—source data 2
The raw data-points as plotted in Appendix 4—figure 2.
- https://cdn.elifesciences.org/articles/64000/elife-64000-app4-fig2-data2-v2.csv
Appendix 4—figure 3

Mean values of processing-times and 5 %/95 % percentiles for video frames of all videos in the speed dataset (Table 1), comparing two different matching algorithms.
Parameters were kept identical, except for the matching mode, and posture was turned off to eliminate its effects on performance. Our tree-based algorithm is shown in green and the Hungarian method in red. Grey numbers above the graphs show the number of samples within each bin, per method. Differences between the algorithms increase very quickly, proportional to the number of individuals. Especially the Hungarian method quickly becomes very computationally intensive, while our tree-based algorithm shows a much shallower curve. Some frames could not be solved in reasonable time by the tree-based algorithm alone, at which point it falls back to the Hungarian algorithm. Data-points belonging to these frames () have been excluded from the results for both algorithms. One main advantage of the Hungarian method is that, with its bounded worst-case complexity (see Appendix D Matching an object to an object in the next frame), no such combinatorical explosions can happen. However, even given this advantage the Hungarian method still leads to significantly lower processing speed overall (see also Appendix 4—table 3).
-
Appendix 4—figure 3—source data 1
Raw data for producing this figure and Appendix 4—table 3.
Each sample is represented as a row here, indexed by method (tree, approximate, hungarian), video and the bin (horizontal line in this figure).
- https://cdn.elifesciences.org/articles/64000/elife-64000-app4-fig3-data1-v2.zip
Appendix 5—figure 1

The original image is displayed on the left.
Each square represents one pixel. The processed image on the right is overlaid with lines of different colors, each representing one connected component detected by our outline estimation algorithm. Dots in the centers of pixels are per-pixel-identities returned by OpenCVs findContours function (for reference) coded in the same colors as ours. Contours calculated by OpenCVs algorithm can not be used to estimate the one-pixel-wide ‘tail’ of the 9-like shape seen here, since it becomes a 1D line without sub-pixel accuracy. Our algorithm also detects diagonal lines of pixels, which would otherwise be an aliased line when scaled up.
Appendix 12—figure 1 with 2 supplements
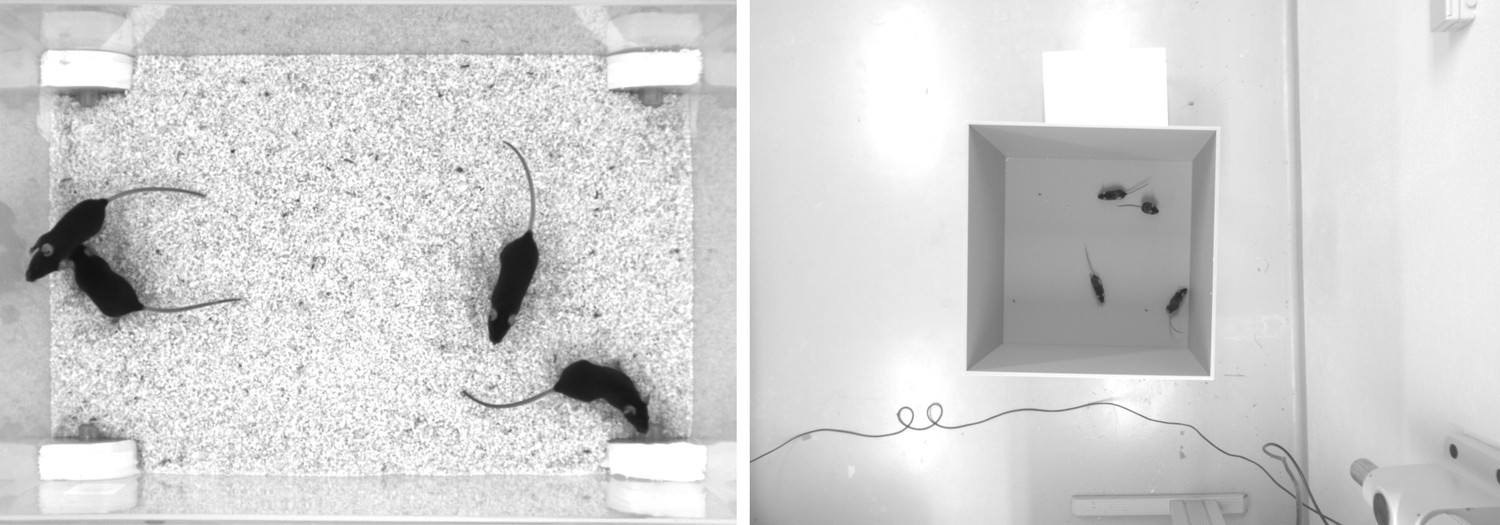
Screenshots from videos V1 and V2 listed in Appendix 12—table 1.
Left (V1), video of four ‘black mice’ (17 min, 1272 × 909 px resolution) from Romero-Ferrero et al., 2019. Right (V2), four C57BL/6 mice (1: 08 min, 1280 × 960 px resolution) by M. Groettrup, D. Mink.
Appendix 12—figure 1—video 1
A clip of the tracking results from V1, played back at normal speed.
Although it succumbs to noise in some frames (e.g. around 13 s), posture estimation remains remarkably robust to it throughout the video – sometimes even through periods where individuals overlap (e.g. at 27 s). Identity assignments are near perfect here, confirming our results in Appendix 12—table 1. https://youtu.be/UnqRNKrYiR4.
Appendix 12—figure 1—video 2
Tracking results from V2, played back at two times normal speed.
Since resolution per animal in V2 is lower than V1, and contrast is lower, posture estimation in V2 is also slightly worse than in V1. Importantly, however, identity assignment is very stable and accurate. https://youtu.be/OTP4dVSc7Es.
Appendix 12—figure 2

Median of all normalized images (N = 7161, 7040, 7153, 7076) for each of the four individuals from V1 in Appendix 12—table 1.
Posture information was used to normalize each image sample, which was stable enough — also for TRex — to tell where the head is, and even to make out the ears on each side (brighter spots).
Appendix 12—figure 3
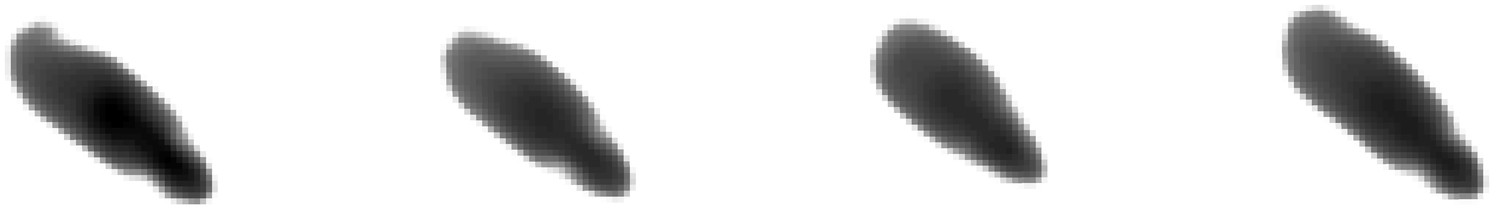
Median of all normalized images (N = 1593, 1586, 1620, 1538) for each of the four individuals from V2 in Appendix 12—table 1.
Resolution per animal is lower than in V1, but ears are still clearly visible.
Tables
Table 1
A list of the videos used in this paper as part of the evaluation of TRex, along with the species of animals in the videos and their common names, as well as other video-specific properties.
Videos are given an incremental ID, to make references more efficient in the following text, which are sorted by the number of individuals in the video. Individual quantities are given accurately, except for the videos with more than 100 where the exact number may be slightly more or less. These videos have been analyzed using TRex’ dynamic analysis mode that supports unknown quantities of animals. Videos 7 and 8, as well as 13–11, are available as part of the original idtracker paper (Pérez-Escudero et al., 2014). Many of the videos are part of yet unpublished data: Guppy videos have been recorded by A. Albi, videos with sunbleak (Leucaspius delineatus) have been recorded by D. Bath. The termite video has been kindly provided by H. Hugo and the locust video by F. Oberhauser. Due to the size of some of these videos (>150 GB per video), they have to be made available upon specific request. Raw versions of these videos (some trimmed), as well as full preprocessed versions, are available as part of the dataset published alongside this paper (Walter et al., 2020).
| ID | Species | Common | # ind. | Fps (Hz) | Duration | Size (Px2) () |
|---|---|---|---|---|---|---|
| 0 | Leucaspius delineatus | Sunbleak | 1024 | 40 | 8 min 20 s | 3866 × 4048 |
| 1 | Leucaspius delineatus | Sunbleak | 512 | 50 | 6 min 40 s | 3866 × 4140 |
| 2 | Leucaspius delineatus | Sunbleak | 512 | 60 | 5 min 59 s | 3866 × 4048 |
| 3 | Leucaspius delineatus | Sunbleak | 256 | 50 | 6 min 40 s | 3866 × 4140 |
| 4 | Leucaspius delineatus | Sunbleak | 256 | 60 | 5 min 59 s | 3866 × 4048 |
| 5 | Leucaspius delineatus | Sunbleak | 128 | 60 | 6 min | 3866 × 4048 |
| 6 | Leucaspius delineatus | Sunbleak | 128 | 60 | 5 min 59 s | 3866 × 4048 |
| 7 | Danio rerio | Zebrafish | 100 | 32 | 1 min | 3584 × 3500 |
| 8 | Drosophila melanogaster | Fruit-fly | 59 | 51 | 10 min | 2306 × 2306 |
| 9 | Schistocerca gregaria | Locust | 15 | 25 | 1hr 0 min | 1880 × 1881 |
| 10 | Constrictotermes cyphergaster | Termite | 10 | 100 | 10 min 5 s | 1920 × 1080 |
| 11 | Danio rerio | Zebrafish | 10 | 32 | 10 min 10 s | 3712 × 3712 |
| 12 | Danio rerio | Zebrafish | 10 | 32 | 10 min 3 s | 3712 × 3712 |
| 13 | Danio rerio | zebrafish | 10 | 32 | 10 min 3 s | 3712 × 3712 |
| 14 | Poecilia reticulata | Guppy | 8 | 30 | 3 hr 15 min 22 s | 3008 × 3008 |
| 15 | Poecilia reticulata | Guppy | 8 | 25 | 1 hr 12 min | 3008 × 300 |
| 16 | Poecilia reticulata | Guppy | 8 | 35 | 3 hr 18 min 13 s | 3008 × 3008 |
| 17 | Poecilia reticulata | Guppy | 1 | 140 | 1 hr 9 min 32 s | 1312 × 1312 |
Table 2
Results of the human validation for a subset of videos.
Validation was performed by going through all problematic situations (e.g. individuals lost) and correcting mistakes manually, creating a fully corrected dataset for the given videos. This dataset may still have missing frames for some individuals, if they could not be detected in certain frames (as indicated by ‘of that interpolated’). This was usually a very low percentage of all frames, except for Video 9, where individuals tended to rest on top of each other – and were thus not tracked – for extended periods of time. This baseline dataset was compared to all other results obtained using the automatic visual identification by TRex () and idtracker.ai () to estimate correctness. We were not able to track Videos 9 and 10 with idtracker.ai, which is why correctness values are not available.
| Video metrics | Review stats | % correct | |||
|---|---|---|---|---|---|
| Video | # ind. | Reviewed (%) | Of that interpolated (%) | TRex | idtracker.ai |
| 7 | 100 | 100.0 | 0.23 | 99.07 ± 0.013 | 98.95 ± 0.146 |
| 8 | 59 | 100.0 | 0.15 | 99.68 ± 0.533 | 99.94 ± 0.0 |
| 9 | 15 | 22.2 | 8.44 | 95.12 ± 6.077 | N/A |
| 10 | 10 | 100.0 | 1.21 | 99.7 ± 0.088 | N/A |
| 13 | 10 | 100.0 | 0.27 | 99.98 ± 0.0 | 99.96 ± 0.0 |
| 12 | 10 | 100.0 | 0.59 | 99.94 ± 0.006 | 99.63 ± 0.0 |
| 11 | 10 | 100.0 | 0.5 | 99.89 ± 0.009 | 99.34 ± 0.002 |
-
Table 2—source data 1
A table of positions for each individual of each manually approved and corrected trial.
- https://cdn.elifesciences.org/articles/64000/elife-64000-table2-data1-v2.zip
Table 3
Evaluating comparability of the automatic visual identification between idtracker.ai and TRex.
Columns show various video properties, as well as the associated uniqueness score (see Guiding the training process) and a similarity metric. Similarity (% similar individuals) is calculated based on comparing the positions for each identity exported by both tools, choosing the closest matches overall and counting the ones that are differently assigned per frame. An individual is classified as ‘wrong’ in that frame, if the euclidean distance between the matched solutions from idtracker.ai and TRex exceeds 1 % of the video width. The column ‘% similar individuals’ shows percentage values, where a value of 99% would indicate that, on average, 1 % of the individuals are assigned differently. To demonstrate how uniqueness corresponds to the quality of results, the last column shows the average uniqueness achieved across trials. A file containing all X and Y positions for each trial and each software combined into one very large table is available from Walter et al., 2020, along with the data in different formats.
| Video | # ind. | N TRex | % similar individuals | Final uniqueness |
|---|---|---|---|---|
| 7 | 100 | 5 | 99.8346 ± 0.5265 | 0.9758 ± 0.0018 |
| 8 | 59 | 5 | 98.6885 2.1145 | 0.9356 ± 0.0358 |
| 13 | 10 | 5 | 99.9902 0.3737 | 0.9812 ± 0.0013 |
| 11 | 10 | 5 | 99.9212 ± 1.1208 | 0.9461 ± 0.0039 |
| 12 | 10 | 5 | 99.9546 ± 0.8573 | 0.9698 ± 0.0024 |
| 14 | 8 | 5 | 98.8356 ± 5.8136 | 0.9192 ± 0.0077 |
| 15 | 8 | 5 | 99.2246 ± 4.4486 | 0.9576 ± 0.0023 |
| 162 | 8 | 5 | 99.7704 ± 2.1994 | 0.9481 ± 0.0025 |
-
Table 3—source data 1
Assignments between identities from multiple solutions, as calculated by a bipartite-graph matching algorithm.
For each permutation of trials from TRex and idtracker.ai for the same video, the algorithm sought to match the trajectories of the same physical individuals in both trials with each other by finding the ones with the smallest mean euclidean distance per frame between them. Available from Walter et al., 2020 as T2_source_data.zip.
- https://cdn.elifesciences.org/articles/64000/elife-64000-table3-data1-v2.csv
Table 4
Both TRex and idtracker.ai analyzed the same set of videos, while continuously logging their memory consumption using an external tool.
Rows have been sorted by , which seems to be a good predictor for the memory consumption of both solutions. idtracker.ai has mixed mean values, which, at low individual densities are similar to TRex’ results. Mean values can be misleading here, since more time spent in low-memory states skews results. The maximum, however, is more reliable since it marks the memory that is necessary to run the system. Here, idtracker.ai clocks in at significantly higher values (almost always more than double) than TRex.
| Video | #ind. | Length | Max.consec. | TRex memory (GB) | Idtracker.ai memory (GB) |
|---|---|---|---|---|---|
| 12 | 10 | 10 min | 26.03s | 4.88 ± 0.23, max 6.31 | 8.23 ± 0.99, max 28.85 |
| 13 | 10 | 10 min | 36.94s | 4.27 ± 0.12, max 4.79 | 7.83 ± 1.05, max 29.43 |
| 11 | 10 | 10 min | 28.75s | 4.37 ± 0.32, max 5.49 | 6.53 ± 4.29, max 29.32 |
| 7 | 100 | 1 min | 5.97s | 9.4 ± 0.47, max13.45 | 15.27 ± 1.05, max 24.39 |
| 15 | 8 | 72 min | 79.4s | 5.6 ± 0.22, max 8.41 | 35.2 ± 4.51, max 91.26 |
| 10 | 10 | 10 min | 1391s | 6.94 ± 0.27, max 10.71 | N/A |
| 9 | 15 | 60 min | 7.64s | 13.81 ± 0.53, max 16.99 | N/A |
| 8 | 59 | 10 min | 102.35s | 12.4 ± 0.56, max 17.41 | 35.3 ± 0.92, max 50.26 |
| 14 | 8 | 195 min | 145.77s | 12.44 ± 0.8, max 21.99 | 35.08 ± 4.08, max 98.04 |
| 16 | 8 | 198 min | 322.57s | 16.15 ± 1.6, max 28.62 | 49.24 ± 8.21, max 115.37 |
-
Table 4—source data 1
Data from log files for all trials as a single table, where each row is one sample.
The total memory of each sample is calculated as . Each row indicates at which exact time, by which software, and as part of which trial it was taken.
- https://cdn.elifesciences.org/articles/64000/elife-64000-table4-data1-v2.zip
Table 5
Evaluating time-cost for automatic identity correction – comparing to results from idtracker.ai.
Timings consist of preprocessing time in TGrabs plus network training in TRex, which are shown separately as well as combined (ours (min), ). The time it takes to analyze videos strongly depends on the number of individuals and how many usable samples per individual the initial segment provides. The length of the video factors in as well, as does the stochasticity of the gradient descent (training). idtracker.ai timings () contain the whole tracking and training process from start to finish, using its terminal_mode (v3). Parameters have been manually adjusted per video and setting, to the best of our abilities, spending at most one hour per configuration. For videos 16 and 14, we had to set idtracker.ai to storing segmentation information on disk (as compared to in RAM) to prevent the program from being terminated for running out of memory.
| Video | # ind. | Length | Sample | TGrabs (min) | TRex (min) | Ours (min) | idtracker.ai (min) |
|---|---|---|---|---|---|---|---|
| 7 | 100 | 1min | 1.61s | 2.03 ± 0.02 | 74.62 ± 6.75 | 76.65 | 392.22 ± 119.43 |
| 8 | 59 | 10min | 19.46s | 9.28 ± 0.08 | 96.7 ± 4.45 | 105.98 | 495.82 ± 115.92 |
| 9 | 15 | 60min | 33.81s | 13.17 ± 0.12 | 101.5 ± 1.85 | 114.67 | N/A |
| 11 | 10 | 10min | 12.31s | 8.8 ± 0.12 | 21.42 ± 2.45 | 30.22 | 127.43 ± 57.02 |
| 12 | 10 | 10min | 10.0s | 8.65 ± 0.07 | 23.37 ± 3.83 | 32.02 | 82.28 ± 3.83 |
| 13 | 10 | 10min | 36.91s | 8.65 ± 0.047 | 12.47 ± 1.27 | 21.12 | 79.42 ± 4.52 |
| 10 | 10 | 10min | 16.22s | 4.43 ± 0.05 | 35.05 ± 1.45 | 39.48 | N/A |
| 14 | 8 | 195min | 67.97s | 109.97 ± 0.05 | 70.48 ± 3.67 | 180.45 | 707.0 ± 27.55 |
| 15 | 8 | 72min | 79.36s | 32.1 ± 0.42 | 30.77 ± 6.28 | 62.87 | 291.42 ± 16.83 |
| 16 | 8 | 198min | 134.07s | 133.1 ± 2.28 | 68.85 ± 13.12 | 201.95 | 1493.83 ± 27.75 |
-
Table 5—source data 1
Preprocessed log files (see also notebooks.zip in Walter et al., 2020) in a table format.
The total processing time (s) of each trial is indexed by video and software used – TGrabs for conversion and TRex and idtracker.ai for visual identification. This data is also used in Appendix 4—table 4.
- https://cdn.elifesciences.org/articles/64000/elife-64000-table5-data1-v2.csv
Appendix 4—table 1
Showing quantiles for frame timings for videos of the speed dataset (without posture enabled).
Video 15, 16, and 14 each contain a short sequence of taking out the fish, causing a lot of big objects and noise in the frame. This leads to relatively high spikes in these segments of the video, resulting in high peak processing timings here. Generally, processing time is influenced by a lot of factors involving not only TRex, but also the operating system as well as other programs. While we did try to control for these, there is no way to make sure. However, having sporadic spikes in the timings per frame does not significantly influence overall processing time, since it can be compensated for by later frames. We can see that videos of all quantities ≤256 individuals can be processed faster than they could be recorded. Videos that can not be processed faster than real-time are underlaid in gray.
| Video characteristics | Ms / frame (processing) | Processing time | ||||||
|---|---|---|---|---|---|---|---|---|
| Video | # ind. | Ms / frame | 5% | Mean | 95 % | Max | > real-time | % video length |
| 0 | 1024 | 25.0 | 46.93 | 62.96 | 119.54 | 849.16 | 100.0% | 358.12 |
| 1 | 512 | 20.0 | 19.09 | 29.26 | 88.57 | 913.52 | 92.11% | 259.92 |
| 2 | 512 | 16.67 | 17.51 | 26.53 | 36.72 | 442.12 | 97.26% | 235.39 |
| 3 | 256 | 20.0 | 8.35 | 11.28 | 13.25 | 402.54 | 1.03% | 77.18 |
| 4 | 256 | 16.67 | 8.04 | 11.62 | 13.48 | 394.75 | 1.13% | 94.77 |
| 5 | 128 | 16.67 | 3.54 | 5.14 | 5.97 | 367.92 | 0.41% | 40.1 |
| 6 | 128 | 16.67 | 3.91 | 5.64 | 6.89 | 381.51 | 0.51% | 44.38 |
| 7 | 100 | 31.25 | 2.5 | 3.57 | 5.19 | 316.75 | 0.1% | 28.35 |
| 8 | 59 | 19.61 | 1.43 | 2.29 | 3.93 | 2108.77 | 0.19% | 16.33 |
| 9 | 15 | 40.0 | 0.4 | 0.52 | 1.67 | 4688.5 | 0.01% | 2.96 |
| 10 | 10 | 10.0 | 0.28 | 0.33 | 0.57 | 283.7 | 0.07% | 8.08 |
| 11 | 10 | 31.25 | 0.21 | 0.25 | 0.65 | 233.7 | 0.01% | 3.48 |
| 12 | 10 | 31.25 | 0.23 | 0.27 | 0.75 | 225.63 | 0.02% | 2.82 |
| 13 | 10 | 31.25 | 0.22 | 0.25 | 0.54 | 237.32 | 0.02% | 2.64 |
| 14 | 8 | 33.33 | 0.24 | 0.29 | 0.66 | 172.8 | 0.02% | 1.8 |
| 15 | 8 | 40.0 | 0.22 | 0.26 | 0.88 | 244.88 | 0.01% | 1.5 |
| 16 | 8 | 28.57 | 0.18 | 0.21 | 0.51 | 1667.14 | 0.02% | 1.38 |
| 17 | 1 | 7.14 | 0.03 | 0.04 | 0.06 | 220.81 | 0.01% | 1.56 |
-
Appendix 4—table 1—source data 1
Raw samples for this table and Appendix 4—table 5.
- https://cdn.elifesciences.org/articles/64000/elife-64000-app4-table1-data1-v2.zip
Appendix 4—table 2
A quality assessment of assignment decisions made by the general purpose tracking system without the aid of visual recognition – comparing results of two accurate tracking algorithms with the assignments made by an approximate method.
Here, decisions are reassignments of an individual after it has been lost, or the tracker was too ‘unsure’ about an assignment. Decisions can be either correct or wrong, which is determined by comparing to reference data generated using automatic visual recognition: Every segment of frames between decisions is associated with a corresponding ‘baseline-truth’ identity from the reference data. If this association changes after a decision, then that decision is counted as wrong. Analysing a decision may fail if no good match can be found in the reference data (which is not interpolated). Failed decisions are ignored. Comparative values for the Hungarian algorithm (Kuhn, 1955) are always exactly the same as for our tree-based algorithm, and are therefore not listed separately. Left-aligned total, excluded and wrong counts in each column are results achieved by an accurate algorithm, numbers to their right are the corresponding results using an approximate method. Raw data of trial runs using the hungarian and tree-based matching algorithms, as well as baseline data from manually or automatically corrected trials used in this table is available for download from Walter et al., 2020 (in A4T2_source_data.zip).
| Video | # ind. | Length | Total | Excluded | Wrong | |||
|---|---|---|---|---|---|---|---|---|
| 7 | 100 | 1 min | 717 | 755 | 22 | 22 | 45 (6.47%) | 65 (8.87%) |
| 8 | 59 | 10 min | 279 | 312 | 146 | 100 | 55 (41.35%) | 32 (16.09%) |
| 9 | 15 | 1h0min | 838 | 972 | 70 | 111 | 100 (13.02%) | 240 (27.87%) |
| 13 | 10 | 10min3s | 331 | 337 | 22 | 22 | 36 (11.65%) | 54 (17.14%) |
| 12 | 10 | 10min3s | 382 | 404 | 42 | 43 | 83 (24.41%) | 130 (36.01%) |
| 11 | 10 | 10min10s | 1067 | 1085 | 50 | 52 | 73 (7.18%) | 92 (8.91%) |
| 14 | 8 | 3h15min22s | 7424 | 7644 | 1428 | 1481 | 1174 (19.58%) | 1481 (24.03%) |
| 15 | 8 | 1h12min | 3538 | 3714 | 427 | 517 | 651 (20.93%) | 962 (30.09%) |
| 16 | 8 | 3h18min13s | 2376 | 3305 | 136 | 206 | 594 (26.52%) | 1318 (42.53%) |
| sum | 16952 | 16754 | -2343 | -2554 | 2811 (19.24%) | 4374 (27.38%) | ||
Appendix 4—table 3
Comparing computation speeds of the tree-based tracking algorithm with the widely established Hungarian algorithm Kuhn, 1955, as well as an approximate version optimized for large quantities of individuals.
Posture estimation has been disabled, focusing purely on the assignment problem in our timing measurements. The tree-based algorithm is programmed to fall back on the Hungarian method whenever the current problem ‘explodes’ computationally – these frames were excluded. Listed are relevant video metrics on the left and mean computation speeds on the right side for three different algorithms: (1) The tree-based and (2) the approximate algorithm presented in this paper, and (3) the Hungarian algorithm. Speeds listed here are percentages of real-time (the videos’ fps), demonstrating usability in closed-loop applications and overall performance. Results show that increasing the number of individuals both increases the time-cost, as well as producing much larger relative standard deviation values. (1) is almost always fast than (3), while becoming slower than (2) with increasing individual numbers. In our implementation, all algorithms produce faster than real-time speeds with 256 or fewer individuals (see also appendix Table Appendix 4—table 1), with (1) and (2) even getting close for 512 individuals.
| Video metrics | % real-time | |||||
|---|---|---|---|---|---|---|
| Video | # ind. | Fps (Hz) | Size (px2) | Tree | Approximate | Hungarian |
| 0 | 1024 | 40 | 3866 × 4048 | 35.49 ± 65.94 | 38.69 ± 65.39 | 12.05 ± 18.72 |
| 1 | 512 | 50 | 3866 × 4140 | 51.18 ± 180.08 | 75.02 ± 193.0 | 28.92 ± 29.12 |
| 2 | 512 | 60 | 3866 × 4048 | 59.66 ± 121.4 | 65.58 ± 175.51 | 23.18 ± 26.83 |
| 3 | 256 | 50 | 3866 × 4140 | 174.02 ± 793.12 | 190.62 ± 743.54 | 127.86 ± 9841.21 |
| 4 | 256 | 60 | 3866 × 4048 | 140.73 ± 988.15 | 155.9 ± 760.05 | 108.48 ± 2501.06 |
| 5 | 128 | 60 | 3866 × 4048 | 318.6 ± 347.8 | 353.58 ± 291.63 | 312.05 ± 337.71 |
| 6 | 128 | 60 | 3866 × 4048 | 286.13 ± 330.08 | 314.91 ± 303.53 | 232.33 ± 395.21 |
| 7 | 100 | 32 | 3584 × 3500 | 572.46 ± 98.21 | 611.5 ± 96.46 | 637.87 ± 97.03 |
| 8 | 59 | 51 | 2306 × 2306 | 744.98 ± 364.43 | 839.45 ± 257.56 | 864.01 ± 223.47 |
| 9 | 15 | 25 | 1880 × 1881 | 4626 ± 424.8 | 4585.08 ± 378.64 | 4508.08 ± 404.56 |
| 10 | 10 | 100 | 1920 × 1080 | 2370.35 ± 303.94 | 2408.27 ± 297.83 | 2362.42 ± 296.99 |
| 11 | 10 | 32 | 3712 × 3712 | 6489.12 ± 322.59 | 6571.28 ± 306.34 | 6472.0 ± 322.03 |
| 12 | 10 | 32 | 3712 × 3712 | 6011.59 ± 318.12 | 6106.12 ± 305.96 | 55.49.25 ± 318.21 |
| 13 | 10 | 32 | 3712 × 3712 | 6717.12 ± 325.37 | 6980.12 ± 316.59 | 6726.46 ± 316.87 |
| 14 | 8 | 30 | 3008 × 3008 | 8752.2 ± 2141.03 | 8814.63 ± 2140.4 | 8630.73 ± 2177.16 |
| 15 | 8 | 25 | 3008 × 3008 | 9786.68 ± 1438.08 | 10118.04 ± 1380.2 | 9593.44 ± 1439.28 |
| 16 | 8 | 35 | 3008 × 3008 | 6861.42 ± 1424.91 | 10268.82 ± 1339.8 | 9680.68 ± 1387.14 |
| 17 | 1 | 140 | 1312 × 1312 | 15323.05 ± 637.17 | 15250.39 ± 639.2 | 15680.93 ± 640.99 |
Appendix 4—table 4
Comparing the time-cost for tracking and converting videos in two steps with doing both of those tasks at the same time.
The columns prepare and tracking show timings for the tasks when executed separately, while live shows the time when both of them are performed at the same time using the live-tracking feature of TGrabs. The column win shows the time ‘won’ by combining tracking and preprocessing as the percentage . The process is more complicated than simply adding up timings of the tasks. Memory and the interplay of work-loads have a huge effect here. Posture is enabled in all variants.
| Video metrics | Minutes | ||||||
|---|---|---|---|---|---|---|---|
| Video | # ind. | Length | Fps (Hz) | Prepare | Tracking | Live | Win (%) |
| 0 | 1024 | 8.33min | 40 | 10.96 ± 0.3 | 41.11 ± 0.34 | 65.72 ± 1.35 | -26.23 |
| 1 | 512 | 6.67min | 50 | 11.09 ± 0.24 | 24.43 ± 0.2 | 33.67 ± 0.58 | 5.24 |
| 2 | 512 | 5.98min | 60 | 11.72 ± 0.2 | 20.86 ± 0.47 | 31.1 ± 0.62 | 4.55 |
| 3 | 256 | 6.67min | 50 | 11.09 ± 0.21 | 7.99 ± 0.17 | 12.32 ± 0.17 | 35.26 |
| 4 | 256 | 5.98min | 60 | 11.76 ± 0.26 | 9.04 ± 0.26 | 15.08 ± 0.13 | 27.46 |
| 6 | 128 | 5.98min | 60 | 11.77 ± 0.29 | 4.74 ± 0.13 | 12.13 ± 0.32 | 26.49 |
| 5 | 128 | 6.0min | 60 | 11.74 ± 0.26 | 4.54 ± 0.1 | 12.08 ± 0.25 | 25.79 |
| 7 | 100 | 1.0min | 32 | 1.92 ± 0.02 | 0.47 ± 0.01 | 2.03 ± 0.02 | 14.88 |
| 8 | 59 | 10.0min | 51 | 6.11 ± 0.07 | 7.68 ± 0.12 | 9.28 ± 0.08 | 32.7 |
| 9 | 15 | 60.0min | 25 | 12.59 ± 0.18 | 5.32 ± 0.07 | 13.17 ± 0.12 | 26.47 |
| 11 | 10 | 10.17min | 32 | 8.58 ± 0.04 | 0.74 ± 0.01 | 8.8 ± 0.12 | 5.66 |
| 12 | 10 | 10.05min | 32 | 8.68 ± 0.04 | 0.75 ± 0.01 | 8.65 ± 0.07 | 8.3 |
| 13 | 10 | 10.05min | 32 | 8.67 ± 0.03 | 0.71 ± 0.01 | 8.65 ± 0.07 | 7.76 |
| 102 | 10 | 10.08min | 100 | 4.17 ± 0.06 | 2.02 ± 0.02 | 4.43 ± 0.05 | 28.3 |
| 14 | 8 | 195.37min | 30 | 110.51 ± 2.32 | 8.99 ± 0.22 | 109.97 ± 2.05 | 7.98 |
| 15 | 8 | 72.0min | 25 | 31.84 ± 0.53 | 3.26 ± 0.07 | 32.1 ± 0.42 | 8.55 |
| 16 | 8 | 198.22min | 35 | 133.45 ± 2.22 | 11.38 ± 0.28 | 1.33 ± 2.28 | 8.1 |
| mean | 14.55 % | ||||||
Appendix 4—table 5
Statistics for running the tree-based matching algorithm with the videos of the speed dataset.
We achieve low leaf and node visits across the board – this is especially interesting in videos with high numbers of individuals. High values for ’# nodes visited’ are only impactful if they make up a large portion of the assignments. These are the result of too many choices for assignments – the weak point of the tree-based algorithm – and lead to combinatorical ‘explosions’ (the method will take a really long time to finish). If such an event is detected, TRex automatically switches to a more computationally bounded algorithm like the Hungarian method.
| Video characteristics | Matching stats | |||
|---|---|---|---|---|
| Video | # ind. | # nodes visited (5,50,95,100%) | # leafs visited | # improvements |
| 0 | 1024 | [1535; 2858; 83243; 18576918] | 1.113 ± 0.37 | 1.113 |
| 1 | 512 | [1060; 8156; 999137; 19811558] | 1.247 ± 0.61 | 1.247 |
| 2 | 512 | [989; 2209; 56061; 8692547] | 1.159 ± 0.47 | 1.159 |
| 3 | 256 | [452; 479; 969; 205761] | 1.064 ± 0.29 | 1.064 |
| 4 | 256 | [475; 496; 584; 608994] | 1.028 ± 0.18 | 1.028 |
| 5 | 128 | [233; 245; 258; 7149] | 1.012 ± 0.12 | 1.012 |
| 6 | 128 | [237; 259; 510; 681702] | 1046 ± 0.25 | 1.046 |
| 7 | 100 | [195; 199; 199; 13585] | 1.014 ± 0.14 | 1.014 |
| 8 | 59 | [117; 117; 117; 16430] | 1.014 ± 0.2 | 1.014 |
| 9 | 15 | [24; 29; 29; 635] | 1.027 ± 0.22 | 1.027 |
| 10 | 10 | [17; 19; 19; 56] | 1.001 ± 0.02 | 1.001 |
| 11 | 10 | [19; 19; 19; 129] | 1.006 ± 0.1 | 1.006 |
| 12 | 10 | [19; 19; 19; 1060] | 1.023 ± 0.23 | 1.023 |
| 13 | 10 | [19; 19; 19; 106] | 1.001 ± 0.04 | 1.001 |
| 14 | 8 | [11; 15; 15; 893] | 1.003 ± 0.08 | 1.003 |
| 15 | 8 | [13; 15; 15; 597] | 1.024 ± 0.23 | 1.024 |
| 16 | 8 | [15; 15; 15; 2151] | 1.009 ± 0.17 | 1.009 |
| 17 | 1 | [1; 1; 1; 1] | 1.0 ± 0.02 | 1.0 |
Appendix 9—table 1
Settings used for idtracker.ai trials, as saved inside the json files used for tracking.
The minimum intensity was always set to 0 and background subtraction was always enabled. An ROI is an area of interest in the form of an array of 2D vectors, typically a convex polygon containing the area of the tank (e.g. for fish or locusts). Since this format is quite lengthy, we only indicate here whether we limited the area of interest or not.
| Video | length (# frames) | Nblobs | Area | Max. intensity | Roi |
|---|---|---|---|---|---|
| 7 | 1921 | 100 | [165, 1500] | 170 | Yes |
| 8 | 30,626 | 59 | [100, 2500] | 160 | Yes |
| 11 | 19,539 | 10 | [200, 1500] | 10 | Yes |
| 13 | 19,317 | 10 | [200, 1500] | 10 | Yes |
| 12 | 19,309 | 10 | [200, 1500] | 10 | Yes |
| 9 | 90,001 | 8 | [190, 4000] | 147 | Yes |
| 16 | 416,259 | 8 | [200, 2500] | 50 | No |
| 14 | 351,677 | 8 | [200, 2500] | 50 | No |
| 15 | 108,000 | 8 | [250, 2500] | 10 | No |
Appendix 12—table 1
Analogous to our analysis in Table 3, we compared automatically generated trajectories for two videos with manually verified ones.
Unlike the table in the main text, the sample size per video is only one here, which is why the standard deviation is zero in both cases. Results show very high accuracy for both videos, but relatively high numbers of interpolated frames compared to Table 3, where only the results for Video 9 showed more than 8 % interpolation and all others remained below 1 %.
| Video | # ind. | Reviewed (%) | Interpolated (%) | TRex |
|---|---|---|---|---|
| (V1) Romero-Ferrero et al., 2019 | 4 | 100.0 | 6.41 | 99.6 ± 0.0 |
| (V2) D. Mink, M. Groettrup | 4 | 100.0 | 1.74 | 99.82 ± 0.0 |
Additional files
-
Transparent reporting form
- https://cdn.elifesciences.org/articles/64000/elife-64000-transrepform-v2.pdf
-
Appendix 4—figure 2—source data 1
A list of all consecutive frame segments used in Appendix 4—figure 2.
In the table, they are indexed by their length, the software they were produced by, the video they originate from, as well as they bin they belong to.
- https://cdn.elifesciences.org/articles/64000/elife-64000-app4-fig2-data1-v2.csv
-
Appendix 4—figure 2—source data 2
The raw data-points as plotted in Appendix 4—figure 2.
- https://cdn.elifesciences.org/articles/64000/elife-64000-app4-fig2-data2-v2.csv
-
Appendix 4—figure 3—source data 1
Raw data for producing this figure and Appendix 4—table 3.
Each sample is represented as a row here, indexed by method (tree, approximate, hungarian), video and the bin (horizontal line in this figure).
- https://cdn.elifesciences.org/articles/64000/elife-64000-app4-fig3-data1-v2.zip
-
Appendix 4—table 1—source data 1
Raw samples for this table and Appendix 4—table 5.
- https://cdn.elifesciences.org/articles/64000/elife-64000-app4-table1-data1-v2.zip
Download links
A two-part list of links to download the article, or parts of the article, in various formats.
Downloads (link to download the article as PDF)
Open citations (links to open the citations from this article in various online reference manager services)
Cite this article (links to download the citations from this article in formats compatible with various reference manager tools)
TRex, a fast multi-animal tracking system with markerless identification, and 2D estimation of posture and visual fields
eLife 10:e64000.
https://doi.org/10.7554/eLife.64000


