Reprogramming of translation in yeast cells impaired for ribosome recycling favors short, efficiently translated mRNAs
- Division of Molecular and Cellular Biology, Eunice Kennedy Shriver National Institute of Child Health and Human Development, National Institutes of Health, United States
- Laboratory of Biochemistry and Genetics, National Institute of Diabetes and Digestive and Kidney Diseases, National Institutes of Health, United States
Figures
Figure 1 with 2 supplements

Identification of mRNAs exhibiting altered relative TEs on deletion of TMA64/TMA20.
(A) Results from ribosome profiling showing the normalized 80S ribosome reads from all mRNAs aligned with respect to their stop codons, for WT strain BY4741 (blue), the tma∆∆ mutant H4520 (green), and SM-treated WT cells (maroon). Schematics depict queuing of 80S ribosomes 30 nt upstream of the stop codon in the tma∆∆ mutant attributed to 40S post-TerCs stalled at stop codons owing to defective recycling. (B) Expanded view of normalized 80S reads from all mRNAs shown in (A) for the first 50 nt of the 3’UTRs. The schematic depicts resumed scanning by 40S post-TerCs and reinitiation in 3’UTRs. (C) Polysome profiles of the strains in (A). (i)-(ii) Cells cultured in SC medium at 30°C to log-phase and treated with 50 μg/mL of CHX for 5 min before harvesting at 4°C. (iii) WT cells grown as in (i) except in SC-Ile/Val medium and treated with 1 µg/mL SM for 20 min before CHX addition. WCEs were resolved by sedimentation through sucrose gradients and scanned at 260 nm to visualize (from left to right) free 40S and 60S subunits, 80S monosomes, and polysomes. Tracings are magnified in the insets to show halfmer polysome positions (red arrows) in the tma∆∆ mutant, depicted in the schematic above (ii). The mean polysome/monosome (P/M) ratios and free 40S to 60S subunits ratios with ± standard error of the means (SEMs) from five biological replicates are shown. (D) Volcano plot showing the log2 ratios of relative TEs in the tma∆∆ mutant versus WT cells (∆TEtma∆∆ values) for each mRNA (x-axis) versus negative log10 of the False Discovery Rate (FDR) for the ∆TEtma∆∆ changes determined by DESeq2 analysis of ribosome profiling data for the 5405 mRNAs with evidence of translation (y-axis). The dotted line marks the 5% FDR threshold. mRNAs showing a significant increase (∆TEtma∆∆_up) or decrease (∆TEtma∆∆_down) in relative TE in the tma∆∆ mutant versus WT cells at FDR < 0.05, are plotted in dark or light green circles, respectively. (E) Venn diagrams of overlaps between differentially expressed mRNAs (ΔmRNA) (FDR < 0.05 and log2ΔmRNA >1 or <-1) or differentially translated mRNAs (ΔTE, FDR < 0.05) between the tma∆∆ mutant versus WT cells, with arrows indicating increased (up) or decreased (down) mRNA or TE in the tma∆∆ mutant versus WT cells. p values were calculated using Fisher's exact test and were shown only for over-enrichment compared to expectation by chance.
Figure 1—figure supplement 1
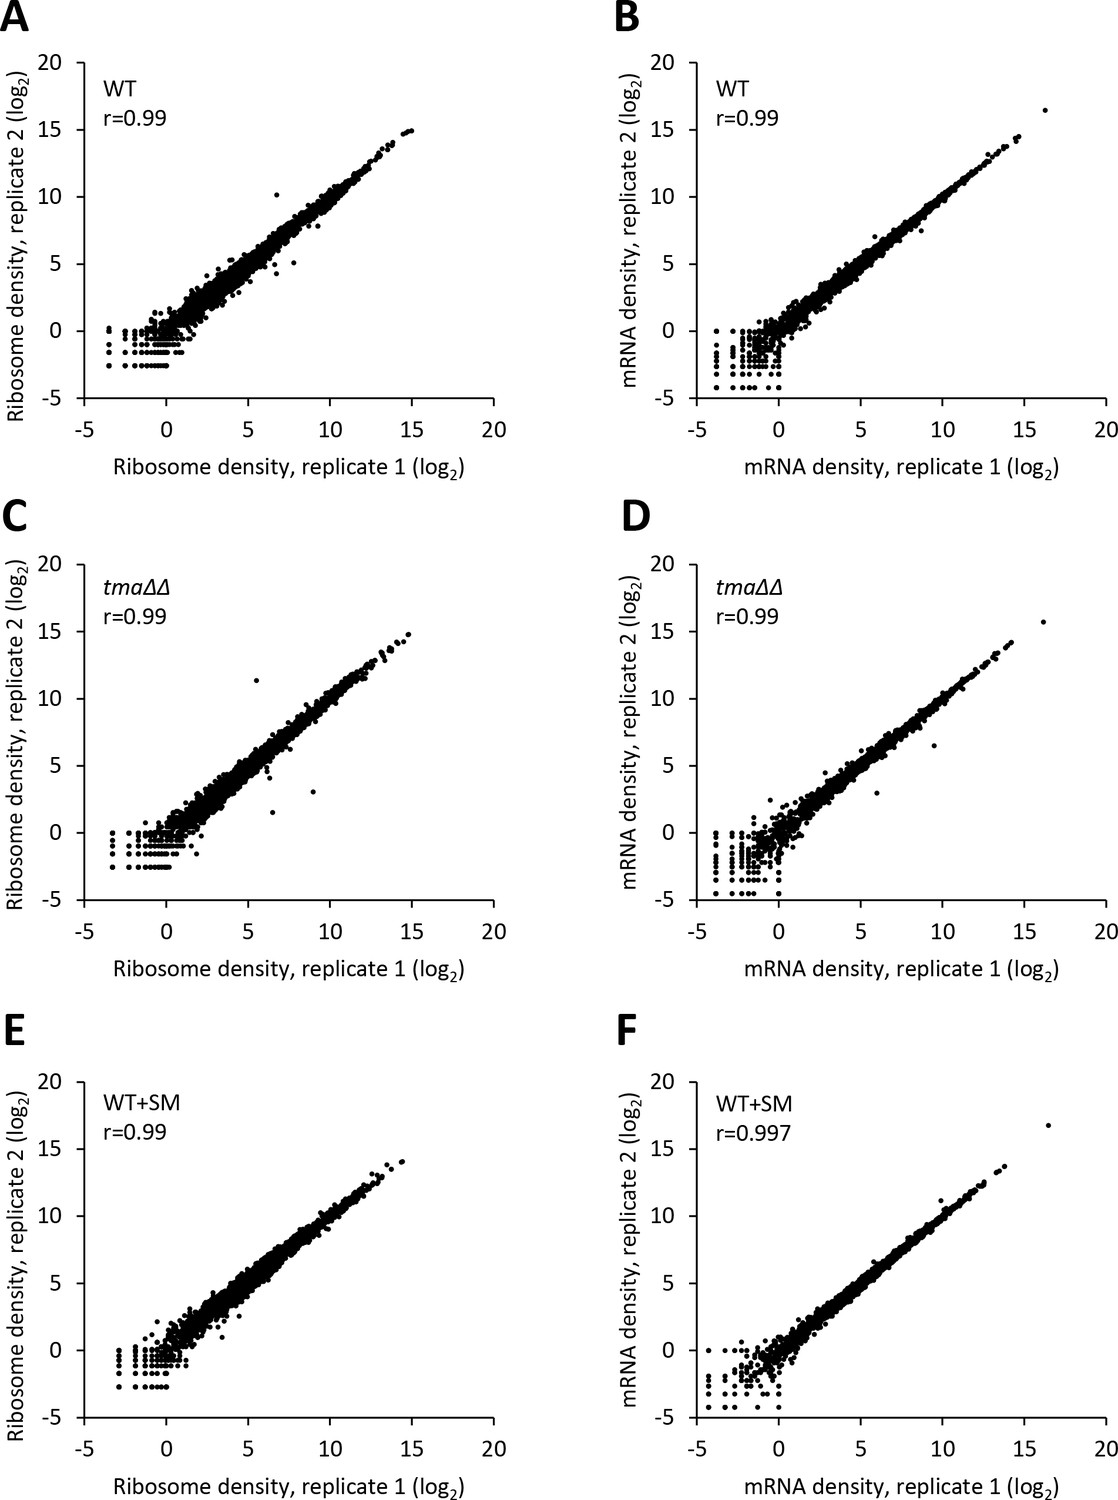
Reproducibility between biological replicates of ribosome footprint profiling and RNA-seq analyses for WT, the tma∆∆ mutant, and SM-treated WT.
(A–F) Scatterplots of normalized ribosome footprint (A, C, E) or mRNA (B, D, F) read densities for all expressed mRNAs for biological replicates of the WT (A, B), the tma∆∆ mutant (C, D) and SM-treated WT cells (E, F). The densities were plotted from the reads mapped to the CDS of each gene per million mapped reads in the individual library of a biological replicate. Pearson’s correlation coefficient (r) is indicated in each plot.
Figure 1—figure supplement 2
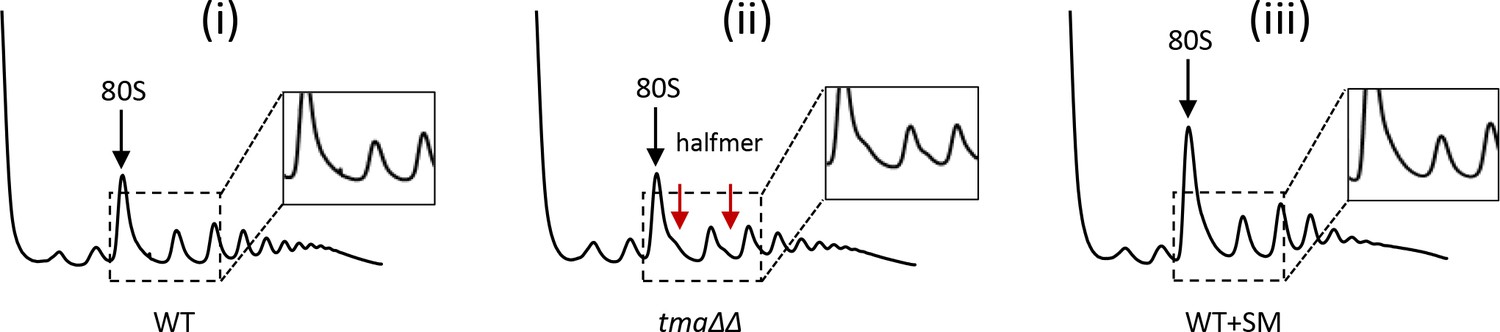
Polysome profiles of WT, the tma∆∆ mutant, and SM-treated WT under the growth conditions used for ribosome profiling and RNA-seq.
Polysome profiles of (i) WT, (ii)the tma∆∆ mutant and (iii) SM-treated WT cells. (i)-(ii) Cells were cultured in SC medium at 30°C to log-phase and treated with 50 μg/mL of CHX for 5 min before harvesting at 4°C. (iii) WT cells grown as in (i) except in SC-Ile/Val medium and treated with 1 µg/mL SM for 20 min before CHX addition. WCEs were resolved by sedimentation through sucrose gradients and scanned at 260 nm to visualize (from left to right) free 40S and 60S subunits, 80S monosomes, and polysomes. Tracings are magnified in the insets to show halfmer polysome positions (red arrows) in the tma∆∆ mutant.
Figure 2 with 2 supplements
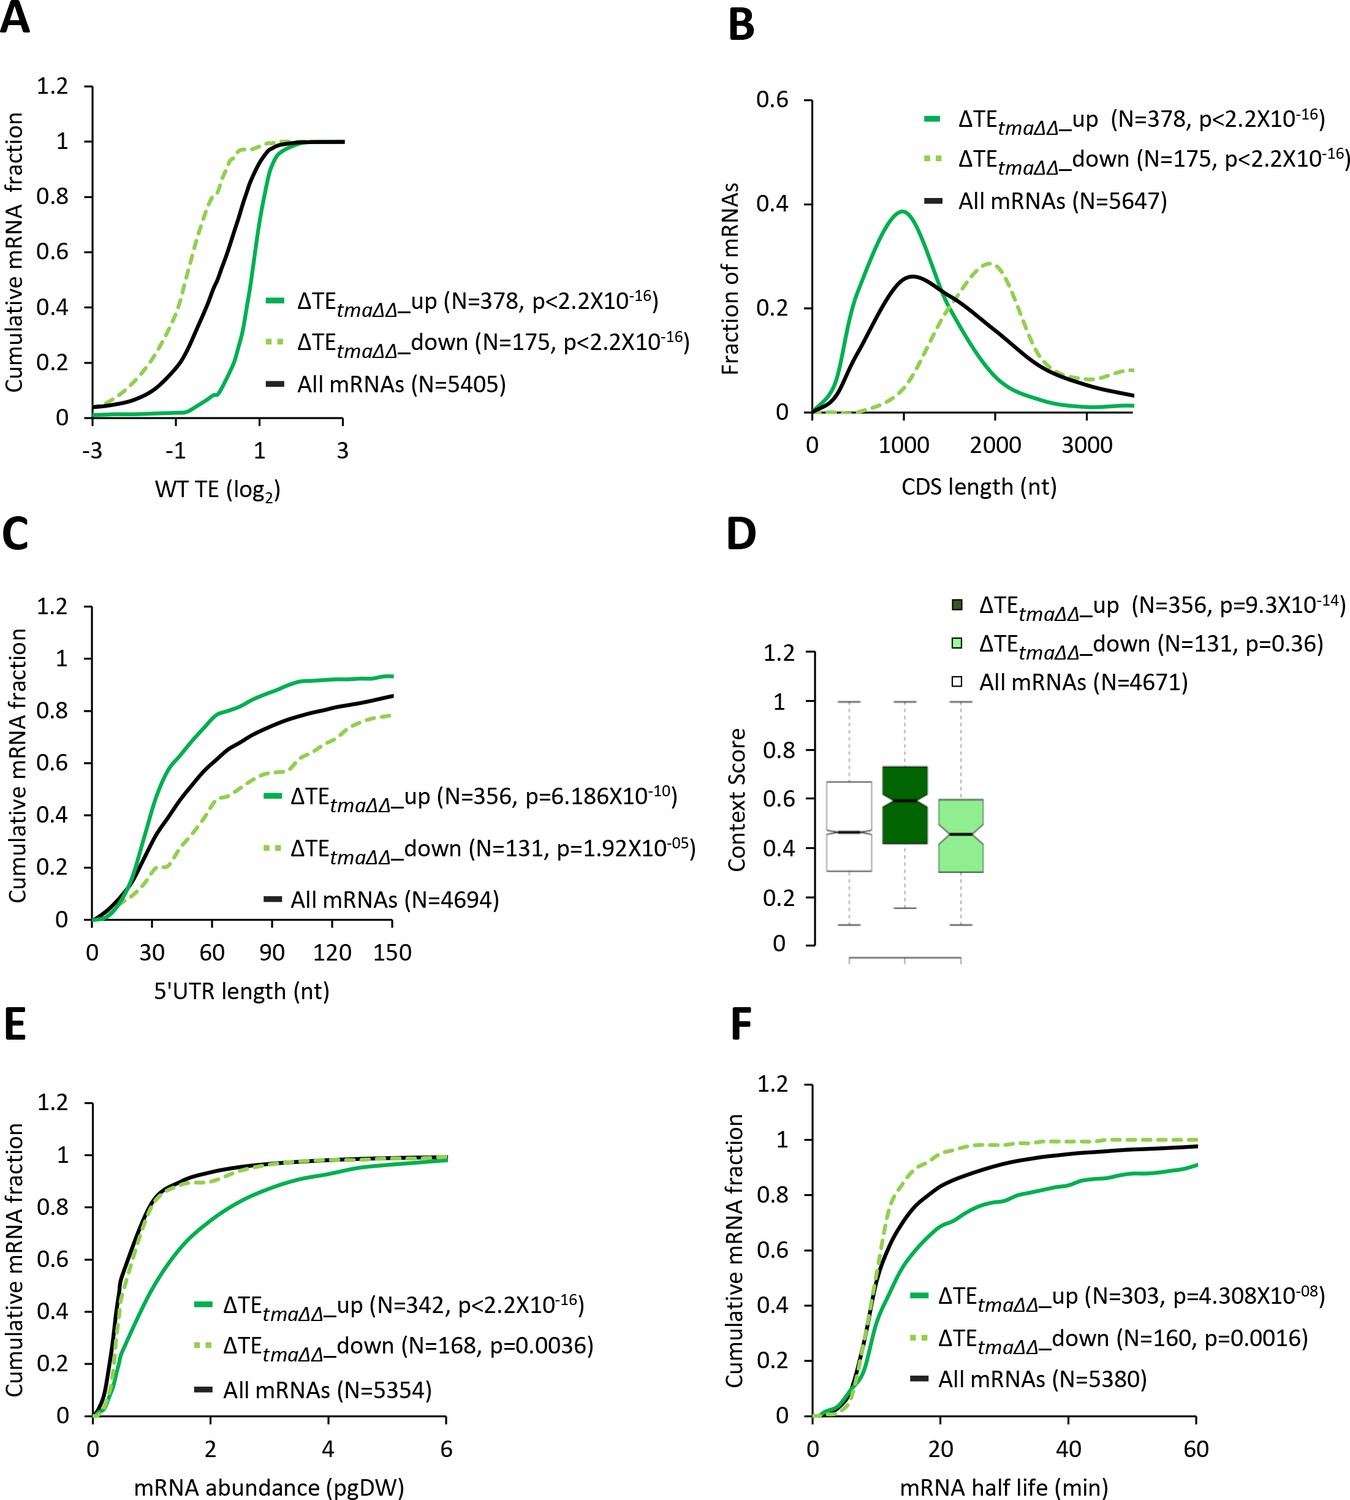
mRNAs with increased relative TEs in the tma∆∆ mutant exhibit multiple features of efficiently translated mRNAs.
(A, C, E, and F) Cumulative distribution function (CDF) plots of log2WT TE values (A), 5’UTR length (C), mRNA abundance in molecules per picogram of dry cellular weight (pgDW) (E), and mRNA half-life (F), for all mRNAs (black) and mRNAs exhibiting a significant increase (∆TEtma∆∆_up, solid dark green) or decrease (∆TEtma∆∆_down, dotted light green) in relative TE (at FDR < 0.05) in the tma∆∆ mutant versus WT cells. (B) Frequency distribution plots of CDS length for the groups of mRNAs examined in (A). p values in panels A-C and E-F were calculated using the Kolmogorov-Smirnov test. (D) Notched box plots of context scores calculated for positions −3 to −1 and +4 of main CDS AUGs for all mRNAs (white) and the ∆TEtma∆∆_up (dark green) and ∆TEtma∆∆_down (light green) mRNAs examined in (A). p values indicated in the panel were calculated using the Mann-Whitney U test. For this and all other box plots below, the upper and lower boxes contain the second and third quartiles and the band gives the median of the data. If the notches in two plots do not overlap, there is roughly 95% confidence that their medians are different.
Figure 2—figure supplement 1
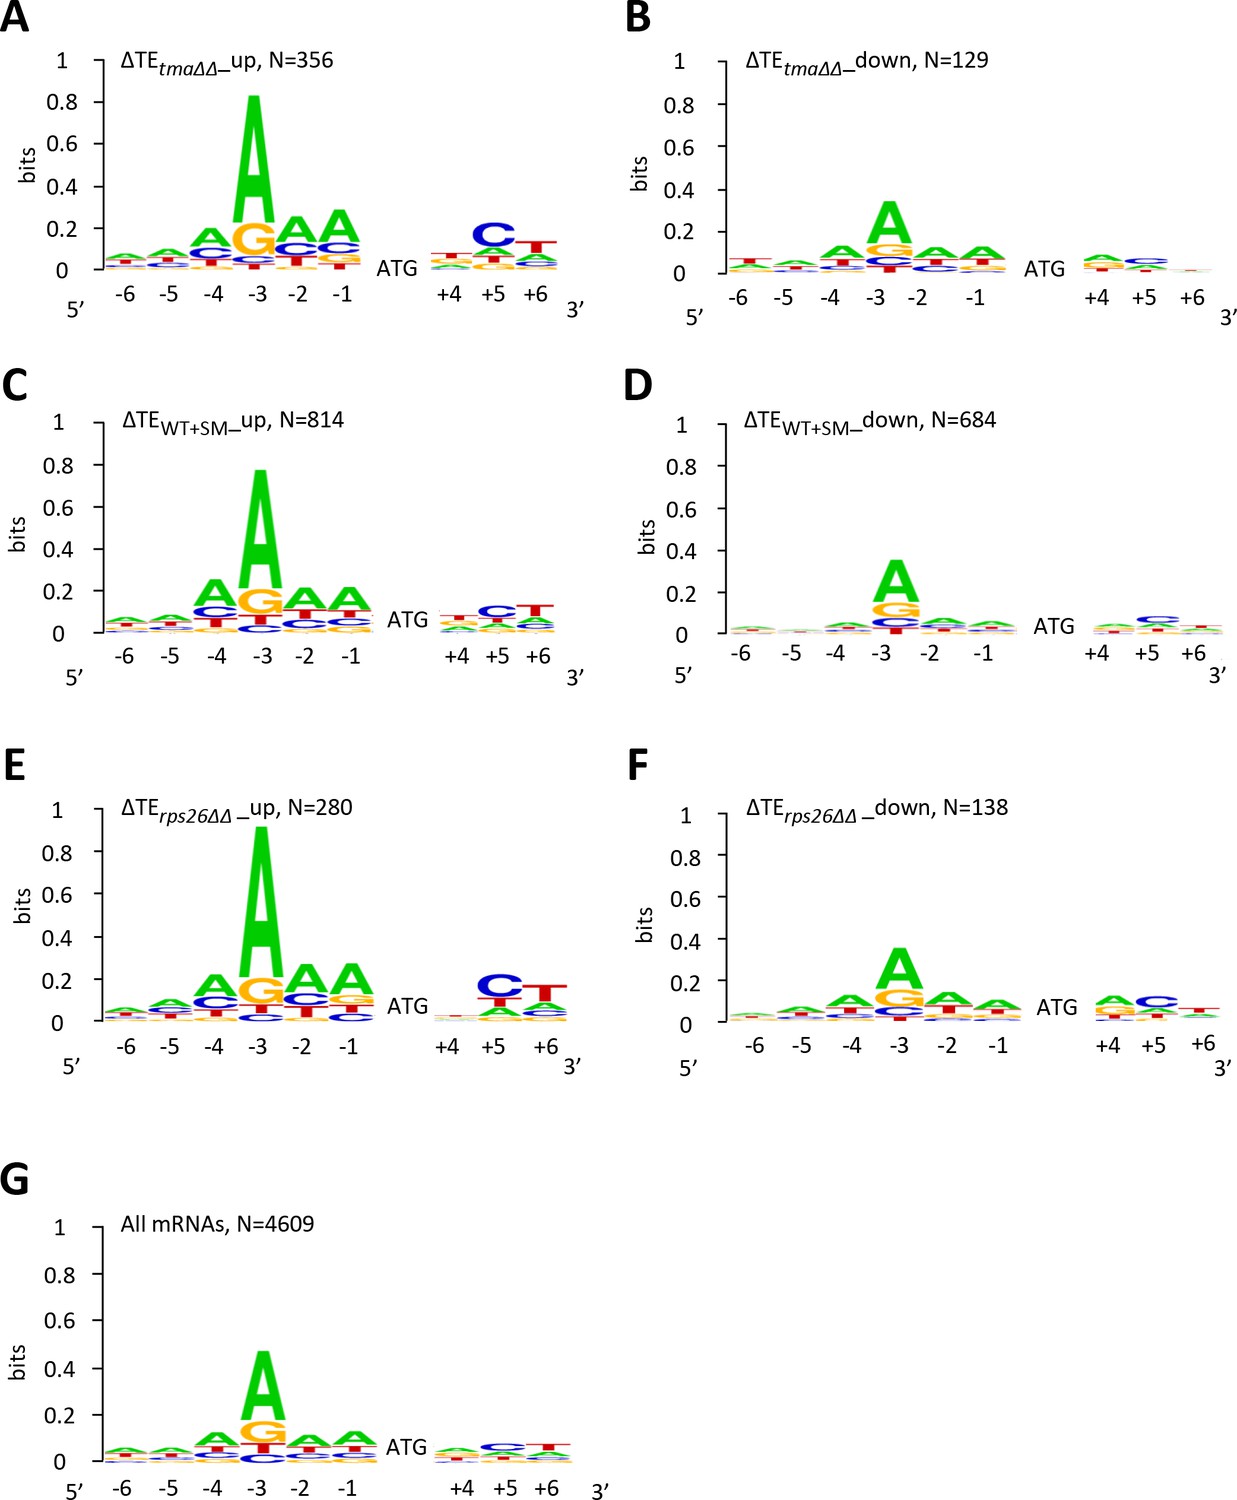
mRNAs showing relative TE increases or decreases in response to the tma∆∆ mutations, increased eIF2α phosphorylation in WT, or 40S subunit depletion by rps26∆∆ tend to exhibit good or poor Kozak context surrounding their AUG start codons, respectively, compared to all mRNAs.
(A–G) The Weblogo for positions −6 to −1 and +4 to +6 of the main CDS AUGs for mRNAs exhibiting a significant increase (∆TE_up) (A, C, E) or decrease (∆TE_down) (B, D, F) in relative TEs (at FDR < 0.05) in the tma∆∆ mutant versus WT cells (A–B), in SM-treated versus untreated WT cells (C–D), and in the rps26∆∆ mutant versus WT cells (E–F); or for all mRNAs (G). The DNA rather than RNA sequence is represented.
Figure 2—figure supplement 2
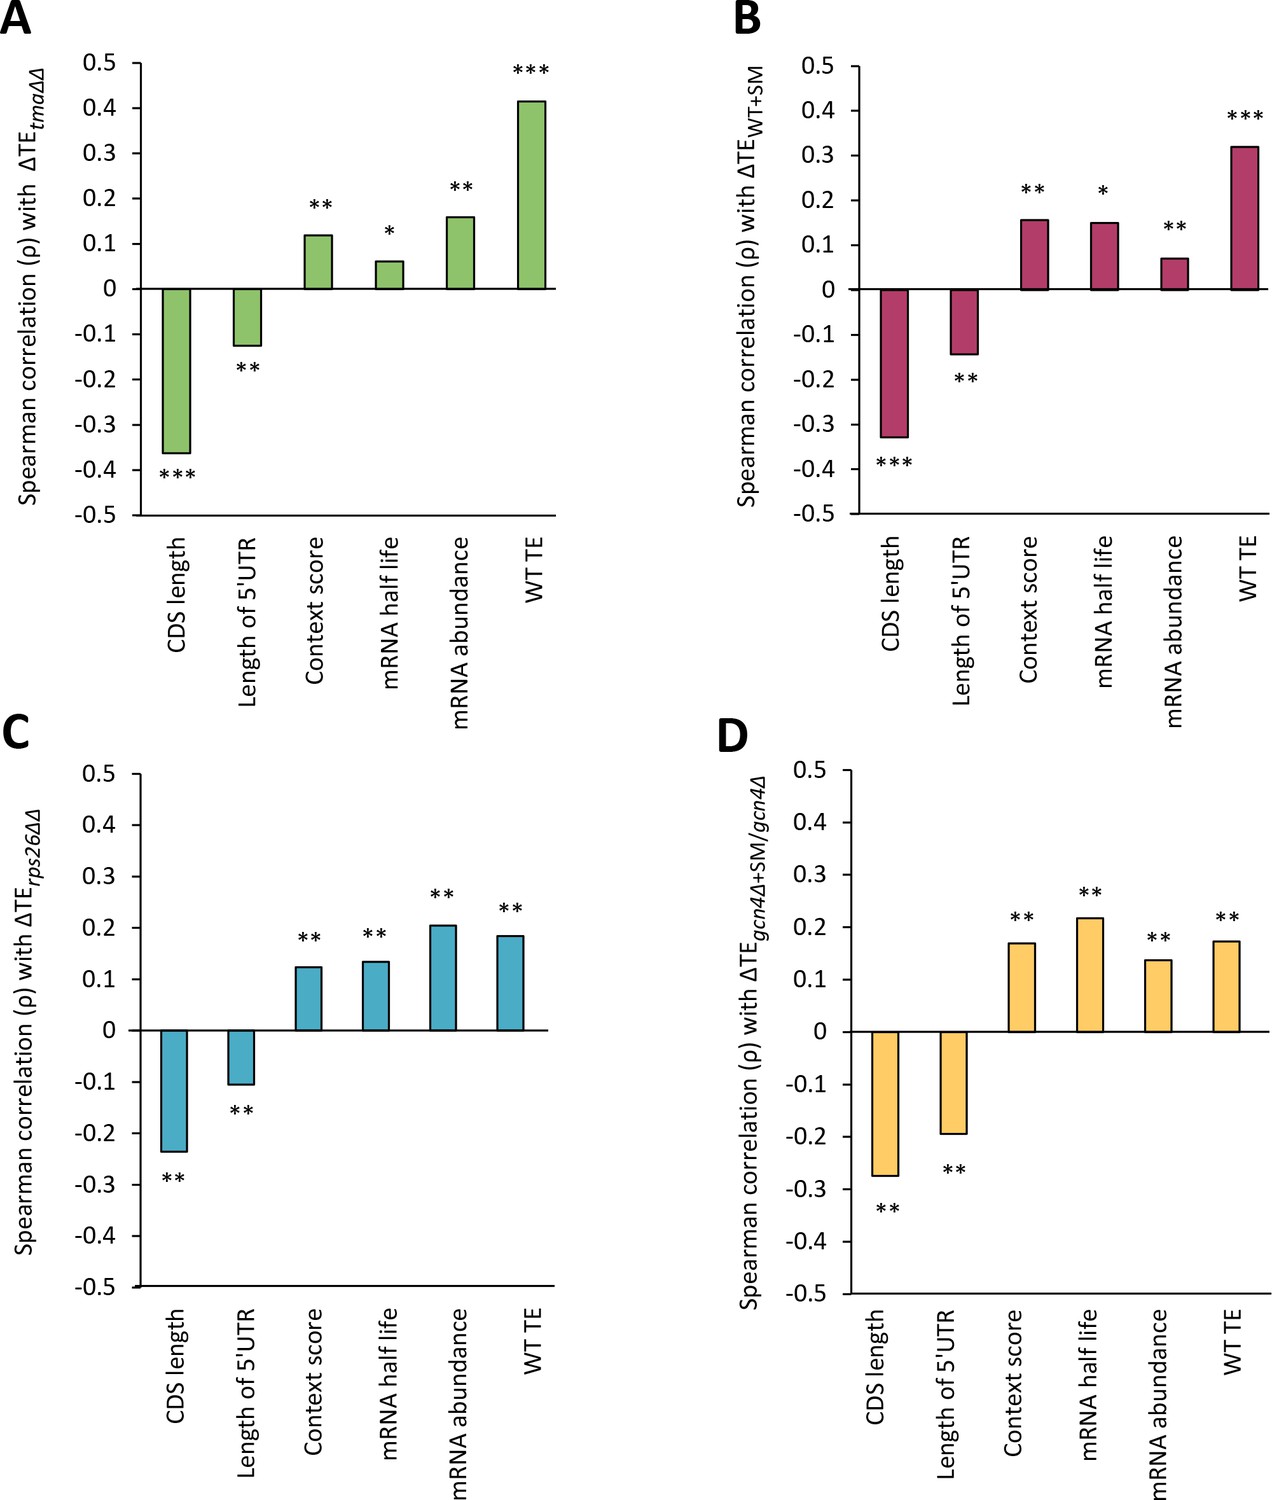
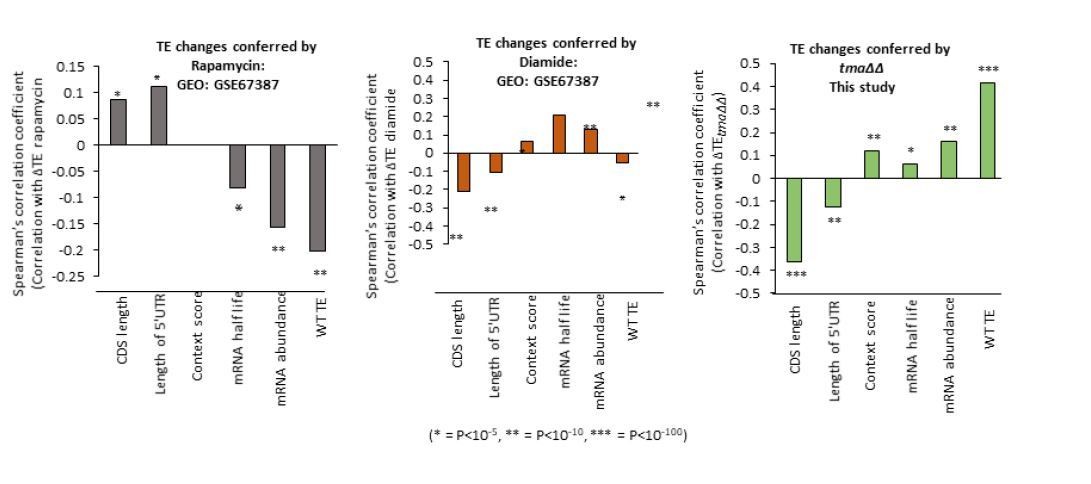
Correlations of genome-wide changes in relative TE evoked by different mutations or conditions with various mRNA attributes.
(A–D) Spearman correlation coefficients (ρ) were calculated for each mRNA feature listed on the x-axis and the relative ∆TE values for all expressed mRNAs for the tma∆∆ mutant versus WT cells (A), SM-treated versus untreated WT cells (B), the rps26∆∆ mutant versus WT cells (C), or SM-treated versus untreated gcn4∆ cells (D). (* = p value < 10−5, ** = p value < 10−10, *** = p value < 10−100).
Figure 3 with 1 supplement
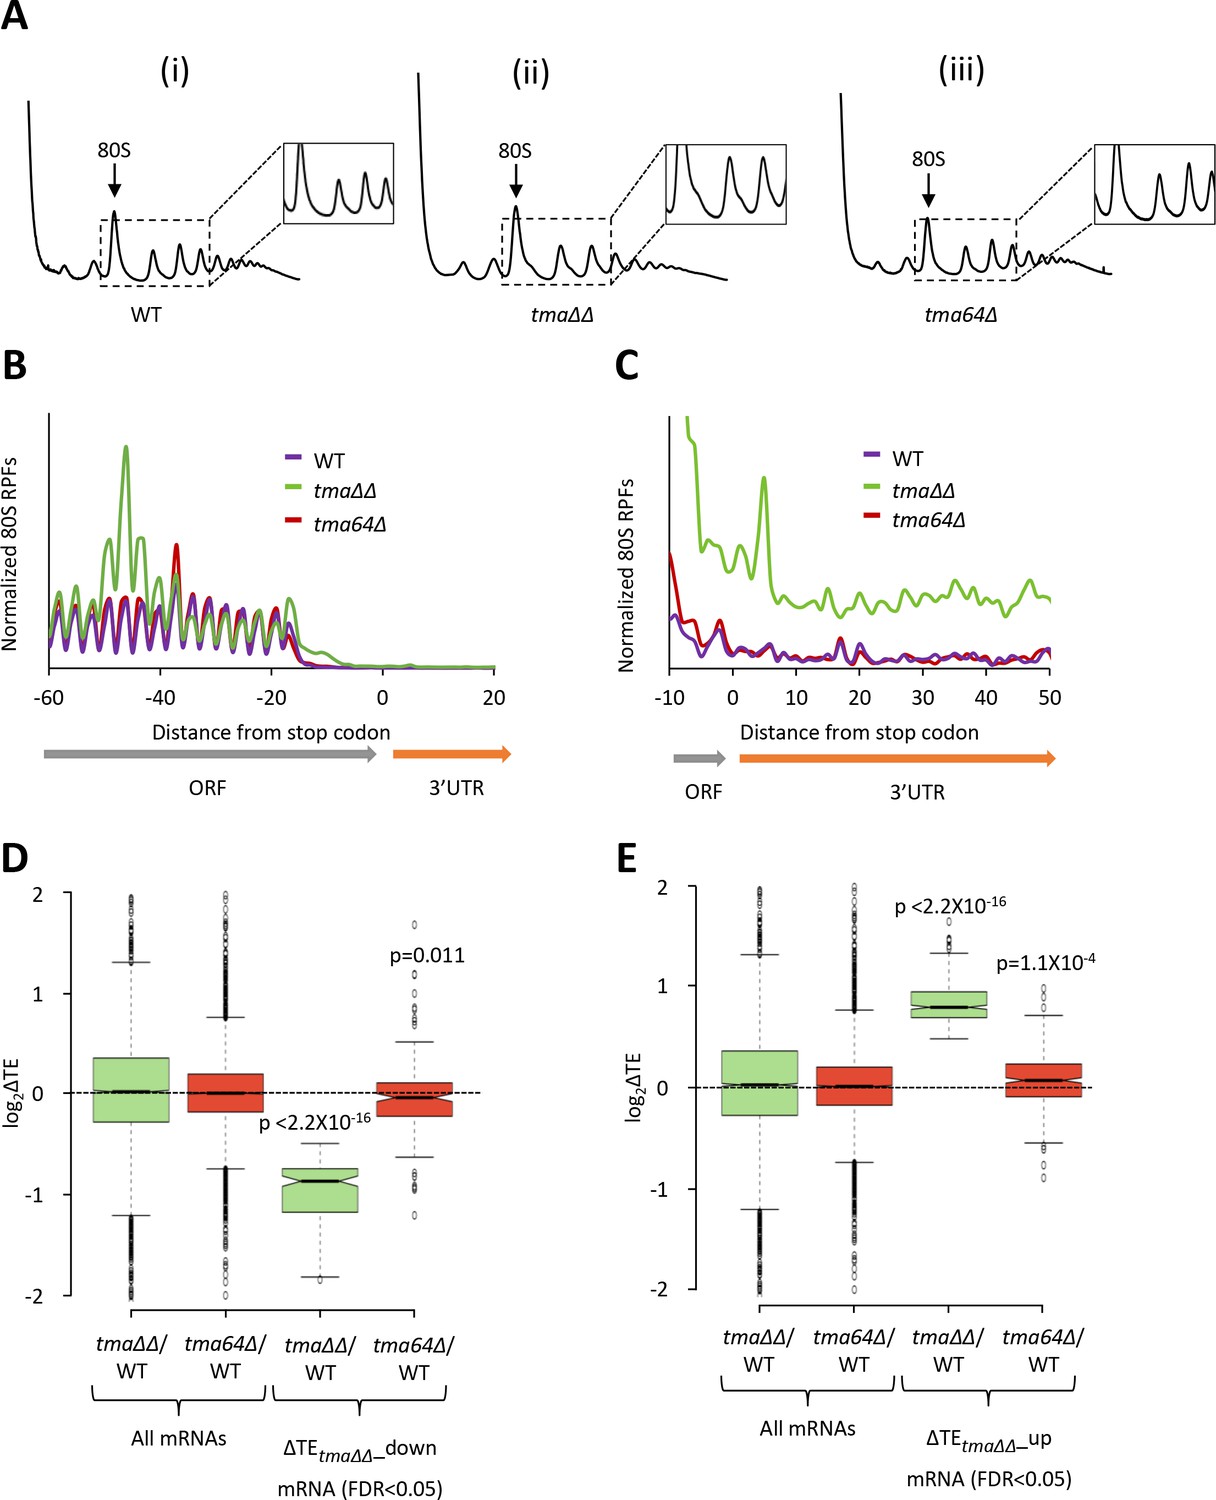
Relative TE changes in the tma∆∆ mutant do not result from elimination of eIF2D by the tma64∆ mutation.
(A) Polysome profiles of WT strain BY4741 (i), the tma∆∆ mutant H4520 (ii), and the tma64∆ mutant 4051 (iii). Cells were cultured in SC medium at 30°C to log-phase and treated with 50 μg/mL of CHX for 5 min before harvesting at 4°C. WCEs were resolved by sedimentation through sucrose gradients and scanned at 260 nm to visualize (from left to right) free 40S and 60S subunits, 80S monosomes, and polysomes. Tracings are magnified in the insets to show halfmer polysome positions in the tma∆∆ mutant (ii). (The polysome profile in (ii) was previously shown in Figure 1C (ii)). (B) Results from ribosome profiling showing the normalized 80S ribosome reads from all mRNAs aligned with respect to their stop codons for the WT (purple), the tma∆∆ mutant (green), and the tma64∆ mutant (red) described in (A). (Data for the tma∆∆ mutant was plotted previously in Figure 1A). (C) Expanded view of normalized 80S reads from all mRNAs shown in (B) for the first 50 nt of the 3’UTRs. (D–E) Notched box plots showing translation changes (log2(ΔTE)) in the indicated mutants versus WT for all mRNAs or for mRNAs exhibiting a significant decrease (∆TEtma∆∆_down, N = 175, panel D) or increase (∆TEtma∆∆_up, N = 378, panel E) in relative TE in the tma∆∆ mutant versus WT cells at a 5% FDR threshold. A few outliers were omitted from the plots to expand the y-axis scale. p values indicated in panels (D–E) were calculated using the Mann-Whitney U test for the differences between the TE changes for the indicated groups of mRNAs versus all mRNAs.
Figure 3—figure supplement 1
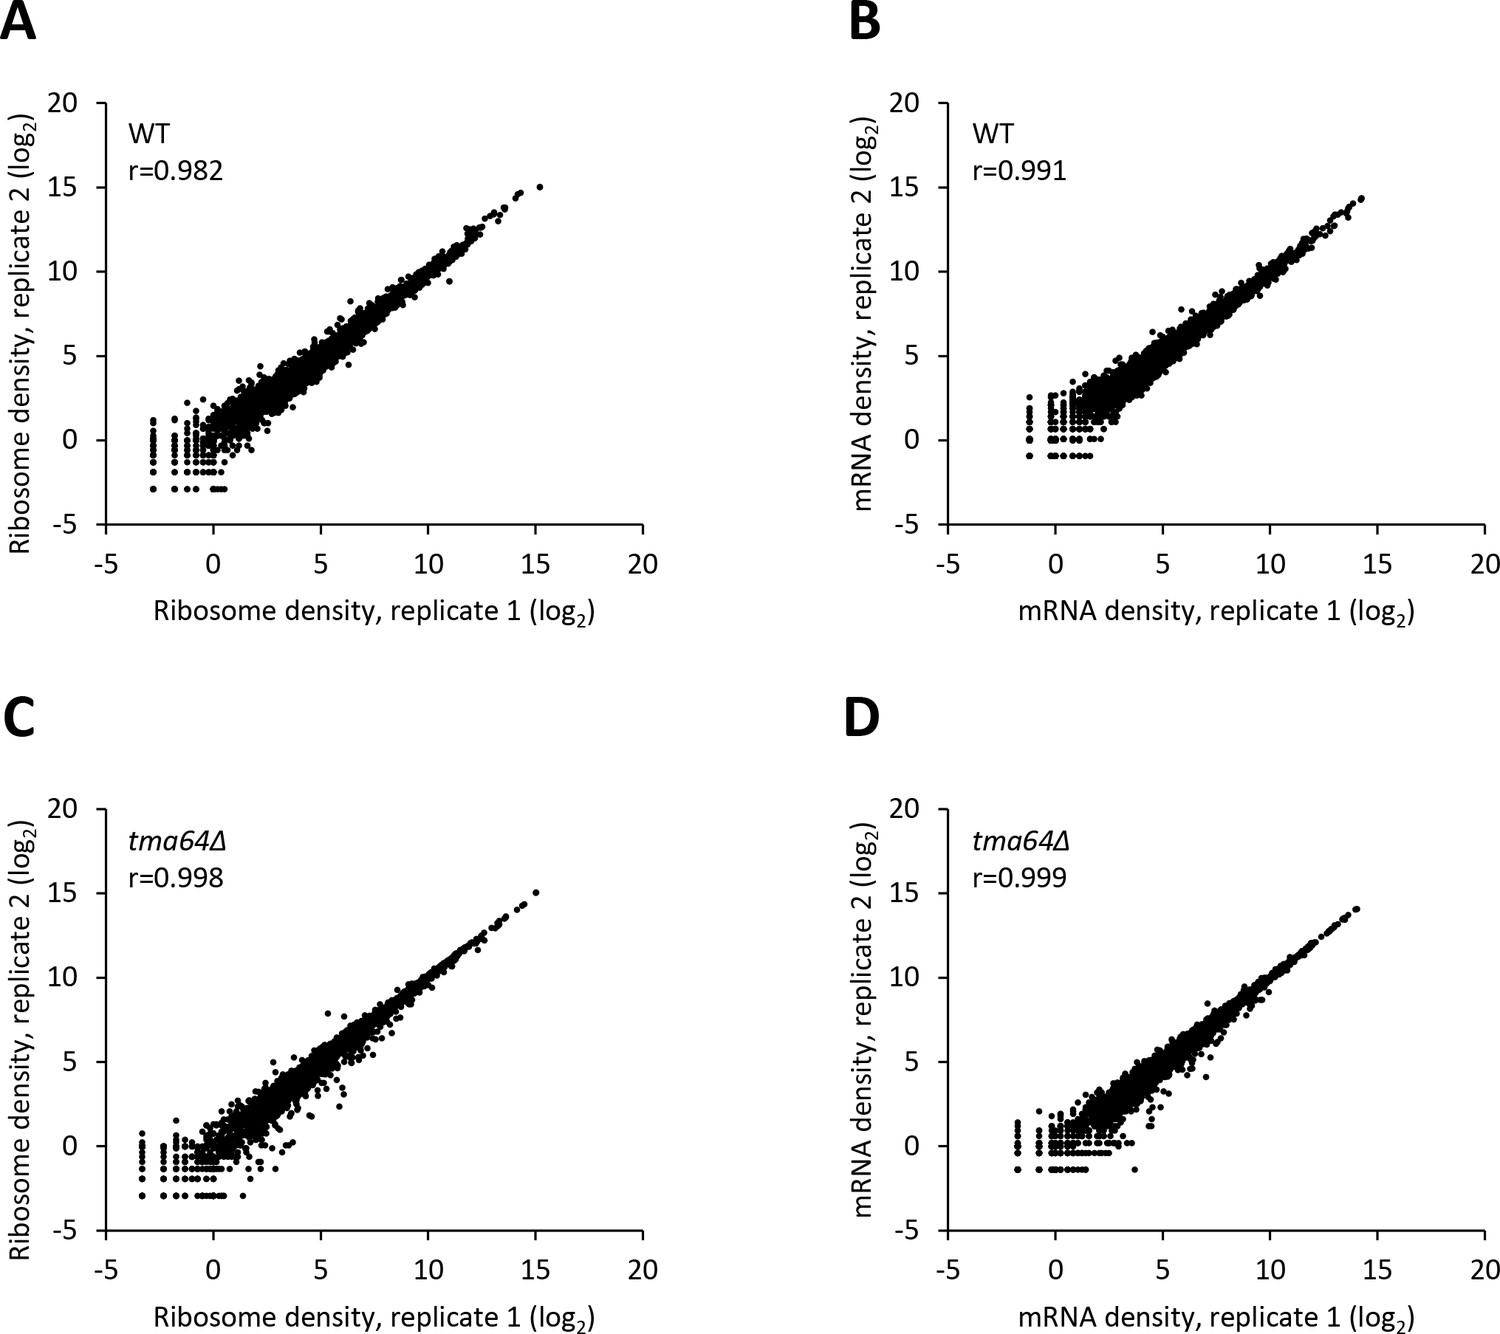
Reproducibility between biological replicates of ribosome footprint profiling and RNA-seq analyses for WT and the tma64∆ mutant.
(A–D) Scatterplots of normalized ribosome footprint (A, C) or mRNA (B, D) read densities for all expressed mRNAs for biological replicates of the WT (A, B) and the tma64∆ mutant (C, D). The densities were plotted from the reads mapped to the CDS of each gene per million mapped reads in the individual library of a biological replicate. Pearson’s correlation coefficient (r) for the plotted genes is indicated in each plot.
Figure 4 with 6 supplements
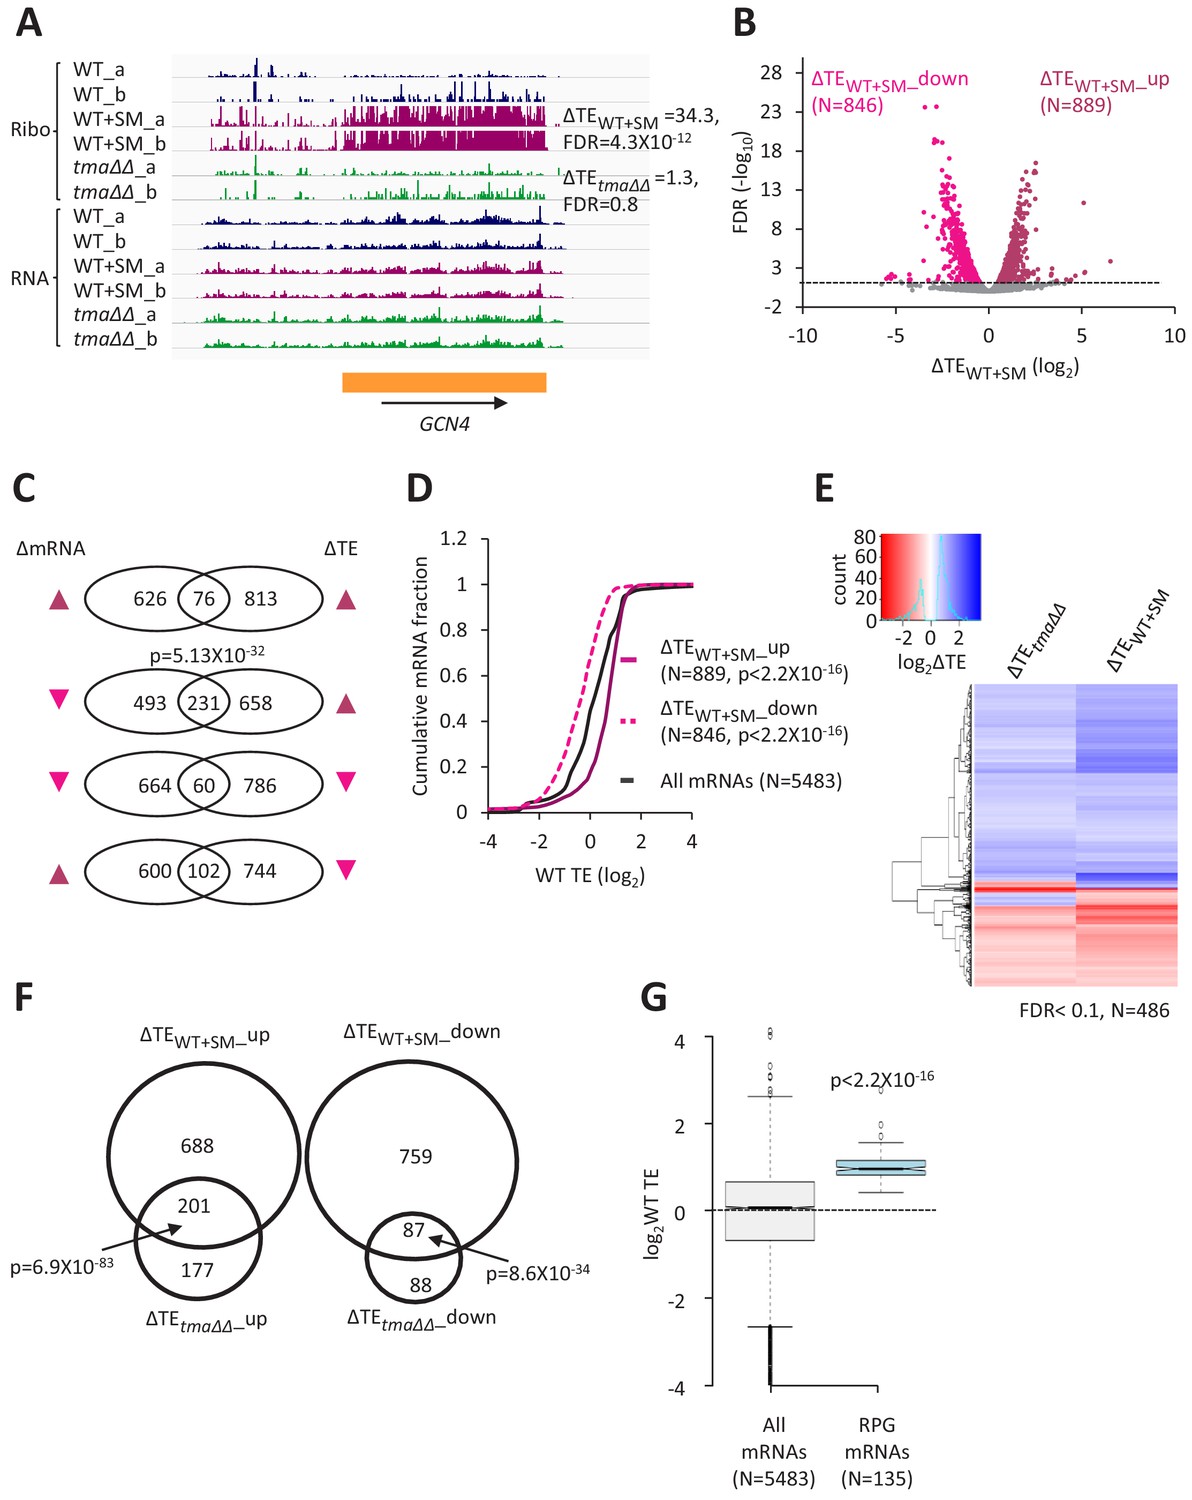
Relative TE changes evoked by increased eIF2α phosphorylation overlap substantially with those conferred by deletion of TMA64/TMA20.
(A) Genome browser view of ribosome profiling data for GCN4 mRNA, showing RPF reads (Ribo) and mRNA reads (RNA) mapping across the transcription unit in WT, with or without SM treatment, and in the tma∆∆ mutant, showing two replicates (a and b) for each genotype/condition. The main CDS is shown schematically (orange). The calculated ∆TEWT+SM and ∆TEtma∆∆ values are shown. (B) Volcano plot showing log2 ratios of relative TEs in SM-treated versus untreated WT cells (∆TEWT+SM values) for each mRNA (x-axis) versus negative log10 of the FDR for the ∆TEWT+SM changes determined by DESeq2 analysis of the 5483 mRNAs with evidence of translation (y-axis). The dotted line marks the 5% FDR threshold. mRNAs showing a significant increase (∆TEWT+SM_up) or decrease (∆TEWT+SM_down) in relative TE in SM-treated versus untreated WT cells, at FDR < 0.05, are plotted in dark or light pink circles, respectively. (C) Venn diagrams of overlaps between differentially expressed mRNAs (ΔmRNA) (FDR < 0.05 and log2ΔmRNA >1 or <-1) or differentially translated mRNAs (ΔTE, FDR < 0.05) in SM-treated versus untreated WT cells, with arrows indicating increased (up) or decreased (down) mRNA or TE in SM-treated versus untreated WT cells. p values were calculated using the Fisher’s exact test and were shown only for over-enrichment compared to expectation by chance. (D) Cumulative distribution function (CDF) plots of log2WT TE values for all mRNAs (black) and mRNAs exhibiting a significant increase (∆TEWT+SM_up, solid dark pink) or decrease (∆TEWT+SM_down, dotted light pink) in relative TE (at FDR < 0.05) in SM-treated versus untreated WT cells. p values were calculated using the Kolmogorov-Smirnov test. (E) Hierarchical clustering analysis of log2TE changes observed for 486 mRNAs that exhibit significant TE changes in the tma∆∆ mutant versus WT cells, and also in SM-treated versus untreated WT cells, at FDR < 0.1 for both comparisons. The color scale for log2ΔTE values ranges from 2.5 (dark blue) to −3.5 (dark red). One mRNA (YPR146C) with ∆TEtma∆∆ >10 fold and ∆TEWT+SM <10 fold was excluded to enhance the color differences among the remaining mRNAs analyzed in the heatmap. (F) Venn diagrams of overlaps between the groups of mRNAs defined in Figure 1D and B showing significantly increased or decreased TEs conferred by SM treatment of WT cells or by the tma∆∆ mutations. p values were calculated using the Fisher's exact test. (G) Notched box plots showing the log2WT TEs of the group of 135 RPG mRNAs or all expressed mRNAs. A few outliers were omitted from the plots to expand the y-axis scale. The p value was calculated using the Mann-Whitney U test.
Figure 4—figure supplement 1
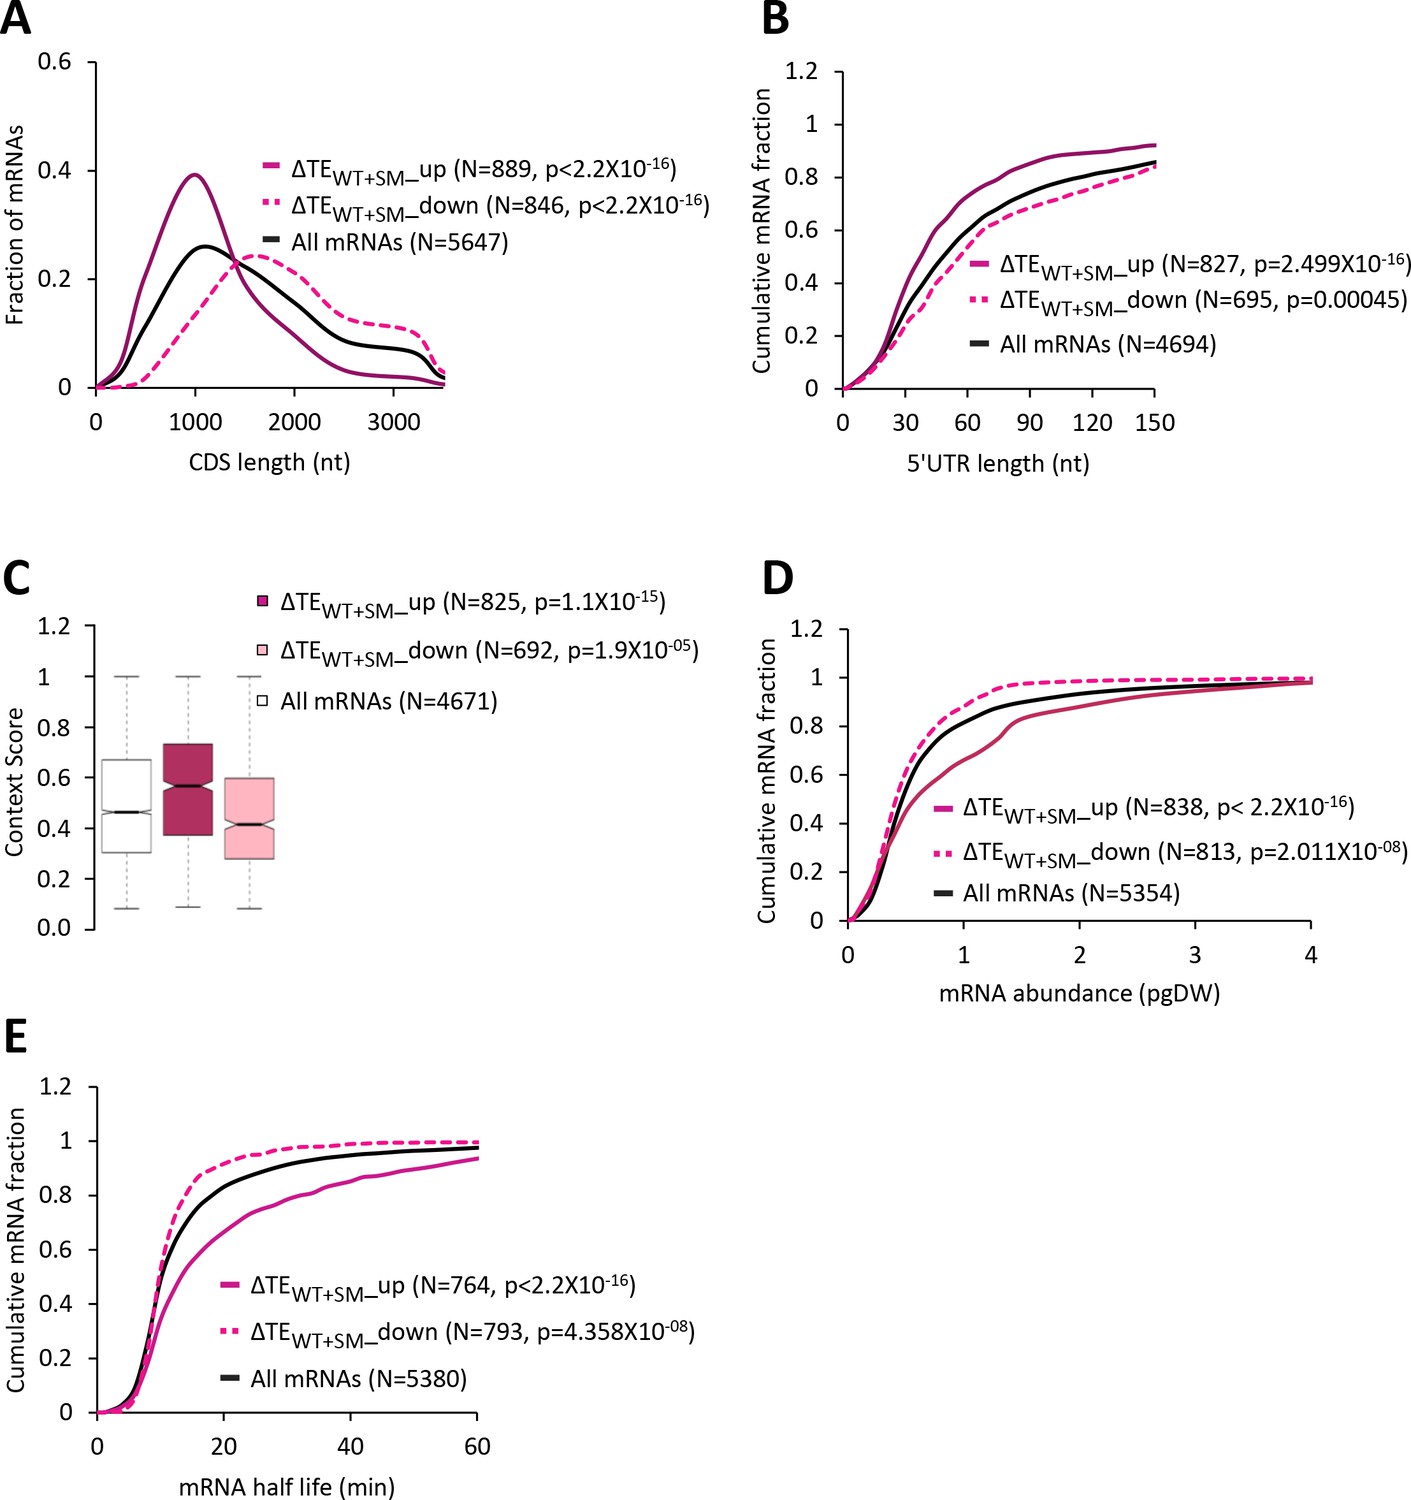
Increased eIF2α phosphorylation in WT upregulates the relative TEs of mRNAs with attributes similar to mRNAs exhibiting relative TE increases in response to the tma∆∆ mutations.
(A) Frequency distribution plots of CDS length for all mRNAs (black) and mRNAs exhibiting a significant increase (∆TEWT+SM_up, solid dark pink) or decrease (∆TEWT+SM_down, dotted light pink) in relative TE (at FDR < 0.05) in SM-treated versus untreated WT cells. (B, D and E) Cumulative distribution function (CDF) plots of 5’UTR length (B), mRNA abundance in molecules per picogram of dry cellular weight (pgDW) (D), and mRNA half-life (E), for the groups of mRNAs examined in (A). p values in panels A-B and D-E were calculated using the Kolmogorov-Smirnov test. (C) Notched box plots of context scores calculated for positions −3 to −1 and +4 of the main CDS AUGs for all mRNAs (white) and the ∆TEWT+SM_up (dark pink) and ∆TEWT+SM_down (light pink) groups of mRNAs examined in (A). p values were calculated using the Mann-Whitney U test.
Figure 4—figure supplement 2
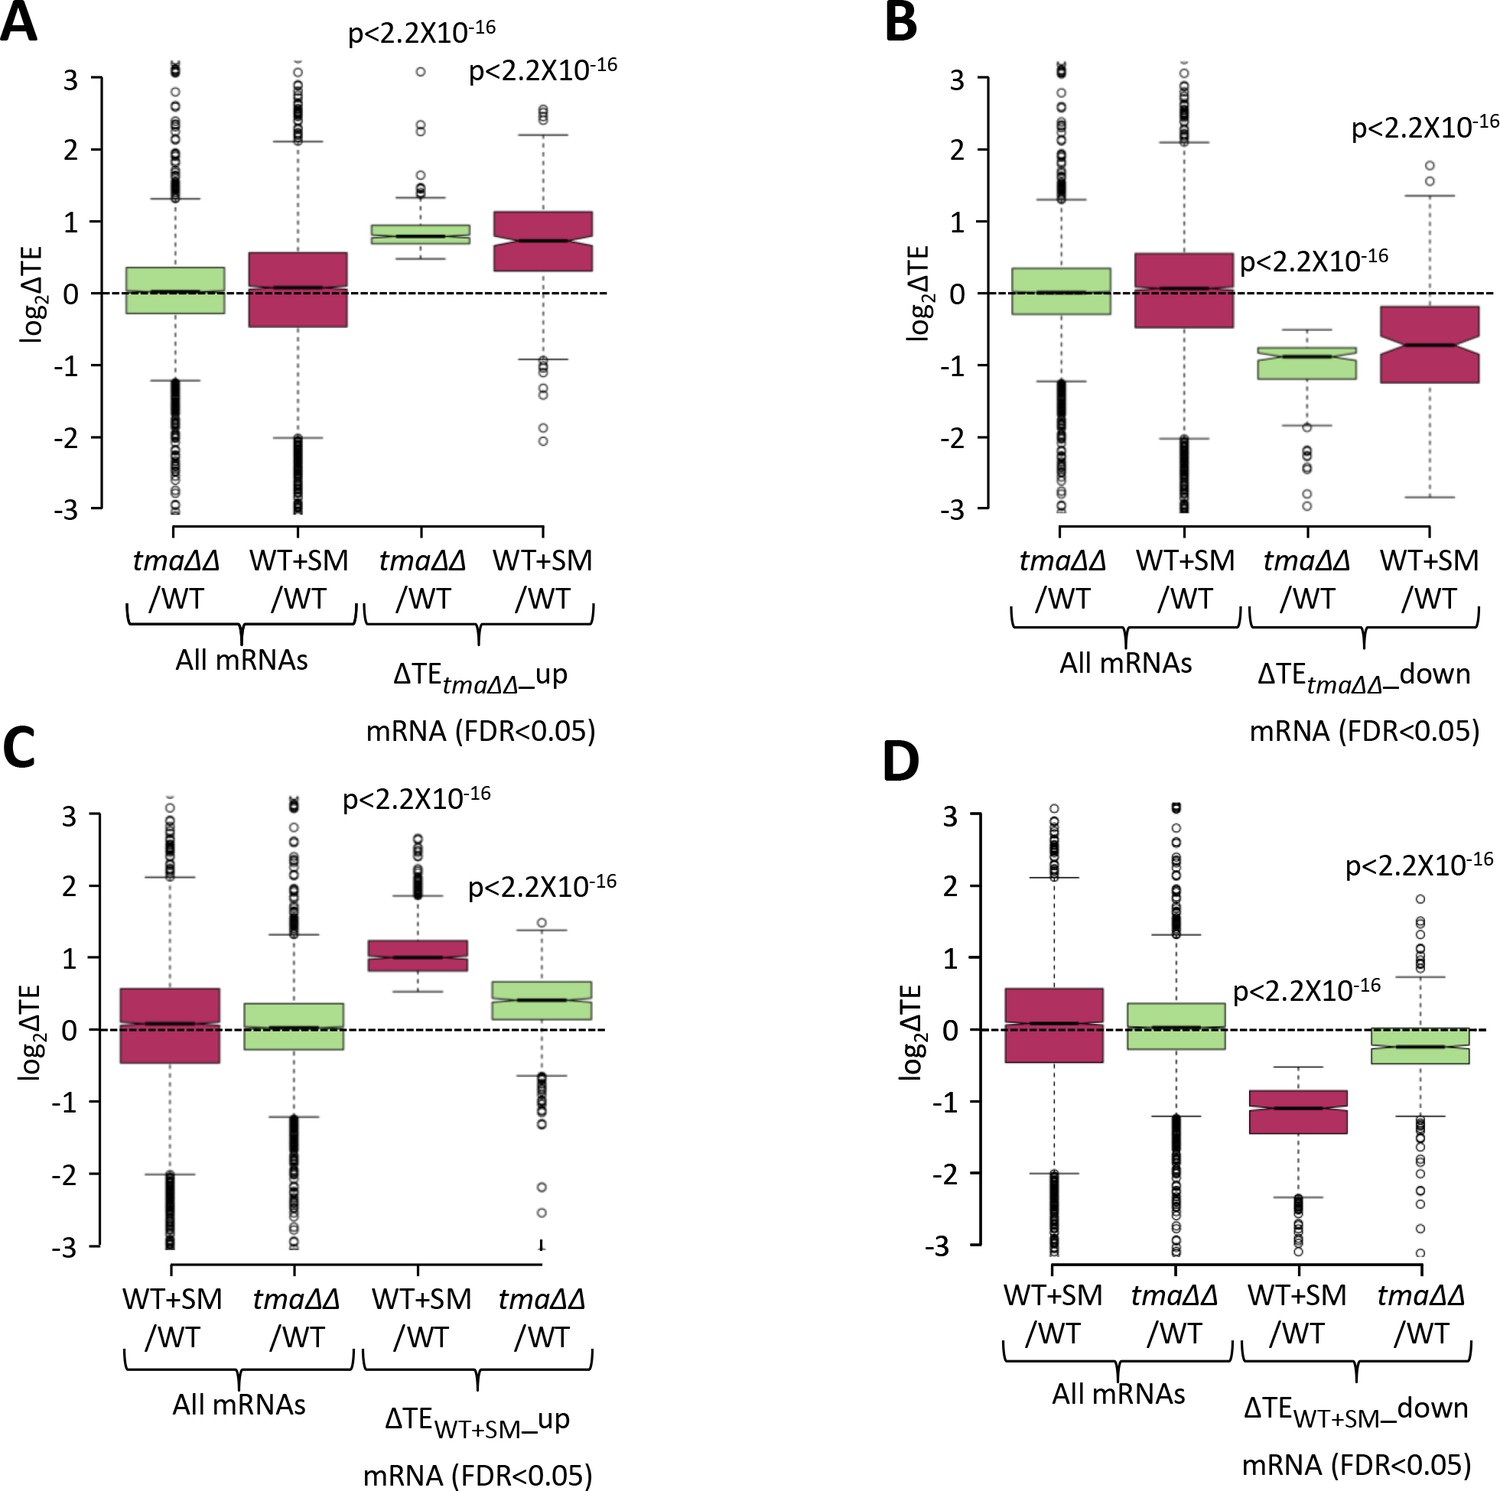
Relative TE changes evoked by increased eIF2α phosphorylation in WT are broadly similar to those conferred by the tma∆∆ mutations.
(A–B) Notched box plots showing the relative TE changes (log2ΔTE) in the indicated strains for all mRNAs or the groups of mRNAs showing significant TE increases (∆TEtma∆∆_up, N = 378, panel A) or decreases (∆TEtma∆∆_down, N = 175, panel B) in the tma∆∆ mutant versus WT cells at a 5% FDR threshold. (C–D) Notched box plots showing the relative TE changes (log2ΔTE) in the indicated strains for all mRNAs or the groups of mRNAs with significant TE increases (∆TEWT+SM_up, N = 889, panel C) or decreases (∆TEWT+SM_down, N = 846, panel D) in SM-treated versus untreated WT cells at a 5% FDR threshold. p values in panels (A–D) were calculated using the Mann-Whitney U test for the differences between all mRNAs and the indicated groups of mRNAs showing TE changes in the respective datasets.
Figure 4—figure supplement 3
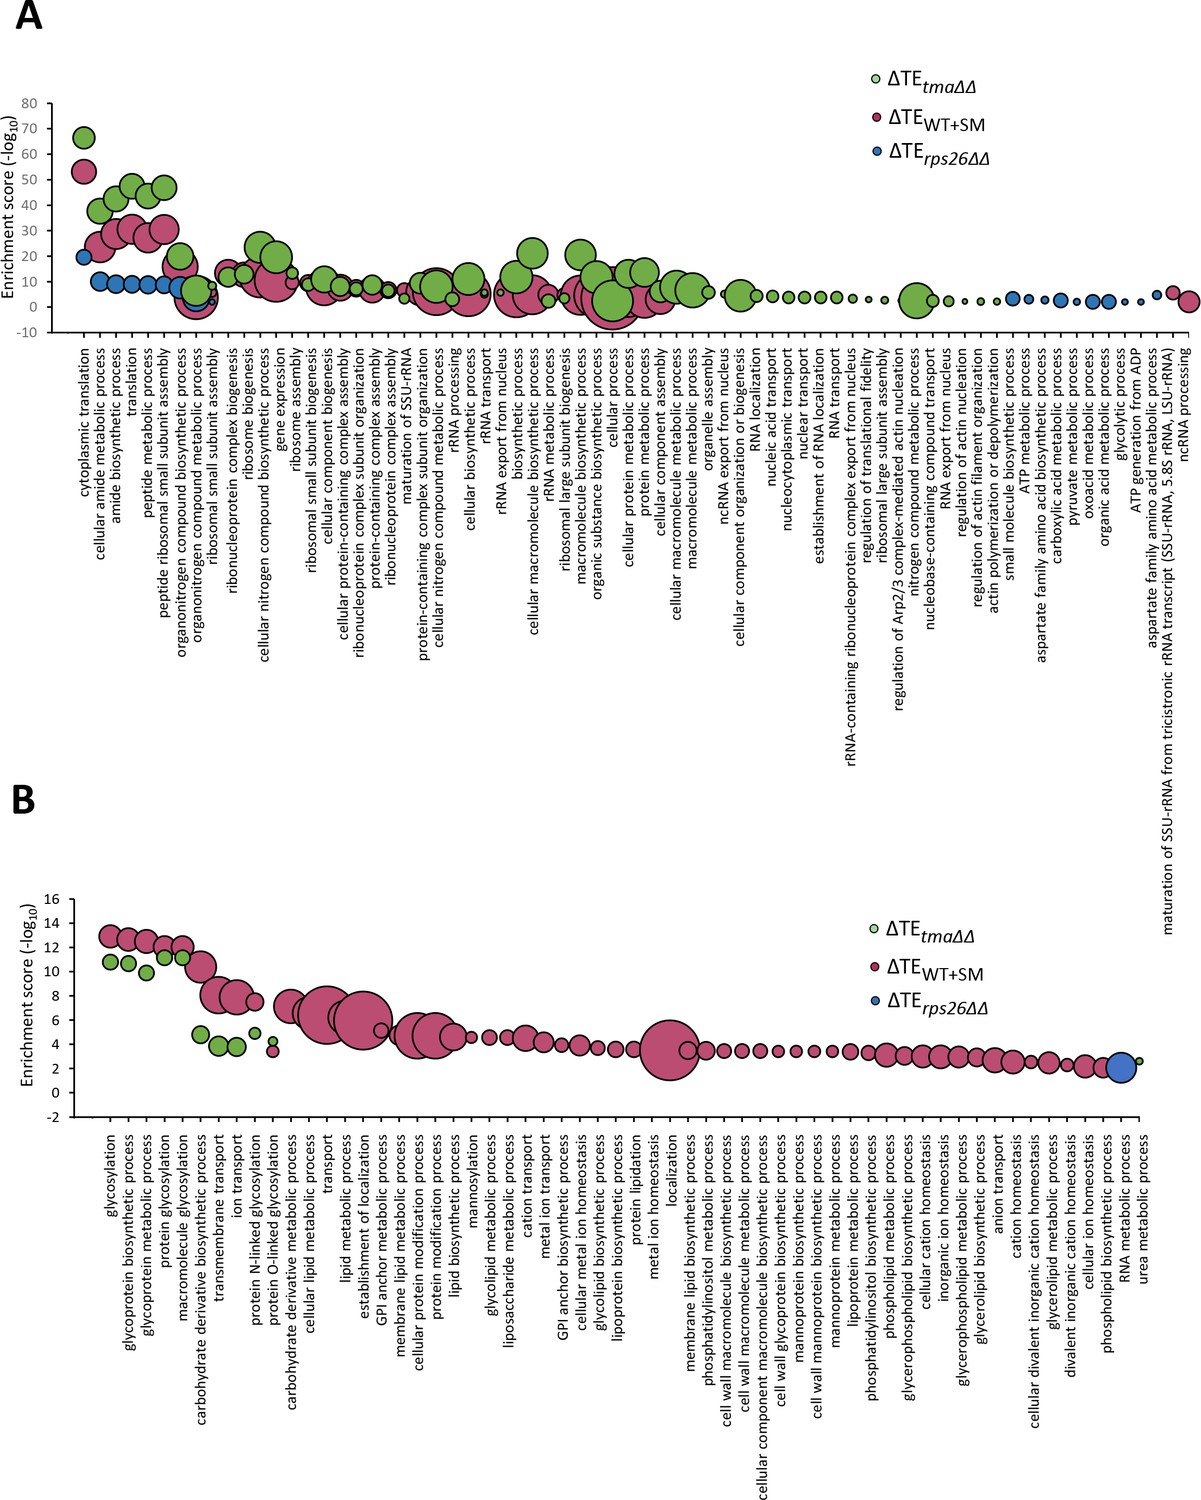
Gene ontology (GO) analysis of relative TE changes evoked by the tma∆∆ mutations, increased eIF2α phosphorylation in WT, or the rps26∆∆ mutations.
(A–B) Bubble plots representing significantly enriched GO terms (FDR < 0.01) in a biological process for genes whose cognate mRNAs show significantly upregulated (A) or down-regulated (B) changes in relative TE in the tma∆∆ mutant versus WT cells (green), in SM-treated versus untreated WT cells (maroon), and in the rps26∆∆ mutant versus WT cells (blue), at FDR < 0.05. The negative log10 of the adjusted p values (FDR) for the GO enrichments are given on the y-axis. The size of each bubble represents the number of genes in the GO term.
Figure 4—figure supplement 4
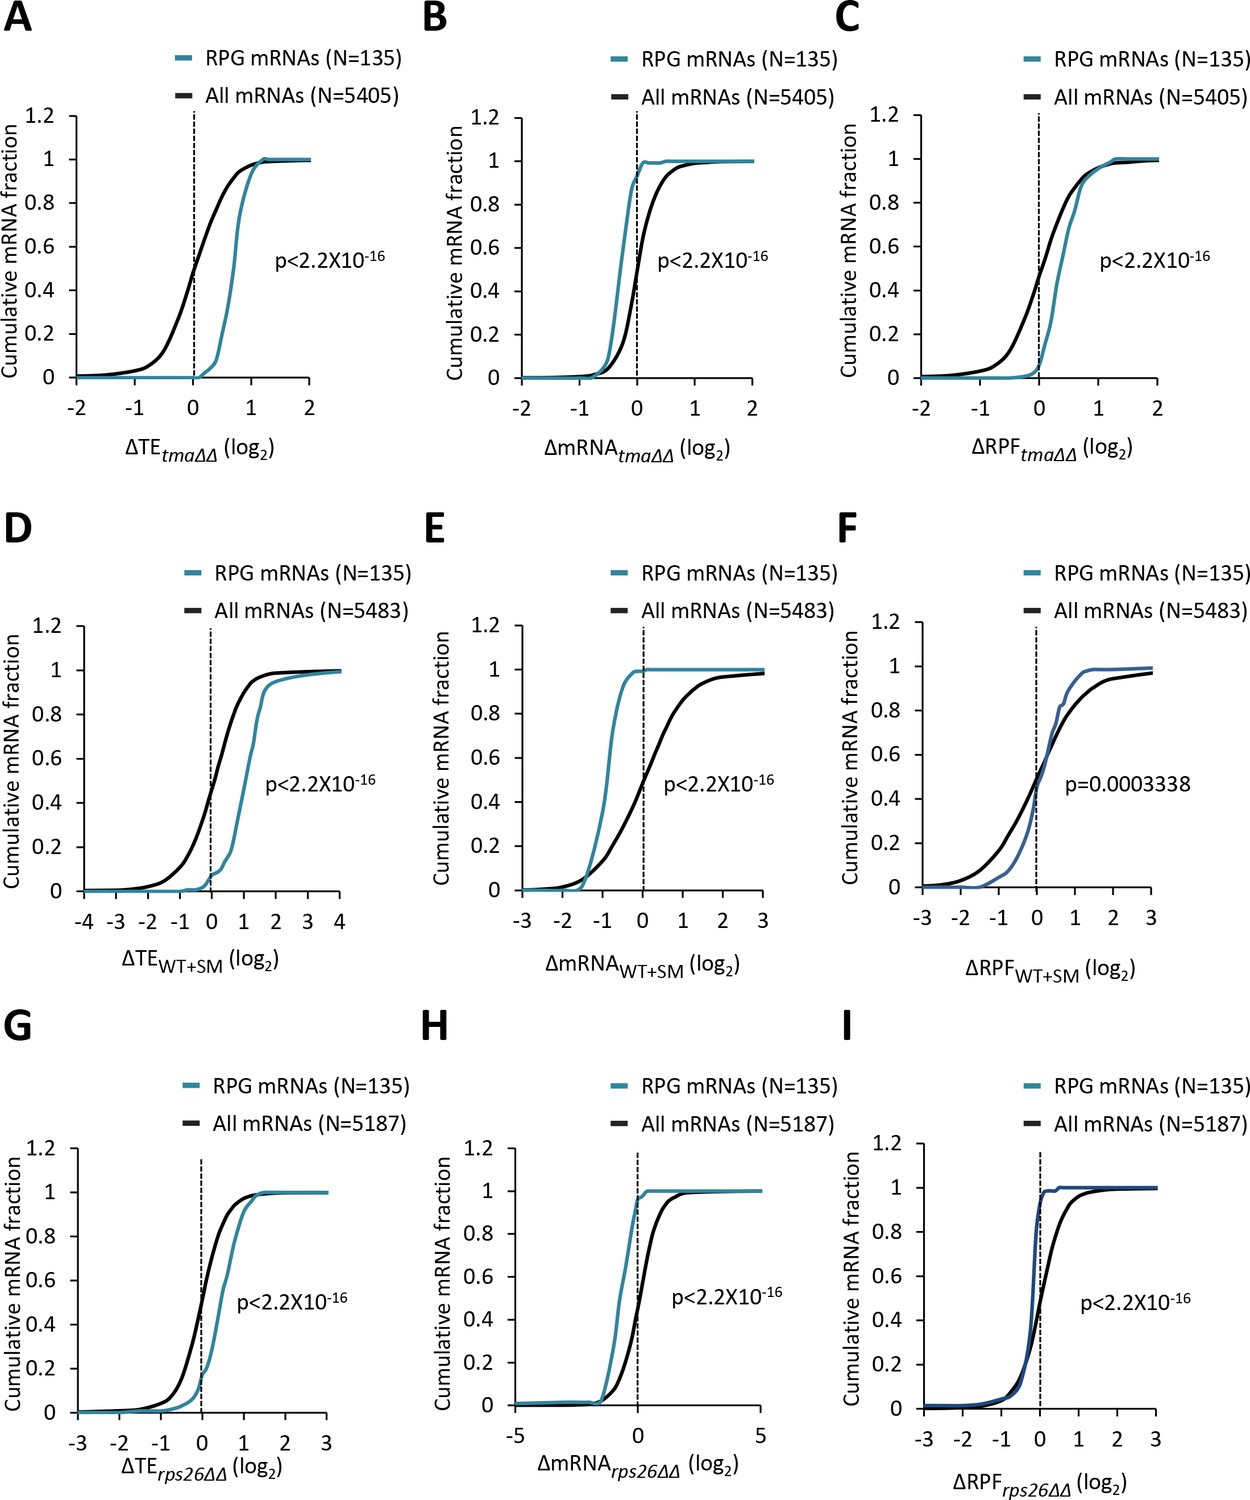
Ribosomal protein mRNAs are translationally upregulated by the tma∆∆ mutations, increased eIF2α phosphorylation in WT, or the rps26∆∆ mutations.
(A–I) Cumulative distribution function (CDF) plots of changes in TE (log2∆TE) (A, D, G), mRNA reads (log2∆mRNA) (B, E, H), or ribosome foot-print reads (log2∆RPF) (C, F, I) for all mRNAs (black) and the group of 135 RPG mRNAs (blue) in the tma∆∆ mutant versus WT cells (A, B, C), SM-treated versus untreated WT cells (D, E, F), and the rps26∆∆ mutant versus WT cells (G, H, I). p values in panels (A–I) were calculated using the Kolmogorov-Smirnov test.
Figure 4—figure supplement 5
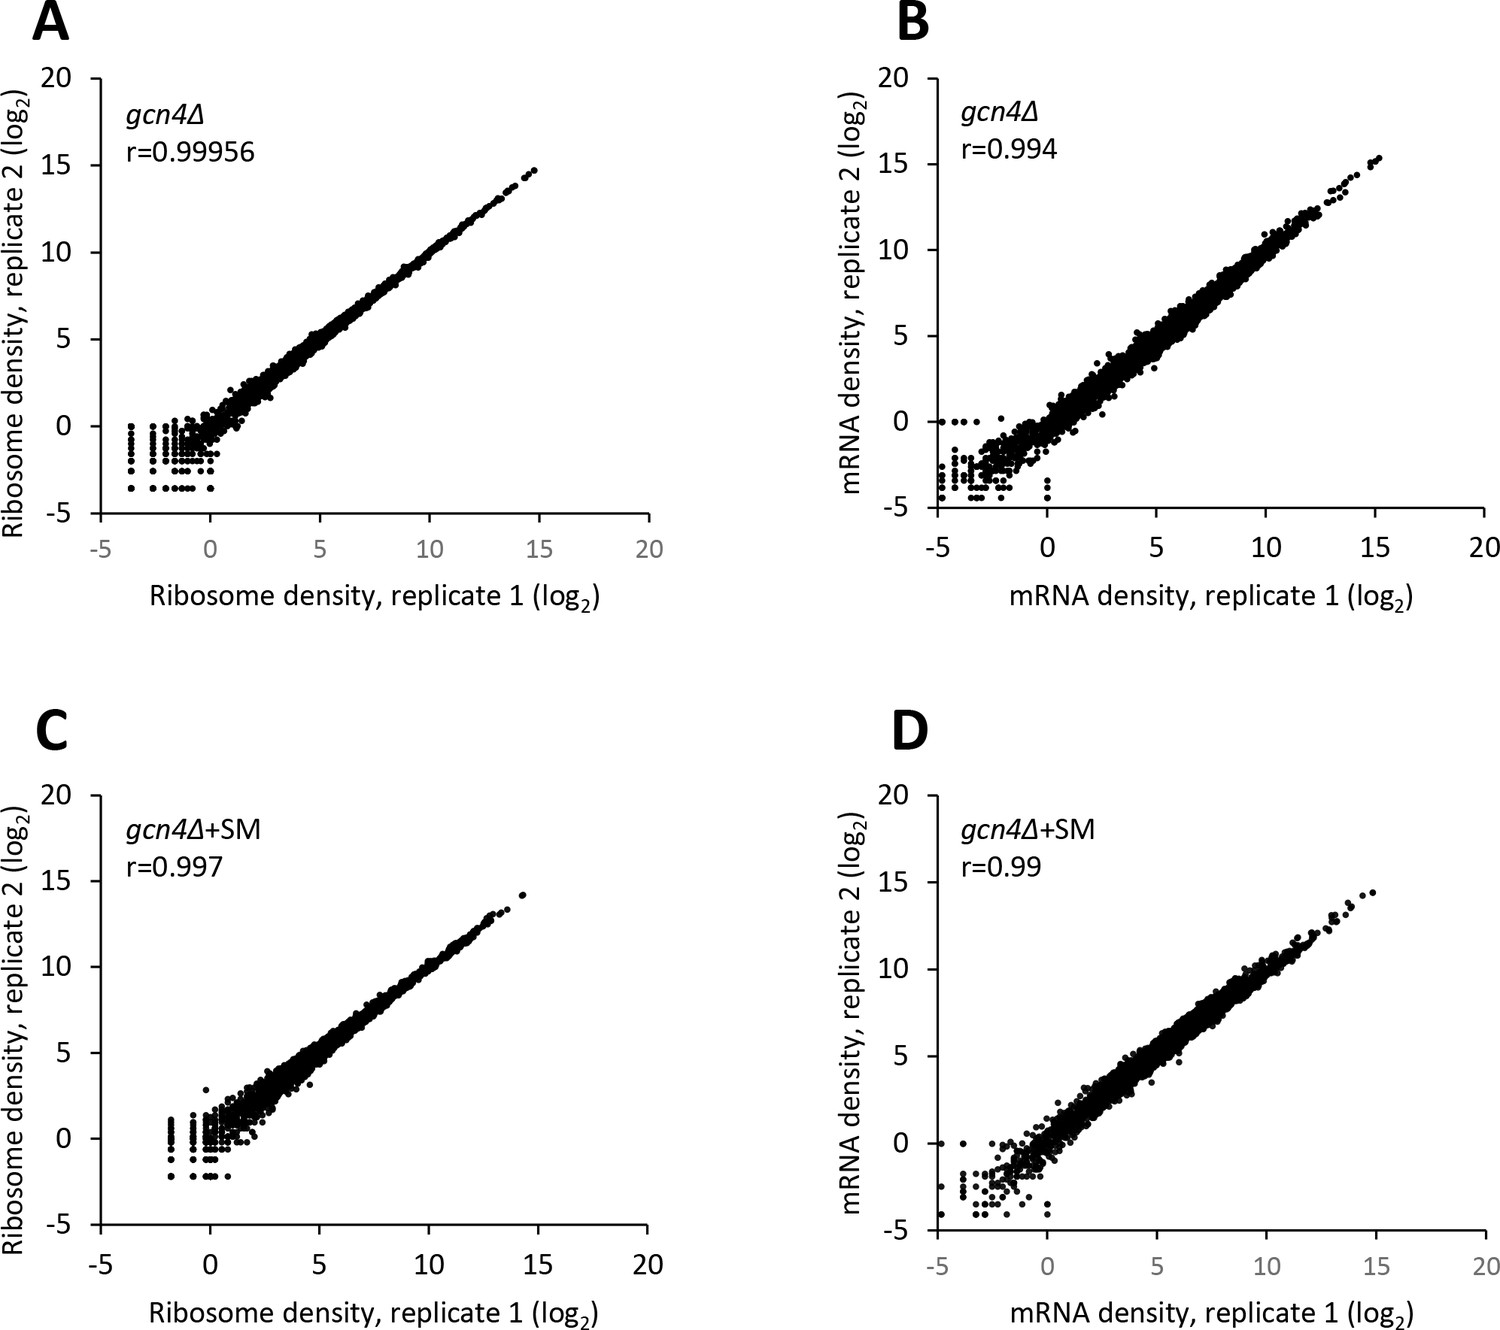
Reproducibility between biological replicates of ribosome footprint profiling and RNA-seq analyses for the gcn4∆ mutant cultured with or without SM treatment.
(A–D) Scatterplots of normalized ribosome footprint (A, C) or mRNA (B, D) read densities for all expressed mRNAs for biological replicates of untreated gcn4∆ cells (A, B) and SM-treated gcn4∆ cells (C, D). The densities were plotted from the reads mapped to the CDS of each gene per million mapped reads in the individual library of a biological replicate. Pearson’s correlation coefficient (r) for the plotted genes is indicated in each plot.
Figure 4—figure supplement 6
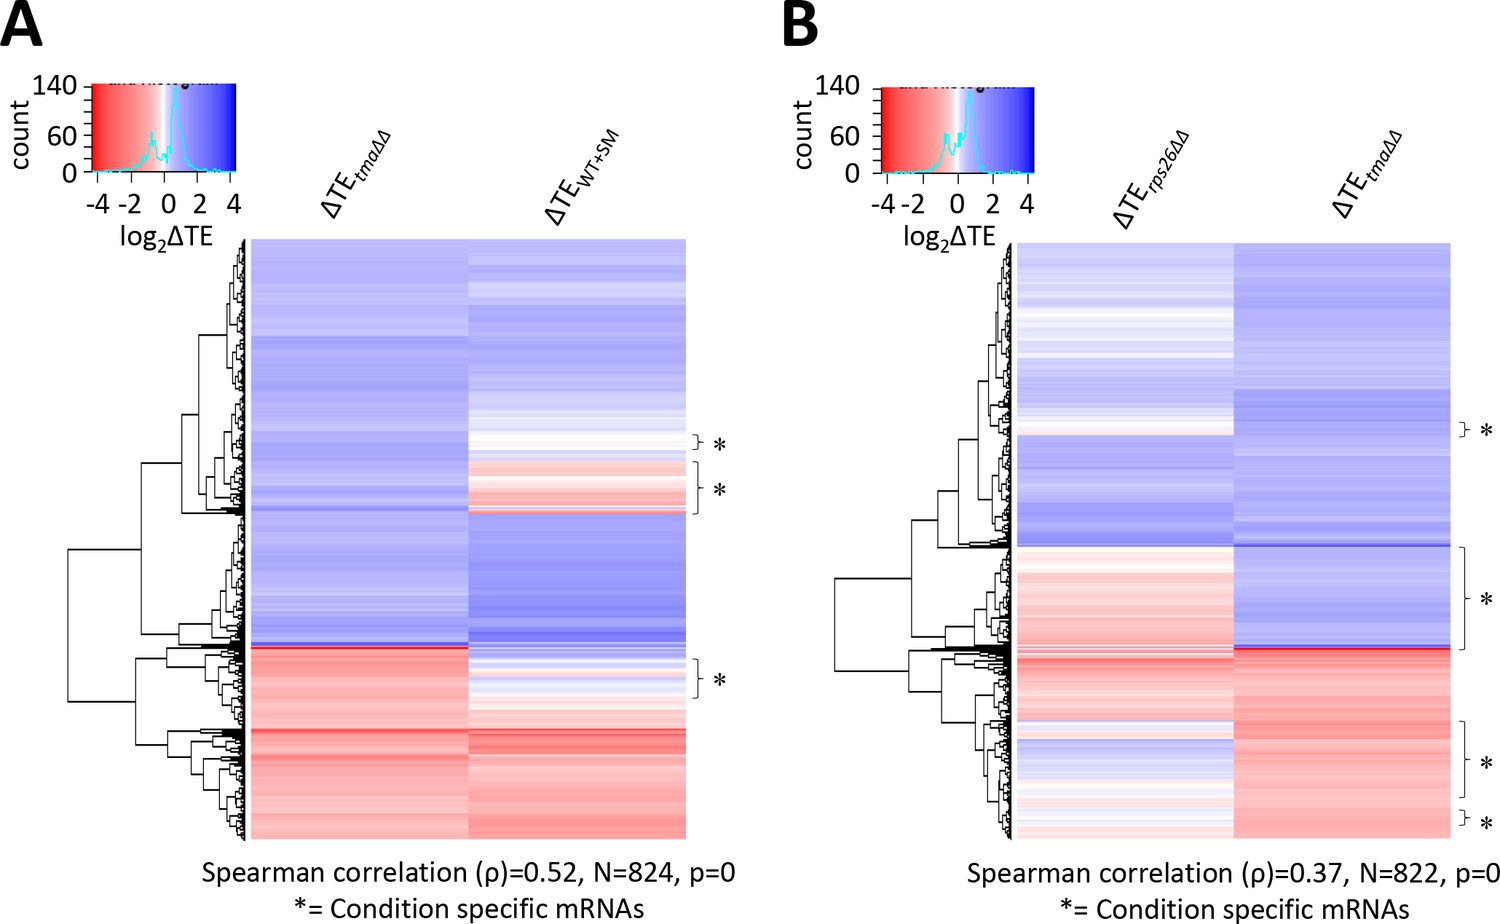
Condition-specific changes in relative TE evoked by the tma∆∆ mutations, increased eIF2α phosphorylation in WT, or the rps26∆∆ mutations.
(A) Hierarchical clustering analysis of log2TE changes observed in the tma∆∆ mutant versus WT cells and in SM-treated versus untreated WT cells for 824 mRNAs that exhibit significant changes in relative TE in the tma∆∆ mutant versus WT cells only, at FDR < 0.1. The color scale for log2ΔTE values ranges from 4 (dark blue) to −3.5 (dark red). Two mRNAs, YPR146C (with ∆TEtma∆∆ >10 fold and ∆TEWT+SM <10 fold) and YGR122C-A (with ∆TEtma∆∆ >3.5 fold and ∆TEWT+SM <0.3 fold) were excluded to enhance the color differences among the remaining mRNAs analyzed in the heatmap. (B) Hierarchical clustering analysis of log2TE changes observed in the tma∆∆ mutant versus WT cells and in the rps26∆∆ mutant versus WT cells for 822 mRNAs that exhibit significant TE changes in the tma∆∆ mutant versus WT cells only, at FDR < 0.1. The color scale for log2ΔTE values ranges from 4 (dark blue) to −4 (dark red). Two mRNAs, YPR146C (with ∆TEtma∆∆ >10 fold and ∆TErps26∆∆ <0.9 fold) and YHL016C (with ∆TEtma∆∆ <3 fold and ∆TErps26∆∆ <12 fold), were excluded to enhance the color differences among the remaining mRNAs. In both panels, the Spearman correlation coefficient (ρ) for the TE changes determined for the plotted mRNAs in the two conditions being compared is indicated below the plot. Brackets marked with asterisks delineate blocks of mRNAs in which the majority show no change in TE, or TE changes in the opposite direction in WT cells treated with SM (A) or in response to the rps26∆∆ mutations (B) compared to the TE changes conferred by the tma∆∆ mutations.
Figure 5 with 5 supplements
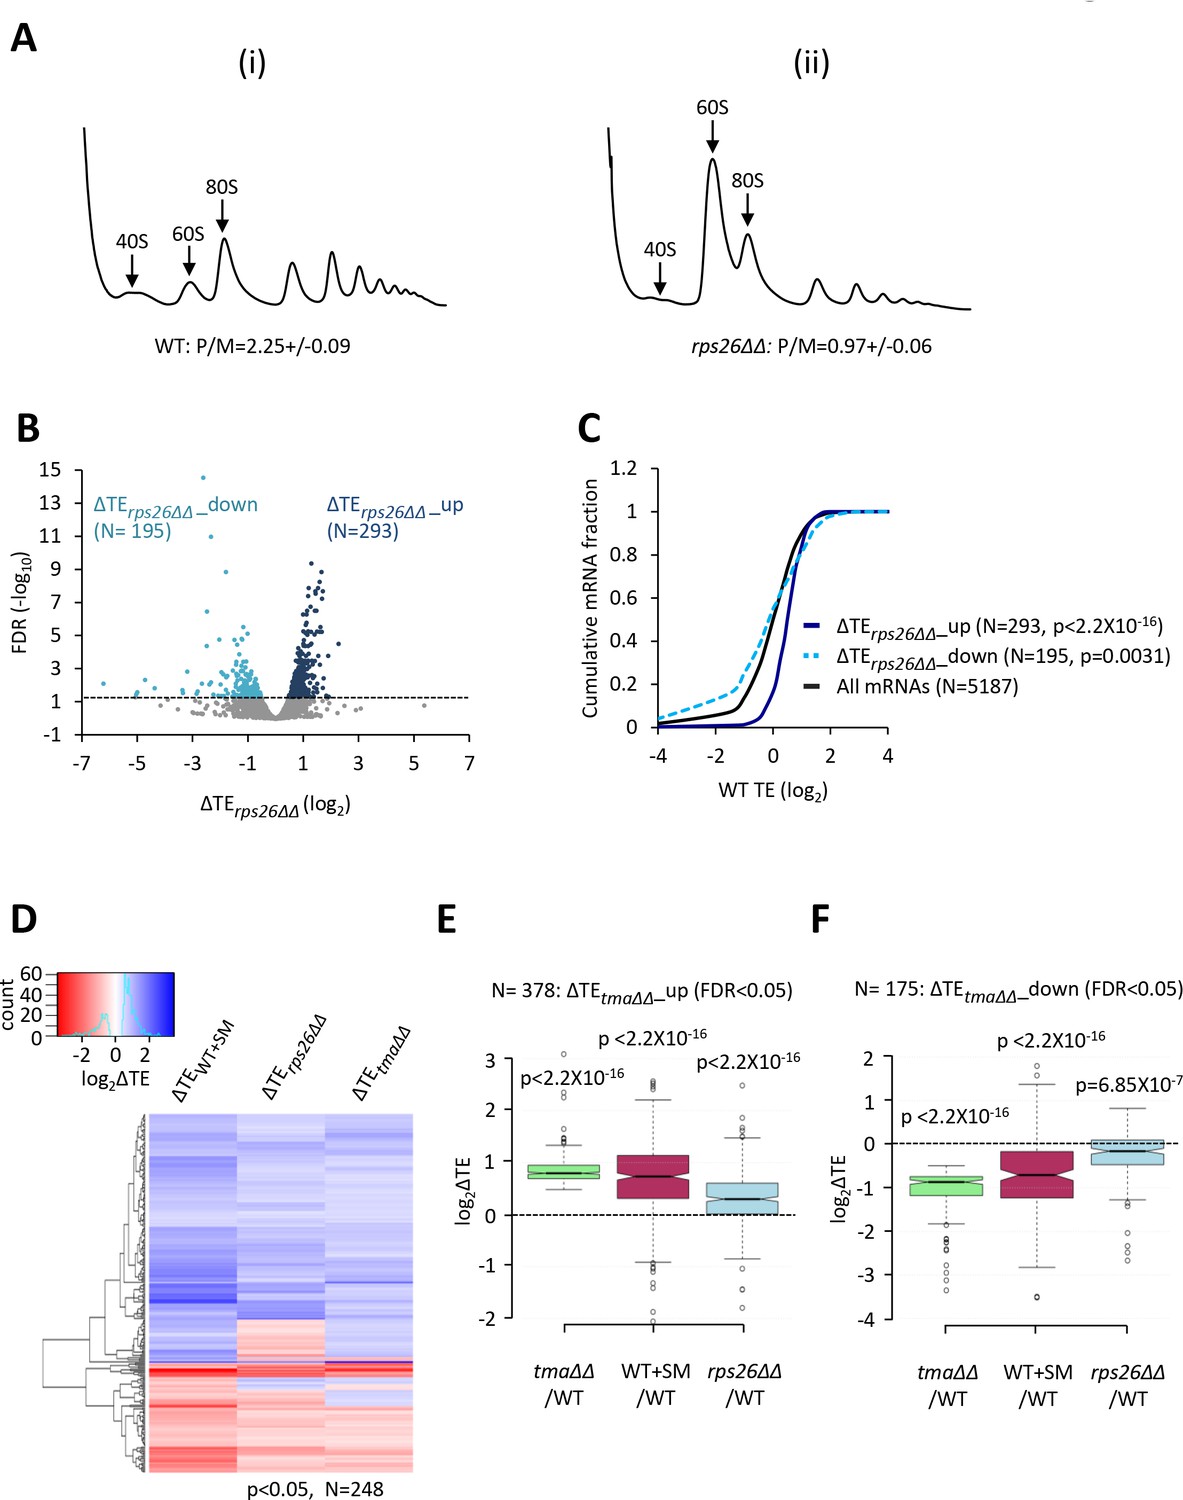
Relative TE changes evoked by depleting 40S subunits are broadly comparable to those evoked by the tma∆∆ mutations or by increased eIF2α phosphorylation.
(A) Polysome profiles of WT strain H2994 and the rps26∆∆ mutant JVY09. Cells cultured in SC medium with 2% galactose and 2% raffinose instead of glucose at 30°C to log-phase were shifted to glucose-containing SC medium for 3 hr and treated with 50 μg/mL of CHX for 5 min before harvesting at 4°C. WCEs were resolved by sedimentation through sucrose gradients and scanned at 260 nm to visualize (from left to right) free 40S and 60S subunits, 80S monosomes, and polysomes. The mean polysome/monosome (P/M) ratios ± SEMs from five biological replicates are shown. (B) Volcano plot showing the log2 ratios of relative TEs in the rps26∆∆ mutant versus WT cells (∆TErps26∆∆ values) for each mRNA (x-axis) versus negative log10 of the FDR for the ∆TErps26∆∆ changes determined by DESeq2 analysis of ribosome profiling data for the 5187 mRNAs with evidence of translation (y-axis). The dotted line marks the 5% FDR threshold. mRNAs showing a significant increase (∆TErps26∆∆_up) or decrease (∆TErps26∆∆_down) in relative TE in the rps26∆∆ mutant versus WT cells at FDR < 0.05, are plotted in dark or light blue circles, respectively. (C) Cumulative distribution function (CDF) plots of log2WT TE values for all mRNAs (black) and mRNAs exhibiting a significant increase (∆TErps26∆∆_up, solid dark blue) or decrease (∆TErps26∆∆_down, dotted light blue) in relative TE (at FDR < 0.05) in the rps26∆∆ mutant versus WT cells. p values were calculated using the Kolmogorov-Smirnov test. (D) Hierarchical clustering analysis of log2TE changes observed for 248 mRNAs that exhibit significant TE changes in the tma∆∆ mutant versus WT cells, in SM-treated versus untreated WT cells, and also in the rps26∆∆ mutant versus WT cells, at p < 0.05 for all genotypes/conditions. The color scale for log2ΔTE values ranges from 3.5 (dark blue) to −2.5 (dark red). (E–F) Notched box plots showing translation changes (log2ΔTE) in the indicated mutant versus WT for mRNAs exhibiting a significant increase (∆TEtma∆∆_up, N = 385, panel E) or decrease (∆TEtma∆∆_down, N = 175, panel F) in relative TE in the tma∆∆ mutant versus WT cells at a 5% FDR threshold. A few outliers were omitted from the plots to expand the y-axis scale. p values were calculated using the Mann-Whitney U test for the differences between the indicated groups of mRNAs versus all mRNAs. (Columns 1–2 in panels (E–F) were previously compared in Figure 4—figure supplement 2A–B).
Figure 5—figure supplement 1

Reproducibility between biological replicates of ribosome footprint profiling and RNA-seq analyses for WT and the rps26∆∆ mutant.
(A–D) Scatterplots of normalized ribosome footprint (A, C) or mRNA (B, D) read densities for all expressed mRNAs for biological replicates of the WT (A, B) and the rps26∆∆ mutant (C, D). The densities were plotted from the reads mapped to the CDS of each gene per million mapped reads in the individual library of a biological replicate. Pearson’s correlation coefficient (r) for the plotted genes is indicated in each plot.
Figure 5—figure supplement 2
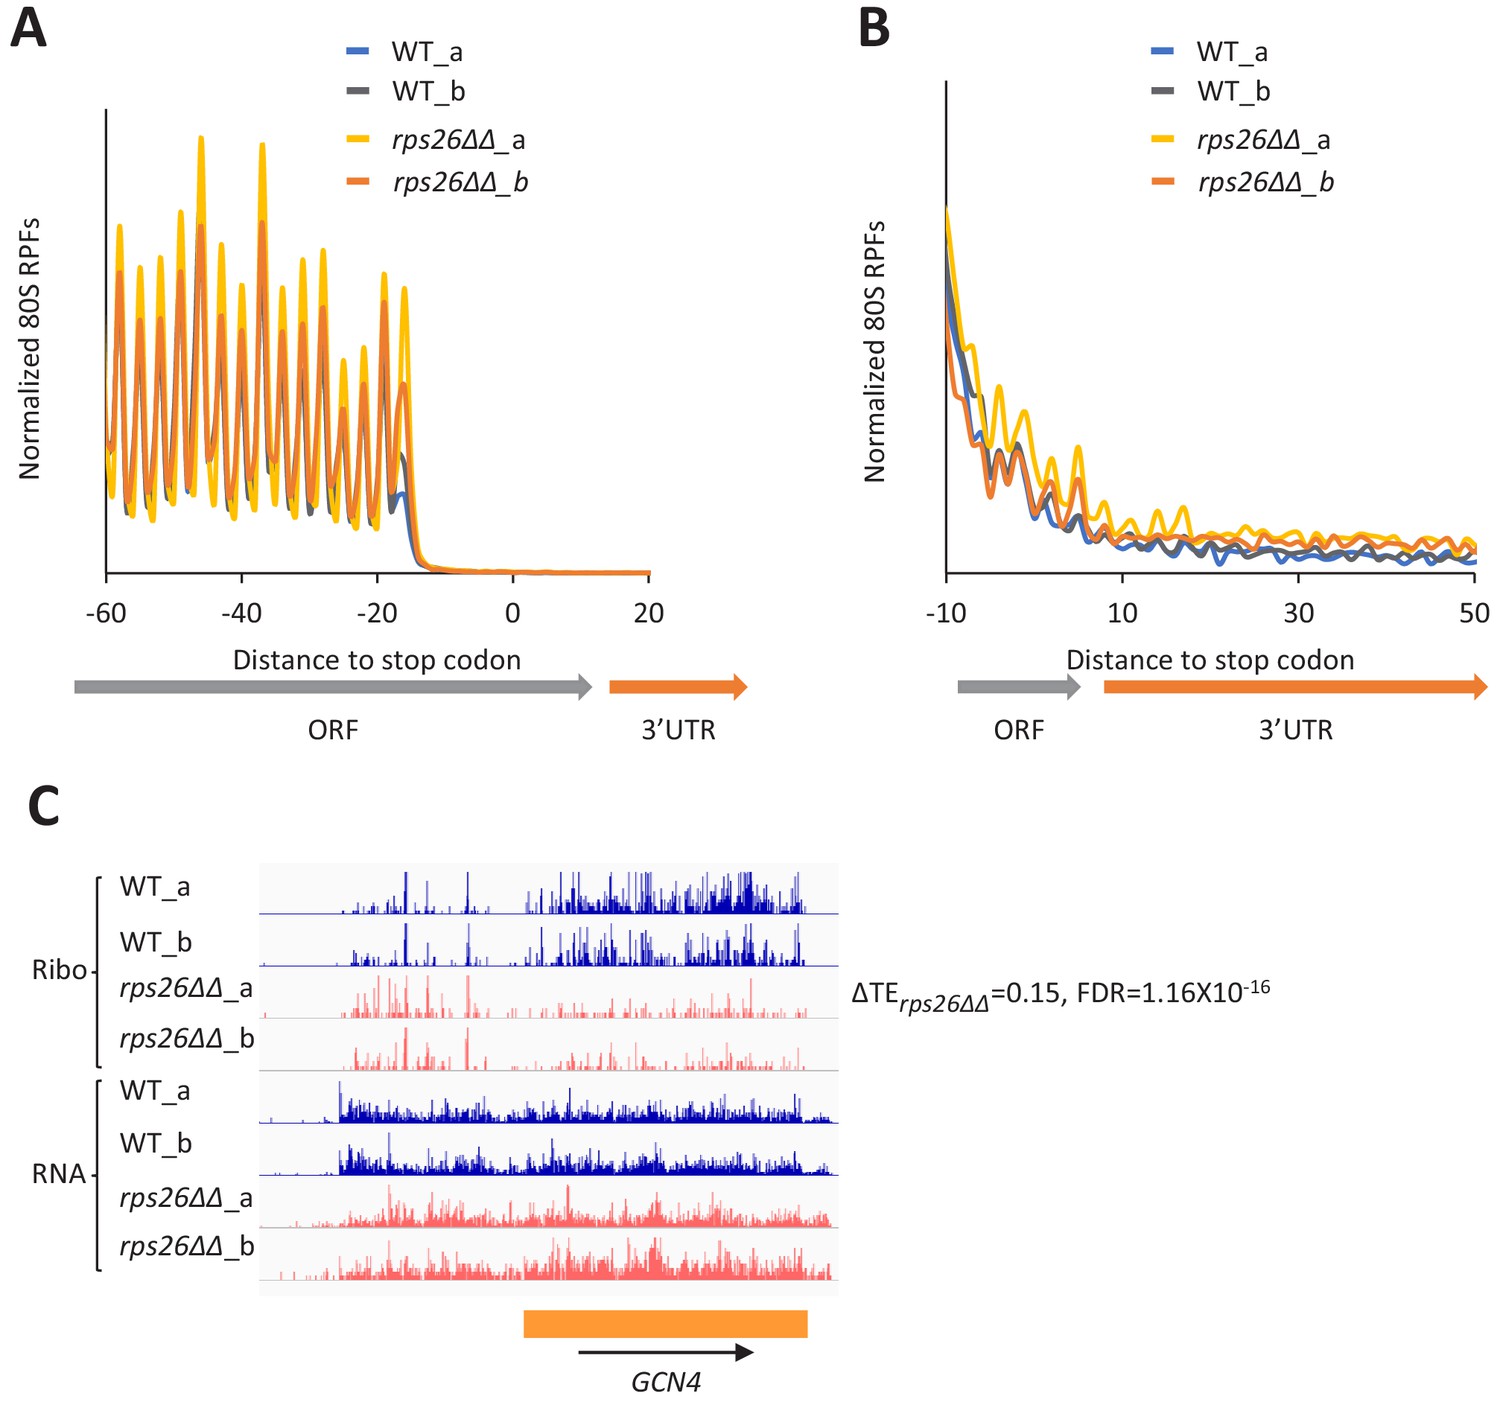
The rps26∆∆ mutations do not derepress GCN4 mRNA translation or confer 40S recycling defects.
(A) Results from ribosome profiling showing the normalized 80S ribosome reads from all mRNAs aligned with respect to their stop codons, for WT strain H2994 (light and dark blue) and the rps26∆∆ mutant JVY09 (yellow and orange), showing two replicates (a and b) for each strain. (B) Expanded view of normalized 80S reads from all mRNAs shown in (A) for the first 50 nt of the 3’UTRs. (C) Genome browser view of ribosome profiling data for GCN4 mRNA, showing RPF reads (Ribo) and mRNA reads (RNA) mapping across the transcription unit in WT, and in the rps26∆∆ mutant, showing two replicates (a and b) for each strain. The main CDS is shown schematically (orange). The calculated ∆TErps26∆∆ value is shown.
Figure 5—figure supplement 3
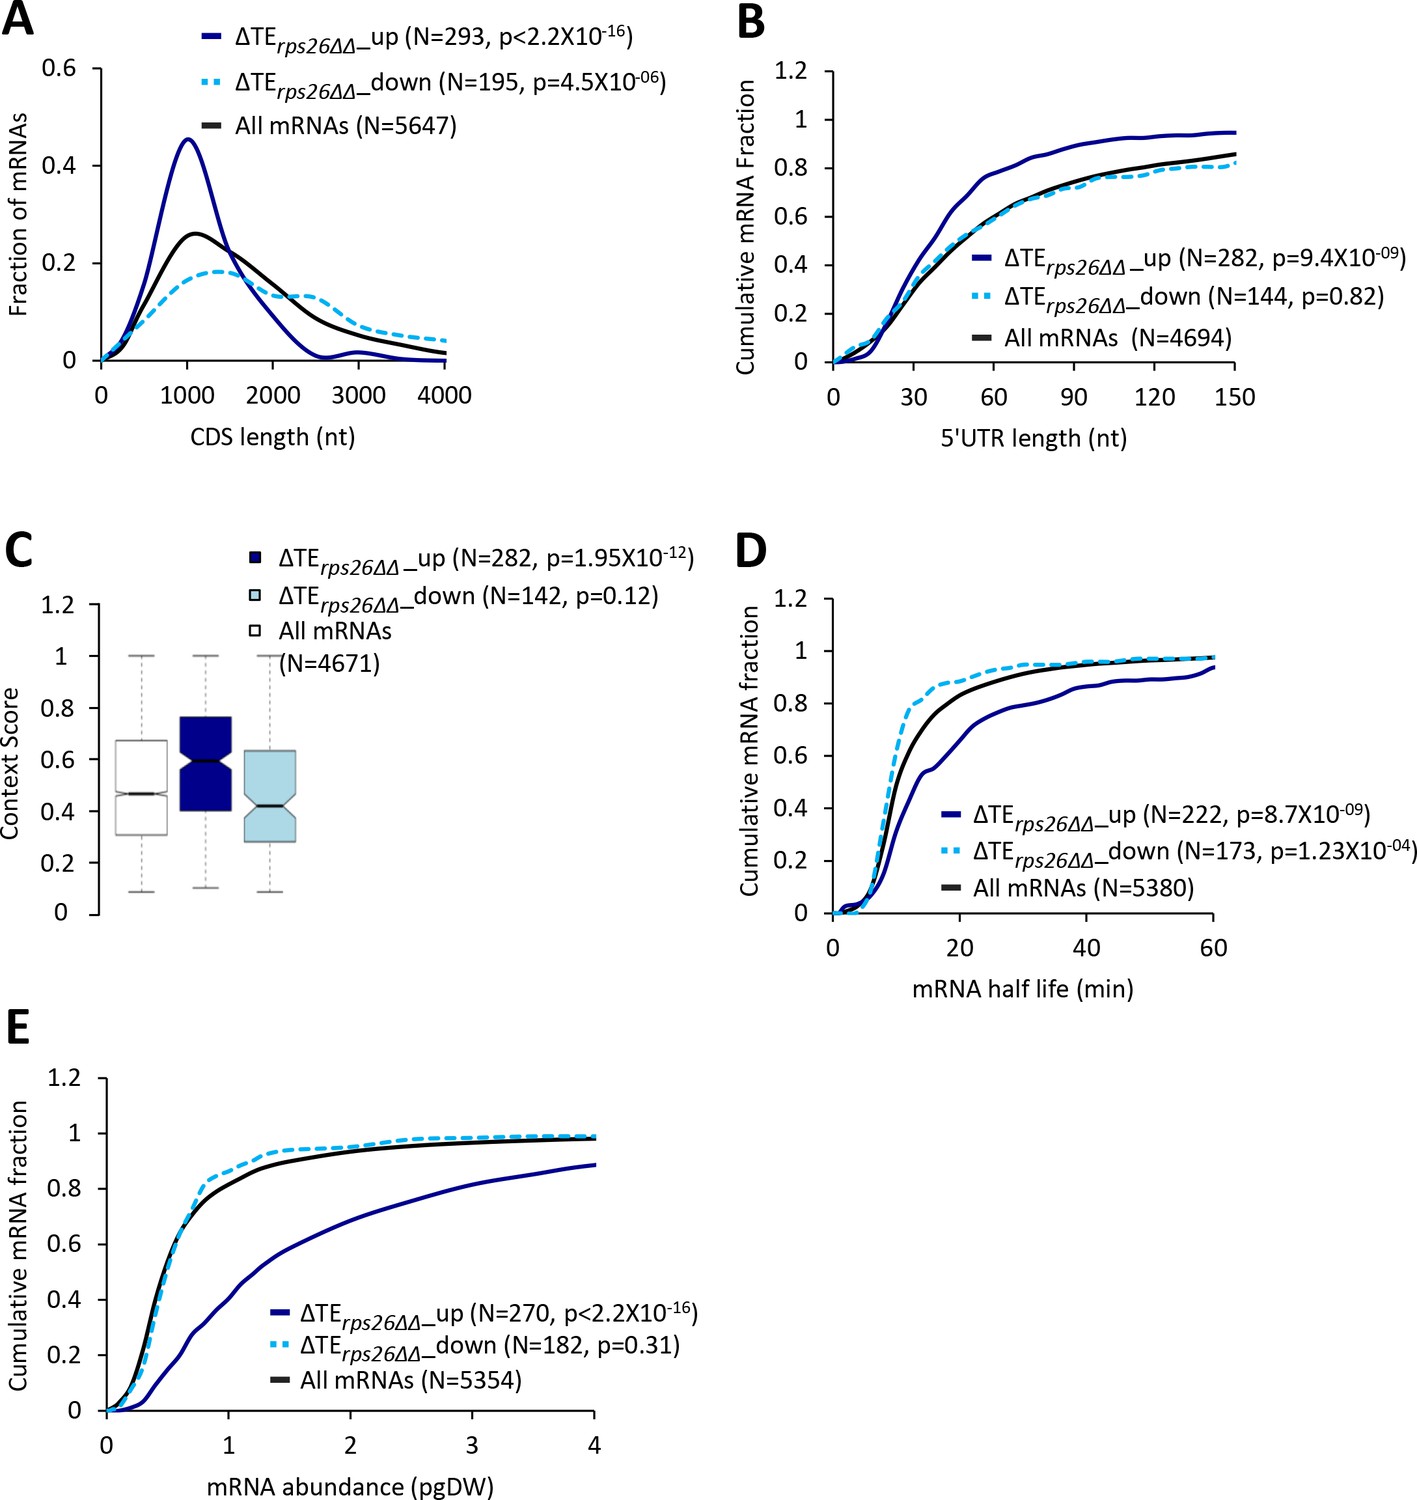
40S subunit depletion in the rps26∆∆ mutant increases the relative TEs of mRNAs with attributes similar to mRNAs showing TE increases conferred by the tma∆∆ mutations.
(A) Frequency distribution plots of CDS length for all mRNAs (black) and mRNAs exhibiting a significant increase (∆TErps26∆∆_up, solid dark blue) or decrease (∆TErps26∆∆_down, dotted light blue) in relative TE (at FDR < 0.05) in the rps26∆∆ mutant versus WT cells. (B, D and E) Cumulative distribution function (CDF) plots of 5’UTR length (B), mRNA abundance in molecules per picogram of dry cellular weight (pgDW) (D), and mRNA half-life (E), for the groups of mRNA examined in (A). p values in panels A-B and D-E were calculated using the Kolmogorov-Smirnov test. (C) Notched box plots of context scores calculated for positions −3 to −1 and +4 of the main CDS AUGs for all mRNAs (white) and for the groups of mRNA, ∆TErps26∆∆_up (dark blue) and ∆TErps26∆∆_down (light blue), examined in (A). p values were calculated using the Mann-Whitney U test.
Figure 5—figure supplement 4
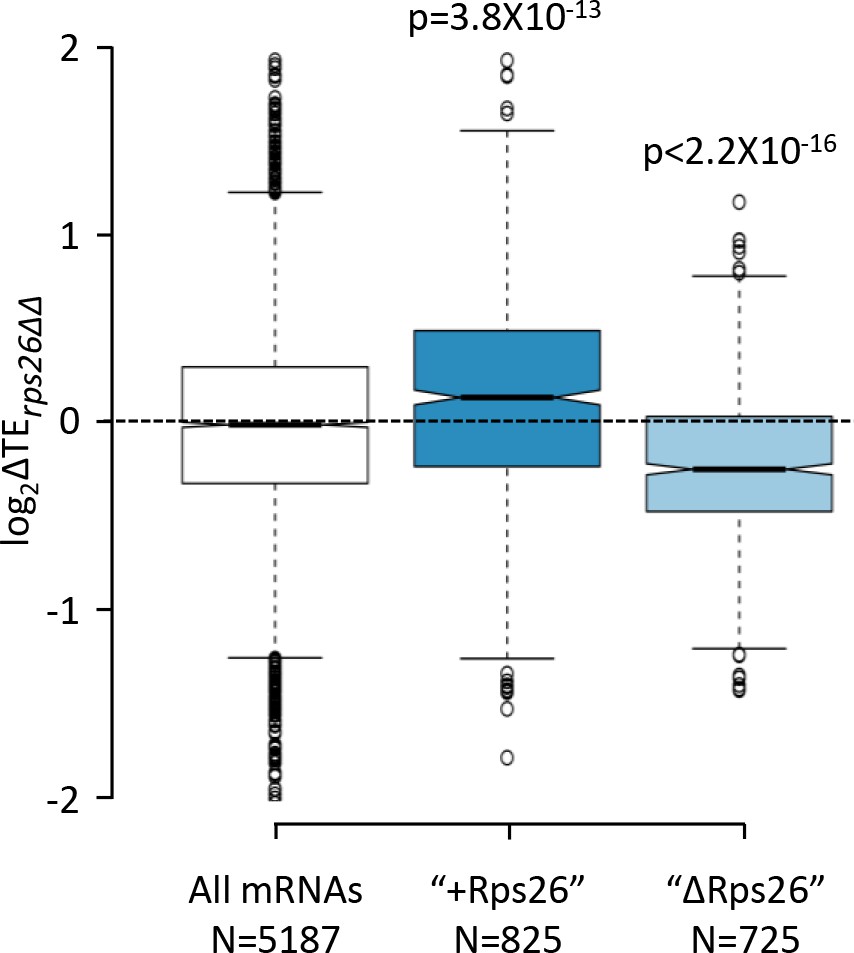
Effects of the rps26∆∆ mutations on the relative TEs of the "+Rps26" and "ΔRps26" groups of mRNAs.
Notched box plots showing the changes in relative TE observed in the rps26∆∆ mutant versus WT cells for all mRNAs and for the two groups of mRNAs found to bind preferentially to 40S subunits containing Rps26 ("+Rps26") or lacking Rps26 ("ΔRps26") by Ferretti et al., 2017. A few outliers were omitted from the plots to expand the y-axis scale. p values indicated in the panel were calculated using the Mann-Whitney U test.
Figure 5—figure supplement 5
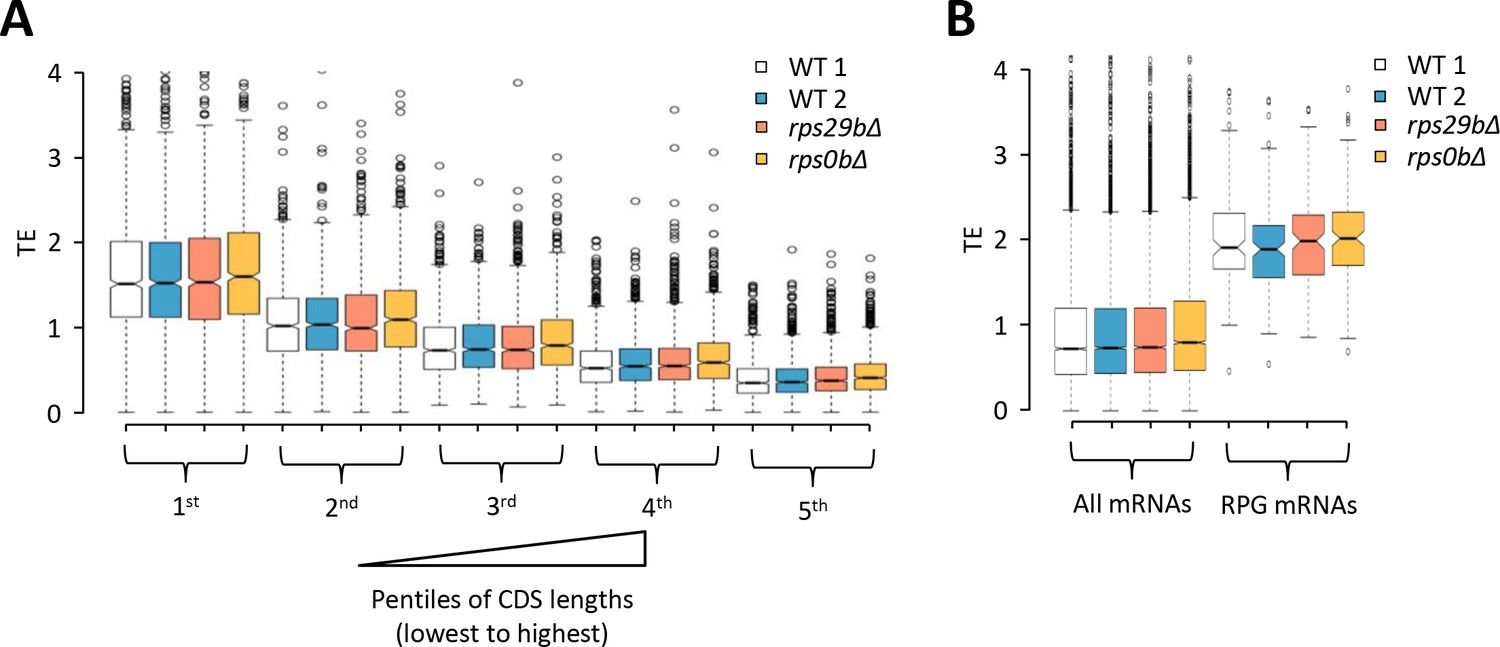
Effects of rps29b∆ and rps0b∆ mutations on relative TEs of different groups of mRNAs calculated from the ribosome footprint profiling and RNA-seq data of Cheng et al., 2019.
(A–B) Notched box plots of relative TEs determined for single replicates of rps29b∆, rps0b∆, and two different WT strains for (A) five pentiles of 907–908 genes sorted according to increasing CDS length, and (B) all mRNAs versus 133 RPG mRNAs interrogated in the rps0b∆ strain and two different WT strains, or the 132 RPG mRNAs interrogated in the rps29b∆ strain.
Figure 6 with 2 supplements

mRNAs showing relative TE increases in response to deletion of TMA64/TMA20, increased eIF2α phosphorylation, or 40S subunit depletion have a strong propensity to form the closed-loop intermediate.
(A–F) Cumulative distribution function (CDF) plots of changes in TEs (log2∆TE) (A, C, E) or mRNA levels (log2∆mRNA) (B, D, F) for all mRNAs (black) or the 386 SCL mRNAs (red) in the tma∆∆ mutant versus WT cells (A–B), in SM-treated versus untreated WT cells (C–D), and in the rps26∆∆ mutant versus WT cells (E–F). p values were calculated using the Kolmogorov-Smirnov test.
Figure 6—figure supplement 1
Strong Closed-Loop (SCL) mRNAs show attributes of highly translated mRNAs.
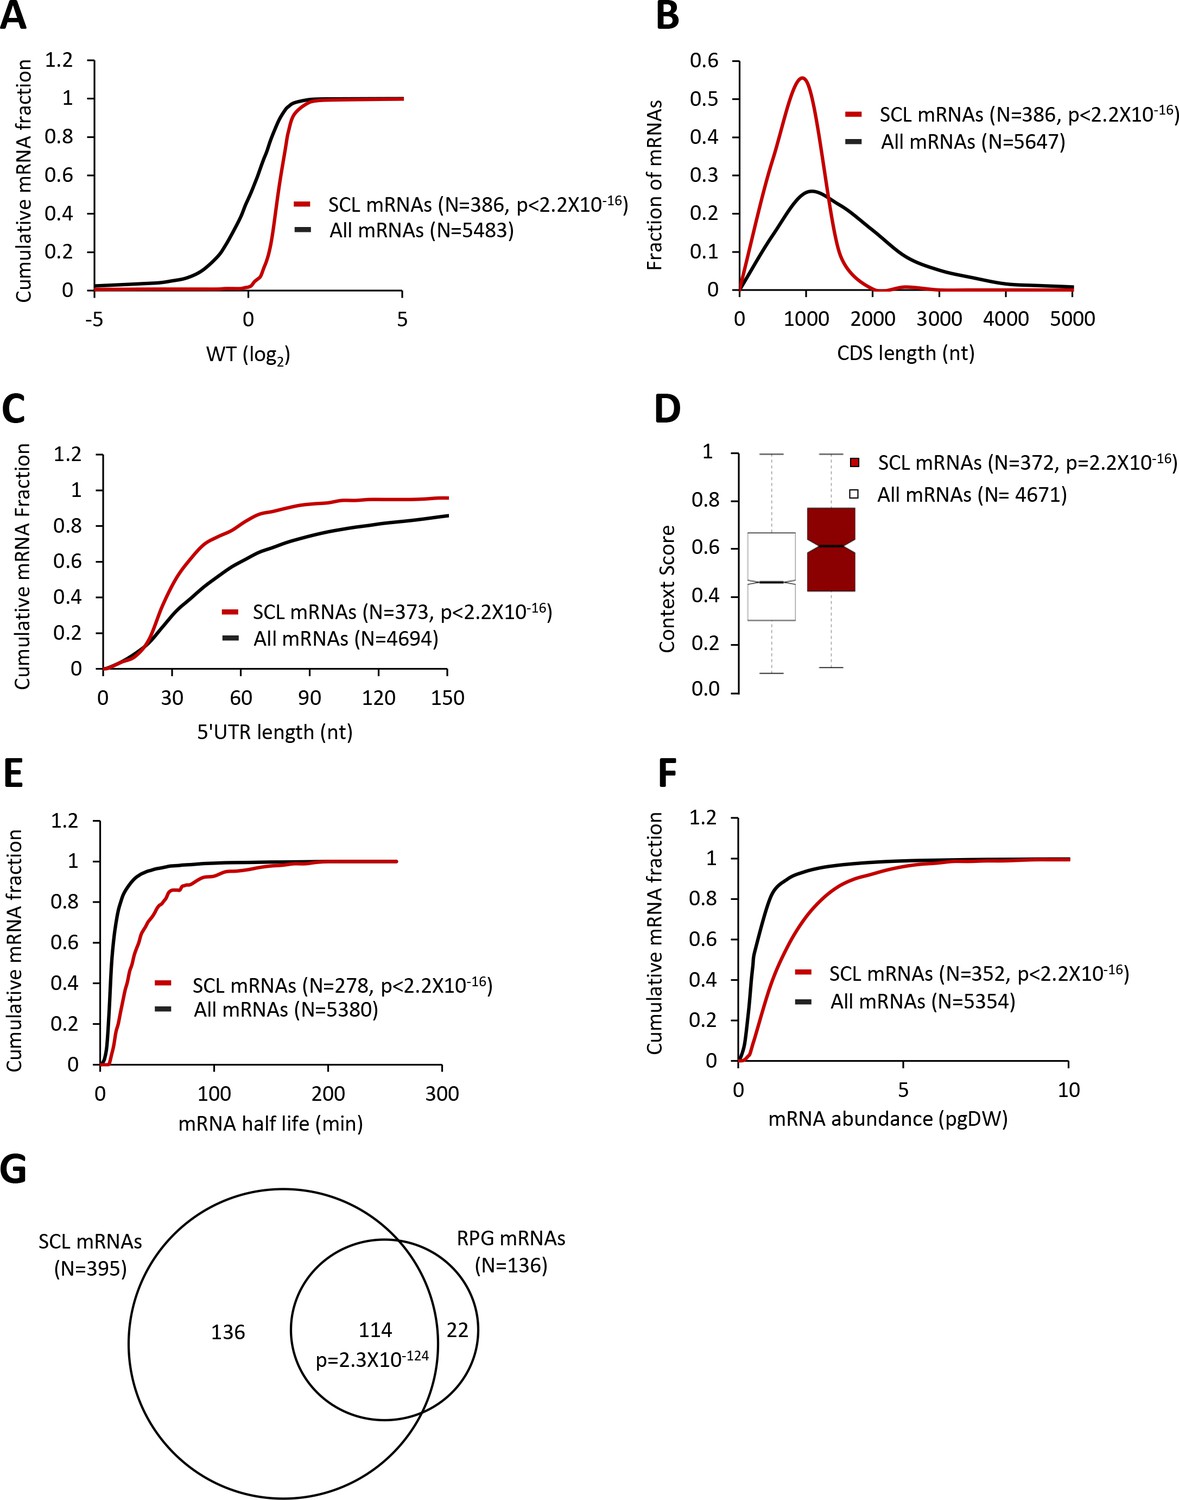
(A, C, E, and F) Cumulative distribution function (CDF) plots of log2WT TE values (A), 5’UTR length (C), mRNA abundance in molecules per picogram of dry cellular weight (pgDW) (E), and mRNA half-life (F), for all mRNAs (black) and the 386 SCL mRNAs (red). (B) Frequency distribution plots of CDS length for all mRNAs and the SCL mRNAs. (D) Notched box plots of context scores calculated for positions −3 to −1 and +4 of main CDS AUGs for all mRNAs (white) and the SCL mRNAs (red). p values were calculated using the Mann-Whitney U test. (G) Venn diagrams of overlaps between the SCL mRNAs and RPG mRNAs, with the p value calculated using the Fisher's exact test.
Figure 6—figure supplement 2
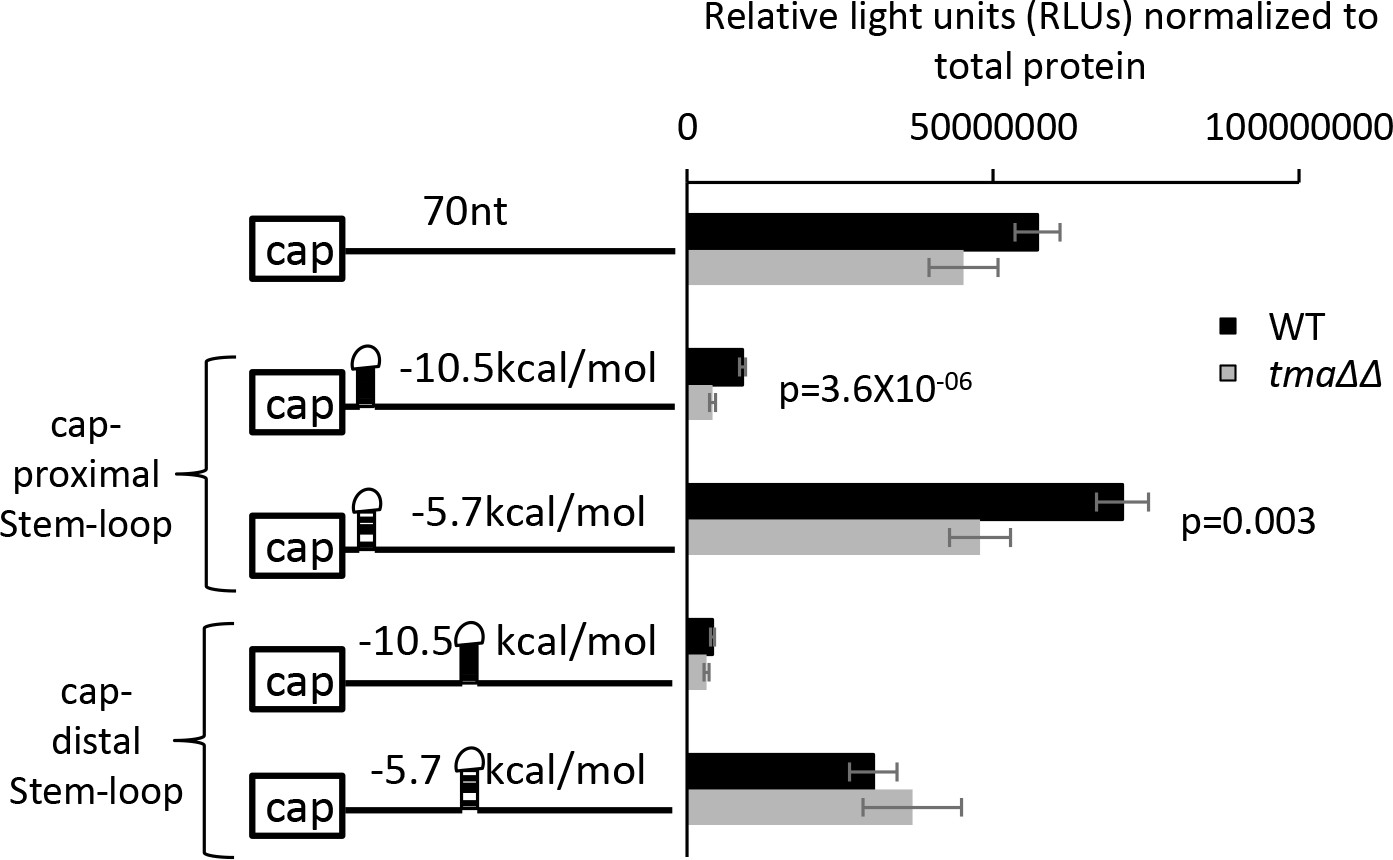
The tma∆∆ mutations exacerbate the inhibitory effect of cap-proximal stem-loop structures on expression of luciferase reporter mRNAs.
Luciferase reporter mRNAs shown schematically on the left were expressed from low-copy number plasmids in WT and the tma∆∆ mutant. Eight independent transformants for each strain/plasmid were cultured for approximately three cell doublings in SC-Ura at 30°C and luciferase activity (relative light units, RLUs) and total protein concentration were measured in WCEs. Plotted on the right are the RLUs normalized for total protein, with error bars indicating ± SEMs and p values calculated using the student’s t-test. Stem-loops of the indicated predicted stabilities (in kcal/mol) were inserted into a 70 nt unstructured 5′ UTR at either 5 nt or 44 nt from the capped mRNA 5’ end (Left). The parental reporter (first row) contains the RPL41A promoter and first 5 nt of RPL41A mRNA followed by a tandem array of 18 CAA repeats, expected to produce a 5’UTR largely devoid of secondary structure, attached to the firefly luciferase CDSs, and an internally truncated RPL41A 3’UTR sequence (Sen et al., 2016).
-
Figure 6—figure supplement 2—source data 1
Source data for results shown in Figure 6—figure supplement 2.
- https://cdn.elifesciences.org/articles/64283/elife-64283-fig6-figsupp2-data1-v1.xlsx
Figure 7 with 1 supplement
Effects of eliminating the 40S recycling factors on translational control by uORFs.
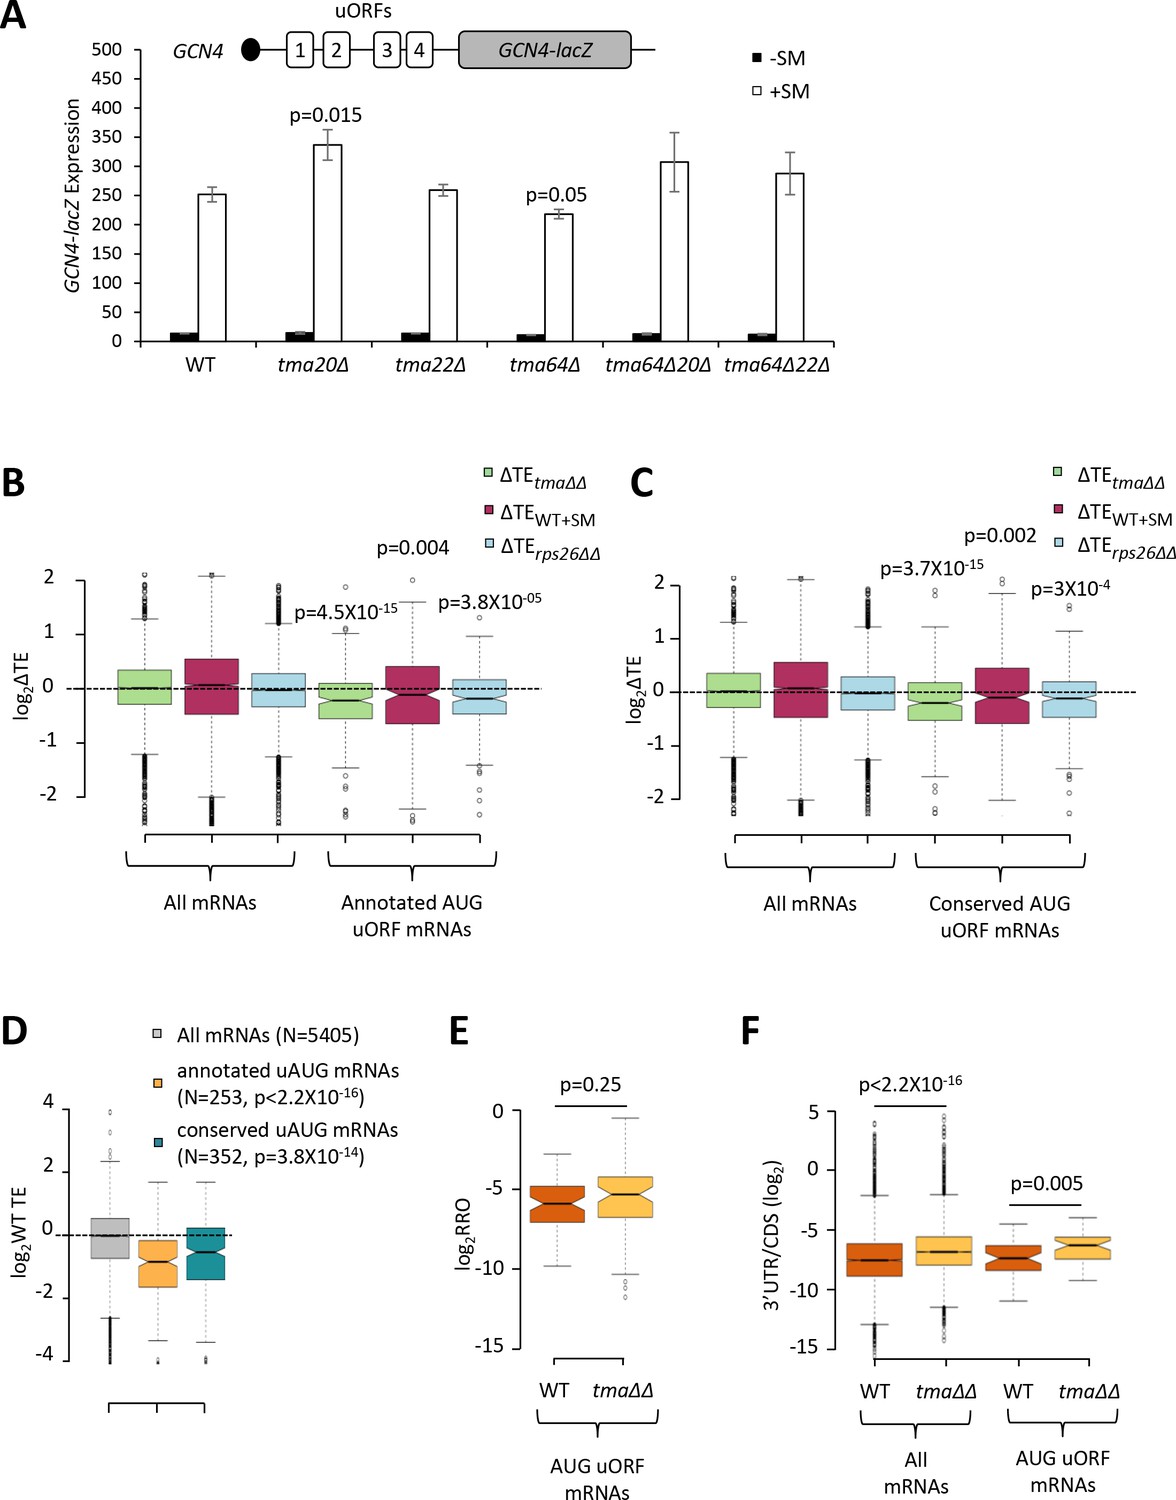
(A) The GCN4-lacZ reporter (depicted schematically) was introduced on plasmid p180 into WT and the indicated yeast mutant strains. Three independently transformed colonies for each strain were cultured in SC-Ura medium at 30°C to log-phase (-SM) or treated with SM at 0.5 μg/mL after 2 hr of growth in SC-Ura and cultured for an additional 4 hr before harvesting. Specific β-galactosidase activities (in units of nmoles of o-nitrophenyl-β-D-galactopyranoside (ONPG) cleaved per min per mg of total protein) were measured in WCEs. Error bars are ± SEMs, and p values were calculated using the student’s t-test. (B–C) Notched box plots showing the log2ΔTE values for all mRNAs or mRNAs containing annotated (B) or conserved (C) AUG uORFs, conferred by the tma∆∆ mutations (green), SM treatment of WT cells (maroon) or the rps26∆∆ mutations (cyan). A few outliers were omitted from the plots to expand the y-axis scale. p values were calculated using the Mann-Whitney U test for the differences between the AUG uORF-containing mRNAs and all mRNAs for each of the three mutations/conditions. (D) Notched box plots showing the log2WT TEs for all expressed mRNAs or for the groups of mRNAs with annotated or conserved AUG uORFs. A few outliers were omitted to expand the y-axis scale. p values were calculated using the Mann-Whitney U test for the differences between the AUG uORF-containing mRNAs and all mRNAs. (E) Notched box plot showing log2RRO values for all AUG uORFs and their corresponding main CDSs in WT and the tma∆∆ mutant. A few outliers were omitted to expand the y-axis scale. The p value was calculated using the Mann-Whitney U test. (F) Notched box plot showing log2(3’UTR:ORF) ratios for all mRNAs or all AUG uORF-containing mRNAs in WT and the tma∆∆ mutant. To interrogate the same number of mRNAs in WT and the tma∆∆ mutant, one footprint read (arbitrary value) was added to all the reads obtained after aligning the sequence data. A few outliers were omitted to expand the y-axis scale. p values were calculated using the Mann-Whitney U test for the differences between WT and the tma∆∆ mutant.
-
Figure 7—source data 1
Source data for results shown in Figure 7A.
- https://cdn.elifesciences.org/articles/64283/elife-64283-fig7-data1-v1.xlsx
Figure 7—figure supplement 1
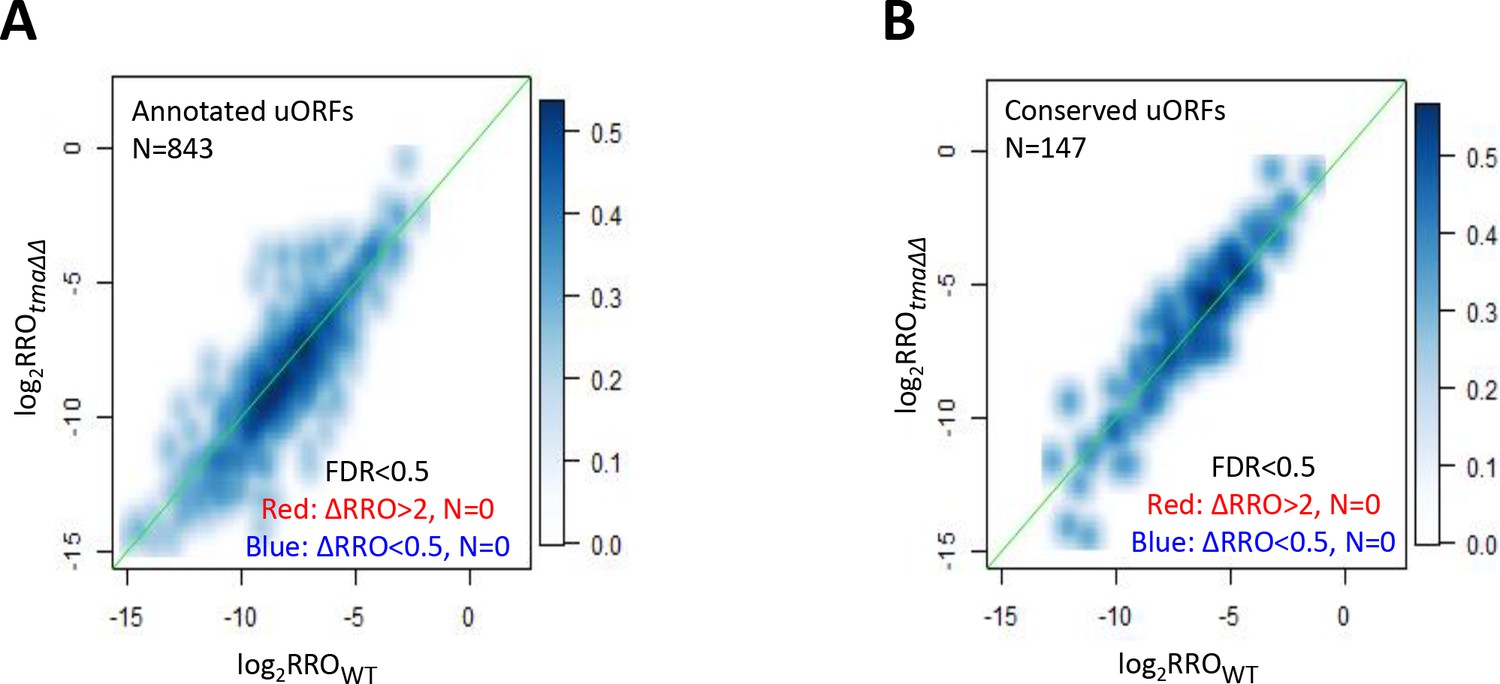
Effects of the tma∆∆ mutations on translational control by uORFs.
(A–B) Smoothed scatterplot comparing log2RROtma∆∆ versus log2RROWT for all annotated uORFs (A) or evolutionarily conserved uORFs (B). Those mRNAs with ≥2 fold changes in RRO in the tma∆∆ mutant versus WT cells (at FDR < 0.5) would be highlighted by red and dark blue dots, respectively, but none exist.
Figure 8
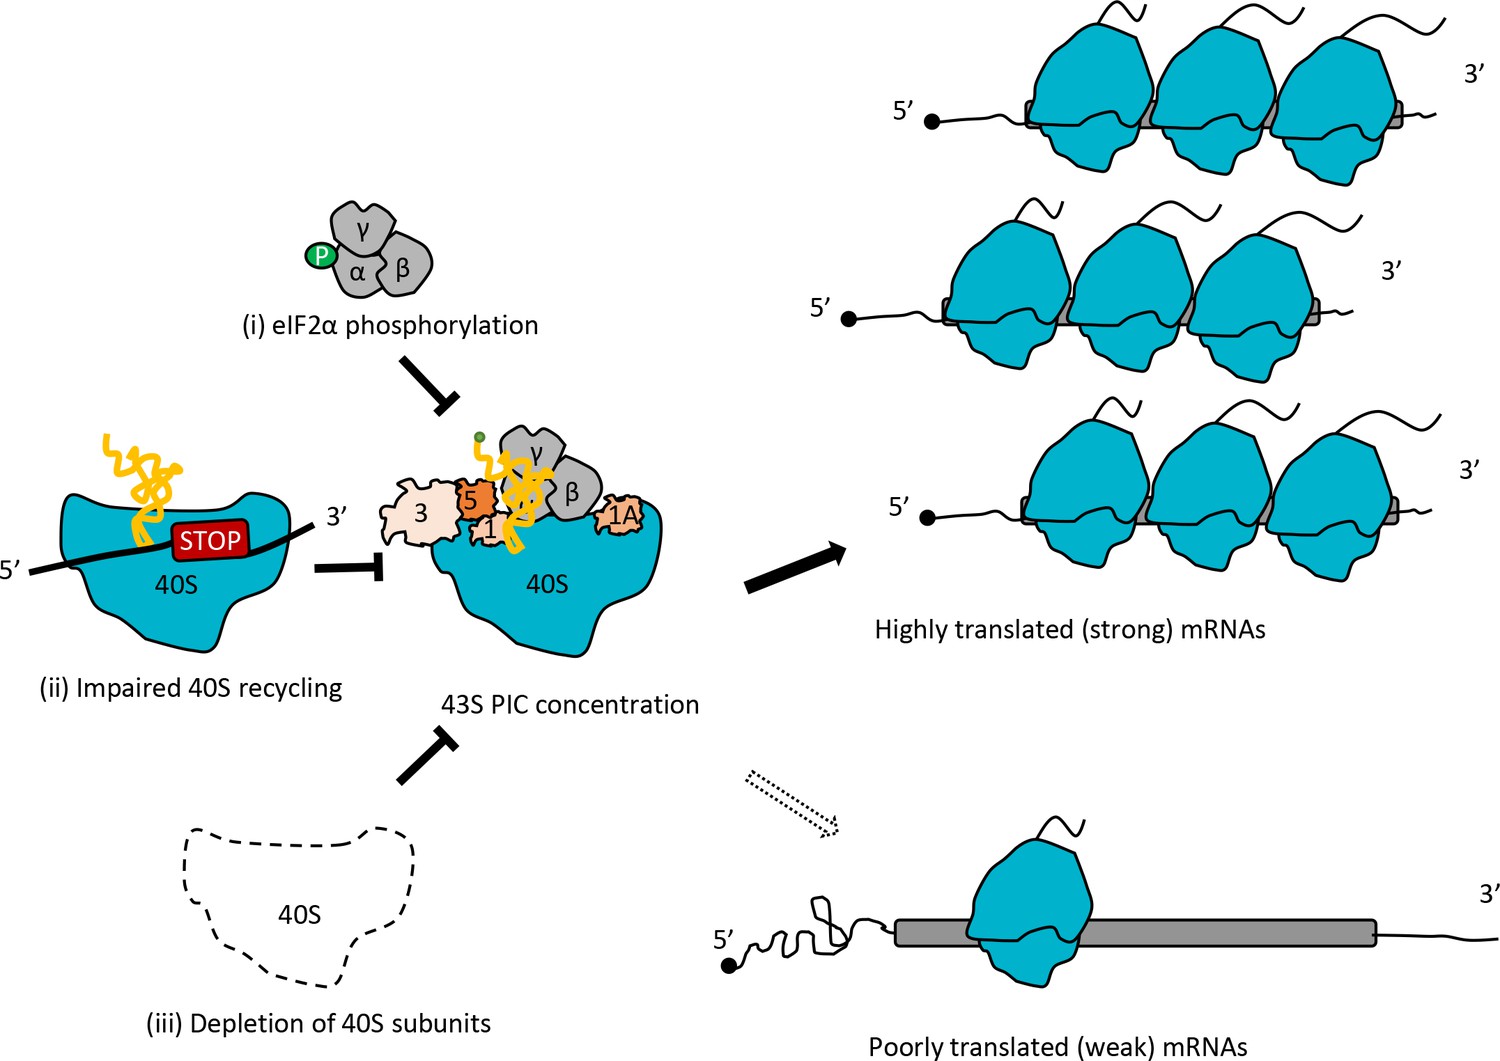
Model depicting how impaired 40S recycling, increased eIF2α phosphorylation, or 40S subunit depletion results in reprogramming of TEs by decreasing 43S PIC assembly.
Reducing assembly of 43S PICs in any of three different ways, (i) impairing recycling of 40S post-TerCs by the tma∆∆ mutations, (ii) inducing phosphorylation of eIF2α by SM treatment of WT cells, or (iii) decreasing 40S subunit levels by depleting Rps26, skews the competition between inherently ‘strong’ and ‘weak’ mRNAs to favor translation of the ‘strong’ mRNAs, which have higher TEs in WT cells and tend to have shorter, less-structured 5’UTRs and shorter CDSs, compared to ‘weak’ mRNAs.
Author response image 1
Tables
Key resources table
| Reagent type (species) or resource | Designation | Source or reference | Identifiers | Additional information |
|---|---|---|---|---|
| Strain, strain background (Saccharomyces cerevisiae) | MATa his3-∆1 leu2-∆0 met15∆0 ura3∆0 | Research Genetics | BY4741 | |
| Strain, strain background (Saccharomyces cerevisiae) | MATa gcn4::kanMX4 his3∆1 leu2∆0 met15∆0 ura3∆0 | Research Genetics | 249 | |
| Strain, strain background (Saccharomyces cerevisiae) | MATa his3∆1 leu2∆0 met15∆0 ura3∆0 tma64∆::kanMX4 | Research Genetics | 4051 | |
| Strain, strain background (Saccharomyces cerevisiae) | MATa his3∆1 leu2∆0 met15∆0 ura3∆0 tma22∆::kanMX4 | Research Genetics | 6812 | |
| Strain, strain background (Saccharomyces cerevisiae) | MATa his3∆1 leu2∆0 met15∆0 ura3∆0 tma20∆::kanMX4 | Research Genetics | 328 | |
| Strain, strain background (Saccharomyces cerevisiae) | MATa his3∆1 leu2∆0 met15∆0 ura3∆0 tma64∆::hygMX4 tma20∆::kanMX4 | Young et al., 2018 | H4520 | |
| Strain, strain background (Saccharomyces cerevisiae) | MATa his3∆1 leu2∆0 met15∆0 ura3∆0 tma64∆::hygMX4 tma20∆::kanMX5 | Young et al., 2018 | H4521 | |
| Strain, strain background (Saccharomyces cerevisiae) | MATa ura3-52 trp1-∆63 leu2-3,−112 his4-303 | Valásek et al., 2004 | H2994 | |
| Strain, strain background (Saccharomyces cerevisiae) | MATa ura3-52 leu2-3 leu2-112 trp1-∆63 his4-303(AUU) kanMX6::PGAL1-RPS26A rps26b∆::hphMX6 | This study | JVY09 | |
| Recombinant DNA reagent | FLUC reporter with 70nt synthetic 5'UTR with (CAA)n repeats in YCplac33 | Sen et al., 2016 | FJZ526 | Plasmid |
| Recombinant DNA reagent | FLUC reporter with cap-proximal SL with ∆G of −10.5 kcal/mol in synthetic 5’UTR in YCplac33 | Sen et al., 2016 | FJZ683 | Plasmid |
| Recombinant DNA reagent | FLUC reporter with cap-proximal SL with ∆G of −5.7 kcal/mol in synthetic 5’UTR in YCplac33 | Sen et al., 2016 | FJZ685 | Plasmid |
| Recombinant DNA reagent | FLUC reporter with cap-distal SL with ∆G of −10.5 kcal/mol in synthetic 5’UTR in YCplac33 | Sen et al., 2016 | FJZ688 | Plasmid |
| Recombinant DNA reagent | FLUC reporter with cap-distal SL with ∆G of −5.7 kcal/mol in synthetic 5’UTR in YCplac33 | Sen et al., 2016 | FJZ690 | Plasmid |
| Recombinant DNA reagent | GCN4-lacZ (uORFs1-4) in YCp50 | Hinnebusch, 1985 | p180 | Plasmid |
| Chemical compound, drug | Cycloheximide | Sigma | Cat# C7698 | |
| Chemical compound, drug | Complete EDTA-free Protease Inhibitor cocktail Tablet | Roche | Cat# 1873580001 | |
| Chemical compound, drug | Sulfometuron Methyl | CHEM SERVICE | Cat# PS-1074 | |
| Other | RNase I | Ambion | Cat# AM2294 | enzyme |
| Other | T4 RNA ligase 2 | New England Biolabs | Cat# M0242L | enzyme |
| Other | T4 Polynucleotide kinase | New England Biolabs | Cat# M0201L | enzyme |
| Other | Superscript III | Invitrogen | Cat# 18080044 | enzyme |
| Other | Circ Ligase ssDNA Ligase | Epicentre | Cat# CL4111K | enzyme |
| Other | T4 Rnl2(tr) K227Q | New England Biolabs | Cat# M0351S | enzyme |
| Other | RecJ exonuclease | Epicentre | Cat# RJ411250 | enzyme |
| Other | Yeast 5’-deadenylase | New England Biolabs | Cat# M0331S | enzyme |
| Other | Protoscript II | New England Biolabs | Cat# M0368L | enzyme |
| Other | CircLigase II | Epicentre | Cat# CL9025K | enzyme |
| Other | Phusion polymerase (F-530) | New England Biolabs | Cat# M0530S | enzyme |
| Other | GlycoBlue | Invitrogen | Cat# AM9516 | Blue dye covalently linked to glycogen |
| Commercial assay, kit | fragmentation reagent | Ambion | Cat# AM8740 | |
| Commercial assay, kit | miRNeasy Mini Kit | Qiagen | Cat# 217004 | |
| Commercial assay, kit | Ribo-Zero Gold rRNA Removal Kit | Illumina | Cat# MRZ11124C | |
| Commercial assay, kit | Bioanalyzer using the High Sensitivity DNA Kit | Agilent | Cat# 5067–4626 | |
| Commercial assay, kit | Oligo Clean and Concentrator column | Zymo Research | Cat# D4060 | |
| Other | Notched box-plots | http://shiny.chemgrid.org/boxplotr/ | Web-based tool | |
| Other | Gene ontology analysis | https://biit.cs.ut.ee/gprofiler/gost | Web-based tool | |
| Other | Spearman’s correlation calculator | https://www.wessa.net/rwasp | Web-based tool | |
| Software, algorithm | ggplot2, R package | https://cran.r-project.org/web/packages/ggplot2/index.html | ||
| Software, algorithm | GeneOverlap, R package | https://www.bioconductor.org/packages/release/bioc/html/GeneOverlap.html | ||
| Software, algorithm | Bowtie | Langmead et al., 2009 | ||
| Software, algorithm | TopHat | Trapnell et al., 2009 | ||
| Software, algorithm | Hisat2 | https://github.com/DaehwanKimLab/hisat2 | ||
| Software, algorithm | R script for DESeq2, R package | https://github.com/hzhanghenry/RiboProR | ||
| Software, algorithm | Integrative Genomics Viewer | Robinson et al., 2011 | ||
| Software, algorithm | Weblogo analysis | Crooks et al., 2004 |
Additional files
Download links
A two-part list of links to download the article, or parts of the article, in various formats.
Downloads (link to download the article as PDF)
Open citations (links to open the citations from this article in various online reference manager services)
Cite this article (links to download the citations from this article in formats compatible with various reference manager tools)
Reprogramming of translation in yeast cells impaired for ribosome recycling favors short, efficiently translated mRNAs
eLife 10:e64283.
https://doi.org/10.7554/eLife.64283


