Age and diet shape the genetic architecture of body weight in diversity outbred mice
- Calico Life Sciences LLC, United States
- The Jackson Laboratory, United States
Figures
Figure 1 with 1 supplement
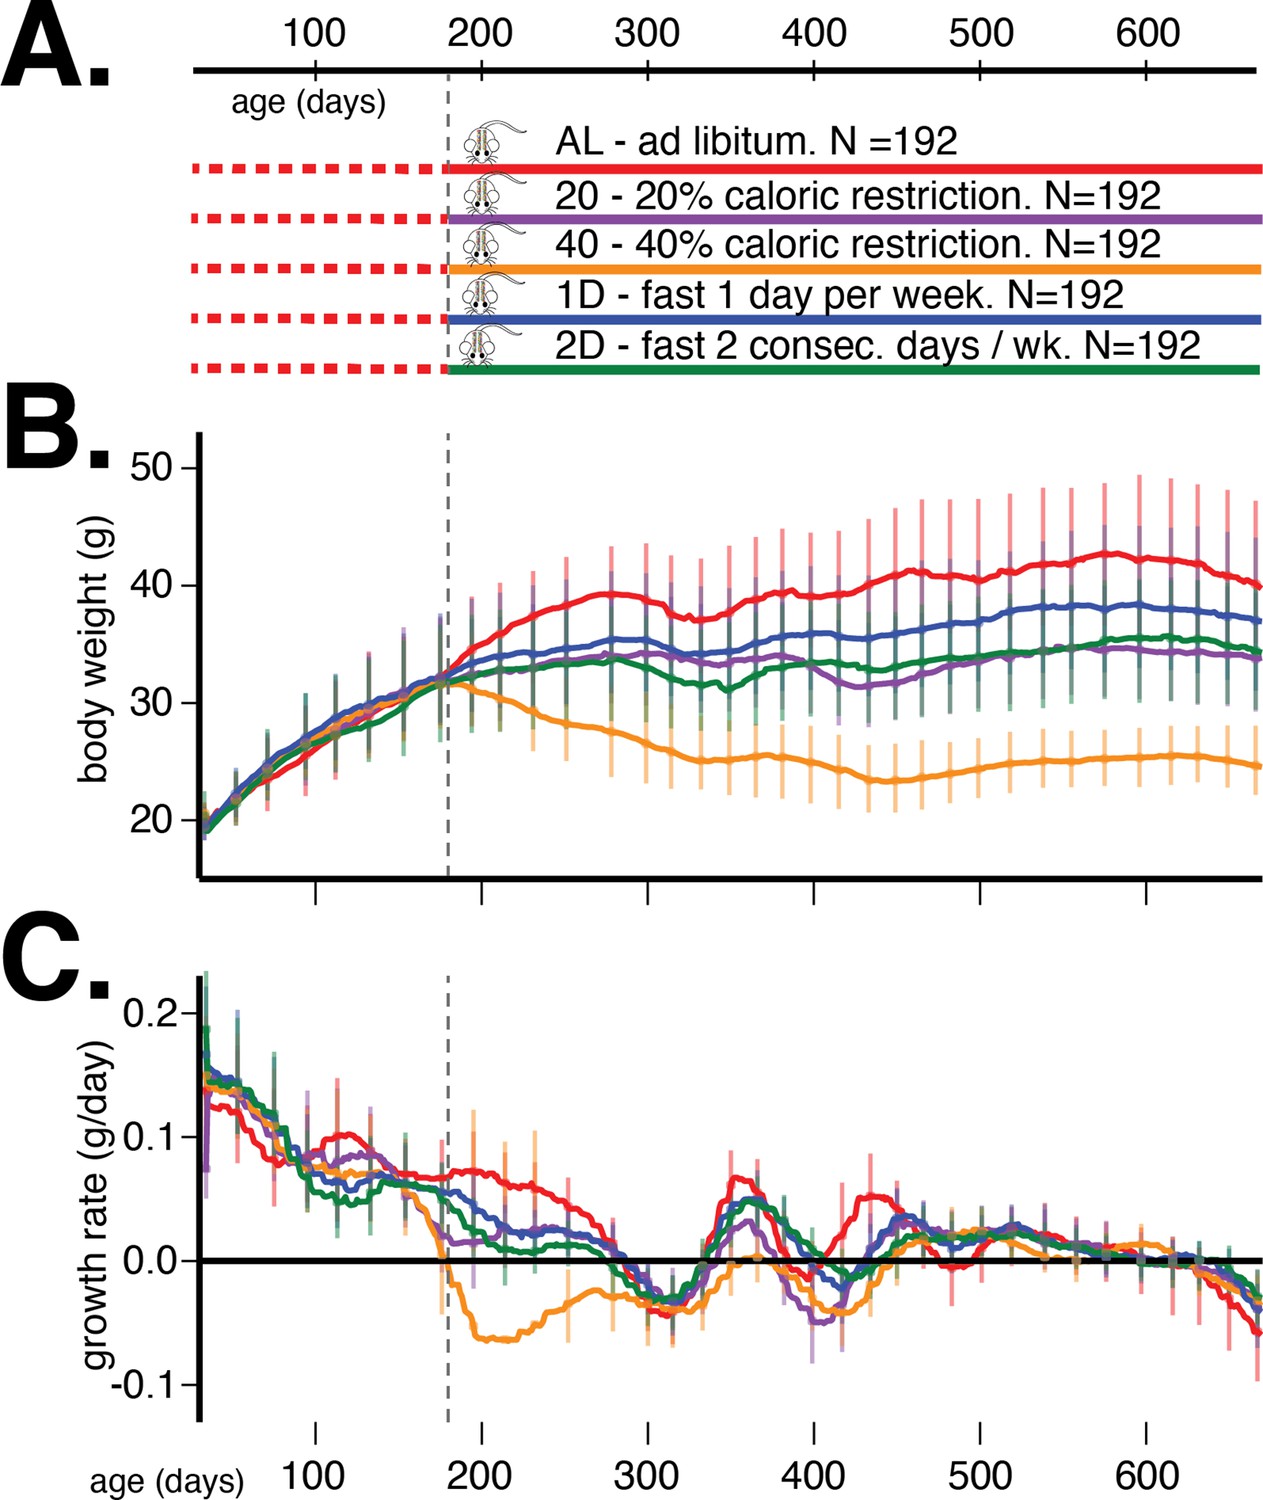
Study design and body weight data summaries.
(A) Outline of study design. (B) Median (interquartile range) body weight in grams and (C) median (interquartile range) growth rate in grams per day for five dietary treatments from 60 to 660 days of age. Vertical gray dotted line denotes the onset of dietary intervention at 180 days of age.
Figure 1—figure supplement 1
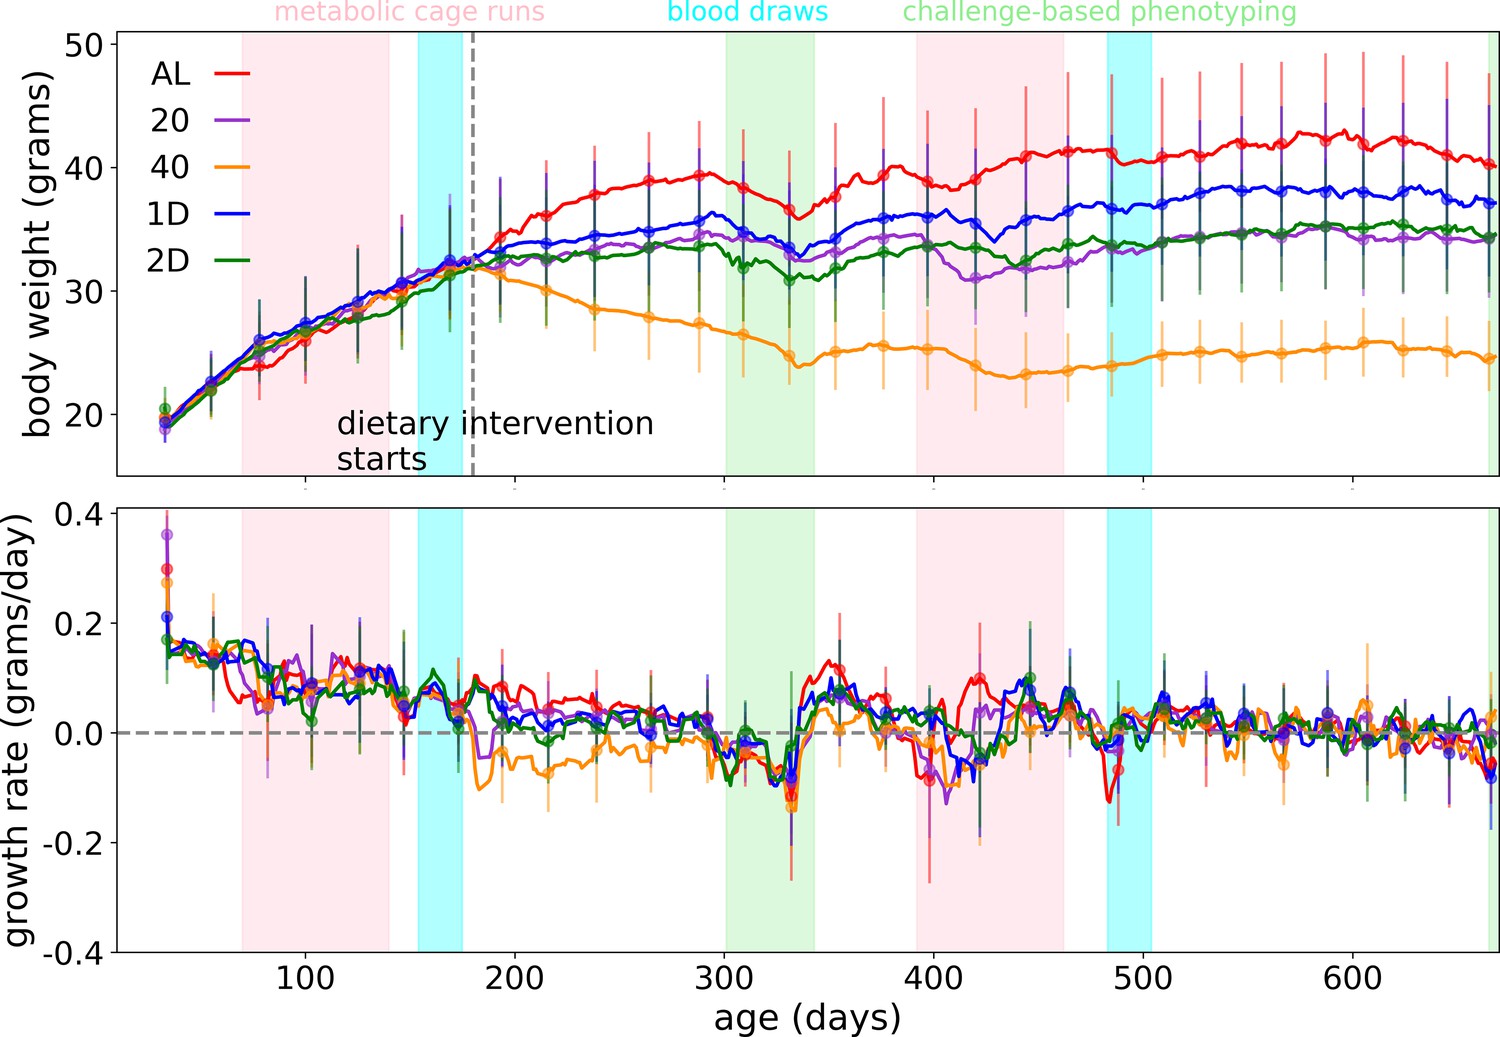
Raw phenotype measurements.
Body weight and growth rate trends as a function of age. Mice in this study also underwent an array of phenotyping procedures; the age range for metabolic cage phenotyping is highlighted in pink, the age range for blood draws is highlighted in blue, and the age range for a battery of challenge-based phenotyping procedures is highlighted in green.
Figure 2
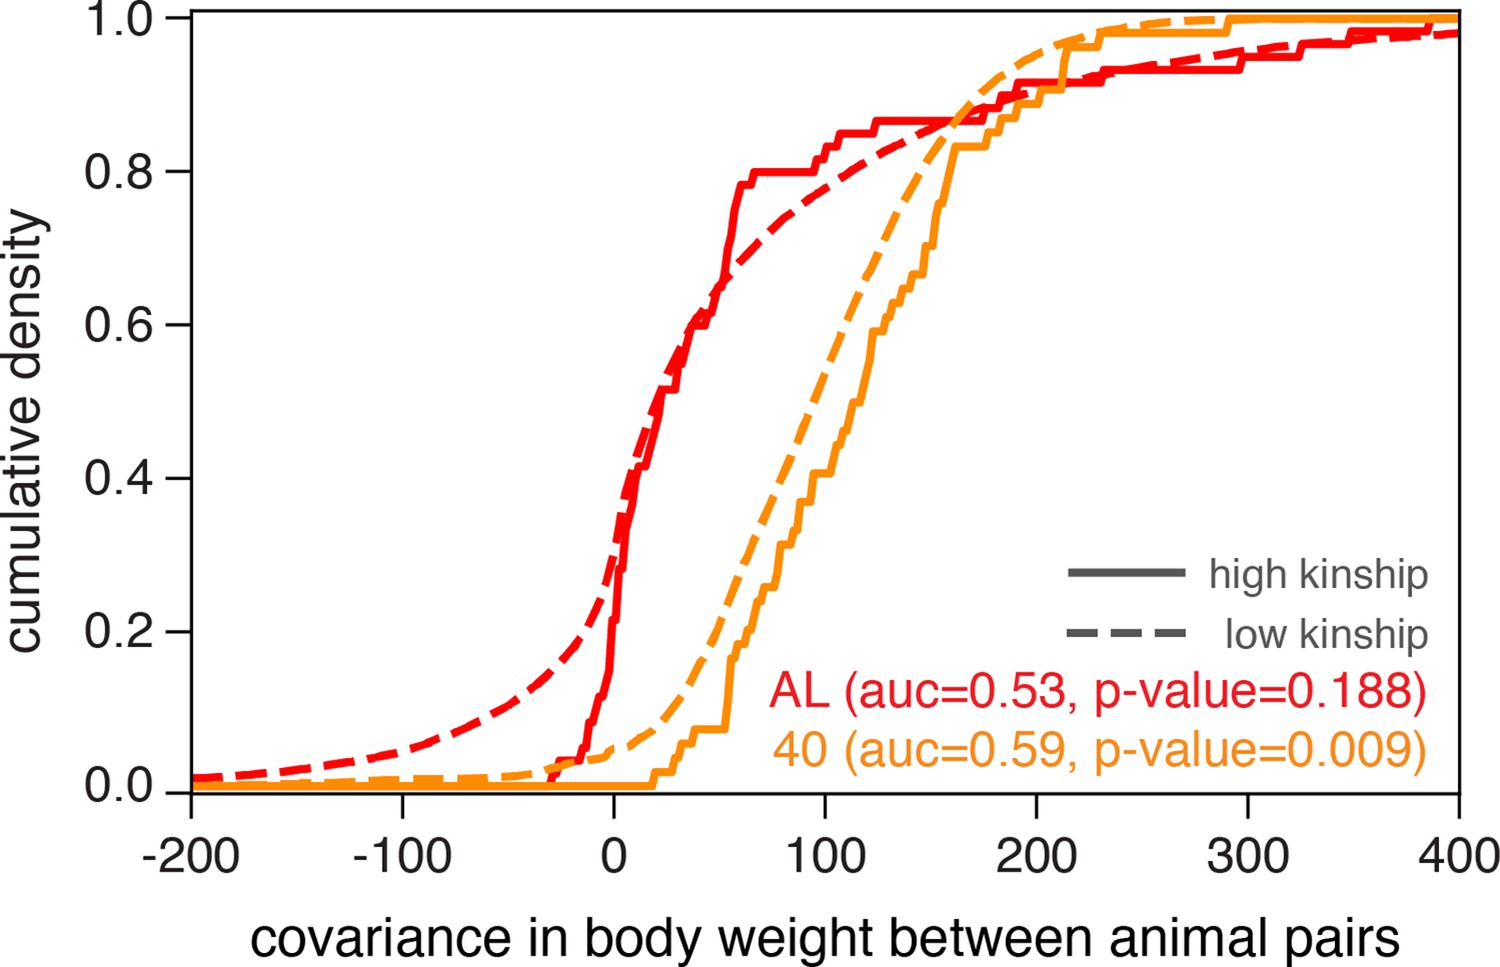
Illustrating diet-dependent association between genetic and phenotypic similarities.
Phenotypic divergence between animal pairs is quantified by the covariance in body weight at 500 days of age. We plot the cumulative density of body weight covariance for all pairs of animals in the ad libitum (AL) and 40% calorie restriction (CR) dietary treatments, partitioned into high-kinship (>0.2) or low-kinship groups. We test for separability between the high- and low-kinship distributions using the Mann–Whitney U test, and report p-values from this test. The reported area under the curve (AUC) is a standard transformation of the Mann-Whitney U test statistic.
Figure 3
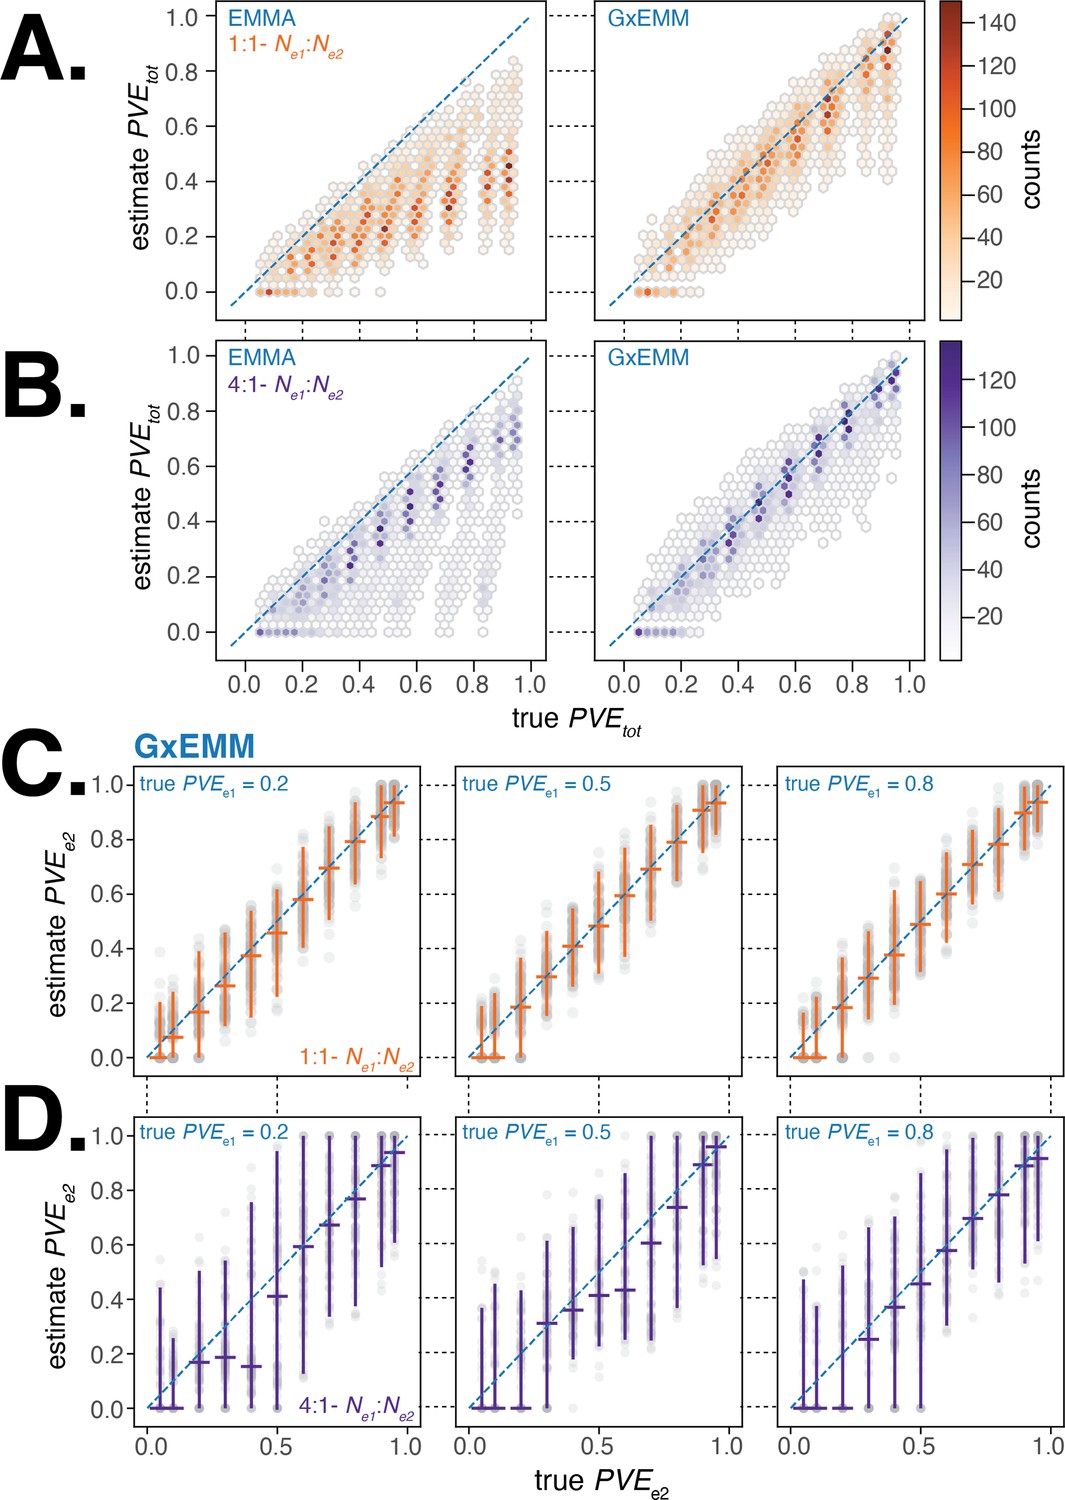
Evaluating gene–environment mixed mode (G×EMM) and EMMA using simulated datasets.
(A). Comparison of true to that estimated from EMMA (left panel) and G×EMM (right panel). Simulations were run with an equal number of samples in each environment () and with the same value for the environment-specific error terms (). (B). Same as (A) but with a 4:1 ratio of samples between environments (). (C). Plot of the true vs. the G×EMM estimate of . Gray points are the results of individual simulations, orange lines denote the median and 95% interquartile range (IQR). The three panels differ in the true proportion of phenotypic variance explained by genetics (PVE) specific to environment 1, . Simulations were run with an equal number of samples in each environment () and with the same value for the environment-specific error terms (). (D). Same as (C) but with a 4:1 ratio of samples between environments ().
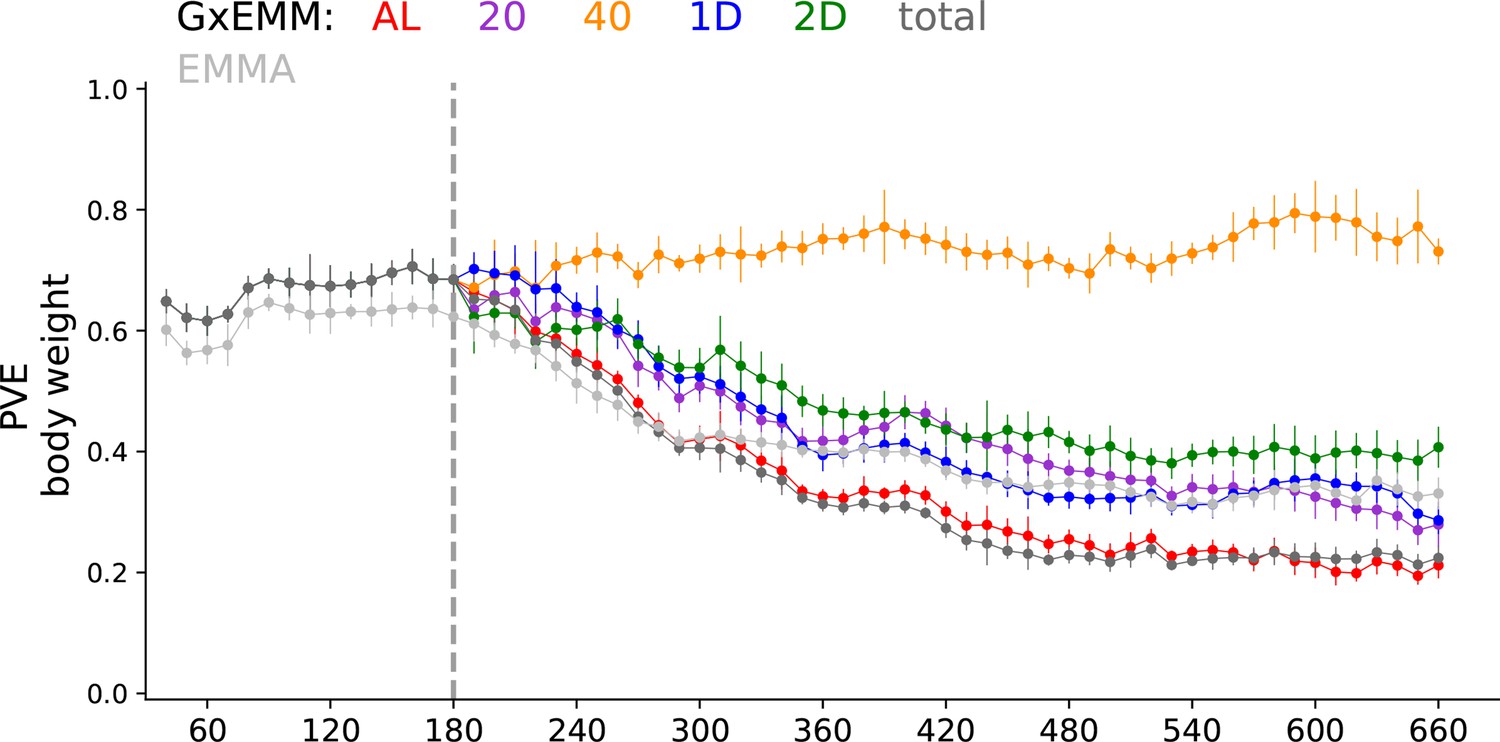
Figure 4 with 6 supplements
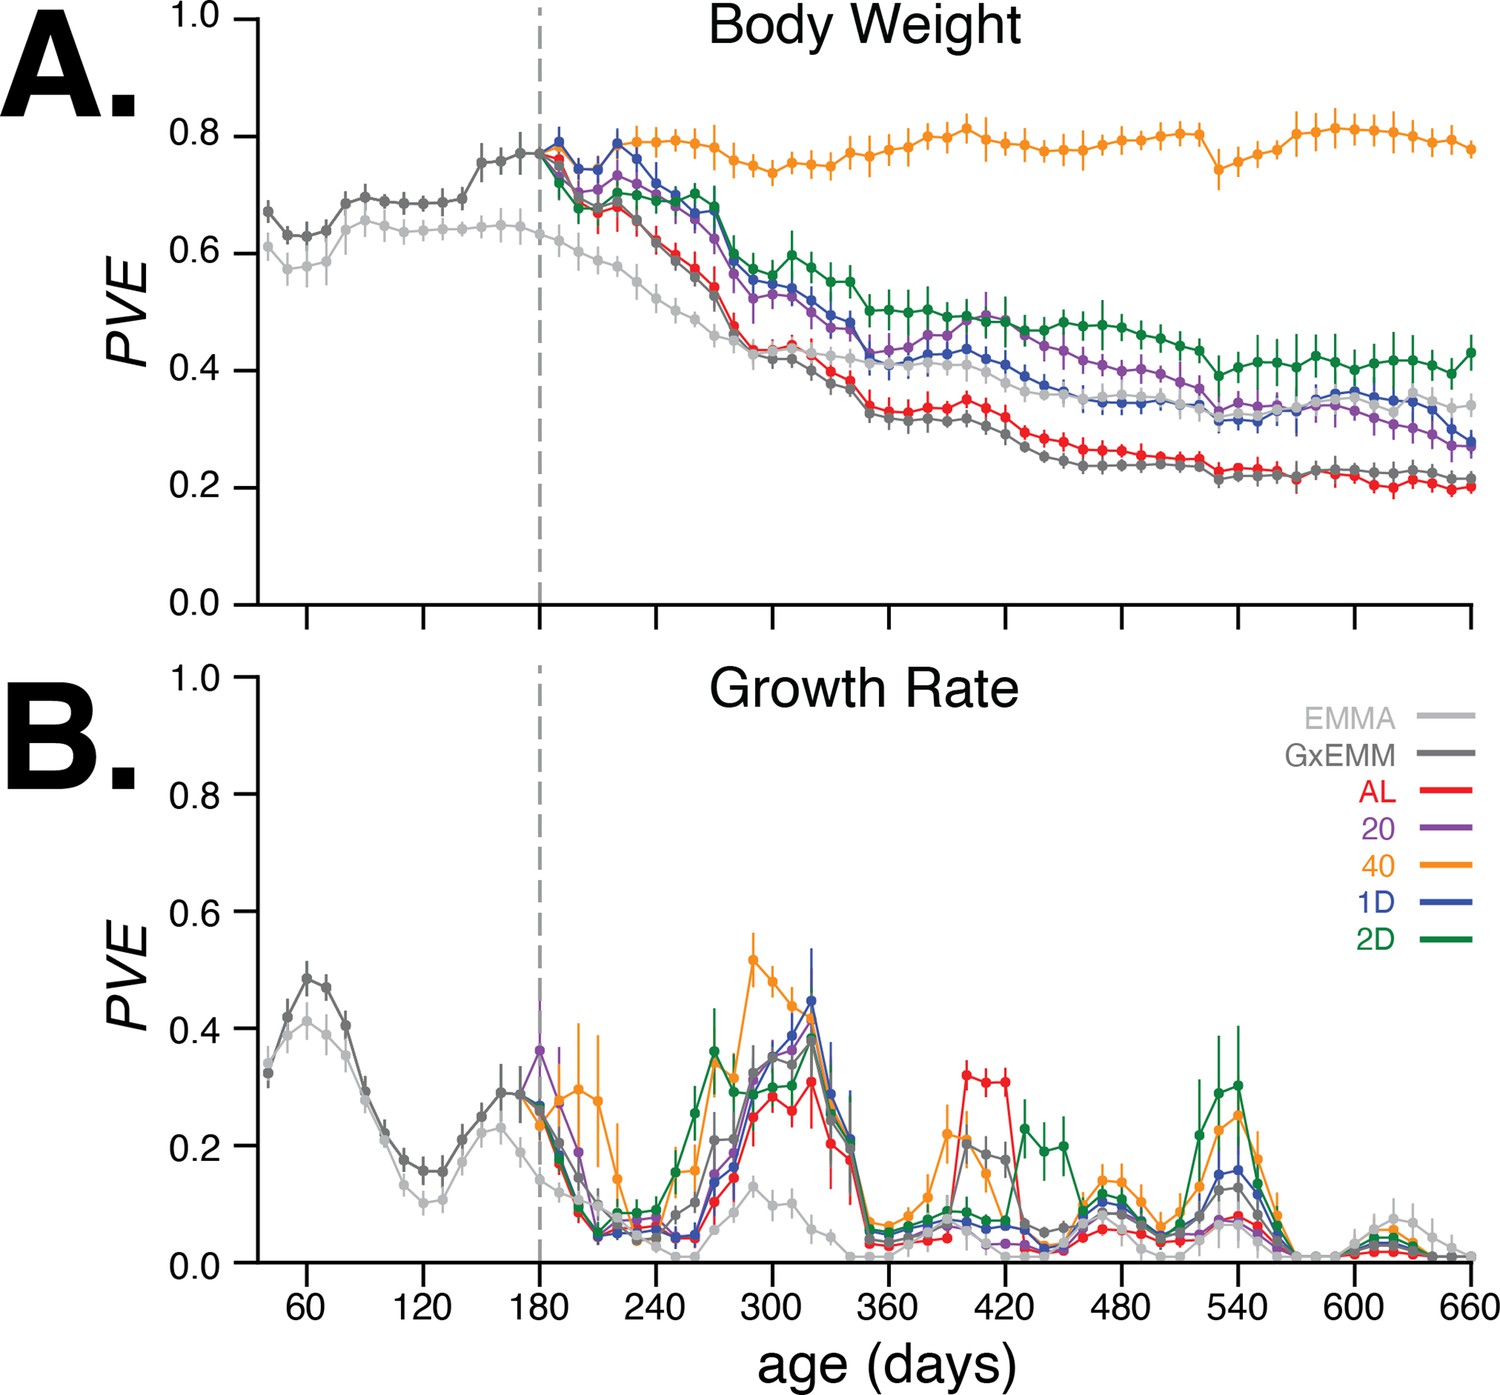
Proportion of phenotypic variance explained by genetics.
(A) Body weight proportion of phenotypic variance explained by genetics (PVE) (± SE) for 30–660 days of age. Total PVE estimates are derived from the EMMA (light gray) and gene–environment mixed mode (G×EMM) (dark gray) models. Diet-dependent PVE values were derived from the G×EMM model. Dotted vertical line at 180 days depicts the time at which all animals were switched to their assigned diets. (B) Growth rate PVE; details the same as (A).
Figure 4—figure supplement 1
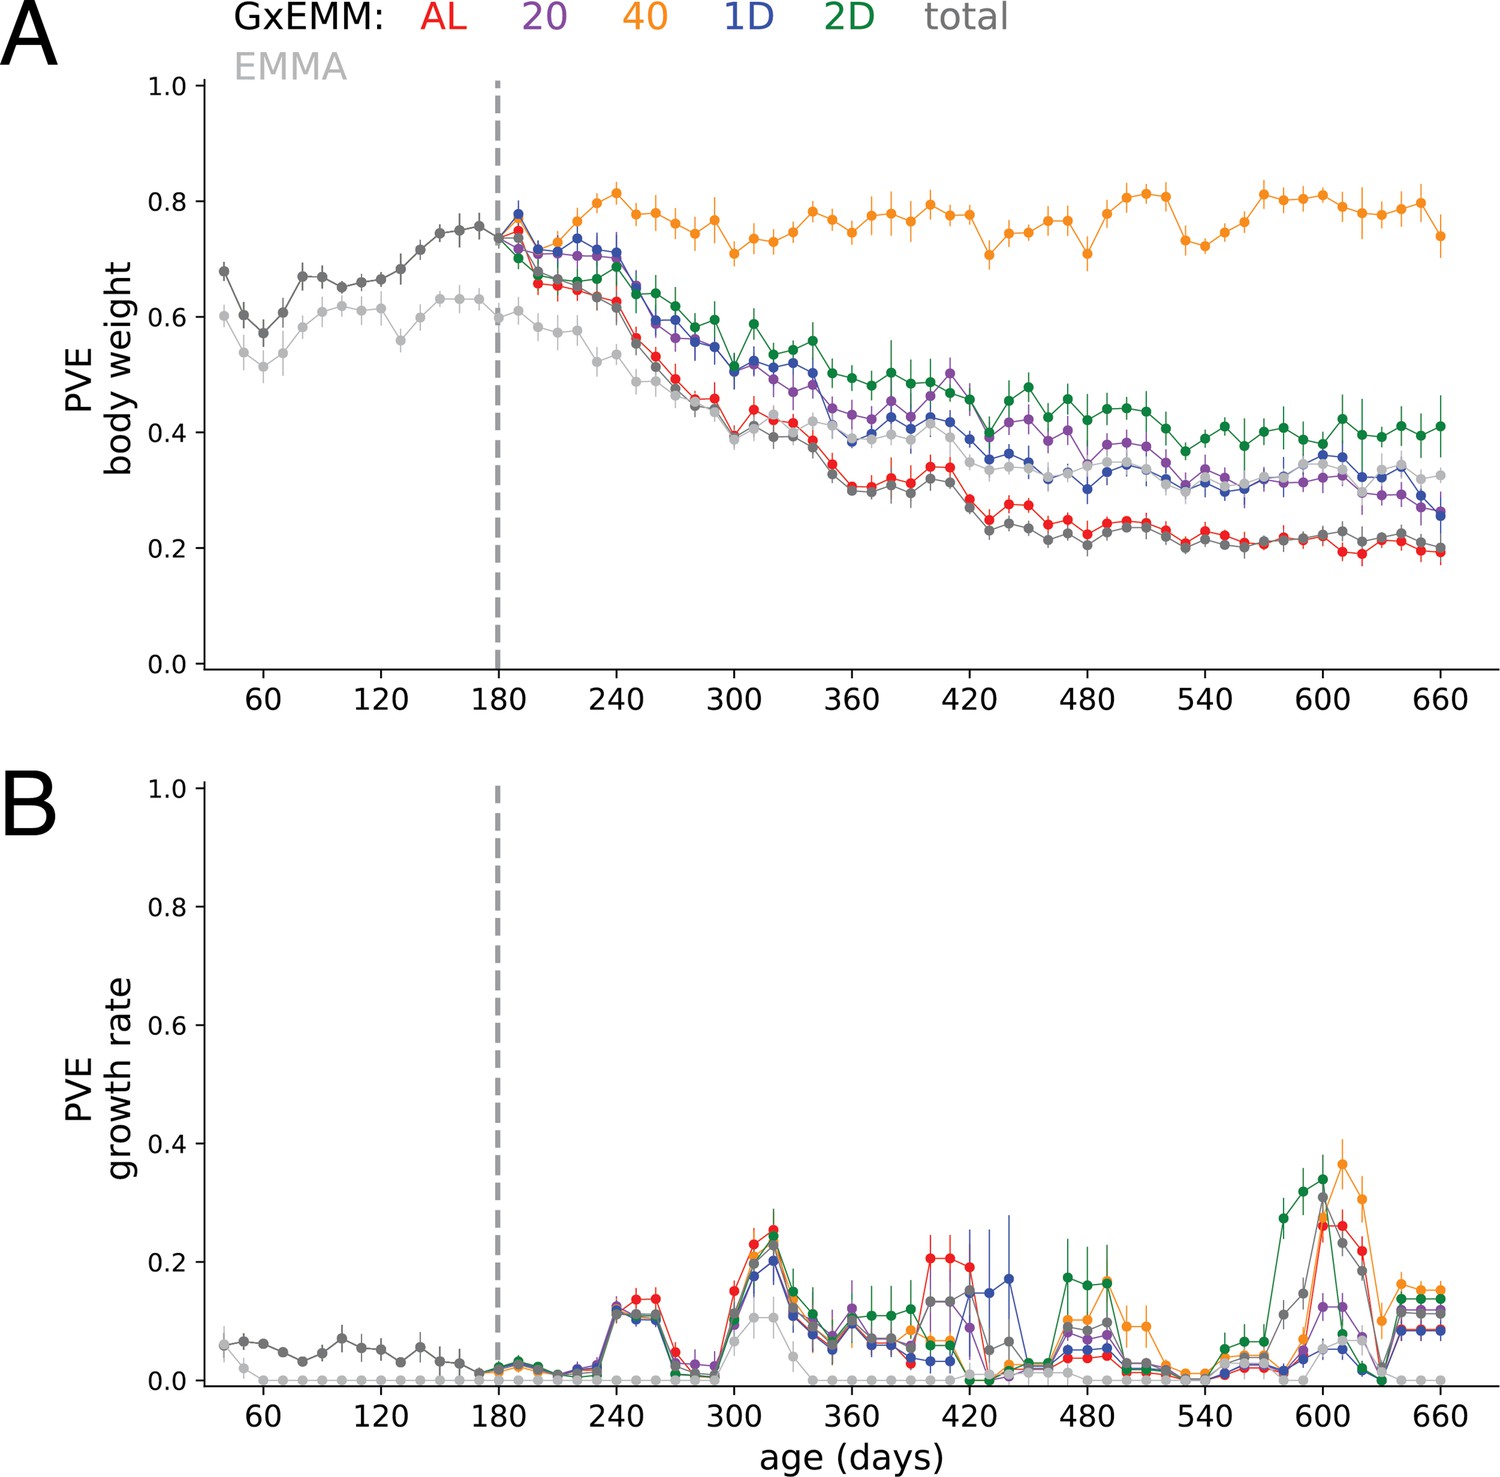
Proportion of phenotypic variance explained by genetics (PVE) using raw measurements.
PVE (±SE) of (A) Body weight and (B) growth rate, estimated using raw body weight measurements.
Figure 4—figure supplement 2
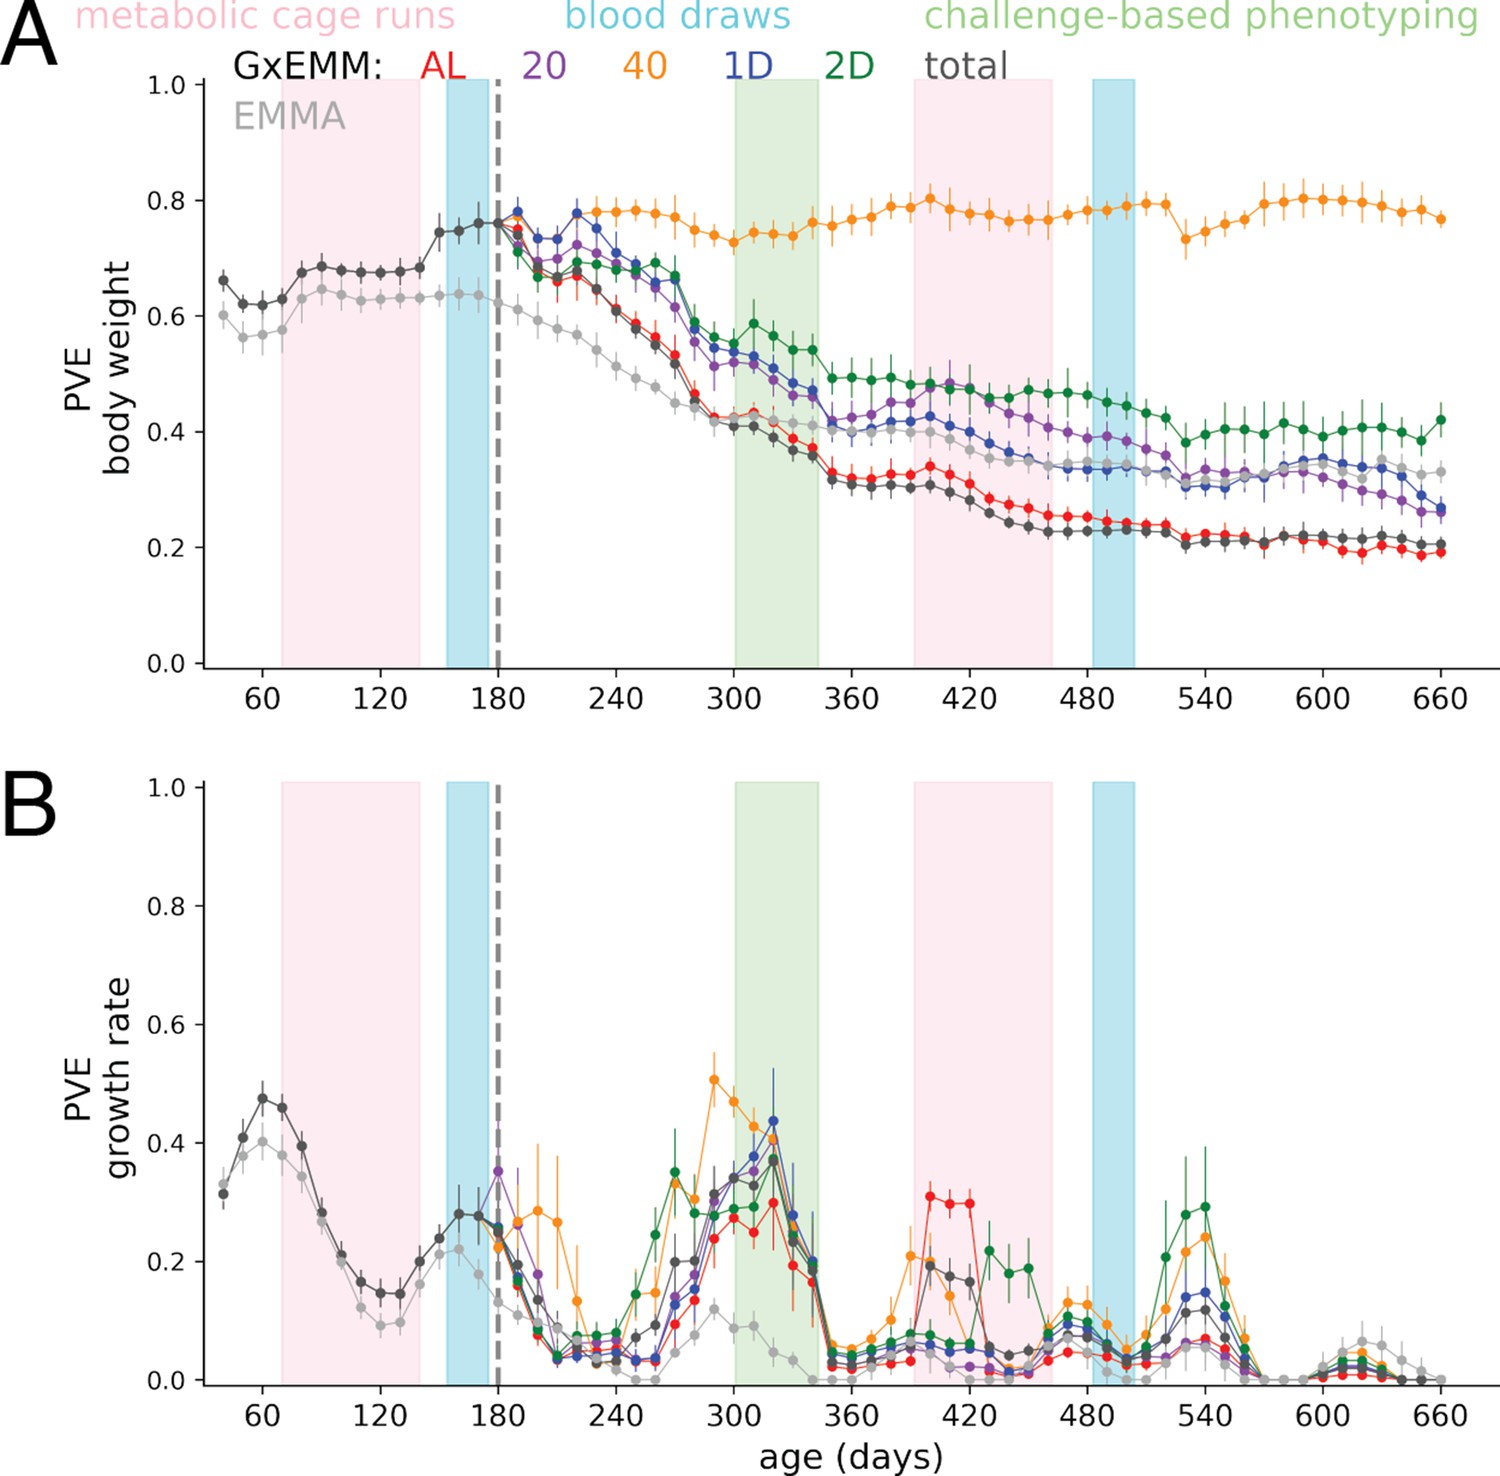
Proportion of phenotypic variance explained by genetics (PVE) overlayed with phenotyping.
PVE (± SE) of (A) Body weight and (B) growth rate, overlayed with the timing of bouts of phenotyping.
Figure 4—figure supplement 3
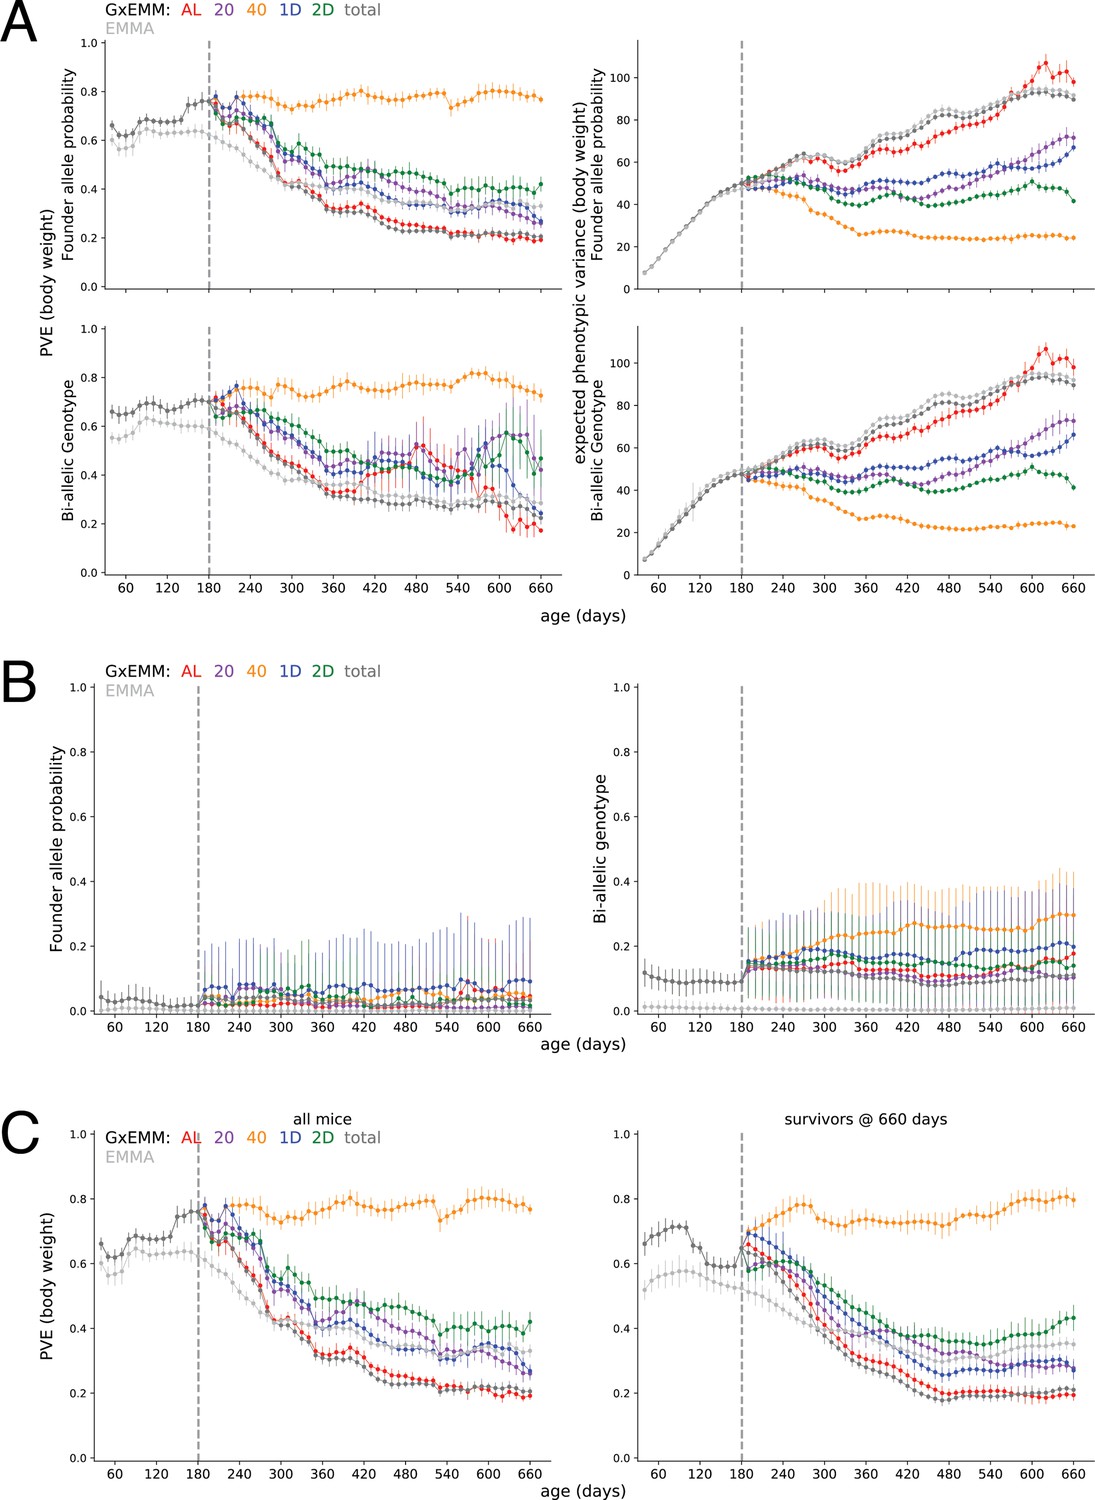
Sensitivity of proportion of phenotypic variance explained by genetics (PVE).
(A) PVE (± SE) (left column) and expected phenotypic variance (±SE) (right column) estimated using kinship calculated from founder-of-origin allele probabilities (top row) and biallelic genotypes (bottom row). (B) PVE (±SE) estimated using kinship calculated from founder-of-origin allele probabilities (left column) and biallelic genotypes (right column), after randomly permuting body weight trajectories across mice, within each dietary intervention. (C) PVE (±SE) estimated using all mice in the study (left column) and mice that survived to 660 days of age (right column).
Figure 4—figure supplement 4
Proportion of phenotypic variance explained by genetics (PVE) with no constraints on variance components.
PVE (±SE) of body weight was estimated without imposing any non-negativity constraints on the variance components in the gene–environment mixed mode (G×EMM) model.
Figure 4—figure supplement 5
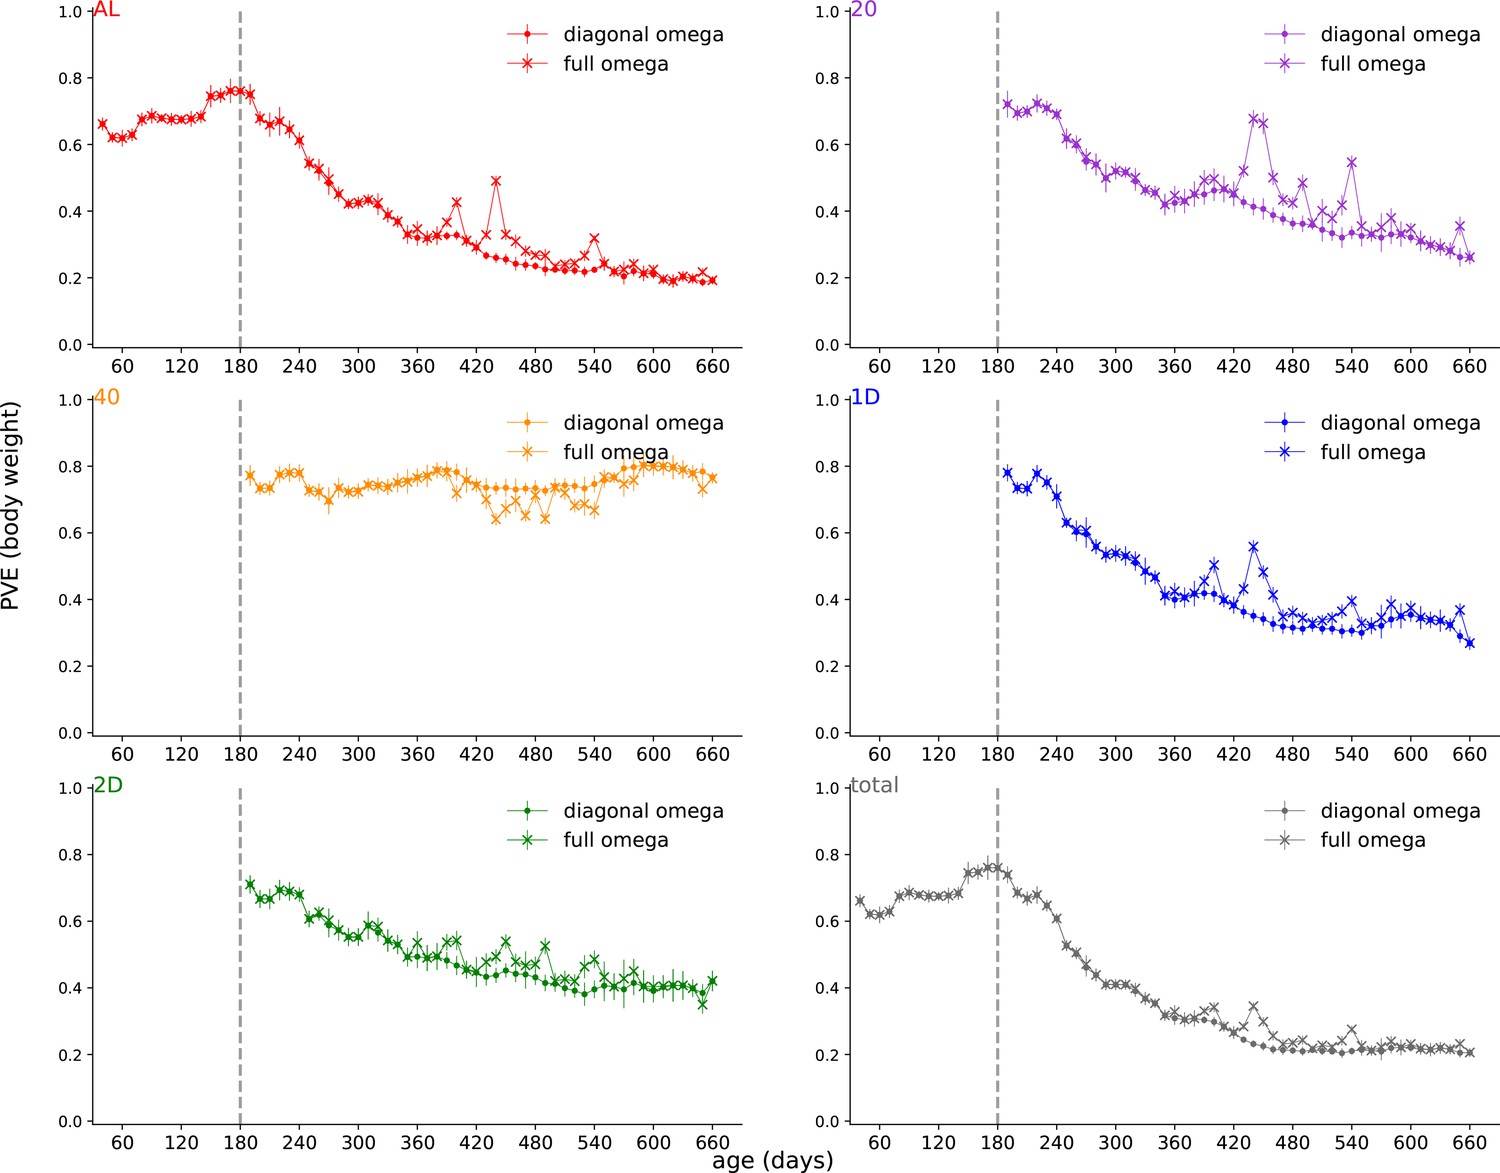
Proportion of phenotypic variance explained by genetics (PVE) comparing full and diagonal .
PVE (± SE) of body weight was estimated with and without a diagonal constraint on .
Figure 4—figure supplement 6
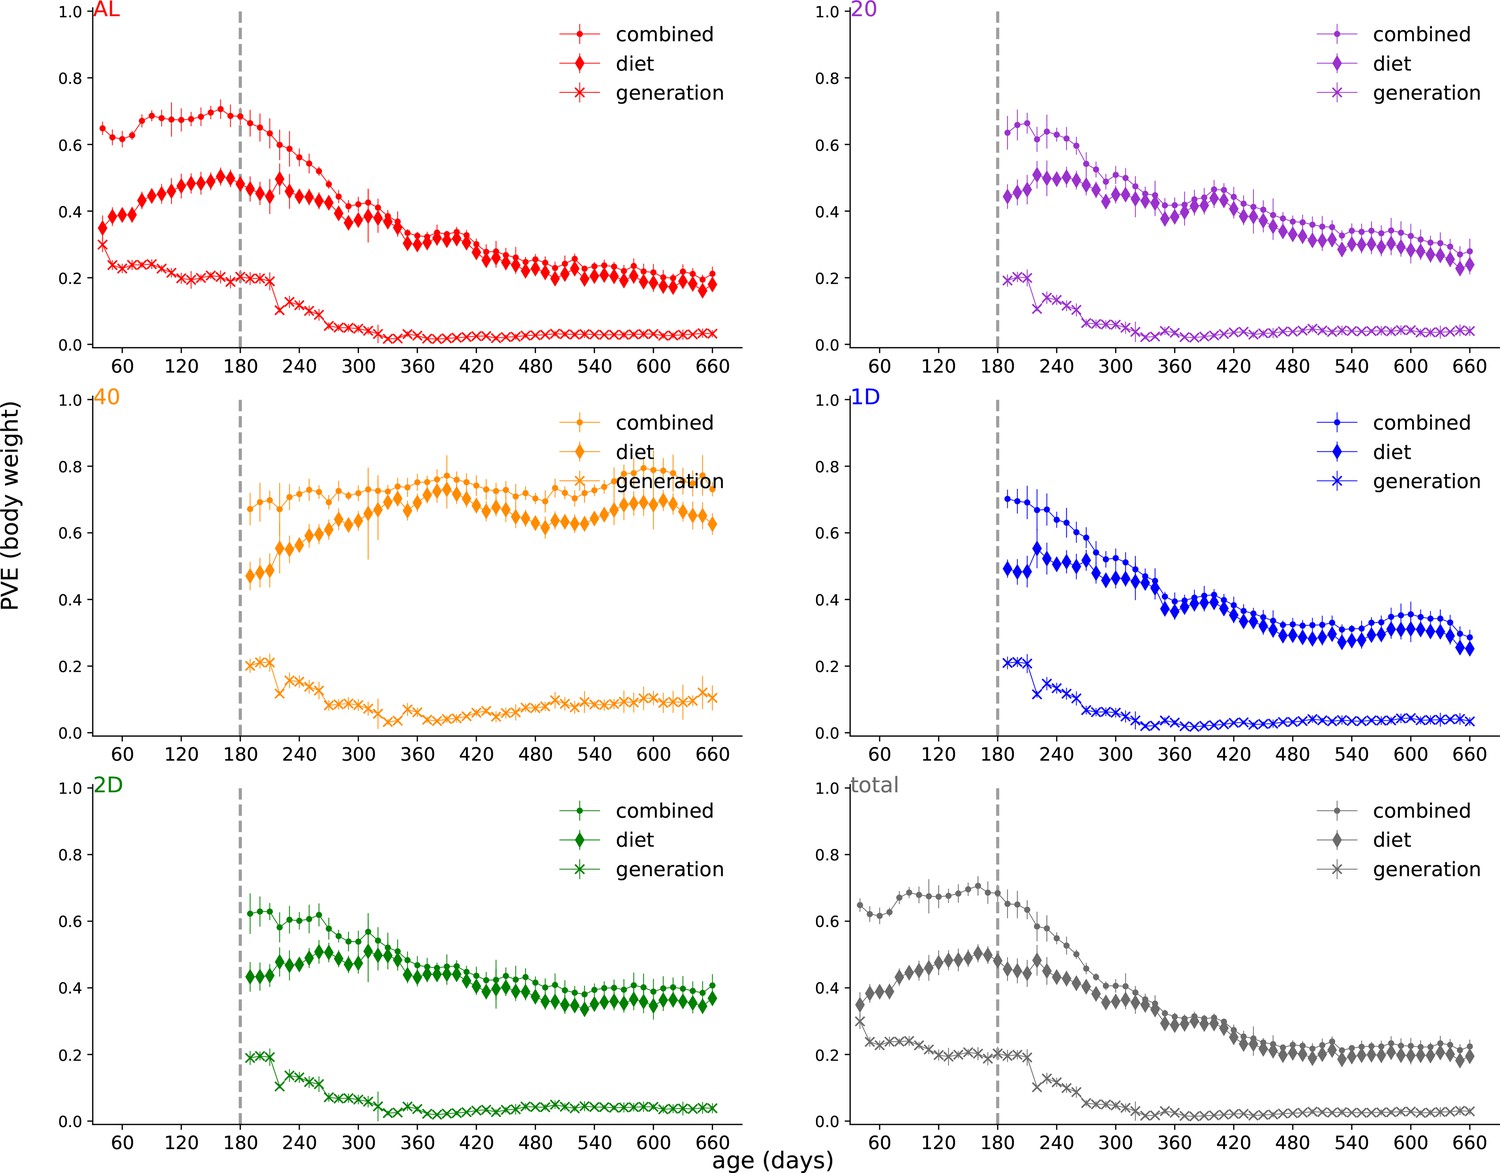
Proportion of phenotypic variance explained by genetics (PVE) decomposition.
Decomposing the total and diet-dependent PVE into contributions from diet terms (diamonds) and contributions from generation terms (x-markers).
Figure 5 with 4 supplements
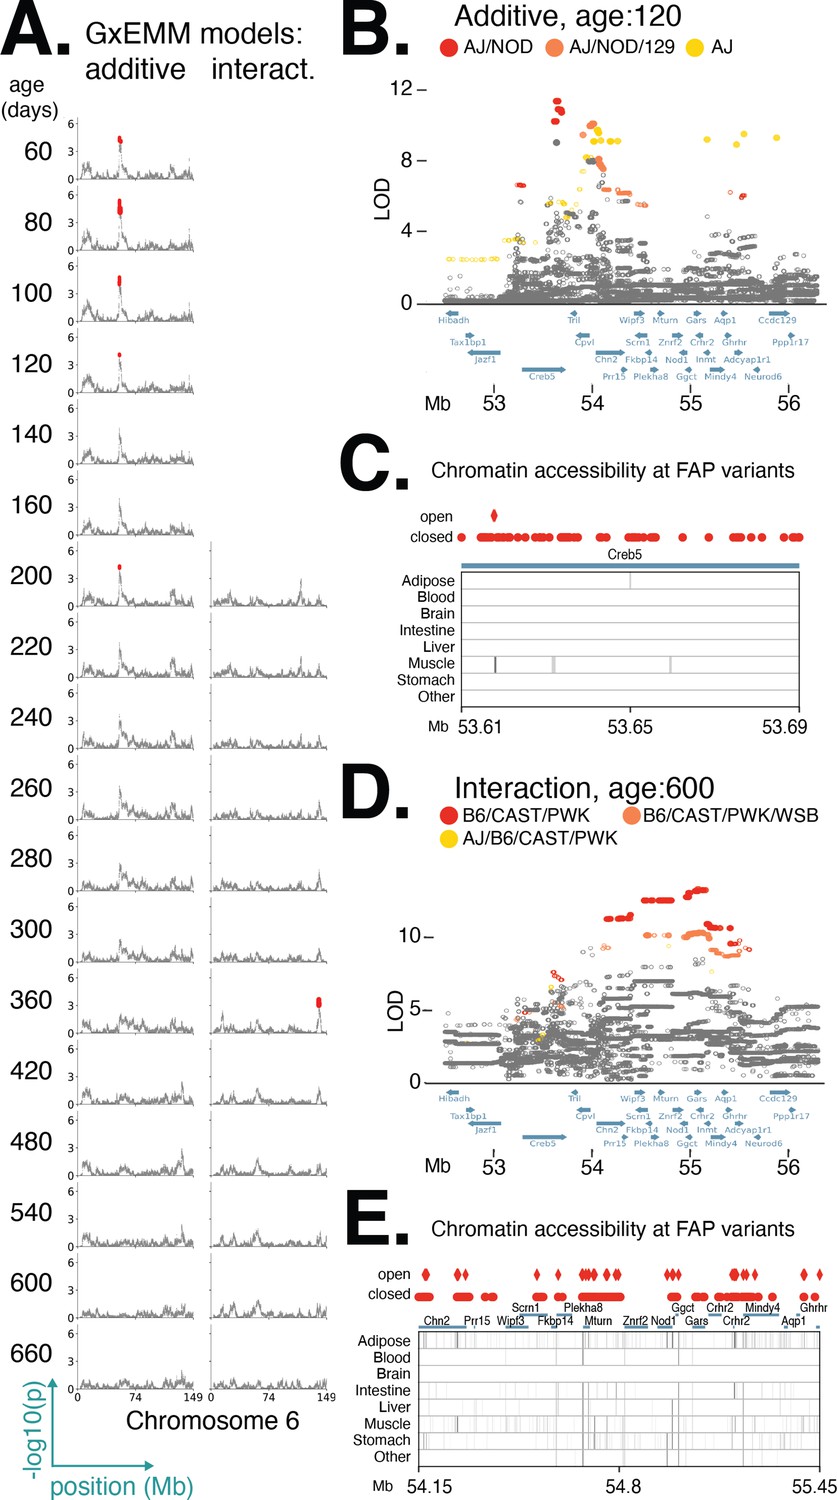
Distinct founder allele patterns (FAPs) contribute to diet-independent and diet-dependent effects on body weight within a region on chromosome 6.
(A) Manhattan plots of additive genetic associations and genotype–diet associations on chromosome 6 at multiple ages. (B, D) Fine-mapping loci associated with body weight: diet-independent association at 120 days of age and diet-dependent association at 600 days of age. Solid circles indicate significant variants. Colors denote variants with shared FAPs; ranks 1, 2, and 3 by logarithm of the odds (LOD) score are colored red, orange, and yellow, respectively. (C, E) Significant variants, colored by their FAP group, along with the gene models (shown in blue) and the tissue-specific activity of regulatory elements near these variants (shown in gray). Significant variants that lie within regulatory elements are highlighted as diamonds, and regulatory elements that contain a significant variant are highlighted in black.
Figure 5—figure supplement 1
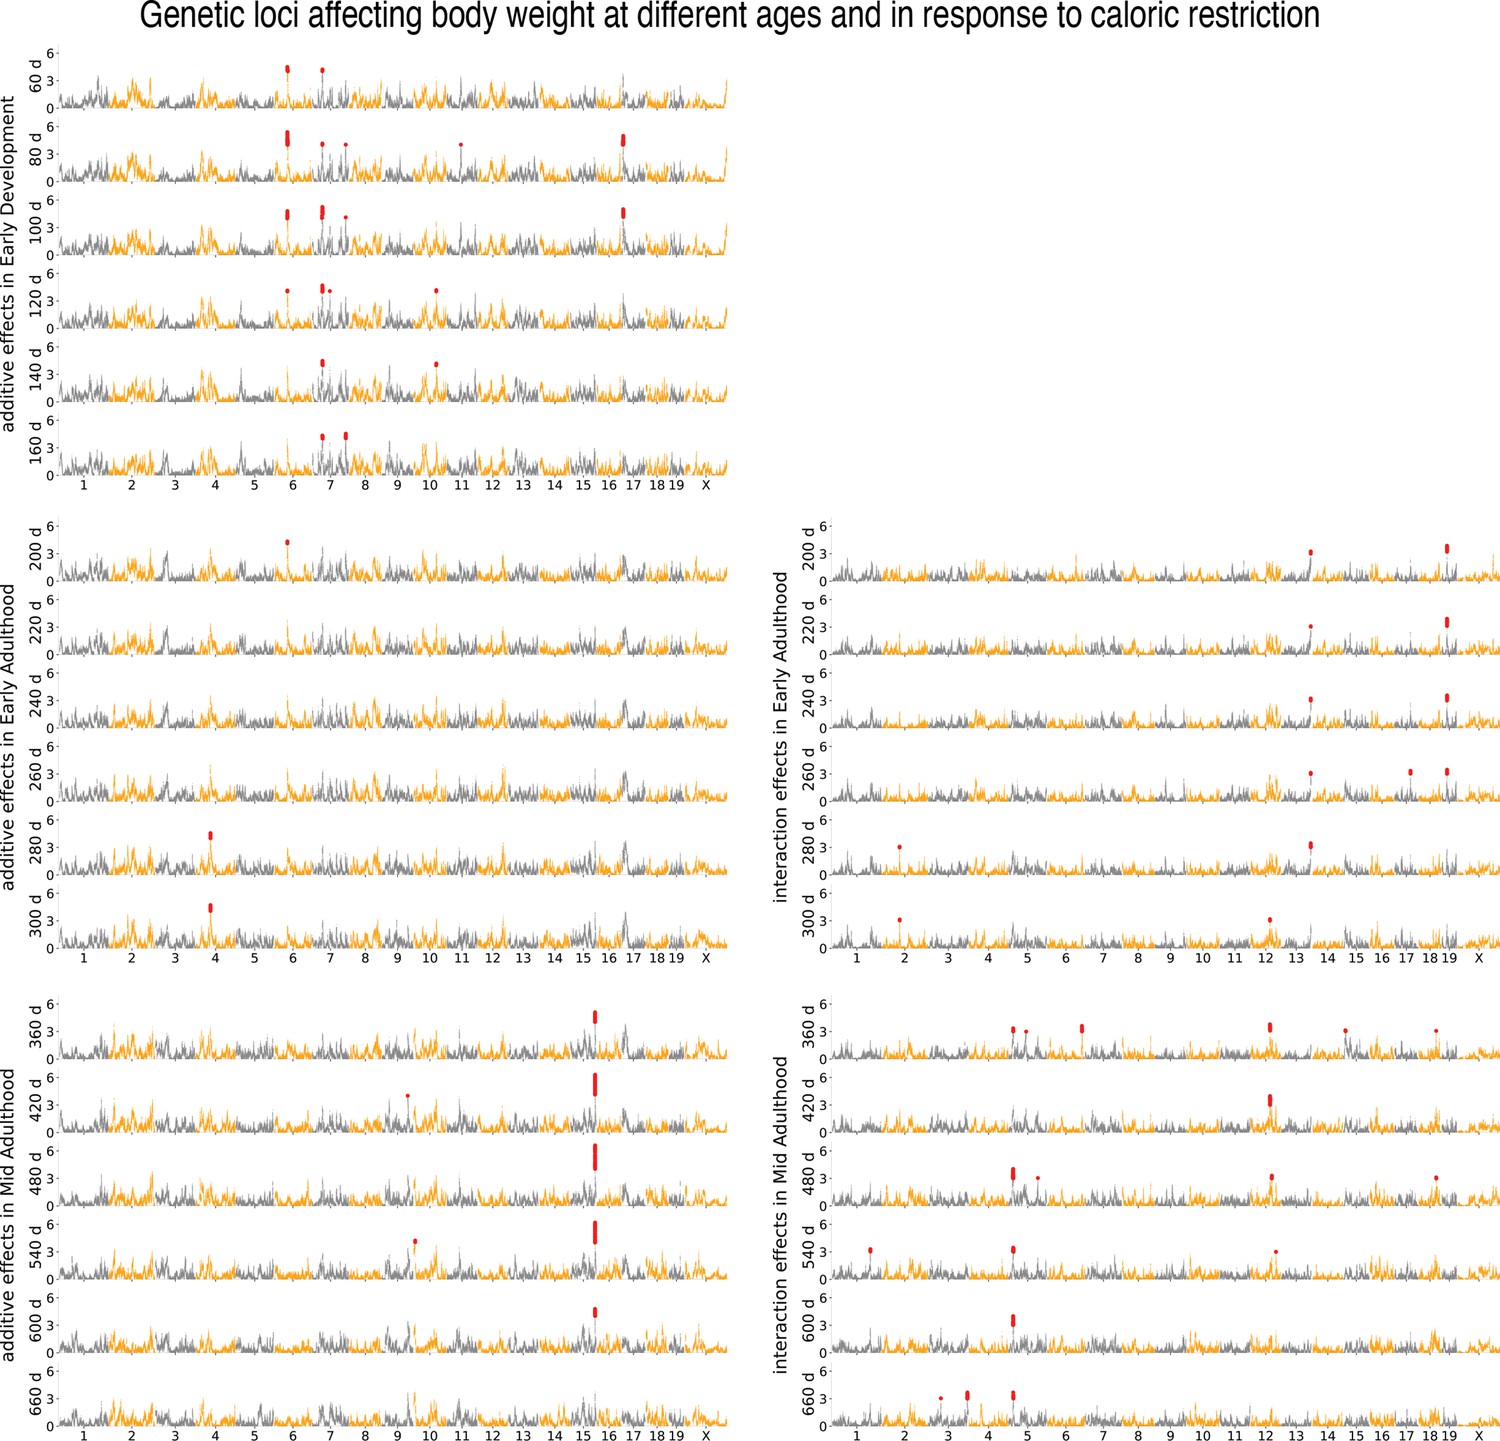
Age- and diet-dependent Manhattan plots for body weight, with gene–environment mixed mode (G×EMM).
Genetic loci associated with body weight, using G×EMM, at different ages identified under the additive genetic model (subpanels on the left) and genotype–diet interaction model (subpanels on the right). Each circle is a genotyped marker, significant markers are in red.
Figure 5—figure supplement 2
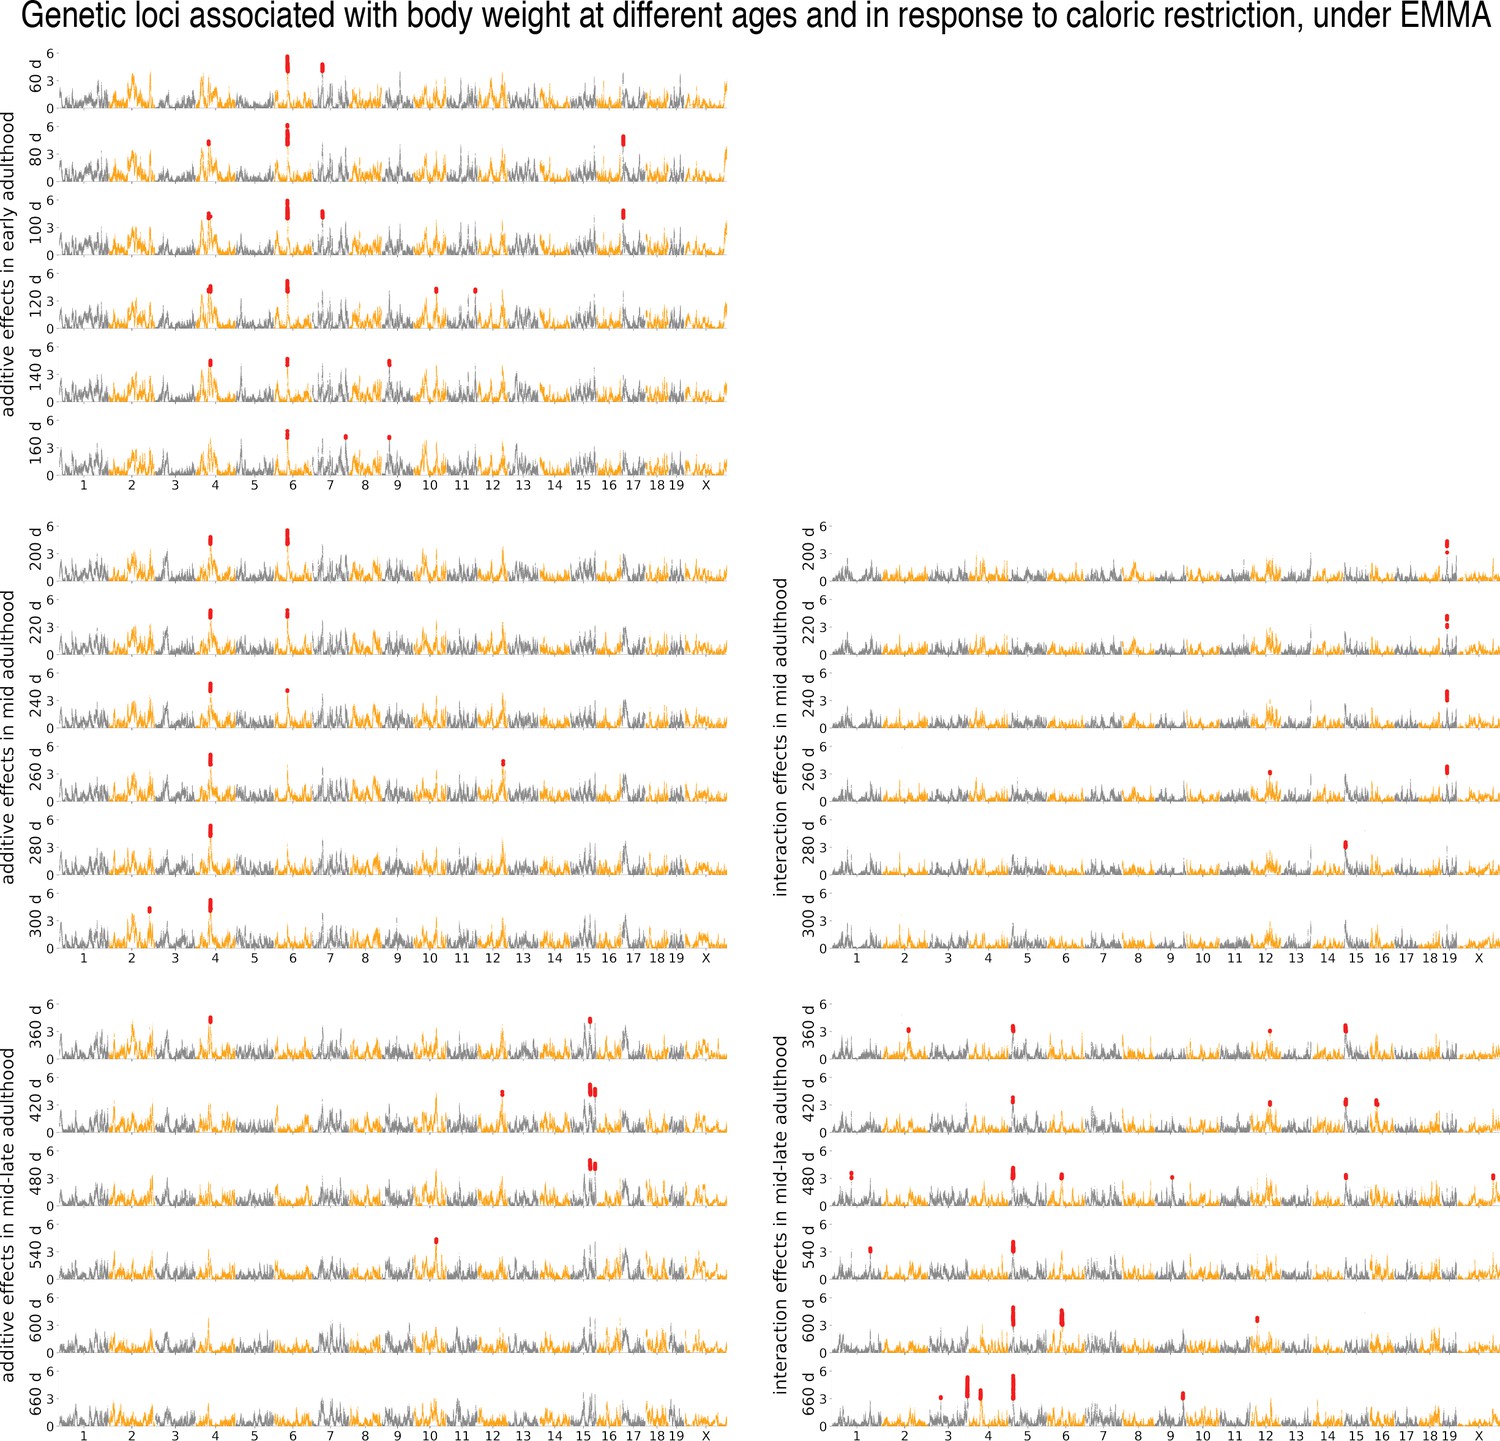
Age- and diet-dependent Manhattan plots for body weight, with EMMA.
Genetic loci associated with body weight, using EMMA, at different ages identified under the additive genetic model (subpanels on the left) and genotype–diet interaction model (subpanels on the right). Each circle is a genotyped marker, significant markers are in red.
Figure 5—figure supplement 3
Loci with significant diet-independent and diet-dependent associations with body weight.
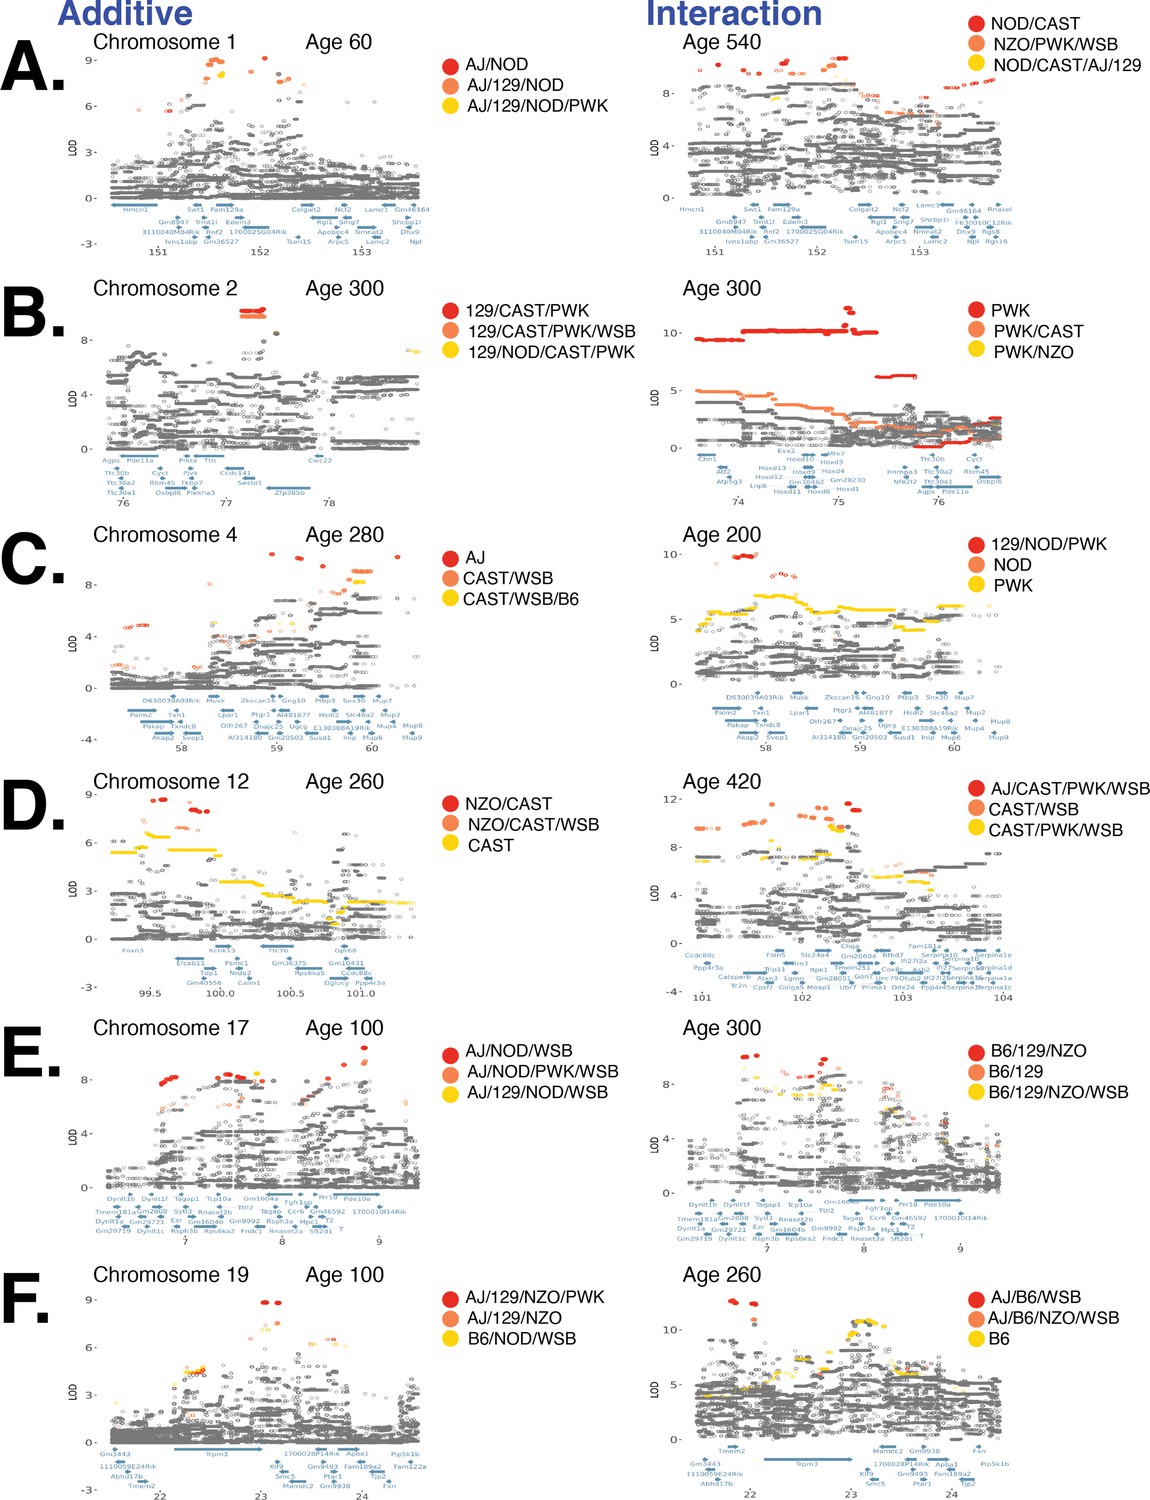
(A) Fine-mapping a locus on chromosome 1 associated with body weight under the additive model (left column) and genotype–diet interaction model (right column). Each circle is a biallelic variant, both imputed and genotyped, and solid circles denote significantly associated variants. Variants are colored according to their founder allele pattern (FAP); FAPs of ranks 1, 2, and 3 (based on logarithm of the odds [LOD] score) are colored red, orange, and yellow, respectively. Panels (B–F) are the same as (A) for loci on chromosomes 2, 4, 12, 17, and 19.
Figure 5—figure supplement 4

Distinct founder allele patterns (FAPs) drive diet-independent and diet-dependent associations with body weight at various loci.
(A) Fine-mapping a locus on chromosome 3 associated with body weight under the additive model (left column) and genotype–diet interaction model (right column). Each circle is a biallelic variant, both imputed and genotyped, and solid circles denote significantly associated variants. Variants are colored according to their FAP; FAP with ranks 1, 2, and 3 are colored red, orange, and yellow, respectively. (B) Founder allele effect as a function of age for the lead FAP variant from (A) for the diet-independent association (left column) and the diet-dependent association (right column). Panels (C) and (D) are the same as (A) and (B) for a locus on chromosome 7.
Figure 6
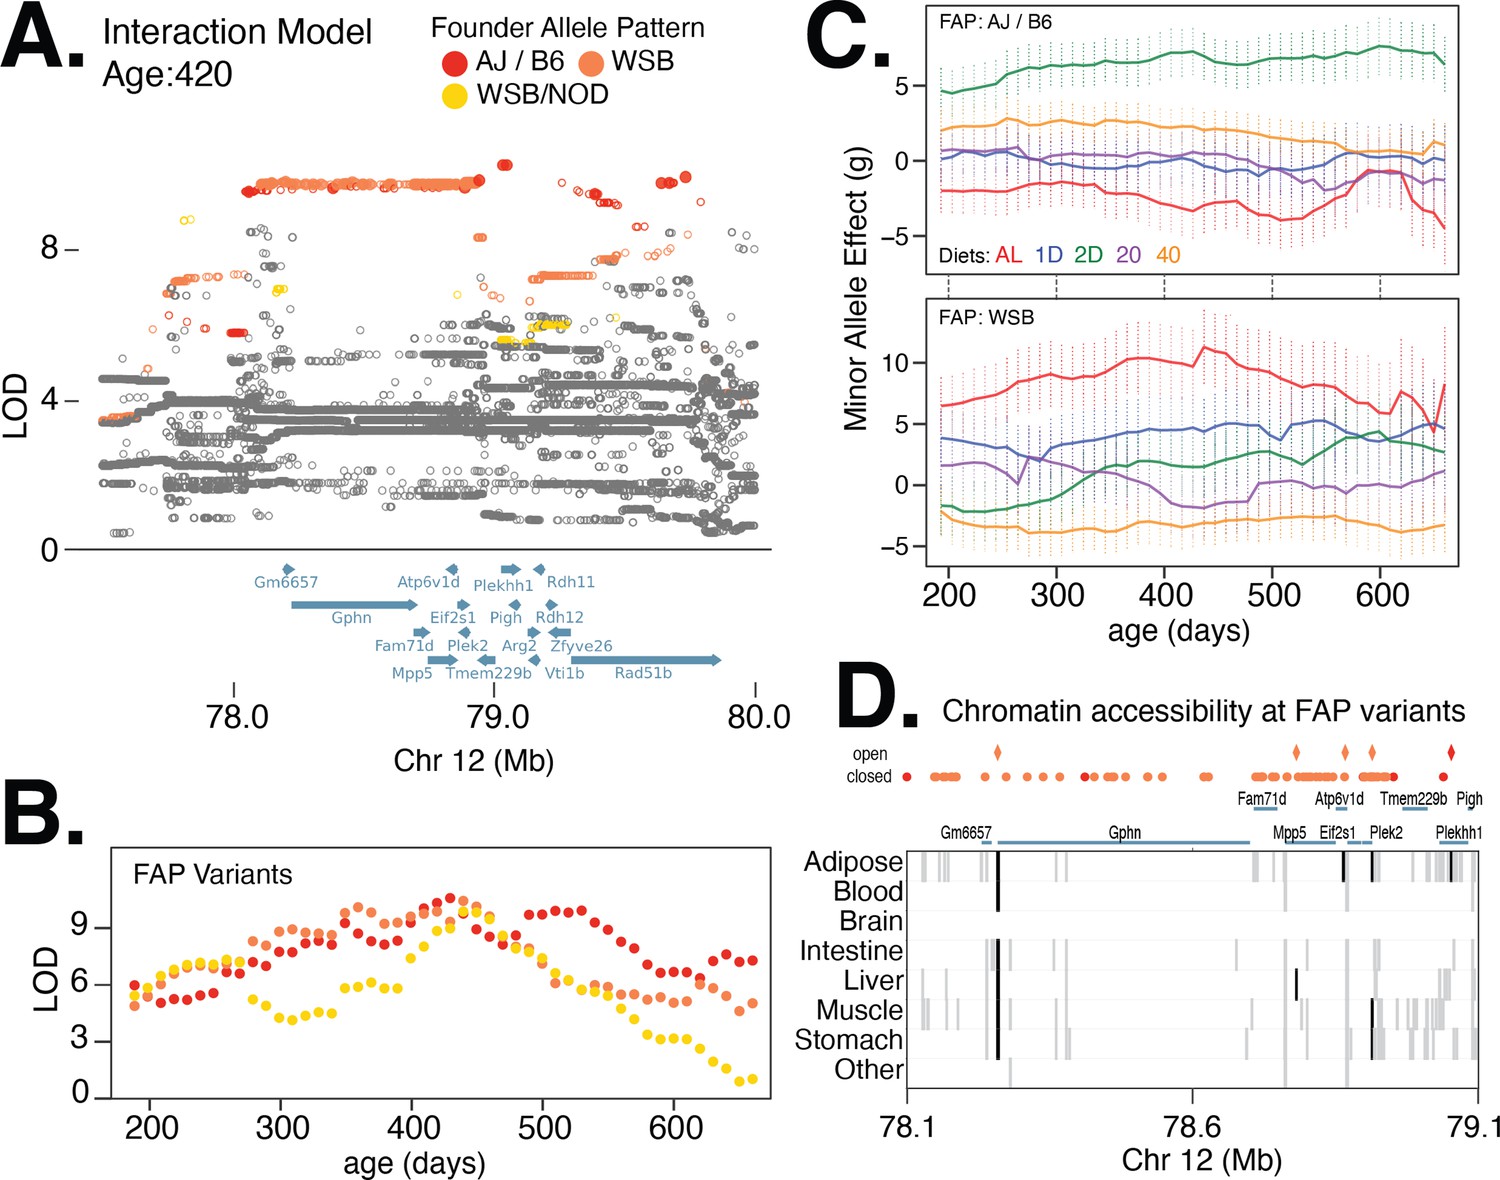
Multiple founder allele patterns (FAPs) at a body weight QTL on chromosome 12 show distinct diet-dependent effects.
(A) Fine-mapping loci, under the interaction model, at 420 days of age. Significant variants are marked as solid circles. Colors denote variants with shared FAPs; ranks 1, 2, and 3 by logarithm of the odds (LOD) score are colored red, orange, and yellow, respectively. (B) Log odds ratio as a function of age, for a single variant that exhibits the strongest association from each of the top three FAPs. (C) Age and diet-dependent effect size of variants with the strongest associations specific to either the WSB minor allele or AJ/B6 minor allele. (D) Significant variants, colored by their FAP, along with the gene models (shown in blue) and the tissue-specific activity of regulatory elements near these variants (shown in gray). Significant variants that lie within regulatory elements are highlighted as diamonds and regulatory elements that contain a significant variant are highlighted in black.
Figure 7 with 2 supplements
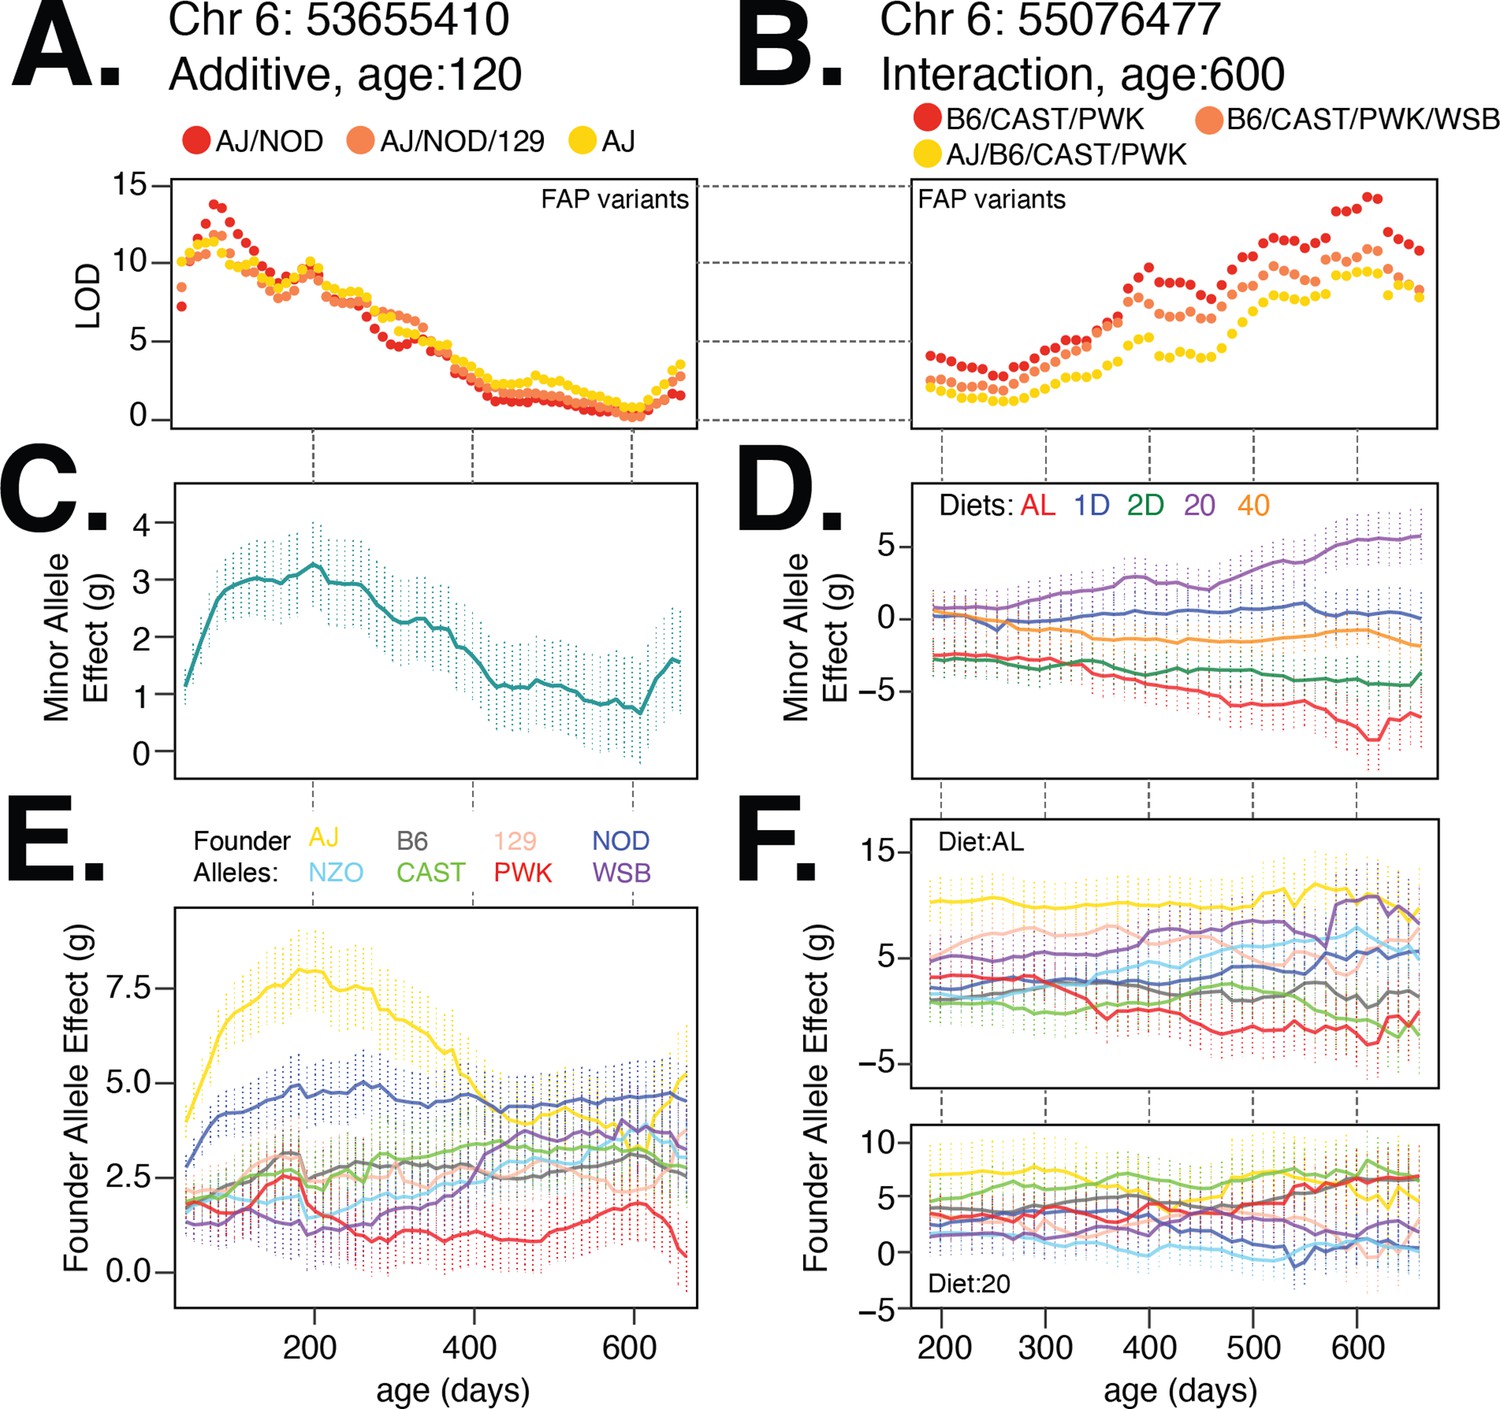
Body weight loci on chromosome 6 exhibit age- and diet-specific effects.
(A) Log odds ratio of additive body weight association as a function of age for the lead variant from each founder allele pattern (FAP) group. Red, orange, and yellow colors denote lead variant for rank 1, 2, and 3 FAPs. (B) Same as (A) for interaction body weight association on chromosome 6. (C, D) Estimated mean (SE) effect on body weight (grams) of the minor allele for the lead imputed variant. For the diet-dependent locus (D), effects are shown for each diet treatment. (E) Estimated mean effect (±SE) on body weight of each founder allele for the genotyped marker with the highest logarithm of the odds (LOD) score from the additive model. (F) Estimated effect (±SE) on body weight of each founder allele under the ad libitum (AL) and 20% calorie restriction (CR) diets.
Figure 7—figure supplement 1

Diet-dependent association with body weight in a locus on chromosome 5.
(A) Manhattan plots of additive genetic associations and genotype–diet associations on chromosome 5 at multiple ages. (B) Fine-mapping a locus associated with body weight in diet-dependent manner at 660 days of age. Each circle is a biallelic variant, both imputed and genotyped and solid circles denote significantly associated variants. Variants are colored according to their founder allele pattern (FAP); FAPs of ranks 1, 2, and 3 (by logarithm of the odds [LOD] score) are colored red, orange, and yellow, respectively. (C) Significant variants, colored by their FAP, along with the gene models (shown in green) and the tissue-specific activity of regulatory elements near these variants (shown in gray). Significant variants that lie within regulatory elements are highlighted as diamonds, and regulatory elements that contain a significant variant are highlighted in black. (D) Log odds ratio as a function of age, for a single variant that exhibits the strongest association from each of the top three FAPs. (E) Diet-dependent effect size of the minor allele as a function of age, for the variant with the strongest association. (F) Estimated effect of each founder allele in three diets (ad libitum [AL], 20, 40), at the genotyped variant with the strongest diet-dependent association.
Figure 7—figure supplement 2
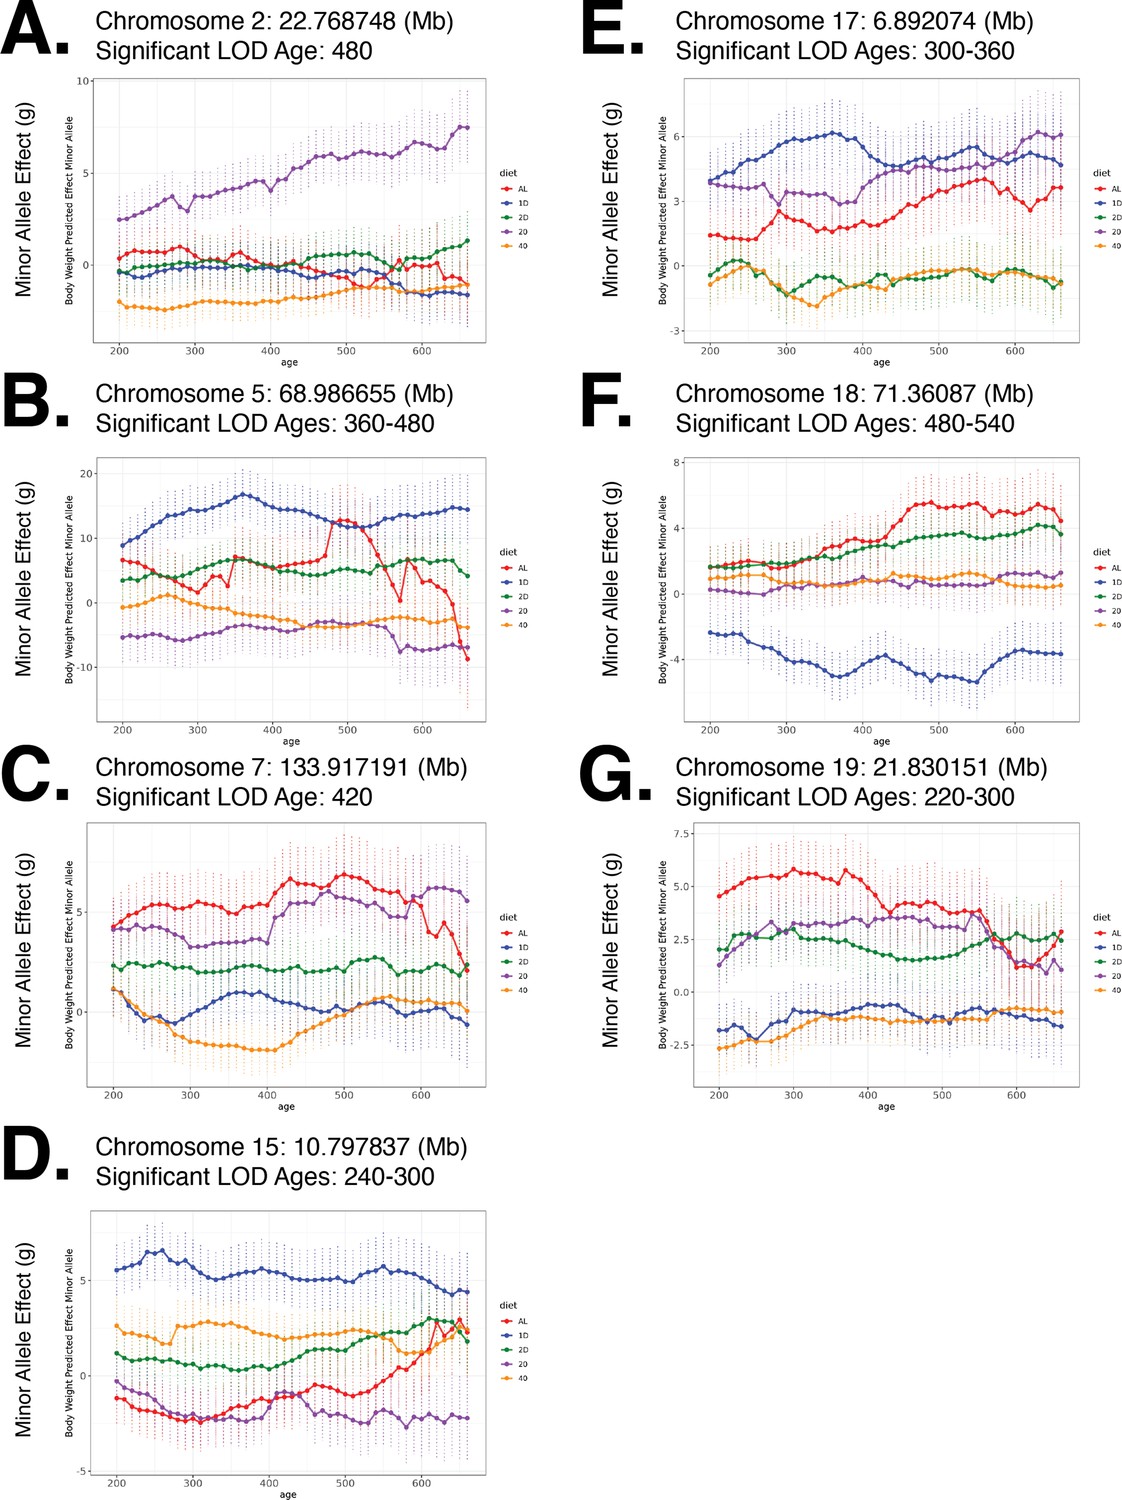
Nonlinear trends in genetic effects with respect to age and dietary intervention.
For each fine-mapped locus (A-G), we note the location of the variant with the strongest association and the ages at which the genetic association is significant and plot the estimated effect (SE) of this variant as a function of age, under different diets.
Tables
Table 1
Candidate diet-independent and diet-dependent body weight loci.
For each locus, we identified the variant with the lowest p-value at any age, the founder allele pattern (FAP) of this variant, the number of significant variants that comprise this lead FAP, the genomic positions spanning these significant FAP variants, and all ages for which at least one FAP variant is associated with body weight. For loci in which the lead FAP is comprised of fewer than 10 significant variants, we also present results for the second FAP. We list candidate genes for loci where the FAP spans three or fewer genes. Highly significant associations () are denoted with ***, significant associations () with **, and suggestive associations () with *.
| FAP position (Mb) | Significant variants | Significant age range (days) | Age-dependent nonlinearity | Lead candidate genes (if ≤3) | |||||||
|---|---|---|---|---|---|---|---|---|---|---|---|
| Chrm | Founder Allele Pattern (FAP) | FAP rank | p-Value | Start | End | Total | Open chromatin | ||||
| Diet-independent | |||||||||||
| 1 | AJ/NOD | 1 | 3.24E-05 | ** | 152.046626 | 152.046626 | 1 | 1 | 60 | 1.44E-05 | Trmt1l, Edem3 |
| AJ/NOD/129 | 2 | 3.05E-05 | ** | 151.473677 | 152.280212 | 58 | 10 | 60 | — | ||
| 2 | 129/CAST/PWK | 1 | 2.17E-05 | ** | 77.154962 | 77.357295 | 80 | 8 | 120–360 | 2.83E-09 | Ccdc141, Sestd1 |
| 3 | AJ/NOD/NZO/CAST | 1 | 1.89E-05 | ** | 50.533599 | 50.595073 | 55 | — | 200–260 | 5.03E-12 | Slc7a11 |
| 4 | AJ | 1 | 6.81E-06 | *** | 58.950364 | 60.267128 | 5 | 2 | 260–360 | 3.82E-19 | Ugcg |
| PWK/WSB | 2 | 2.80E-05 | ** | 59.461248 | 59.981846 | 39 | 3 | 100–300 | — | ||
| 6 | AJ/NOD | 1 | 2.75E-07 | *** | 53.61761 | 55.555977 | 89 | 2 | 60–200 | 1.55E-26 | Creb5 |
| 7 | B6/CAST | 1 | 4.20E-06 | *** | 71.375007 | 72.786849 | 47 | 1 | 80–160 | 2.48E-11 | Mctp2 |
| 7 | AJ/129/NZO/PWK | 1 | 5.70E-06 | *** | 134.08785 | 134.704465 | 20 | 2 | 80–200 | 9.17E-10 | Adam12 |
| 10 | 129/NZO/PWK/WSB | 1 | 4.99E-06 | *** | 9.078054 | 9.078054 | 1 | — | 540–660 | 9.52E-06 | Samd5 |
| 129/NZO/WSB | 2 | 2.25E-05 | ** | 8.903387 | 9.092694 | 10 | 2 | 540 | Sash1, Samd5 | ||
| 10 | CAST/PWK | 1 | 5.98E-06 | *** | 91.163191 | 91.905287 | 2,779 | 81 | 120–660 | 4.09E-10 | Anks1b, Apaf1 |
| 11 | AJ/NZO/PWK/CAST | 1 | 5.89E-05 | ** | 58.155424 | 58.155424 | 1 | — | 80 | 2.35E-05 | — |
| B6/CAST | 2 | 4.91E-05 | ** | 56.985645 | 59.035309 | 603 | 70 | 80–100 | — | ||
| 12 | NZO/CAST | 1 | 6.47E-05 | ** | 99.520559 | 99.907182 | 43 | 3 | 160–260 | 3.83E-12 | Foxn3 |
| 15 | B6/129/NZO | 1 | 4.77E-07 | *** | 99.390603 | 99.65295 | 92 | 20 | 260–600 | 1.50E-13 | Aqp2, Aqp5, Aqp6 |
| 17 | AJ/NOD/WSB | 1 | 8.56E-06 | *** | 6.753277 | 8.85311 | 149 | 11 | 60–420 | 1.23E-10 | Pde10a |
| 19 | AJ/129/NZO/PWK | 1 | 7.90E-05 | ** | 23.025043 | 23.17612 | 58 | 14 | 80–120 | 4.46E-09 | Trpm3, Klf9 |
| Diet-dependent | |||||||||||
| 1 | NOD/CAST | 1 | 4.89E-04 | * | 151.032114 | 153.716837 | 28 | 3 | 360–660 | 3.32E-04 | — |
| 2 | AJ/CAST/PWK/WSB | 1 | 7.74E-04 | * | 22.192222 | 22.78664 | 86 | 8 | 480 | 1.32E-04 | — |
| 2 | PWK | 1 | 3.34E-04 | * | 73.590142 | 75.371564 | 1,672 | 44 | 280–300 | 4.62E-03 | — |
| 3 | NOD/CAST/PWK/WSB | 1 | 3.87E-05 | ** | 50.184746 | 50.419821 | 5 | — | 420–660 | 7.90E-04 | Slc7a11 |
| 3 | B6/PWK | 1 | 8.29E-05 | ** | 156.74554 | 156.74554 | 1 | — | 660 | 1.60E-05 | Negr1 |
| 129/CAST/WSB | 2 | 7.33E-04 | * | 156.133466 | 156.387825 | 170 | 8 | 660 | — | ||
| 4 | 129/NOD/PWK | 1 | 9.61E-04 | * | 57.696301 | 57.84652 | 10 | 1 | 200 | 5.10E-07 | Palm2, Pakap, Akap2 |
| NOD | 2 | 9.76E-04 | * | 57.669827 | 57.669827 | 1 | — | 200 | — | ||
| 5 | NOD | 1 | 3.88E-05 | ** | 19.213904 | 21.57007 | 153 | 16 | 420–660 | 2.26E-03 | Magi2, Ptpn12 |
| 5 | PWK | 1 | 5.84E-04 | * | 68.986655 | 70.490341 | 277 | — | 360–480 | 2.28E-03 | Kctd8 |
| 5 | AJ/129/NOD/WSB | 1 | 4.00E-05 | ** | 117.543498 | 118.050453 | 7 | — | 480–540 | 1.55E-03 | — |
| B6/CAST/PWK | 2 | 1.04E-04 | * | 116.797769 | 118.270745 | 69 | 10 | 360–600 | — | ||
| 6 | B6/CAST/PWK | 1 | 1.04E-04 | * | 54.146132 | 55.452827 | 507 | 101 | 540–660 | 7.51E-04 | Ghrhr |
| 6 | B6/CAST | 1 | 1.68E-05 | ** | 139.190506 | 140.141694 | 111 | 5 | 240–420 | 9.63E-03 | Pik3c2g |
| 7 | NZO/PWK | 1 | 9.60E-04 | * | 133.838117 | 133.924023 | 218 | 3 | 420 | 3.19E-07 | Adam12 |
| 12 | AJ/B6 | 1 | 6.29E-04 | * | 78.06102 | 79.734912 | 10 | 2 | 420–540 | 4.23E-04 | Gphn |
| WSB | 2 | 9.84E-04 | * | 78.107988 | 78.932842 | 122 | 8 | 360–420 | Gphn | ||
| 12 | AJ/CAST/PWK/WSB | 1 | 3.53E-04 | * | 102.447268 | 102.56532 | 43 | 4 | 420–480 | 2.59E-05 | — |
| 13 | NZO/WSB | 1 | 1.00E-04 | ** | 117.100864 | 118.777463 | 99 | 1 | 200–300 | 1.14E-03 | Fgf10 |
| 15 | AJ/129/NOD | 1 | 3.52E-04 | * | 10.738034 | 12.040137 | 53 | 4 | 240–300 | 1.27E-04 | — |
| 17 | B6/129/NZO | 1 | 7.52E-04 | * | 6.755865 | 7.598818 | 26 | 3 | 300–360 | 3.23E-03 | — |
| 18 | 129/CAST | 1 | 3.86E-04 | * | 71.36087 | 71.58844 | 16 | 1 | 480–540 | 6.92E-03 | Dcc |
| 19 | AJ/B6/WSB | 1 | 1.24E-04 | * | 21.806665 | 22.051277 | 32 | 1 | 220–300 | 3.54E-03 | — |
Additional files
Download links
A two-part list of links to download the article, or parts of the article, in various formats.
Downloads (link to download the article as PDF)
Open citations (links to open the citations from this article in various online reference manager services)
Cite this article (links to download the citations from this article in formats compatible with various reference manager tools)
Age and diet shape the genetic architecture of body weight in diversity outbred mice
eLife 11:e64329.
https://doi.org/10.7554/eLife.64329


