Robust, coherent, and synchronized circadian clock-controlled oscillations along Anabaena filaments
- Department of Physics of Complex Systems, Weizmann Institute of Science, Israel
- Dipartimento di Fisica e Astronomia, Università di Firenze, INFN and CSDC, Italy
- Consiglio Nazionale delle Ricerche, Istituto dei Sistemi Complessi, Italy
- Instituto de Bioquímica Vegetal y Fotosíntesis, CSIC and Universidad de Sevilla, Spain
Figures
Figure 1
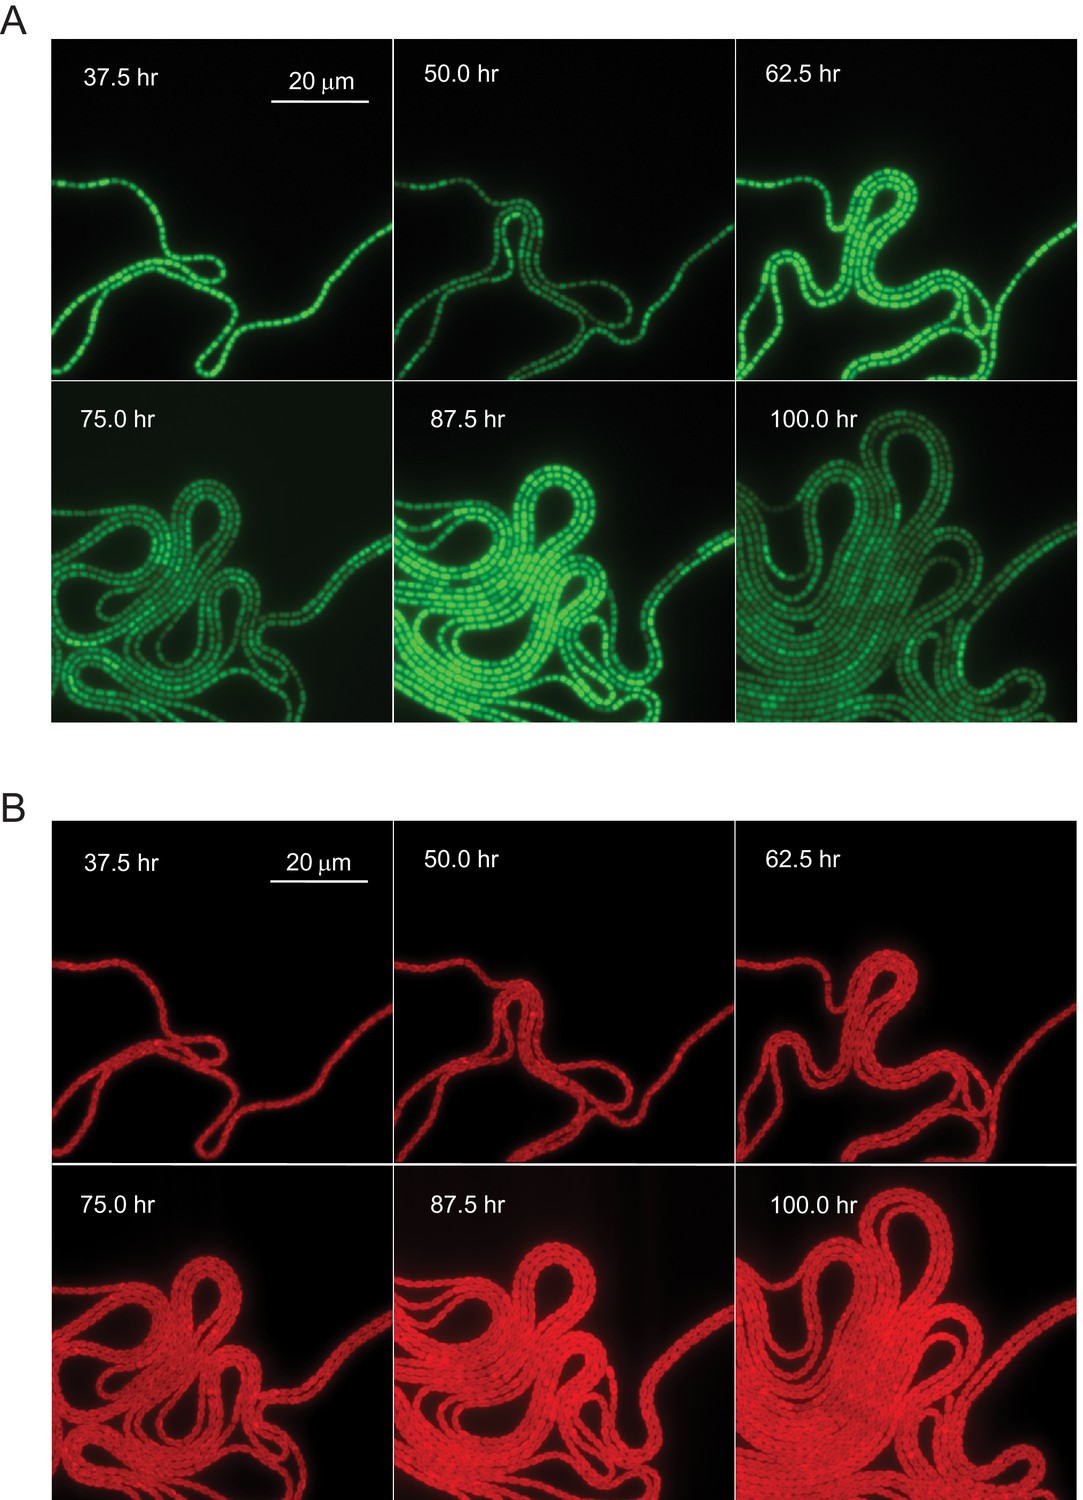
Circadian oscillation in Anabaena.
(A) GFP fluorescence in a filament of an Anabaena strain bearing a promoter fusion, growing under nitrogen-replete conditions. The snapshots were chosen near maxima and minima of the circadian oscillations. (B) Autofluorescence as a function of time in Anabaena. Snapshots correspond to those in (A), and time 0 corresponds to the time at which filaments were placed in a device for microscope observation (for details, see Materials and methods). For a time-lapse movie, see Video 1 (taken over 6 days).
Figure 2 with 1 supplement
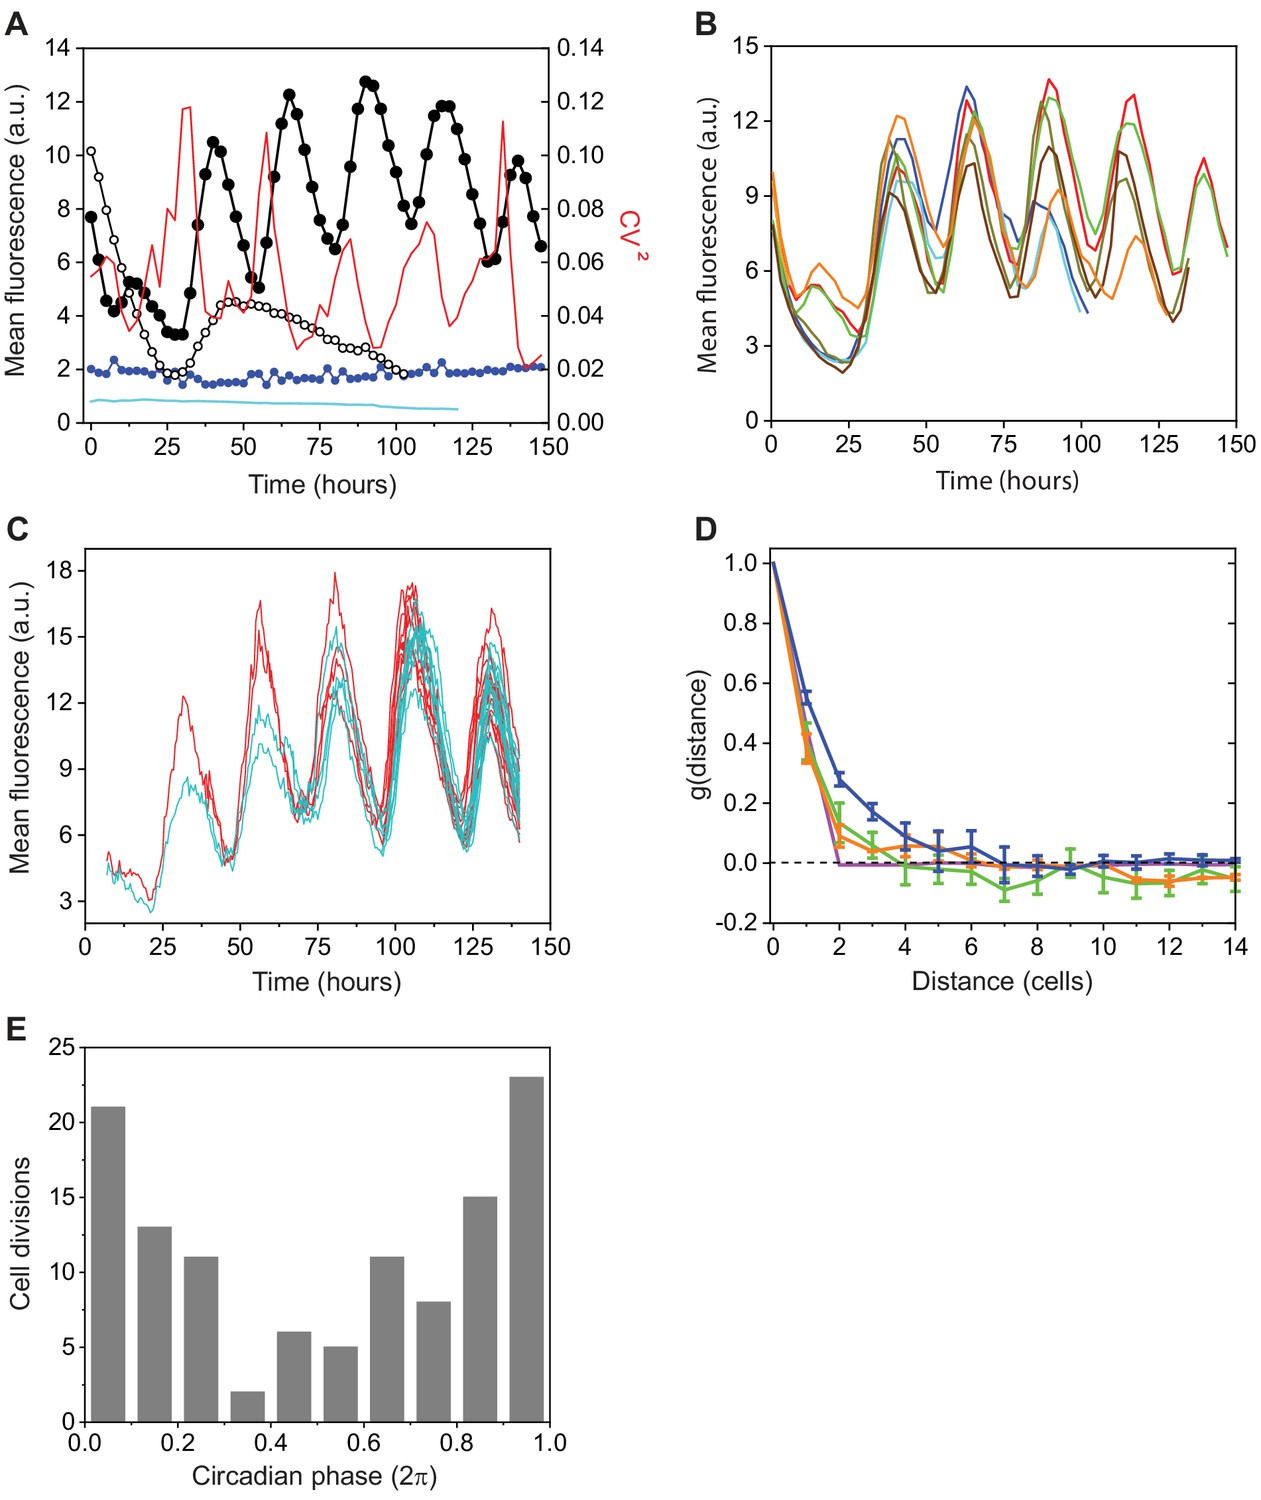
Characterization of a clock-controlled gene in Anabaena.
(A) Average cell fluorescence intensity from in a filament as a function of time for a wild-type genetic background (full black circles) and for a kaiABC background (empty black circles); intensity of autofluorescence as a function of time (blue circles); average cell fluorescence intensity from (cyan line); and temporal dependence of the cell-cell variability in expression of (red line). Data were taken from at least 50 contiguous cells along a filament. (B) Average fluorescence intensity as a function of time of filaments in different fields of view from the same experimental run. Each trace was obtained from at least 50 contiguous cells along each filament. (C) Expression from a fusion in the lineages of two contiguous cells as a function of time. (D) Average spatial autocorrelation function of expression along filaments of wild-type (blue), sepJ/fraCD (green), and kaiABC (orange) genetic backgrounds. Error bars represent standard errors. Magenta line: contribution to the spatial autocorrelation function of fluctuations from the wild-type data set, induced by binomial partitioning of molecules between daughter cells, following each of three consecutive cell divisions. Prior to divisions, the cell order in each filament was reshuffled. (E) Histogram of the phase of cell-division events along the circadian cycles, with 0 and denoting two consecutive minima, from two independent experiments. For additional data similar to (A) and (C), corresponding to filaments of the sepJ/fraCD genetic background, see Figure 2—figure supplement 1.
Figure 2—figure supplement 1
Effects of perturbation of cell-cell communication on the expression of PpecB−gfp.
Figure 3 with 2 supplements
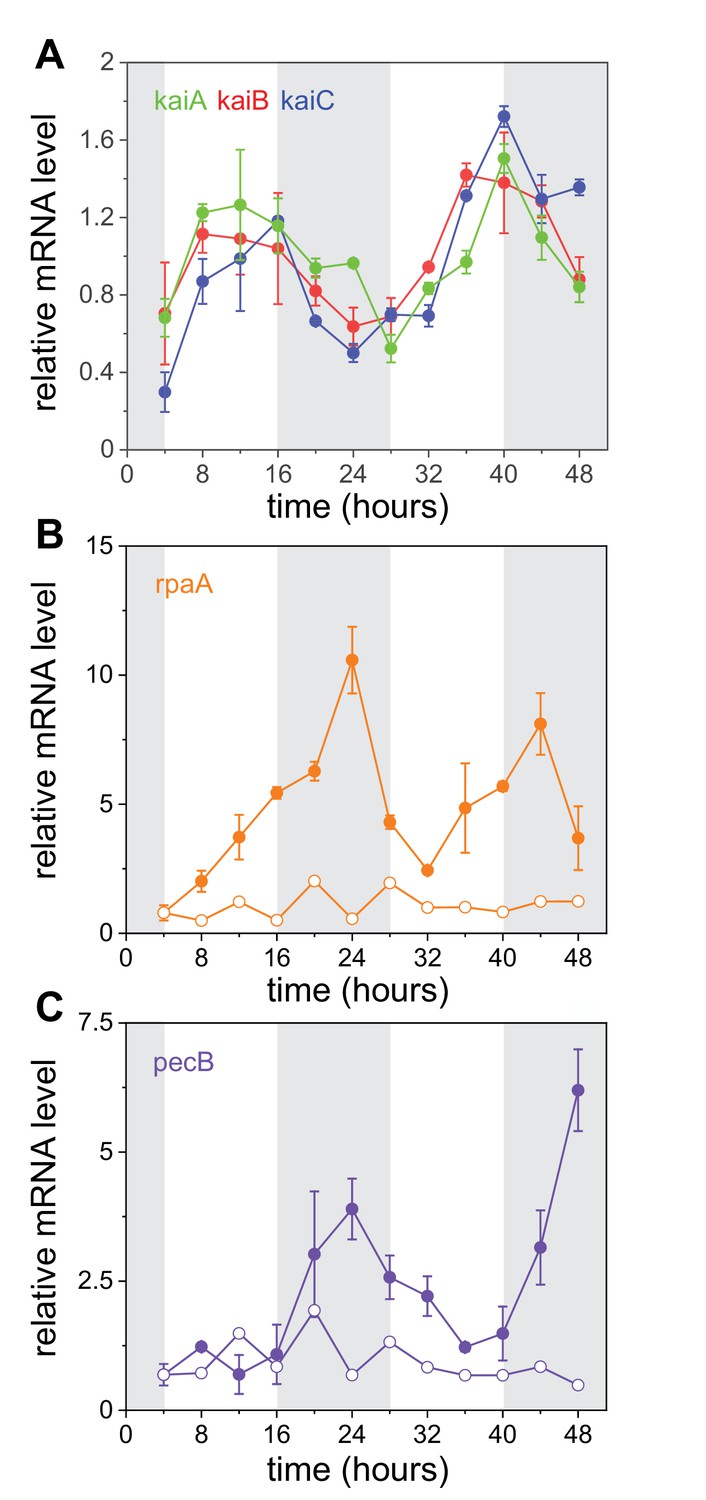
Transcriptional oscillations in the core clock genes, rpaA and pecB.
(A) Relative expression of kaiA (green), kaiB (red), and kaiC (blue) as a function of time measured by RT-qPCR (Materials and methods). A persistence homology analysis of these data is presented in Figure 3—figure supplement 1. (B, C) Relative expression levels of rpaA and pecB, respectively, in wild-type (full circles) and kaiABC strains (empty circles). Curves have been normalized by their temporal mean. Error bars represent the standard error of the mean of three independent experiments (see Materials and methods). Gray shades represent periods of subjective night. For additional information about regulatory sequences of the kaiABC, rpaA, pecB promoter regions and RpaA binding sites in Anabaena, see (C) (Figure 3—figure supplement 2).
Figure 3—figure supplement 1
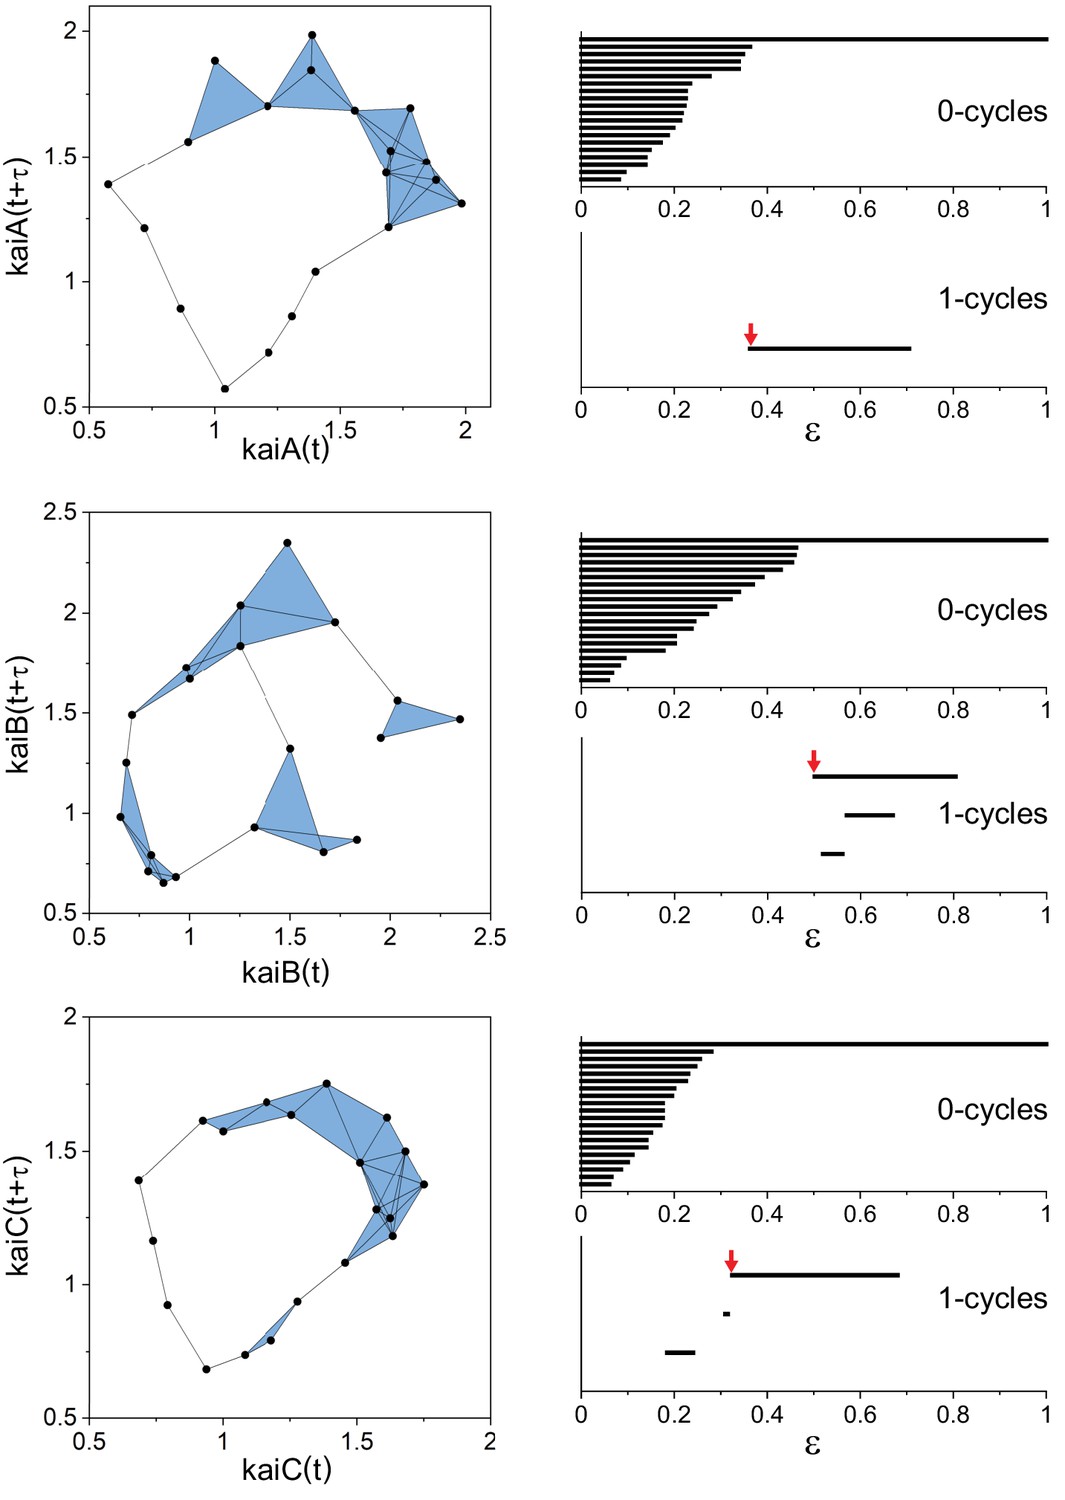
Persistent homology analysis of periodic behavior in the trascriptionaltime series of kai genes of Anabaena.
Figure 3—figure supplement 2
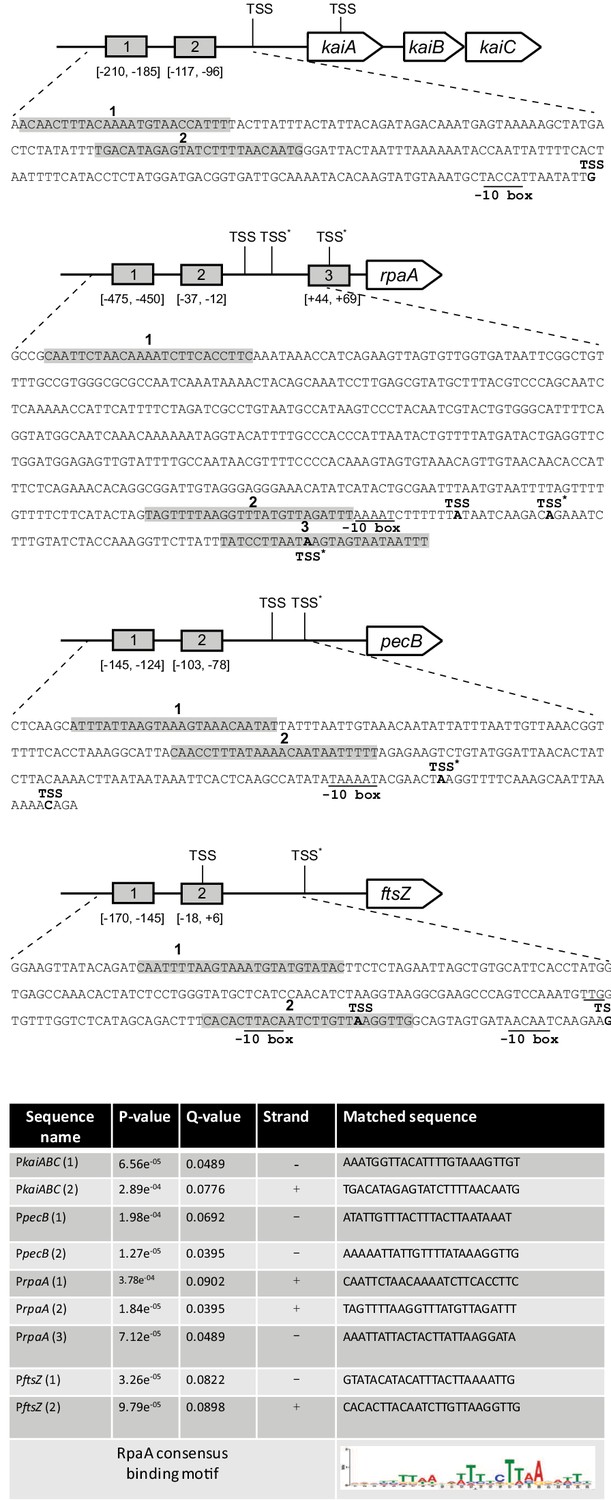
Schematic representation and regulatory sequences of the kaiABC, rpaA,pecB and ftsZ promoter regions in Anabaena.
Figure 4
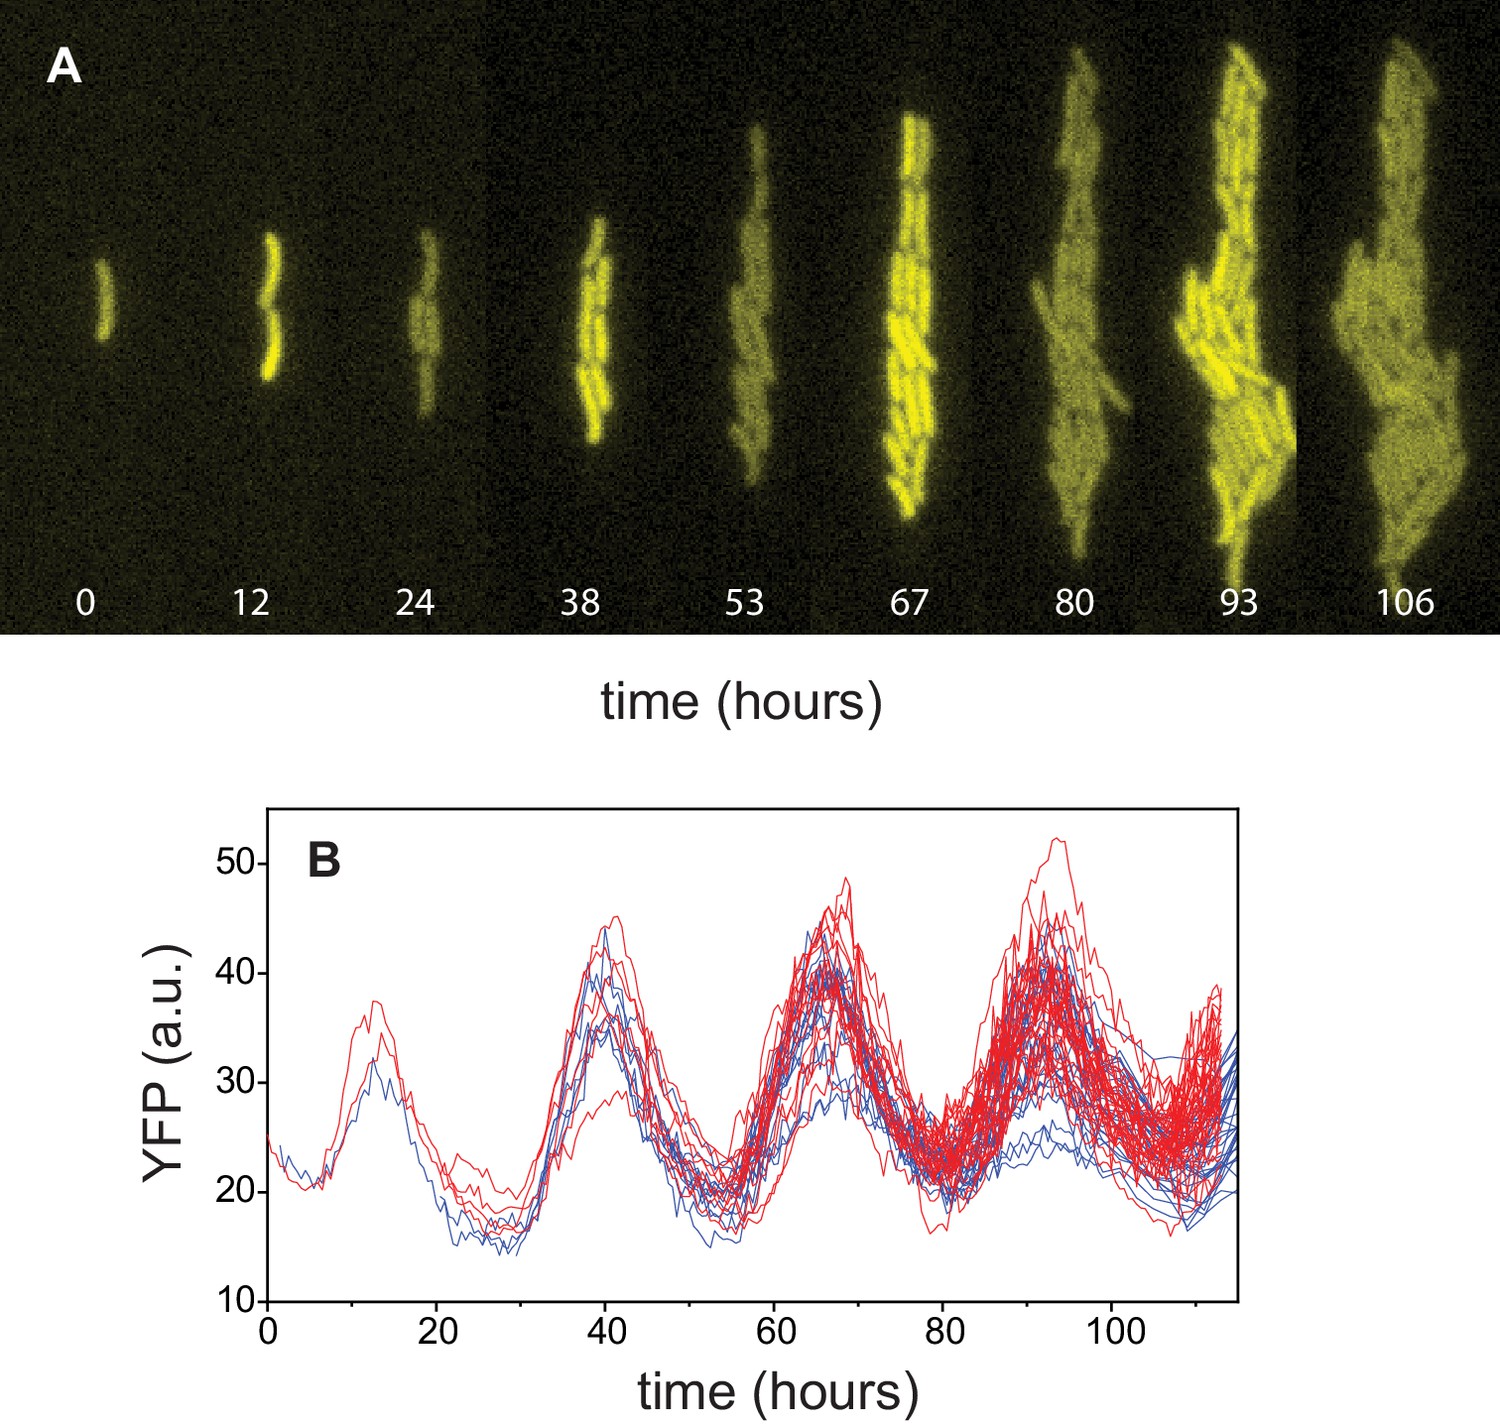
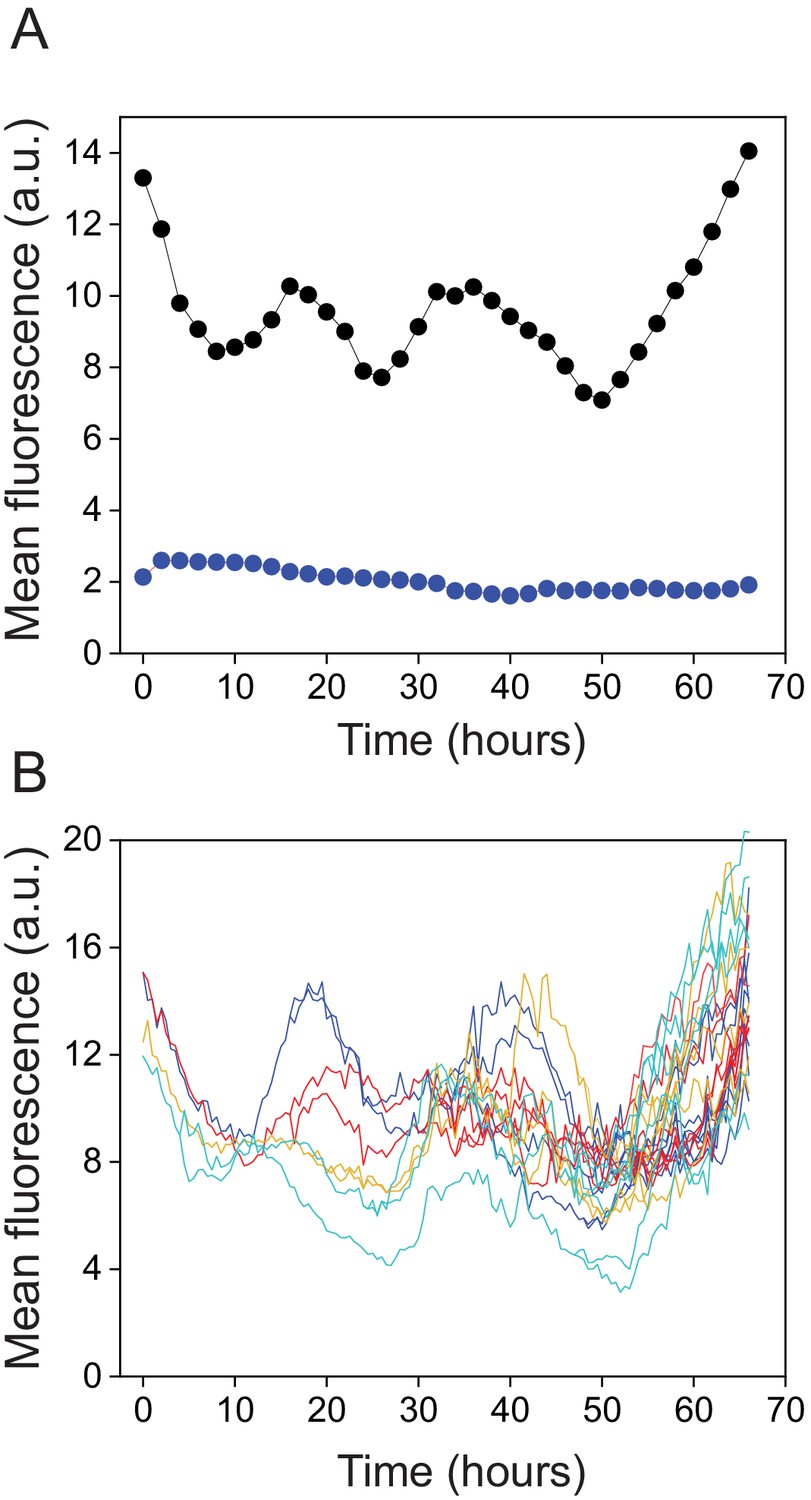
Circadian oscillations in Synechococcus.
(A) Growth and lineage of a cell in patterned agarose, expressing YFP from the kaiBC promoter. The snapshots were chosen near maxima and minima of the circadian oscillations. (B) Fluorescence intensity of YFP of individual cells obtained from two independent cell lineages (red and blue).
Figure 5 with 1 supplement

Stochastic model for circadian oscillations in Synechococcus.
(A) Schematic representation of interconversion between KaiC phosphoforms modulated by the activity of KaiA in an individual clock. The different phosphoform states of KaiC are denoted by U (unphosphorylated, U-KaiC), T (phosphorylated at threonine, T-KaiC), S (phosphorylated at serine, S-KaiC), and D (phosphorylated at both sites). Arrows denote transitions between the different phosphoforms with the indicated rates . KaiB mediates the inactivation of KaiA by S, as described by the continuous function (see Figure 5—figure supplement 1). (B) Average power spectrum of single-cell fluorescence (red symbols) fit to the data with the prediction from the stochastic model (blue line). (C) -[KaiA] plane where deterministic limit cycle oscillations in individual clocks occur. The color corresponds to the period of oscillations (in hours). The boundary of the colored region corresponds to a Hopf bifurcation. Note that deterministic oscillations with a circadian period are limited only to a small strip near the stability boundary at the bottom right. The circle identifies the values of and KaiA that we obtain by fitting experimental power spectra in (B). The diamond stands for best fit parameters obtained for Anabaena (Figure 6C). (D) Comparison between damped deterministic oscillations (blue line) and quasi-cycles, both at the circle point outside the region of the deterministic oscillations in (C).
Figure 5—figure supplement 1
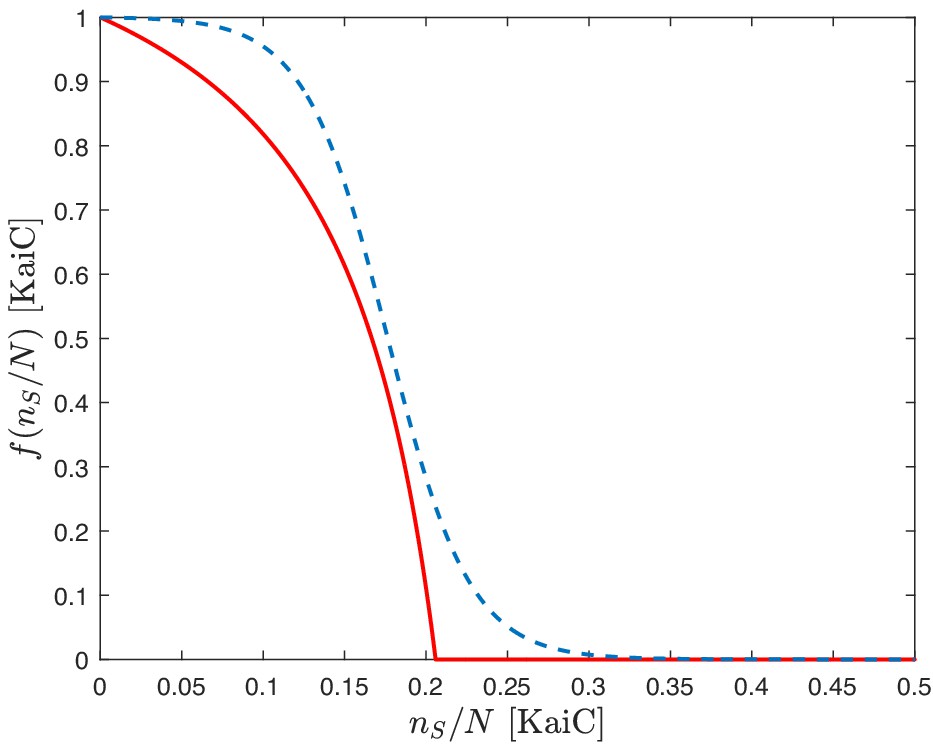
Typical shape of the nonlinear function f.
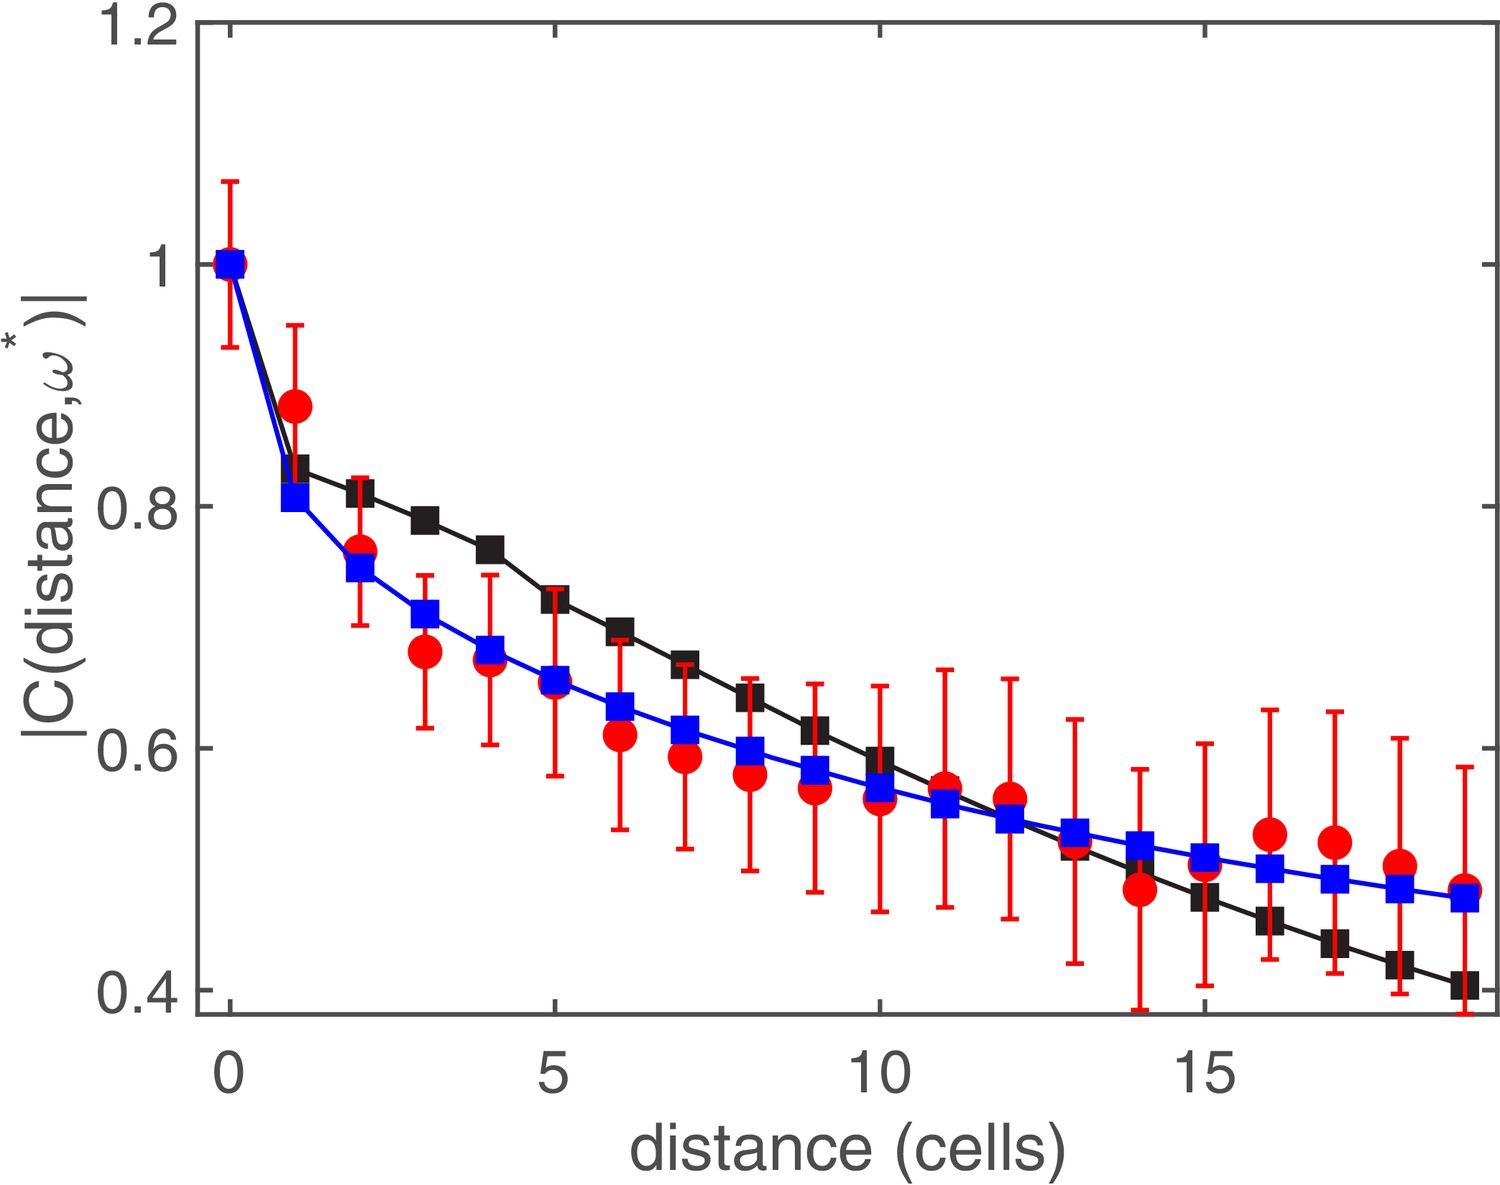
Figure 6

Stochastic model for circadian oscillations in Anabaena.
(A) Schematic representation of the Anabaena filament showing coupling of circadian clocks via cell-cell communication (red arrows). (B) Gillespie simulations of quasi-cycles of T-KaiC in a continuous stretch of 10 cells along a filament. The reaction parameters correspond to the diamond plotted in Figure 5C. The total amount of KaiC phosphoforms was set to 5000, and the number of steps of the Gillespie algorithm was . (C) Average power spectrum of single-cell fluorescence intensity along filaments (red symbols) fit to the data with the prediction from the stochastic model (blue line). The best fit values correspond to the diamond shown in Figure 5C. (D) Complex coherence function measuring the correlation expression from in 35 cell segments at the frequency of temporal oscillations. Red full circles correspond to experimental data, blue squares represent the fit to the experimental data with the prediction of the stochastic model, and empty red circles represent the coherence function of the experimental data in which cells have been reshuffled. Lines between symbols are a guide to the eye. The fit was carried out by adjusting two parameters, the strength of the imposed spatial coupling and the characteristic scale of the exponential kernel, see Appendix 1. Remarkably, the range of the interaction as obtained from the fit is compatible with that estimated from the spatial autocorrelation depicted in Figure 2D. The intercell coupling was obtained from the fit in (C).
Appendix 1—figure 1
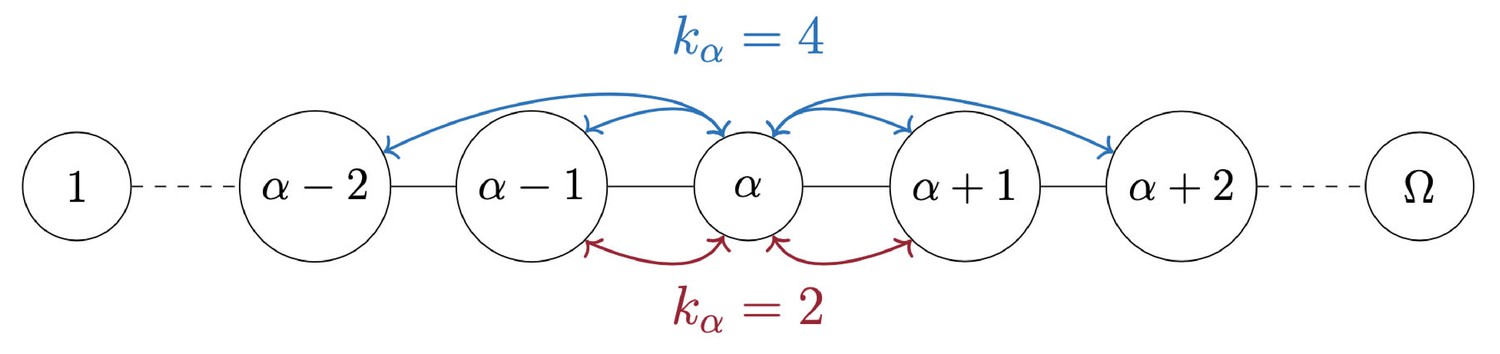
Schematic representation of an Anabaena filament.
The parameter measures the connectivity of each node.
Appendix 1—figure 2
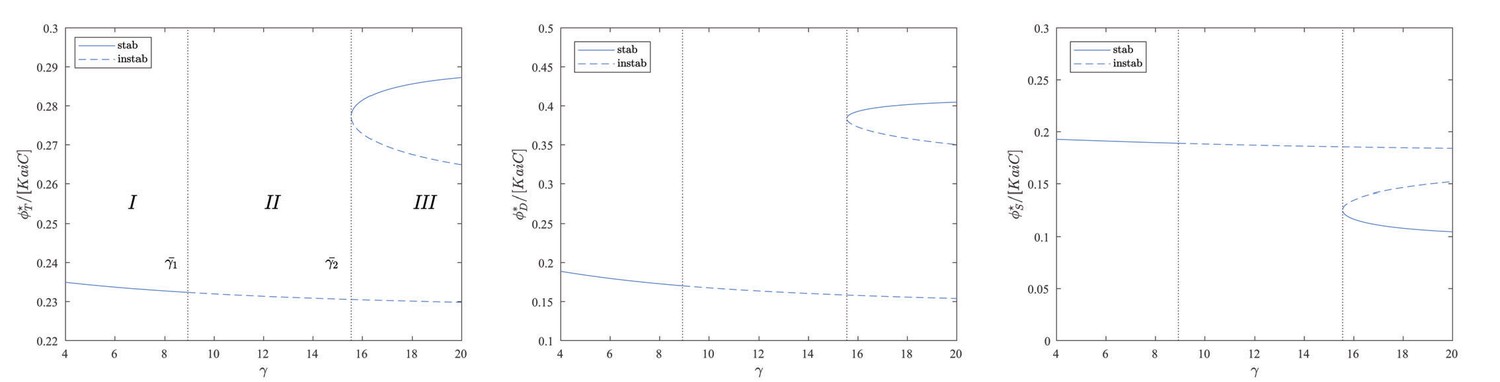
Stability diagram.
Stability of the equilibrium points for the three species as a function of and . The values of all the other parameters are specified in Appendix 1—table 1. Continuous lines denote stable equilibrium points, and dashed lines denote unstable equilibrium points.
Appendix 1—figure 3

Deterministic limit cycle region.
The portion of the plane delimited by the blue line marks the region of the parameter's space where deterministic regular oscillations occur.
Appendix 1—figure 4
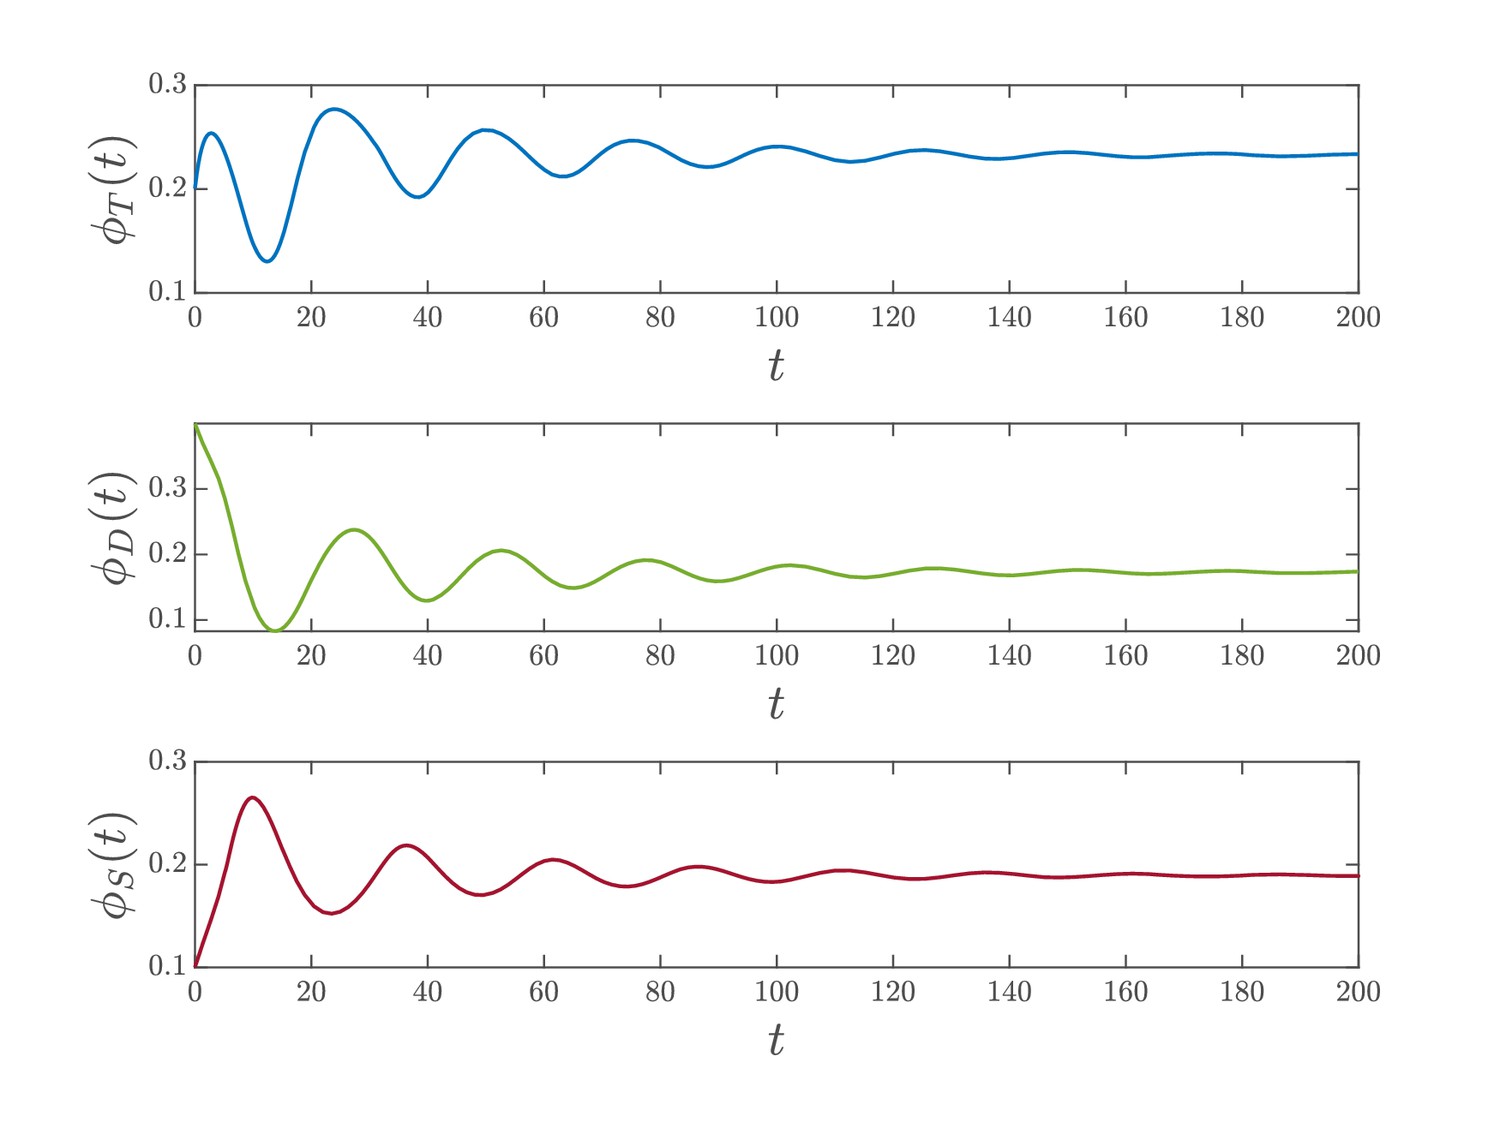
Deterministic simulation.
Results of the numerical integration of system (Equation 23) for and . The other parameters are assigned as specified in Appendix 1—table 1. for stands here for the relative abundance of the phosphoforms in units of [KaiC].
Appendix 1—figure 5
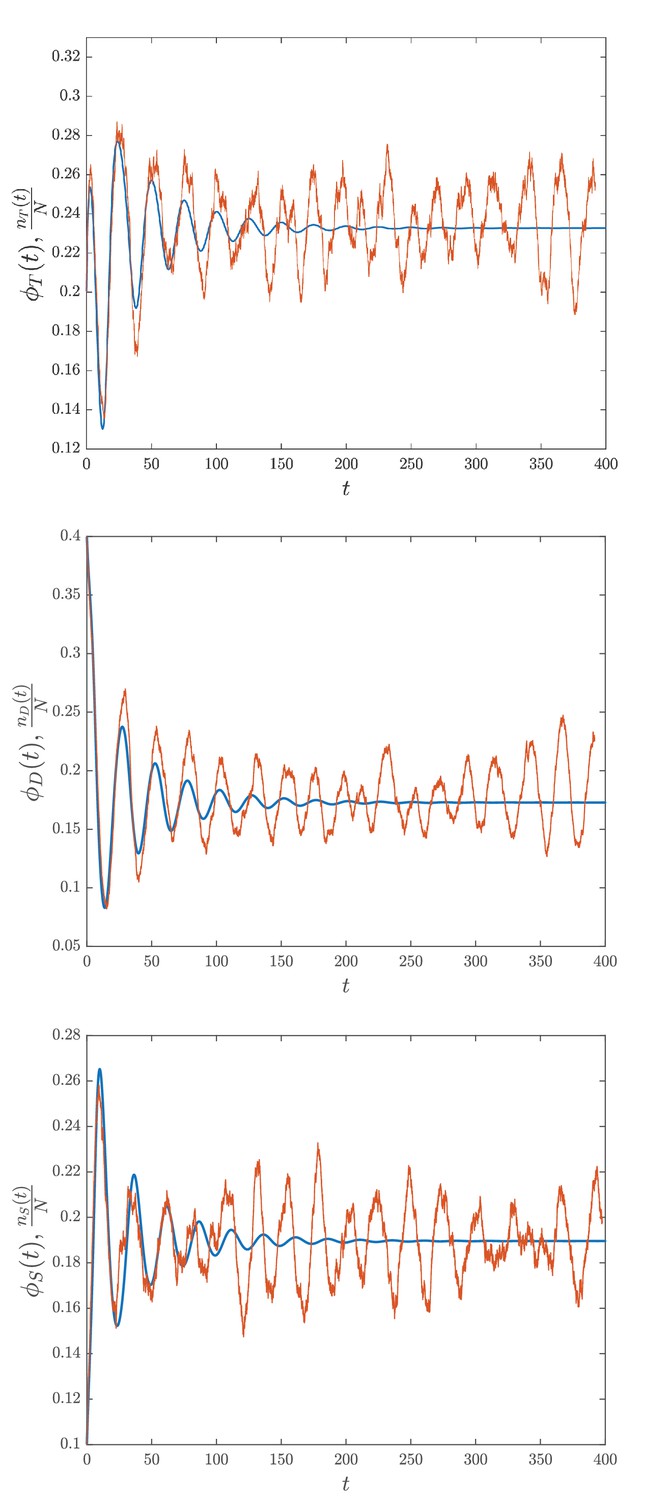
Comparison between deterministic and stochastic simulations.
The blue lines denote the result of the numerical integration of Equation (23) while the noisy red lines represent the stochastic simulation of the system through the Gillespie, 1977 algorithm. For all the plots for and while the other parameters are set as those in Appendix 1—table 1. for stands here for the relative abundance of the phosphoforms in units of [KaiC].
Appendix 1—figure 6
The complex coherence function: comparison between theory and experiments.
Complex coherence function measuring the correlation of 35 cell segments at the frequency of temporal oscillations. Red circles correspond to experimental data, and the squares represent fits to the experimental data with the prediction of the stochastic model using the constant kernel (black squares) and the power-law kernel (blue squares). Lines between symbols are a guide to the eye. The fitting procedure gives for the fixed connectivity , while it returns and for the power-law function.
Appendix 1—figure 7
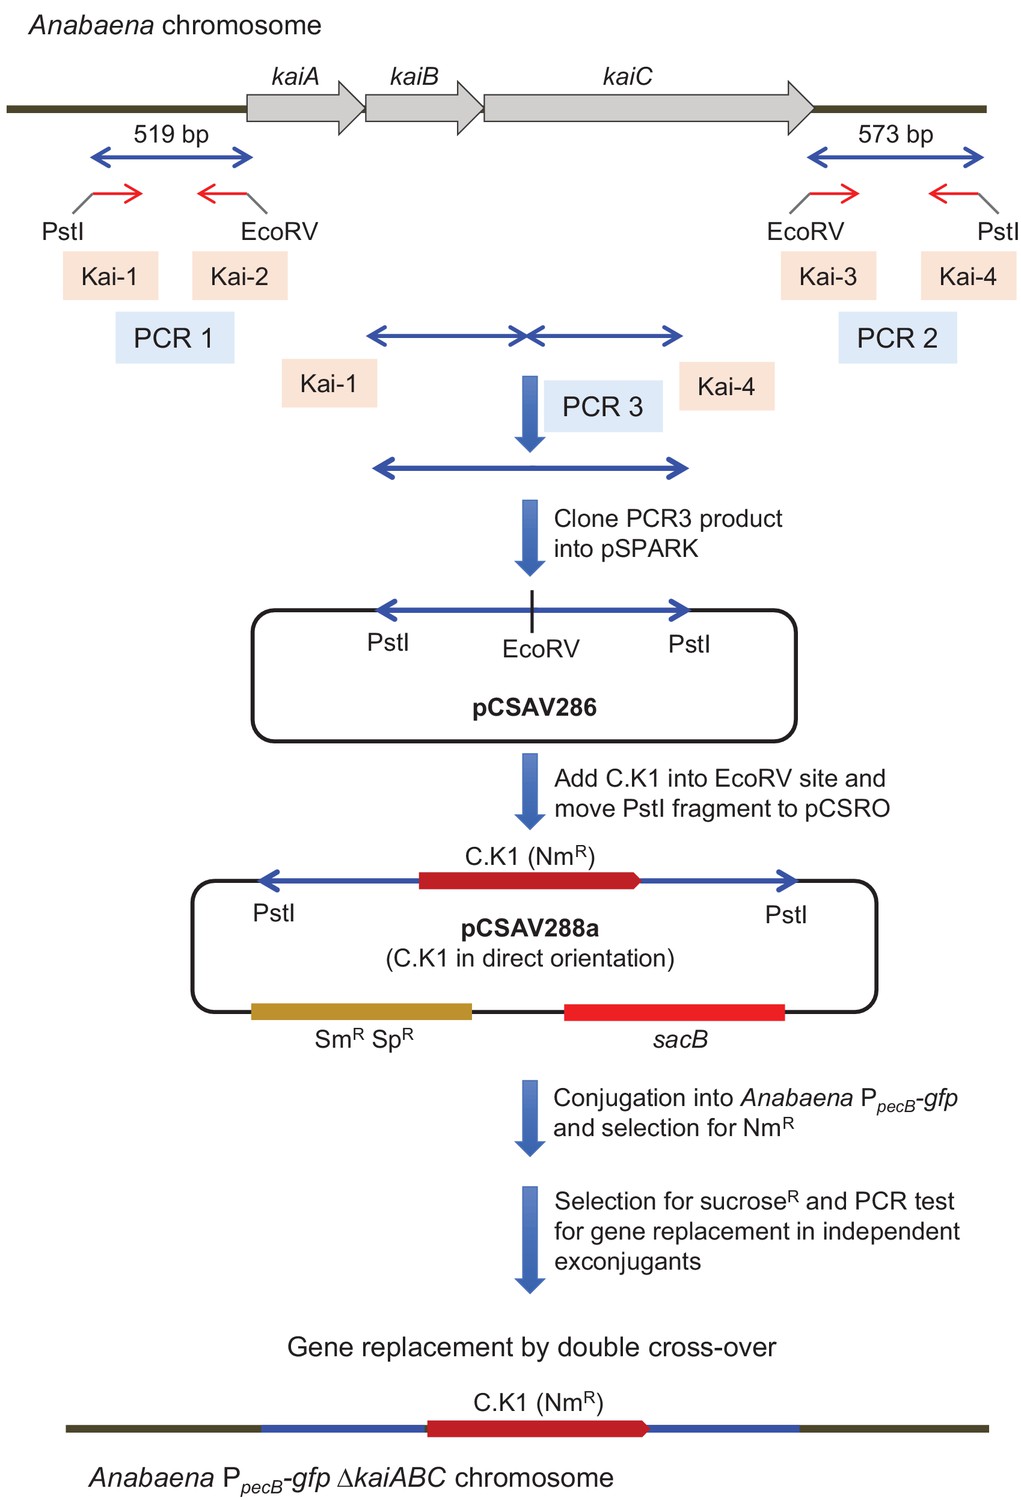
Construction of an AnabaenakaiABC deletion mutant in the PpecB-gfp genetic background.
PCR, DNA restriction/ligation, and transformation into Escherichia coli were performed by standard techniques. Conjugation from E. coli to Anabaena was performed as described by Elhai et al., 1997, and sucrose (sacB)-based positive selection for double recombinants was performed as described by Cai and Wolk, 1990. AnabaenakaiABC homozygous mutants containing the kai deletion with insertion of the C.K1 gene cassette in direct orientation were obtained and confirmed by PCR analysis. Kai-1 to Kai-4 are oligodeoxynucleotide primers.
Videos
Video 1
Real-time expression of a clock-controlled gene and filament autofluorescence during circadian oscillations in WT Anabaena.
Tables
Table 1
Synchronization of expression of a clock-controlled gene in cells within and between Anabaena filaments.
The synchronization index for strains with the indicated genotypes (Materials and methods) was measured from the fluorescence intensities of expression in the same cells followed over a full circadian period in a filament, either in clusters of contiguous cells (contiguous) or for cells separated by intervals of 10 cells (separate). To measure synchronization between filaments, was computed from about 10 cells, each belonging to a different filament. For each genetic background, the mean and standard error of the mean (SEM) of was determined from a number of independent repeats (Rust et al., 2007; Lambert et al., 2016; Dong et al., 2010; Teng et al., 2013), carried out in different experimental runs. Significance (p-value) in interstrain comparisons was established by the Mann–Whitney U-test, and * represents rejection of the null hypothesis that samples come from distributions with equal medians. WT: wild type.
| Genotype | Cell cluster | R (mean ± SEM) | n | Comparison with strain | p-Value |
|---|---|---|---|---|---|
| WT | Contiguous | 0.89 ± 0.04 | 3 | WT (separate) | 0.117 |
| WT | Separate | 0.85 ± 0.01 | 2 | ||
| WT | Different filaments | 0.75 ± 0.04 | 2 | WT (separate) | 0.026* |
| Contiguous | 0.73 ± 0.05 | 4 | WT (contiguous) | 0.001* | |
| Contiguous | 0.71 ± 0.03 | 3 | WT | 0.001* |
Key resources table
| Reagent type (species) or resource | Designation | Source or reference | Identifiers | Additional information |
|---|---|---|---|---|
| Strain, strain background (Anabaena) | , WT | This paper | Anabaena PCC 7120 WT, bearing a pecB promoter fusion to gfp | |
| Strain, strain background (Anabaena) | , | This paper | Anabaena PCC 7120 deletion mutant of the genes, bearing a pecB promoter fusion to gfp | |
| Strain, strain background (Anabaena) | doi: 10.1371/journal.pgen.1005031 | CSL64 | Anabaena PCC 7120 WT, bearing a hetR promoter fusion to gfp | |
| Strain, strain background (Anabaena) | , | This paper | Anabaena PCC 7120 deletion mutant of the , , genes (CSVM141), bearing a pecB promoter fusion to gfp | |
| Strain, strain background (Synechococcus elongatus) | YFP-SsrA | This paper | PCC 7942 | Synechococcus elongatus PCC 7942 (wild-type) expressing YFP- SsrA |
| Recombinant DNA reagent | EB2316 (plasmid) | Addgene plasmid | 87753 | http://n2t.net/addgene: 87753 |
| Recombinant DNA reagent | pSpark (plasmid) | Canvax | C0001 | https://lifescience.canvaxbiotech.com/wpcontent/uploads/sites/2/2015/08pSpark-DNA-Cloning.pdf |
| Recombinant DNA reagent | pCSRO containing cloning vector | doi: 10.1128/JB.00181-13 | ||
| Commercial assay or kit | Fast SYBR Green Master Mix | Applied Biosystems | 4385612 | |
| Commercial assay or kit | QuantiTect Reverse Transcription kit | QIAGEN | 205311 |
Appendix 1—table 1
Parameters used in the simulations.
| 0 h−1 | 0.479077 h−1 | ||
| 0 h−1 | 0.212923 h−1 | ||
| 0 h−1 | 0.505692 h−1 | ||
| 0 h−1 | 0.0532308 h−1 | ||
| 0.21 h−1 | 0.0798462 h−1 | ||
| 0 h−1 | 0.1730000 h−1 | ||
| 0.31 h−1 | −0.319885 h−1 | ||
| 0.11 h−1 | −0.133077 h−1 | ||
| 0.43 µM | [KaiC] | 3.4 µM |
-
All the values are from Lambert et al., 2016.
Appendix 1—table 2
Oligodeoxynucleotide primers used in this work.
| Name | Sequence 5′–3′ |
|---|---|
| alr0523-EcoRI-Fw | TTTTGAATTCGCTTATAAACAGCAGTTAACAGGCT |
| alr0523-Rev | TGCTACCTCCACCGCCTGCCTGTTCAACTACTTTGGA |
| 4G-GFP-Fw | GCGGTGGAGGTAGCAAAGGAGAAGAACTTTTCAC |
| GFP-Rev | GCCTGAATTCTTATTTGTATAGTTCATCCATGCC |
| alr0523-1-Fw | GAATTCGCTTATAAACAGCAGTTAACAGGCT |
| alr0523-1-Rev | CTAGCACCTCCACCGCCTGCCTGTTCAACTACTTTGGA |
| 4G-GFP-Fw in plasmid PCSV3 | ATTTGAAACTGCGCCACGGATC |
| Rev plasmid PCSV3 | GACCATGACGGATTAGCTCAGTAG |
| alr0523(7120)–1 | CGT GAG TCT CCA ACG GAG GC |
| Kai-1 | GAAACTGCAGGCAGAATAGGAAATCTCTAC |
| Kai-2 | CCAAATGATATCGTGCTGACAAACCTACAGTGC |
| Kai-3 | CAGCACGATATCATTTGGTATCGTACTATATTC |
| Kai-4 | CTTTCTGCAGGTTGTCCAGCCAGCAGGGTAG |
| kaiA-2 | CAGGGTGAGGCGATAATCCAT |
| kaiA-1 | GCCAGAGTACTTGTTTCTAAGCAAC |
| CK1-R | CGATTCCGAAGCCCAACCT |
| kaiC-4 | CGAGCTACCAACCGAAAG |
| kaiB-1 | CGGCAATACTCCAAACTCAG |
| PkaiBC-1 | GGTCTATCCCACGAGAAACC |
| YFP-2 | GGTAGCTCAGGTAGTGGTTGTC |
| all5167-1q (forward) | GCTCAAGCAATTCGTCACTGTTCC |
| all5167-2q (reverse) | AAAGATTGCGTCGGTCTGGTGT |
| rnpB-1q (forward) | CTCTTGGTAAGGGTGCAAAGGTG |
| rnpB-4q (reverse) | GGCTCTCTGATAGCGGAACTGG |
| kaiC-3q (forward) | ATGAAGCAGTGGGAGTGGTG |
| kaiC-8q (reverse) | ACGTTACGGGCTATGACCAC |
| kaiB-1q (forward) | ACCAAATTCAGTCAGGGCGT |
| kaiB-4q (reverse) | GCCAATCAGAACTCTTTCCCG |
| kaiA-3q (forward) | CAACTCAAATCAGATTATCGCCA |
| kaiA-4q (reverse) | CTGCCCTCTAGTCGTAGCTG |
| pecB-1q (forward) | ATATTTAATGCTGGTGGTGCTTGTT |
| pecB-4q (reverse) | GCAGCGATCGTCCATGACACTAC |
| rpaA-1q (forward) | TTTAACGCCGGAGCAGATGA |
| rpaA-4q (reverse) | TGTCCGTGACGTTGTAGCAA |
Additional files
Download links
A two-part list of links to download the article, or parts of the article, in various formats.
Downloads (link to download the article as PDF)
Open citations (links to open the citations from this article in various online reference manager services)
Cite this article (links to download the citations from this article in formats compatible with various reference manager tools)
Robust, coherent, and synchronized circadian clock-controlled oscillations along Anabaena filaments
eLife 10:e64348.
https://doi.org/10.7554/eLife.64348


