Drp1 is required for AgRP neuronal activity and feeding
- Institute of Human Nutrition, Columbia University Irving Medical Center, United States
- Department of Comparative Medicine, Yale University School of Medicine, United States
- Program in Integrative Cell Signaling and Neurobiology of Metabolism, Yale University School of Medicine, United States
- Department of Molecular Pharmacology and Therapeutics, Columbia University Irving Medical Center, United States
- Department of Cellular and Molecular Physiology, Yale University School of Medicine, United States
Figures
Figure 1
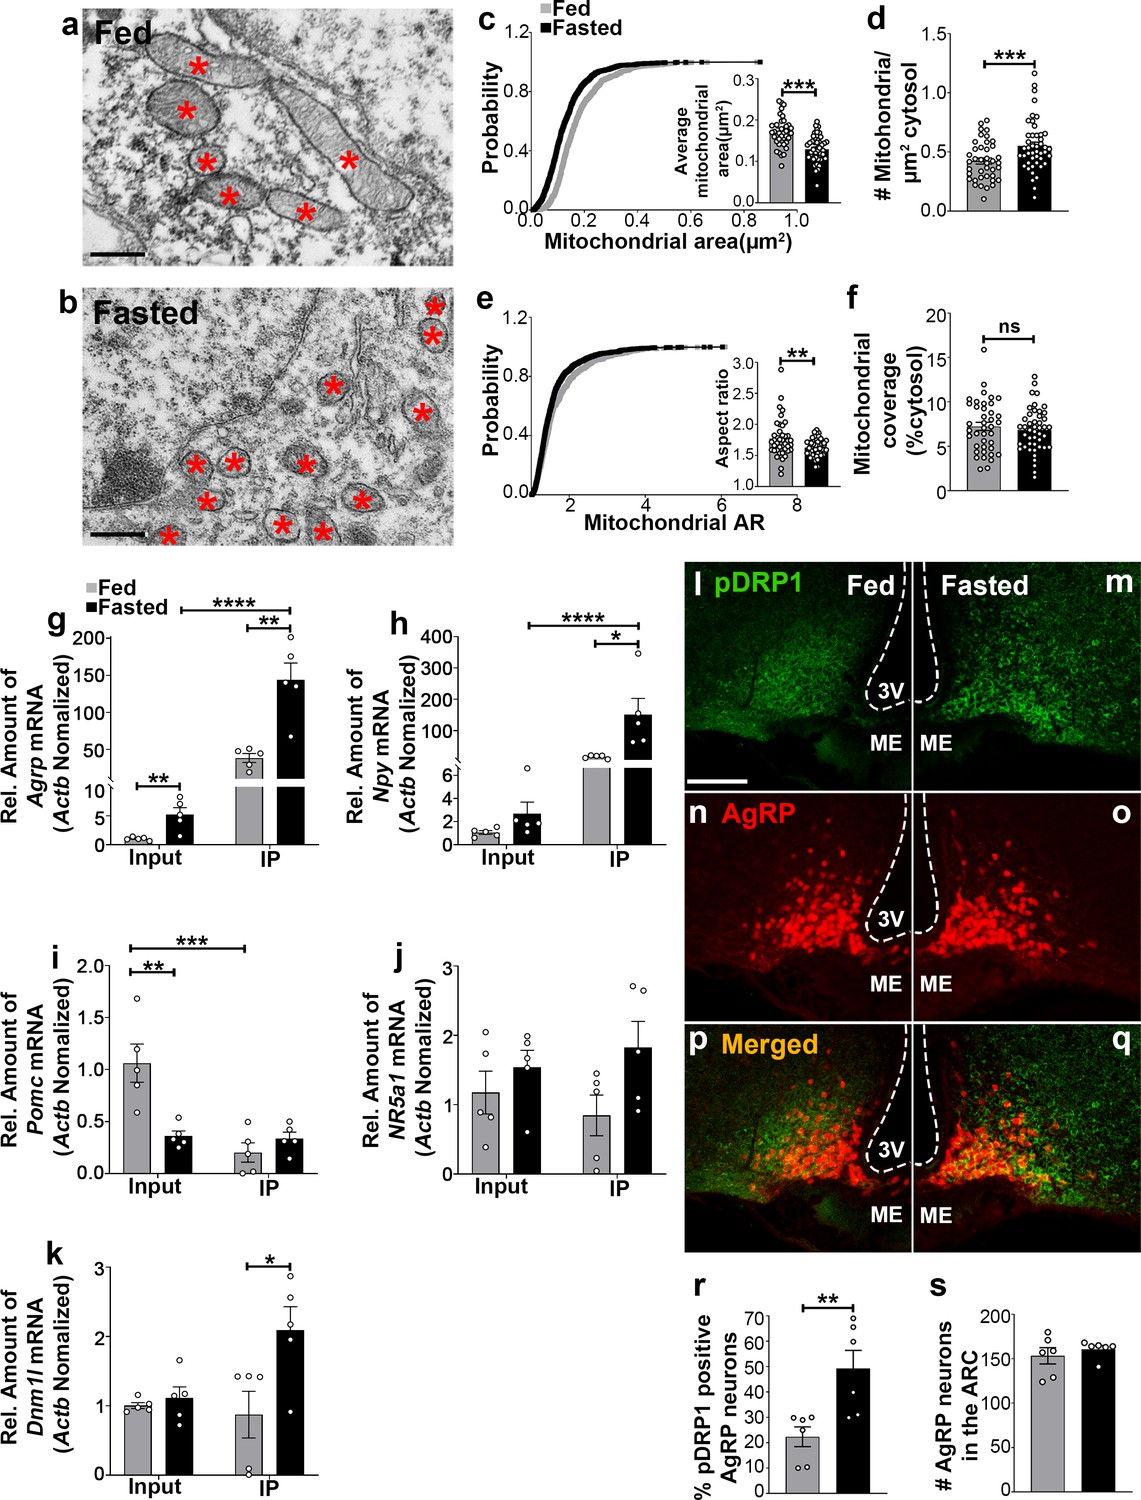
Fasting induces mitochondrial fission and activation of DRP1 in AgRP neurons.
(a and b) Representative electron micrographs showing mitochondria (asterisks) in an AgRP neuron of 5-month-old fed (a) and the fasted male mouse (b). Scale bar represents 500 nm. (c–f) Cumulative probability distribution of cross-sectional mitochondria area and average mitochondrial area (c), mitochondrial density (d), aspect ratio and a cumulative probability distribution of mitochondrial aspect ratio (e), and mitochondrial coverage (f) in AgRP neurons from fed and fasted male mice (fed mice, n = 779 mitochondria/39 AgRP neurons/4 mice; fasted mice, n = 1559 mitochondria/47 AgRP neurons/6 mice). Data are presented as mean ± SEM. **p<0.01; ***p<0.001 by two-tailed Student’s t-test. ns = not significant. (g–k) Real-time PCR data showing relative mRNA levels of Agrp (g), Npy (h), Pomc (i), Nr5a1 (j), and Dnm1l (k) in total lysate of hypothalami (Input) and isolated RNA bound to the ribosomes of the hypothalamic AgRP neurons (IP) from 3-month-old fed or fasted mice (n = 5/group). Three animals were pooled for each n. Data are presented as mean ± SEM. *p<0.05; **p<0.01; ***p<0.001; ****p<0.0001 by two-tailed Student’s t-test. (l–q) Representative micrographs showing immunostaining for phosphorylated DRP1 (at serine 616; pDRP1; green, l and m) and tdTomato (red, representing AgRP, n and o) and merged (p and q) in the hypothalamic ARC of 5-month-old fed and fasted male mice. Scale bar represents 100 µm. 3V = third ventricle; ARC = arcuate nucleus; ME = median eminence. (r) Graph showing the percentage of AgRP neurons immunopositive for pDRP1 (n = 6 mice/group). Data are presented as mean ± SEM. **p<0.01 by two-tailed Student’s t-test. (s) Graph showing no difference in total AgRP cell number between fed and fasted male mice (n = 6 mice/group). Data are presented as mean ± SEM. p=0.4711 by two-tailed Student’s t-test.
-
Figure 1—source data 1
Fasting induces mitochondrial fission and activation of DRP1 in AgRP neurons.
- https://cdn.elifesciences.org/articles/64351/elife-64351-fig1-data1-v3.xlsx
Figure 2 with 1 supplement
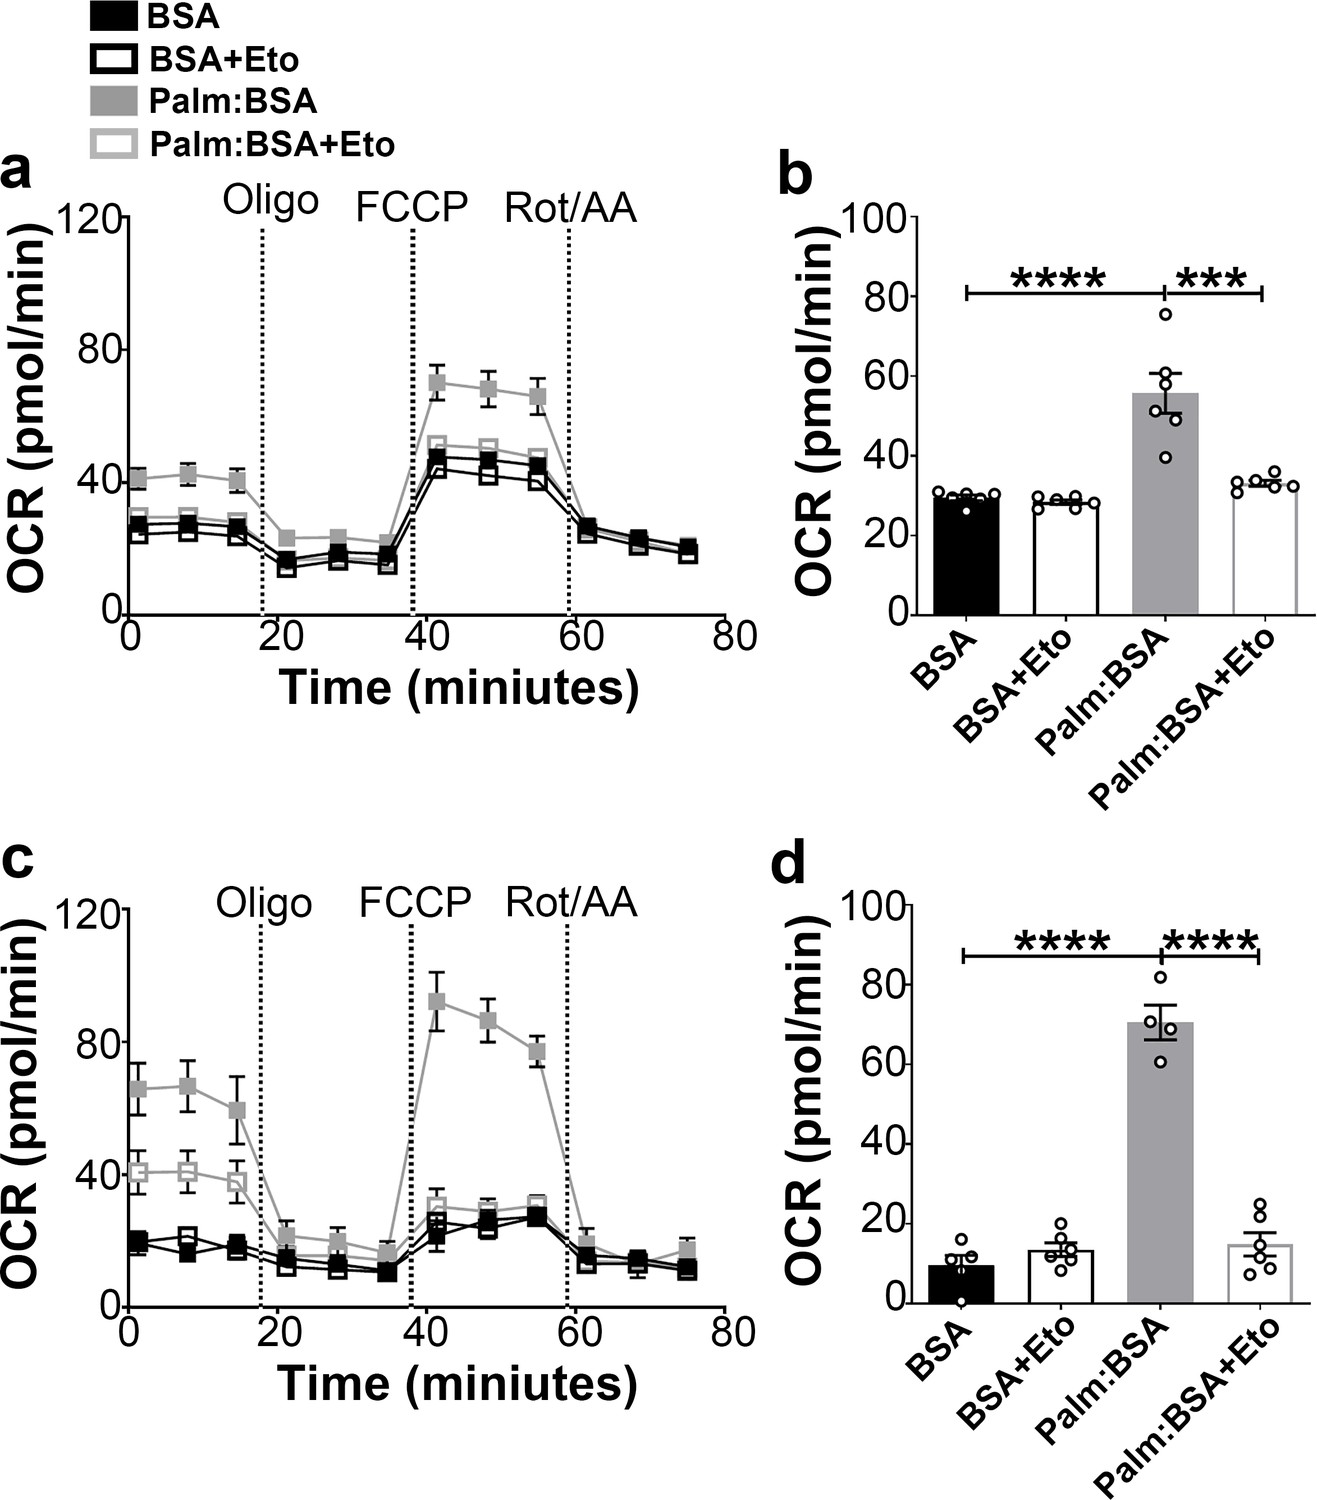
Fasting-induced β-oxidation in the hypothalamic neurons.
(a) Graphs showing oxygen consumption rate (OCR) under 2.5 mM glucose incubation with or without palmitate-BSA (200 μM) and with or without etomoxir (40 μM) in primary hypothalamic neuronal culture (n = 6–8/group) from Dnm1l+/+-AgrpCre:ERT2; tdTomato mice. Cultures were treated with tamoxifen (TMX). (b) Graph showing the quantification of OCR showed in panel (a) in primary hypothalamic neuronal culture. Data are presented as mean ± SEM. *p<0.05; ***p<0.001; ****p<0.0001 by two-way ANOVA with Tukey’s post hoc analysis for multiple comparisons. (c) Graphs showing OCR under low glucose (0.5 mM) with or without palmitate-BSA (200 μM) and with or without etomoxir (40 μM) in primary hypothalamic neuronal culture (n = 6–8/group). (d) Graph showing the quantification of OCR shown in panel c in primary hypothalamic neuronal culture. Data are presented as mean ± SEM. ***p<0.001; ****p<0.0001 by two-way ANOVA with Tukey’s post hoc analysis for multiple comparisons.
-
Figure 2—source data 1
Fasting-induced oxidation in the hypothalamic neurons.
- https://cdn.elifesciences.org/articles/64351/elife-64351-fig2-data1-v3.xlsx
Figure 2—figure supplement 1
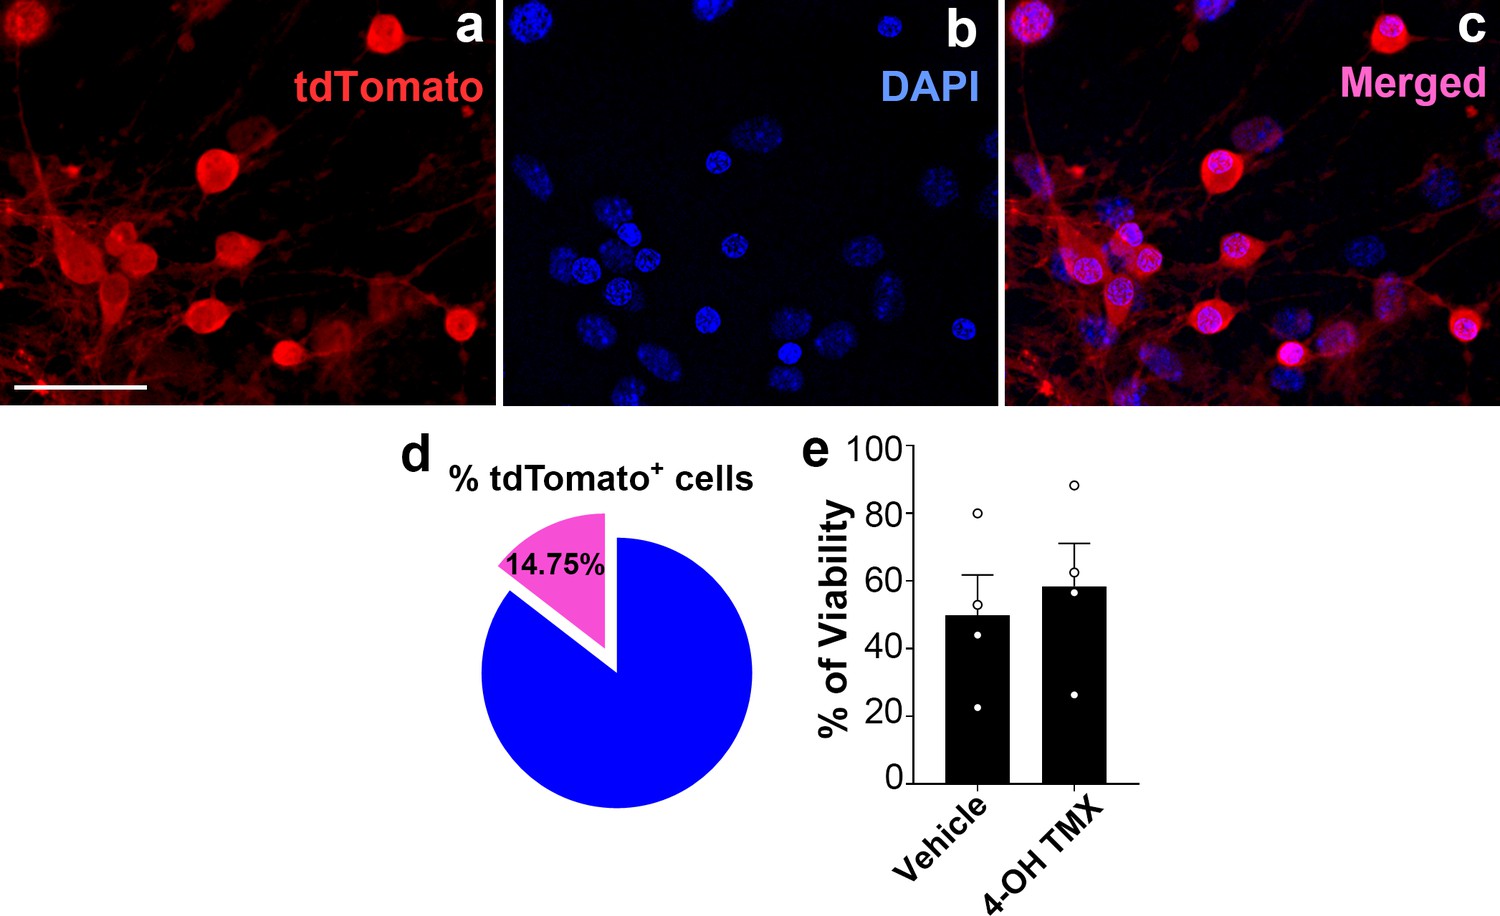
Percentage of tdTomato-expressing AgRP neurons and cell viability after 4-hydroxytamoxifen treatment in hypothalamic neuronal cell cultures.
(a–c) Representative micrographs showing fluorescent reporter gene tdTomato (red, representing AgRP neurons, a) and nuclei staining with DAPI (blue, b) and merged (c) in the primary hypothalamic neuronal cultures derived from a Dnm1l+/+; AgrpCre:ERT2 mice. Once cultured neurons were treated with 4-hydroxytamoxifen (2 μM) for tdTomato expression. Scale bar in a (for b and c) represents 20 µm. (d) Graph showing quantification of the percentage of tdTomato positive cells among DAPI-stained cells in the primary hypothalamic neuronal cultures (n = 8/group). (e) Graph showing the percentage quantification of the trypan blue cell viability assay in primary hypothalamic neuronal cells (n = 4/group) following either vehicle (ethanol) or 4-hydroxytamoxifen (2 μM) treatment. Data are presented as mean ± SEM. Two-tailed Student’s t-test was used for statistical significance.
-
Figure 2—figure supplement 1—source data 1
Tomatoes expressing AgRP neurons and cell viability.
- https://cdn.elifesciences.org/articles/64351/elife-64351-fig2-figsupp1-data1-v3.xlsx
Figure 3 with 2 supplements
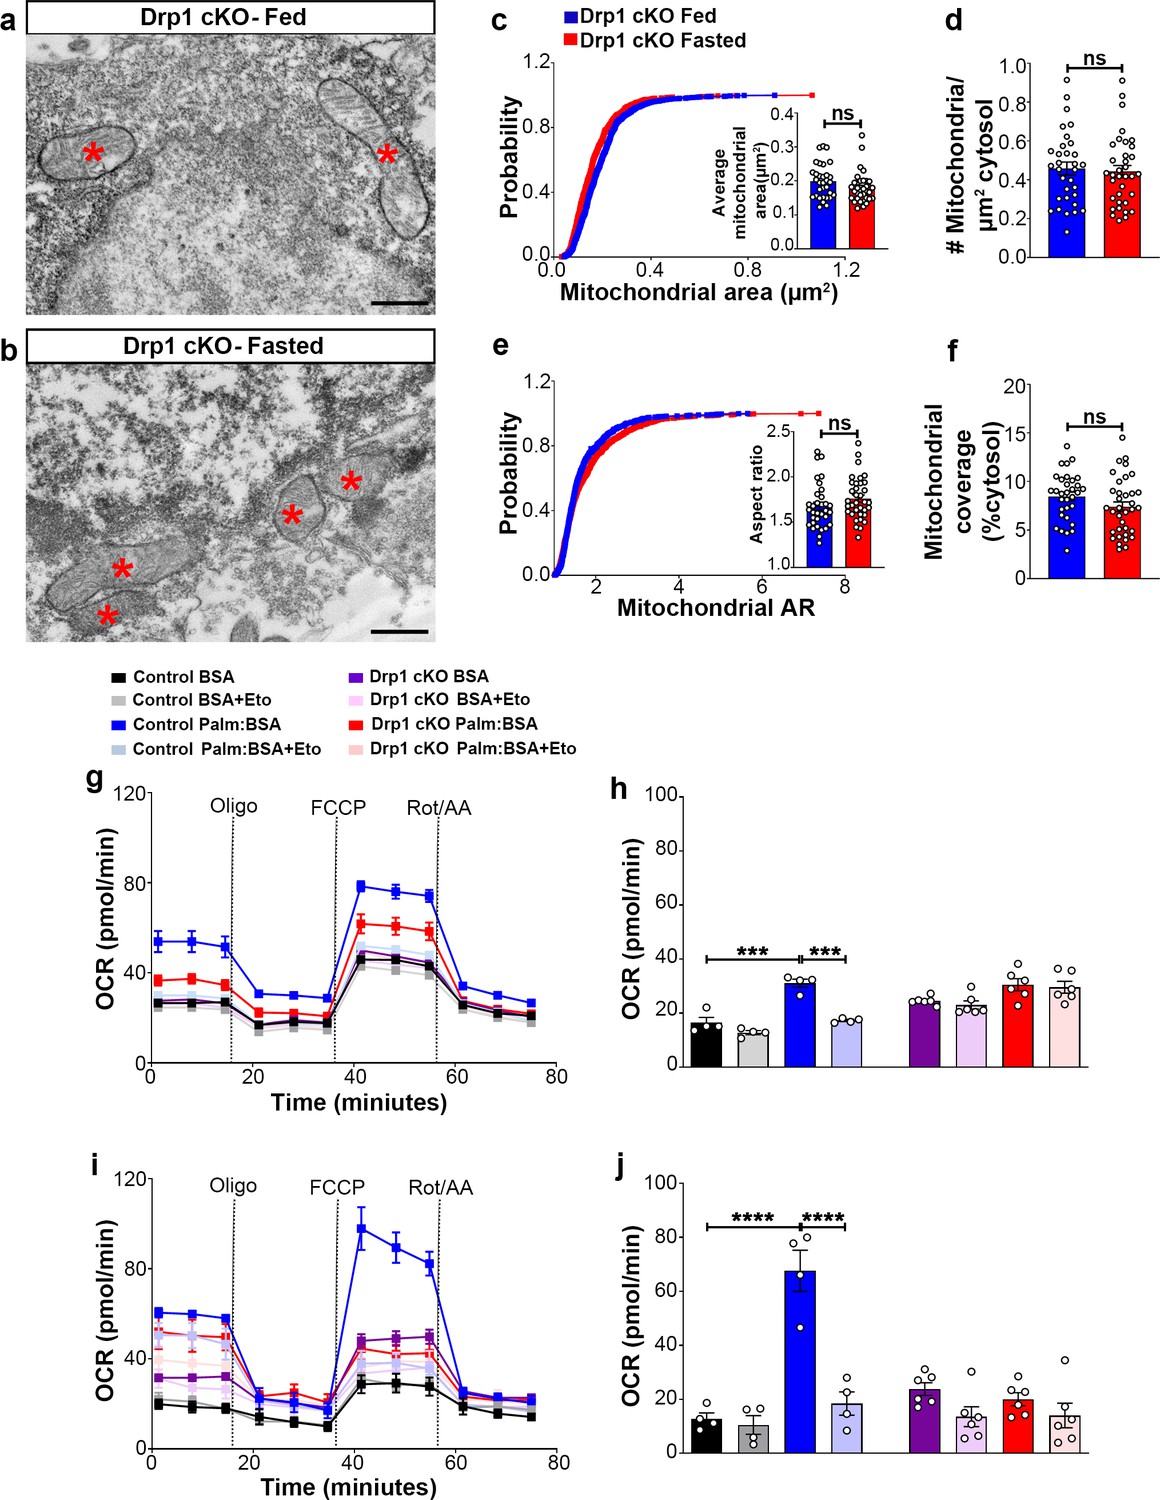
Deletion of Dnm1l in AgRP neurons affects fasting-induced mitochondrial fission and mitochondrial respiration.
(a and b) Representative electron micrographs showing mitochondria (asterisks) in an AgRP neuron of the 5-month-old fed Drp1 cKO (a) and the fasted Drp1 cKO male mice (b). Scale bar represents 500 nm. (c–f) Cumulative probability distribution of cross-sectional mitochondria area and average mitochondrial area (c), mitochondrial density (d), aspect ratio and a cumulative probability distribution of mitochondrial aspect ratio (e), and mitochondrial coverage (f) in AgRP neurons from fed Drp1 cKO (n = 720 mitochondria/32 AgRP neurons/4 mice) and fasted Drp1 cKO male mice (n = 746 mitochondria/35 AgRP neurons/4 mice). Data are presented as mean ± SEM. Two-tailed Student’s t-test was used for statistical significance. ns = not significant. (g and h) Graphs showing OCR (g) and its quantification (h) under 2.5 mM glucose incubation with or without palmitate-BSA (200 µM) and with or without etomoxir (40 µM) in primary hypothalamic neuronal culture of control (Dnm1lfl/fl; AgrpCre:ERT2; tdTomato treated with vehicle) and Drp1 cKO mice (n = 6–8/group). Data are presented as mean ± SEM. Two-way ANOVA with Tukey’s post hoc analysis for multiple comparisons was used for statistical significance. (i and j) Graphs showing OCR (i) and its quantification (j) under low glucose (0.5 mM) incubation with or without palmitate-BSA (200 µM) and with or without etomoxir (40 µM) in primary hypothalamic neuronal culture of control (Dnm1lfl/fl; AgrpCre:ERT2; tdTomato treated with vehicle) and Drp1 cKO mice (n = 6–8/group). Data are presented as mean ± SEM. Two-way ANOVA with Tukey’s post hoc analysis for multiple comparisons was used for statistical significance.
-
Figure 3—source data 1
Deletion of Dnm1l in AgRP neurons affects fasting-induced mitochondrial fission and mitochondrial respiration.
- https://cdn.elifesciences.org/articles/64351/elife-64351-fig3-data1-v3.xlsx
Figure 3—figure supplement 1
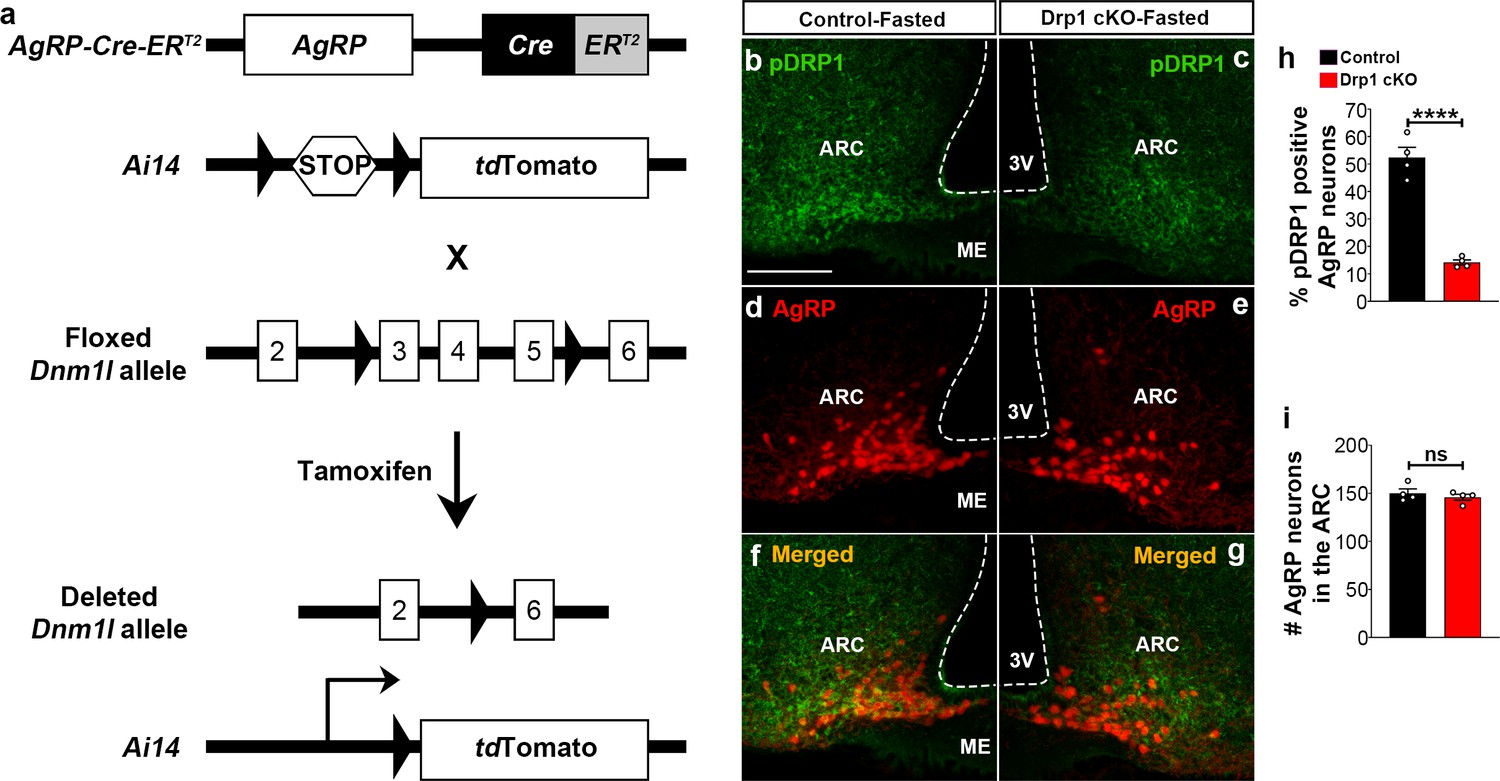
Generation of AgRP neurons-specific Dnm1l deleted mice.
(a) Schematic showing Dnm1lfl/fl and AgrpCre:ERT2 constructs and the strategy used to generate AgRP neurons-specific Dnm1l deleted mice. First, we generated AgrpCre:ERT2 mice harboring inducible tdTomato floxed by stop codon and then we crossed them with Dnm1lfl/fl mice. (b–g) Representative micrographs showing immunostaining for phosphorylated DRP1 (at serine 616; pDRP1; green, b and c) and fluorescent reporter gene tdTomato (red, representing AgRP, d and e) and merged (f and g) in the hypothalamic ARC of a fasted control (b, d, and f) and a fasted Drp1 cKO male mouse (c, e, and g). Scale bar represents 100 µm. 3V = third ventricle; ARC = arcuate nucleus; ME = median eminence. (h) Graph showing the percentage of pDRP1 expression in AgRP neurons of fasted control (n = 4 mice) and Drp1 cKO male mice (n = 4 mice). Data are presented as mean ± SEM. ****p<0.0001 by unpaired two-tailed Student’s t-tests. (i) Graph showing no difference in total AgRP cell number between fasted control (n = 4 mice) and Drp1 cKO mice (n = 4 mice). Data are presented as mean ± SEM. p=0.4605 by two-tailed Student’s t-test. ns = not significant.
-
Figure 3—figure supplement 1—source data 1
Generation of AgRP neuron-specific Dnm1l-deleted mice.
- https://cdn.elifesciences.org/articles/64351/elife-64351-fig3-figsupp1-data1-v3.xlsx
Figure 3—figure supplement 2
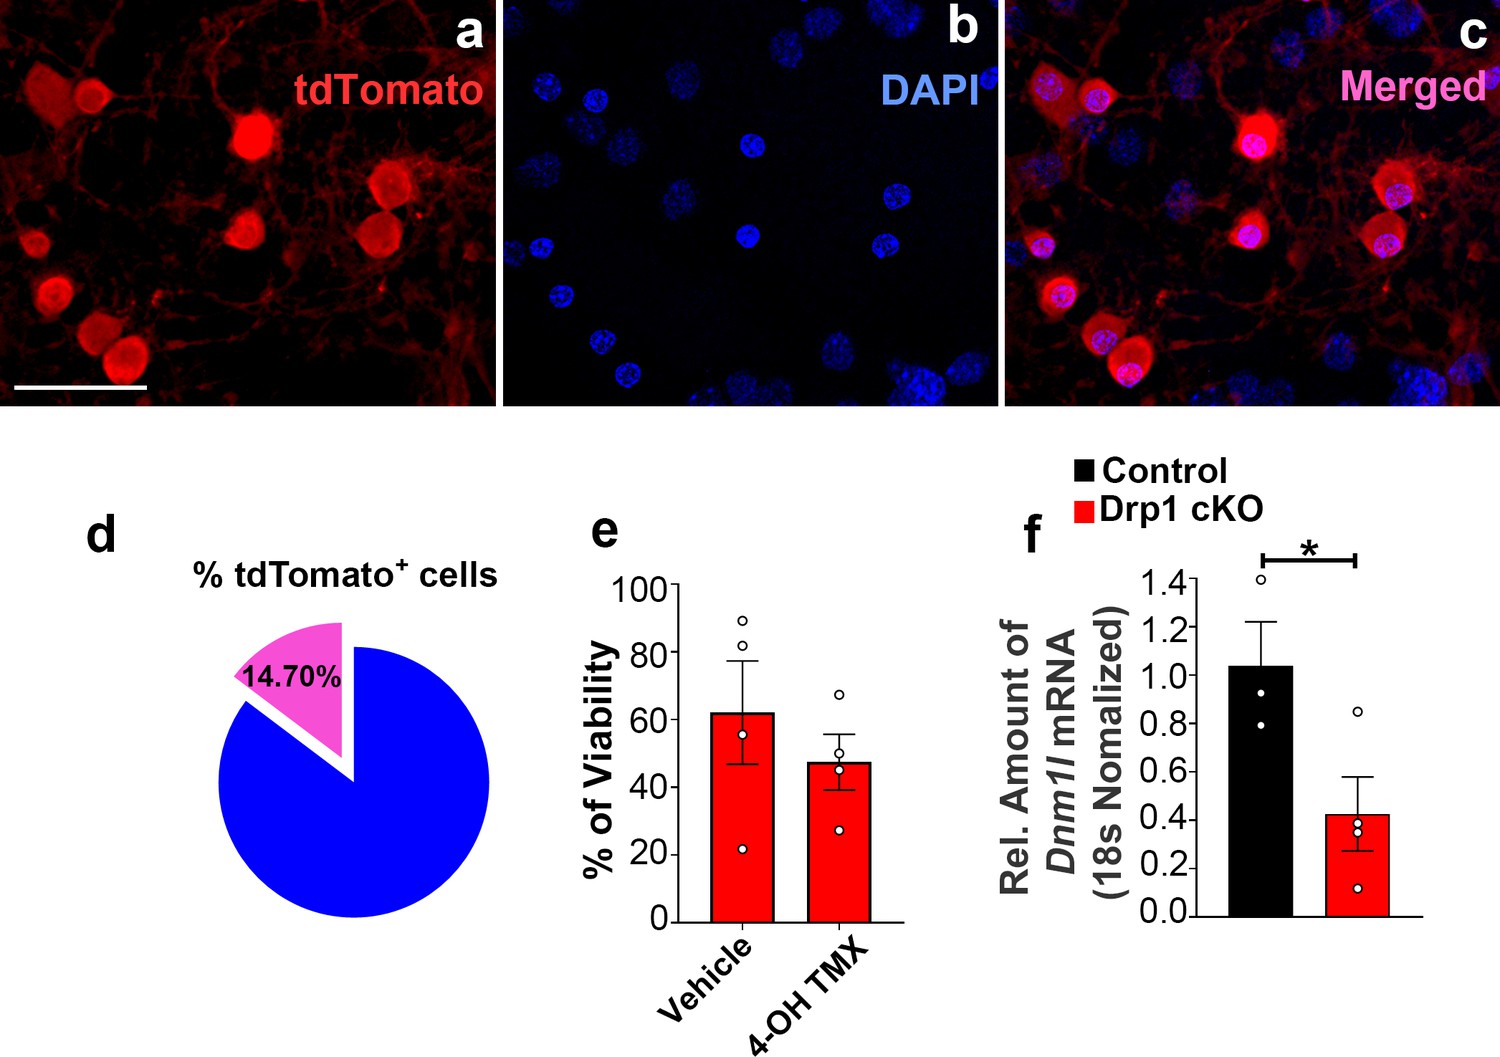
Percentage of tdTomato-expressing AgRP neurons and cell viability and Dnm1l deletion induced by 4-hydroxytamoxifen in hypothalamic neuronal cell cultures.
(a–c) Representative micrographs showing fluorescent reporter gene tdTomato (red, representing AgRP neurons, a) and nuclei staining with DAPI (blue, b) and merged (c) in the primary hypothalamic neuronal cultures derived from a Dnm1lfl/fl; AgrpCre:ERT2 mice. Once cultured neurons were treated with 4-hydroxytamoxifen (2 μM) for tdTomato expression. Bar scale in a (for b and c) represents 20 µm. (d) Graph showing quantification of the percentage of tdTomato positive cells among DAPI-stained cells in the primary hypothalamic neuronal cultures (n = 7/group). Please note that no significant difference was observed between the percentage of tdTomato positive cells in this group (from Dnm1lfl/fl;AgrpCre:ERT2 mice) and the tdTomato positive cells derived from Dnm1l+/+; AgrpCre:ERT2 mice shown in Figure 2—figure supplement 1d (p=0.9883 by two-tailed Student’s t-test). (e) Graph showing the percentage quantification of the trypan blue cell viability assay in primary hypothalamic neuronal cells from Drp1 cKO mice (n = 4/group) following either vehicle (ethanol) or 4-hydroxytamoxifen (2 μM) treatment. Data are presented as mean ± SEM. Two-tailed Student’s t-test was used for statistical significance. (f) Real-time PCR data showing relative mRNA levels of Dnm1l in the primary hypothalamic neuronal cell cultures from control (n = 3/group) and Drp1 cKO mice (n = 4/group). Data are presented as mean ± SEM. *p<0.05 by two-tailed Student’s t-test.
-
Figure 3—figure supplement 2—source data 1
Source data for Figure 3—figure supplement 2.
- https://cdn.elifesciences.org/articles/64351/elife-64351-fig3-figsupp2-data1-v3.xlsx
Figure 4 with 1 supplement
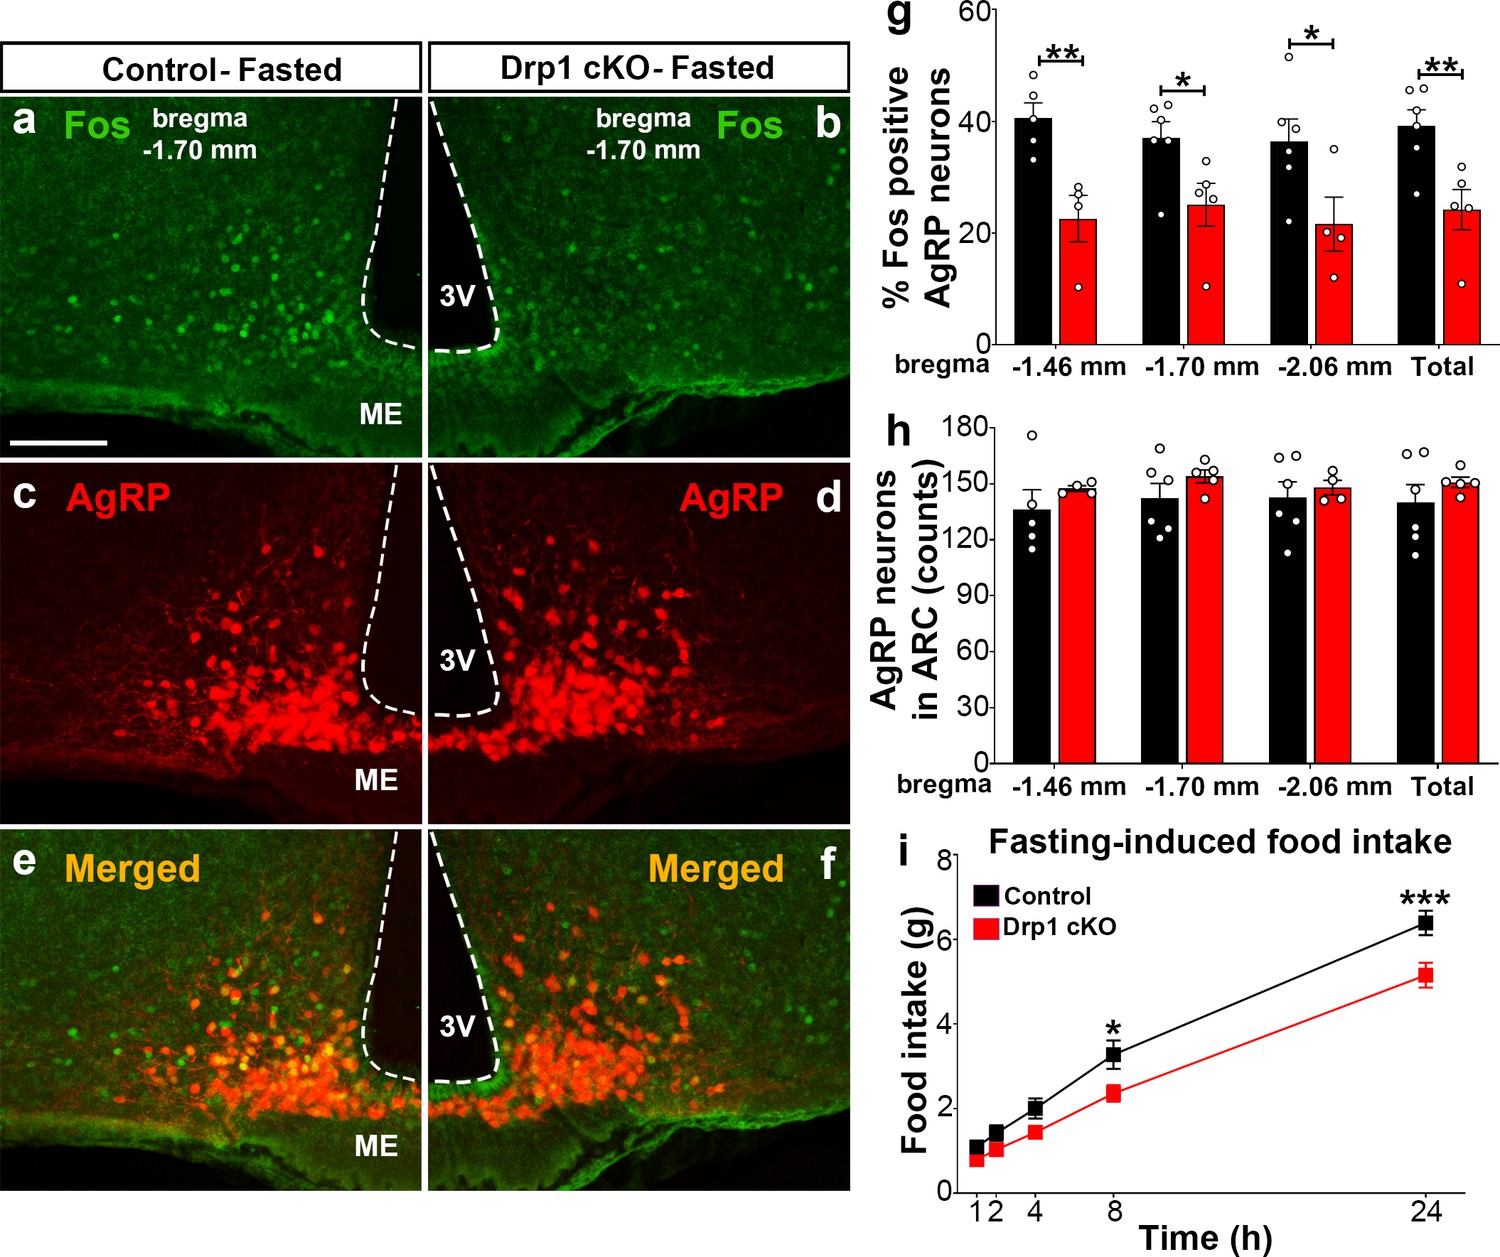
Dnm1l deficiency in AgRP neurons affects neuronal activation of the hypothalamic AgRP neurons.
(a–f) Immunostaining for Fos (green, a and b) and tdTomato (red, representing AgRP, c and d) and merged (e and f) in the hypothalamic ARC (bregma −1.70 mm) of a fasted male control (a, c, and e) and a Drp1 cKO mouse (b, d, and f) at 5 months of age. (g) Graph showing the percentage of Fos-positive AgRP neurons in the three bregma coordinates (bregma −1.46 mm, −1.70 mm, and −2.06 mm) corresponding to anterior, medial, and posterior ARC of fasted control (n = 5–6 mice) and Drp1 cKO male mice (n = 4–5 mice) at 5 months of age. Data are presented as mean ± SEM. *p<0.05; **p<0.01 by two-tailed Student’s t-test. (h) Graph showing the number of AgRP neurons in the three bregma coordinates (bregma −1.46 mm, −1.70 mm, and −2.06 mm) corresponding to anterior, medial, and posterior ARC of control (n = 5–6 mice) and Drp1 cKO mice (n = 4–5 mice) at 5 months of age. Data are presented as mean ± SEM. (i) Graph showing food intake in male control (n = 11 mice) and Drp1 cKO mice (n = 11 mice) at 4 months of age after overnight fasting (16 hr, 18.00–10.00). Data are presented as mean ± SEM. *p<0.05; ***p<0.001 by two-way ANOVA with Tukey’s post hoc analysis for multiple comparisons. 3V = third ventricle; ME = median eminence; ARC = arcuate nucleus.
-
Figure 4—source data 1
Dmn1l deficiency in AgRP neurons affects neuronal activation of the hypothalmic AgRP neurons.
- https://cdn.elifesciences.org/articles/64351/elife-64351-fig4-data1-v3.xlsx
Figure 4—figure supplement 1
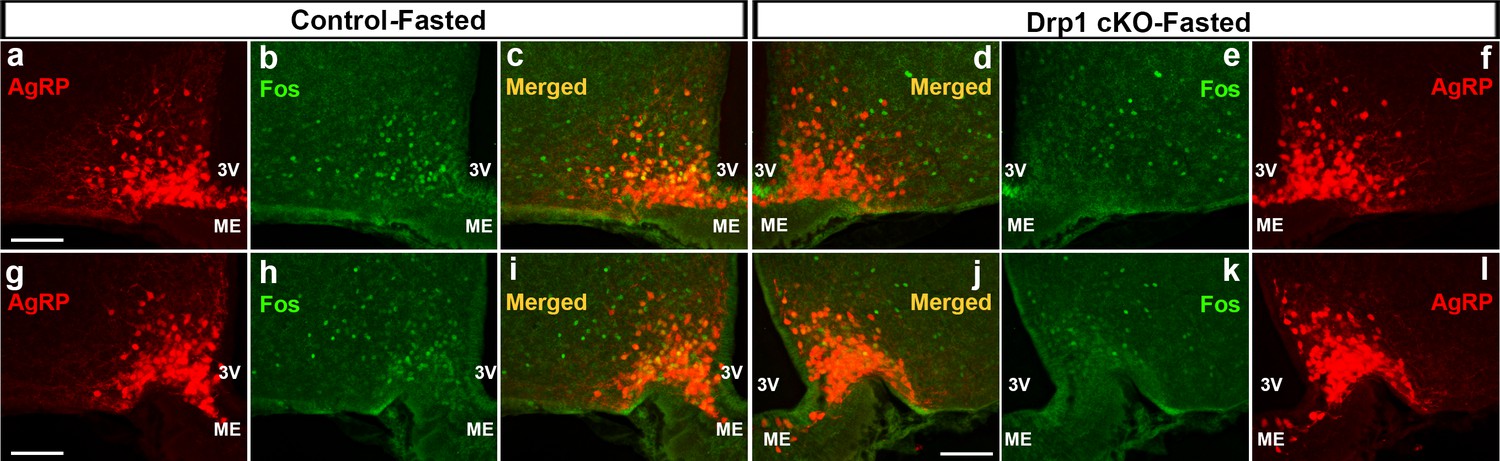
Inducible and selective deletion of Dnm1l in AgRP neurons decreases neuronal activation in the ARC.
(a–f) Immunostaining for Fos (green, a and f) and tdTomato (red, representing AgRP, b and e) and merged (c and d) in the hypothalamic ARC (bregma −1.46 mm) of a fasted male control (a–c) and a Drp1 cKO mouse (d–f) at 5 months of age after overnight fasting (16 hr, 18.00–10.00). (g–l) Immunostaining for Fos (green, g and l) and tdTomato (red, representing AgRP, h and k) and merged (i and j) in the hypothalamic ARC (bregma −2.06 mm) of a fasted male control (g–i) and a Drp1 cKO mouse (j–l) at 5 months of age after overnight fasting (16 hr, 18.00–10.00). 3V = third ventricle; ME = median eminence; ARC = arcuate nucleus.
Figure 5 with 2 supplements
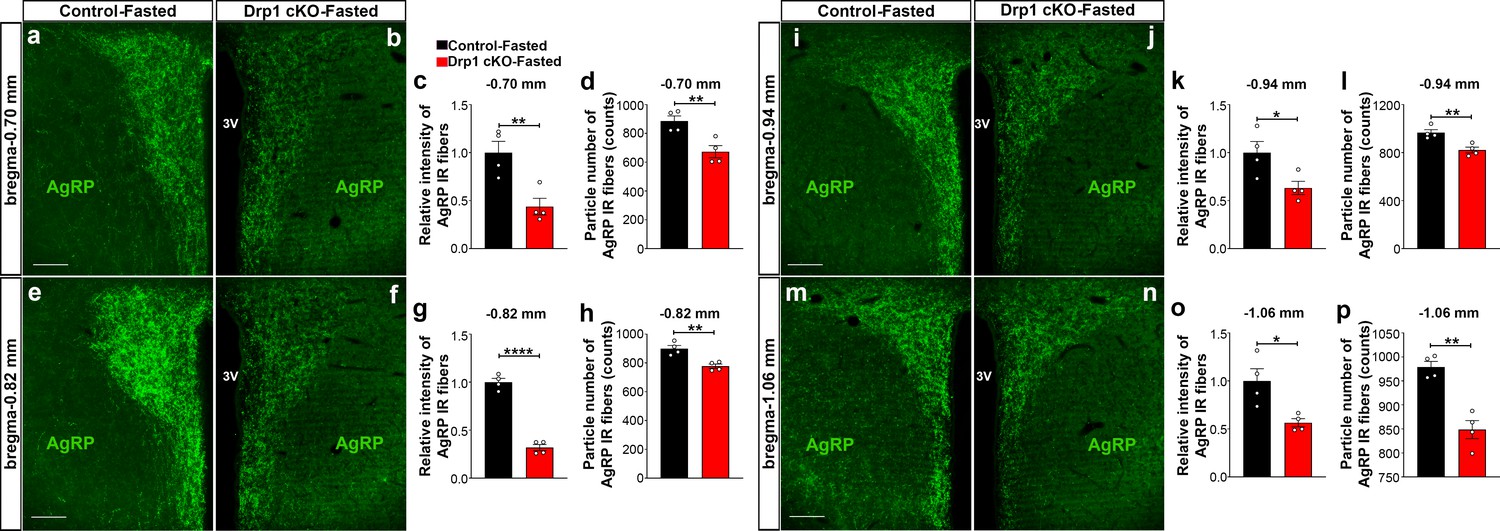
AgRP-selective Dnm1l deficiency affects AgRP projections within the hypothalamic PVN.
(a and b) Immunostaining for AgRP (green) in the PVN (bregma −0.70 mm) of a fasted male control (a) and a fasted Drp1 cKO mouse (b) at 5 months of age. (c and d) Graphs showing the quantification of relative intensity (c) and particle number (d) of AgRP fibers in the PVN (bregma −0.70 mm) of fasted male control and Drp1 cKO male mice (n = 4 mice). (e and f) Immunostaining for AgRP (green) in the PVN (bregma −0.82 mm) of a fasted male control (e) and a fasted Drp1 cKO mouse (f). (g and h) Graphs showing the quantification of relative intensity (g) and particle number (h) of AgRP fibers in the PVN (bregma −0.82 mm) of fasted male control and Drp1 cKO male mice (n = 4 mice). (i and j) Immunostaining for AgRP (green) in the PVN (bregma −0.94 mm) of a fasted male control (i) and a fasted Drp1 cKO mouse (j). (k and l) Graphs showing the quantification of relative intensity (k) and particle number (l) of AgRP fibers in the PVN (bregma −0.94 mm) of fasted male control and Drp1 cKO male mice (n = 4 mice). (m and n) Immunostaining for AgRP in the PVN (bregma −1.06 mm) of a fasted control (m) and a fasted Drp1 cKO mouse (n). (o and p) Graphs showing the quantification of relative intensity (o) and particle number (p) of AgRP fibers in the PVN (bregma −1.06 mm) of fasted control and Drp1 cKO male mice (n = 4 mice). Scale bar represents 100 µm (a, e, i, and m). All data are presented as mean ± SEM. *p<0.05; **p<0.01; ****p<0.0001 by two-tailed Student’s t-test. 3V = third ventricle; PVN = paraventricular hypothalamus.
-
Figure 5—source data 1
AgRP-selective Dnm1l deficiency affects AgRP projections within the hypothalmic PVN.
- https://cdn.elifesciences.org/articles/64351/elife-64351-fig5-data1-v3.xlsx
Figure 5—figure supplement 1
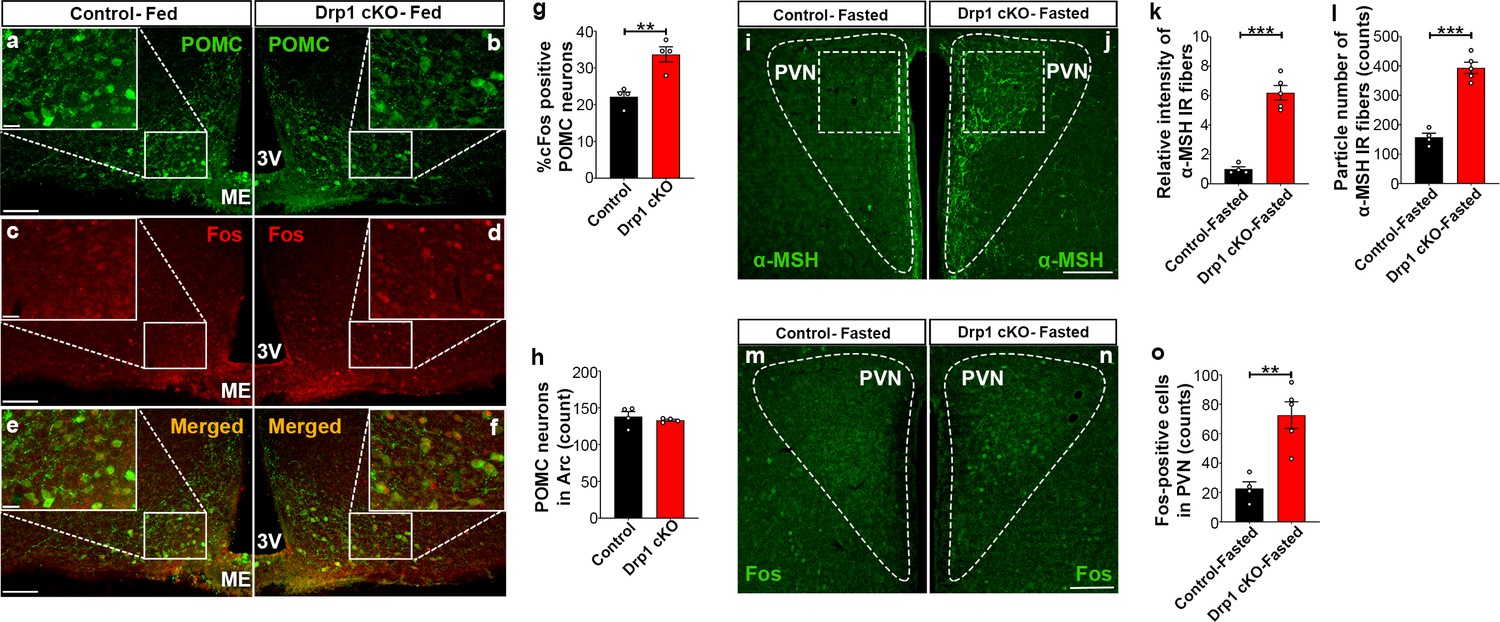
Deletion of Dnm1l in AgRP neurons affects hypothalamic POMC neurons.
(a–f) Representative micrographs of hypothalamic sections showing immunostaining for POMC (green, a and b), Fos (red, c and d), and merged (e and f) in the hypothalamic ARC of a 5-month-old fed control (a, c, and e) and a 5-month-old fed Drp1 cKO male mouse (b, d, and f). (g) Graph showing the percentage of Fos positive POMC neurons in 5-month-old fed control (n = 4 mice) and Drp1 cKO male mice (n = 4 mice). Data are presented as mean ± SEM. **p<0.01 by two-tailed Student’s t-test. (h) Graph showing no difference in total POMC cell number between 5-month-old fed control (n = 4 mice) and Drp1 cKO male mice (n = 4 mice). Data are presented as mean ± SEM. p=0.4951 by two-tailed Student’s t-test. (i and j) Representative micrographs of hypothalamic sections showing immunostaining for α-MSH fibers in a fasted control (i) and a fasted Drp1 cKO male mouse (j). Dashed lines delineate the PVN. Squared area represents the region used for analyses. (k and l) Graphs showing quantification of relative intensity (k) and particle number (l) of α-MSH fibers in hypothalamic PVN of fasted control (n = 4 mice) and Drp1 cKO male mice (n = 5 mice). (m and n) Representative micrographs of hypothalamic sections showing immunostaining for Fos from fasted control (m) and Drp1 cKO mouse (n). (o) Graph showing quantification of Fos expression in hypothalamic PVN neurons of fasted control (n = 4 mice) and Drp1 cKO male mice (n = 5 mice). All data are presented as mean ± SEM. **p<0.01; ***p<0.001 by two-tailed Student’s t-test. Scale bar represents 100 µm (a, d, and g). Scale bar in high magnification image represents 20 µm (a). 3V = third ventricle; PVN = paraventricular hypothalamus; ME = median eminence.
-
Figure 5—figure supplement 1—source data 1
Deletion of Dnm1l in AgRP neurons affects hypothalamic POMC neurons.
- https://cdn.elifesciences.org/articles/64351/elife-64351-fig5-figsupp1-data1-v3.xlsx
Figure 5—figure supplement 2
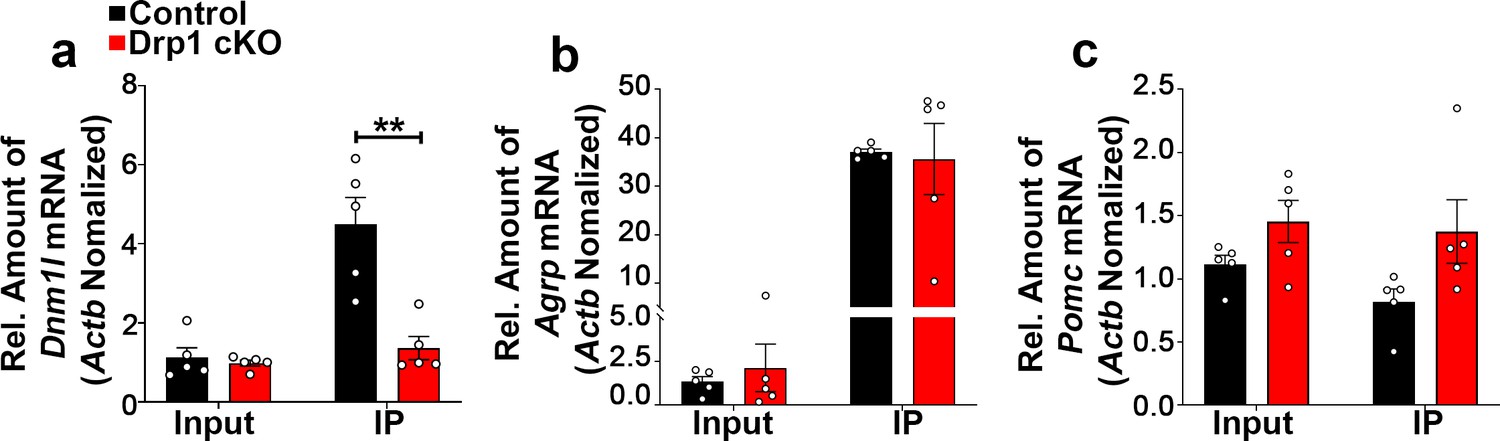
Deletion of Dnm1l in AgRP neurons does not alter gene expression levels of Agrp and Pomc in the hypothalamic ARC.
(a–c) Quantitative real-time PCR data showing relative mRNA levels of Dnm1l (a), Agrp (b), and Pomc (c) in total lysate of hypothalami (Input) and isolated RNA bound to the ribosomes of the hypothalamic AgRP neurons (IP) from 3-month-old fasted control and Drp1 cKO mice (n = 5/group). Three animals were pooled for each n. Data are presented as mean ± SEM. ****p<0.0001 by two-way ANOVA with Tukey’s post hoc analysis for multiple comparisons.
-
Figure 5—figure supplement 2—source data 1
Source data for Figure 5—figure supplement 2.
- https://cdn.elifesciences.org/articles/64351/elife-64351-fig5-figsupp2-data1-v3.xlsx
Figure 6 with 2 supplements

Deletion of Dnm1l in AgRP neurons affects metabolic phenotype in male mice.
(a) Graph showing body weight of Dnm1l+/+; AgrpCre:ERT2 mice injected with tamoxifen (n = 18 mice), Dnm1lfl/fl; AgrpCre:ERT2 mice injected with corn oil (n = 10 mice) as control groups, and Dnm1lfl/fl; AgrpCre:ERT2 mice injected with tamoxifen (n = 17 mice). Data are presented as mean ± SEM. *p<0.05; **p<0.01; ***p<0.001 for Dnm1l+/+; Agrpcre:ERT2-TMX versus Dnm1lfl/fl; AgrpCre:ERT2-TMX; #p<0.05; ##p<0.01; ###p<0.001 for Dnm1lfl/fl; AgrpCre:ERT2-Corn oil versus Dnm1lfl/fl; AgrpCre:ERT2-TMX by two-way ANOVA with Tukey’s post hoc analysis for multiple comparisons. (b and c) Graphs showing fat mass (b) and lean mass (c) of control mice (n = 20 mice) and Drp1 cKO mice (n = 22 mice). Data are presented as mean ± SEM. **p<0.01; ****p<0.0001 by two-way ANOVA with Tukey’s post hoc analysis for multiple comparisons. (d and e) Graphs showing cumulative 24 hr food intake in 4-month-old control (n = 14) and Drp1 cKO male mice (n = 18) (d), and results of food intake as total in the 24 hr cycle and in the dark and light phases of the cycle (e; average of 3 days). Gray area represents dark phases. Data are presented as mean ± SEM. *p<0.05; ****p<0.0001 by two-way ANOVA with Tukey’s post hoc analysis for multiple comparisons. (f–l) Graphs showing locomotor activity (f), energy expenditure (g–i), consumed O2 (j), produced CO2 (k), and the respiratory exchange ratio (RER) (l) in 4-month-old control (n = 14) and Drp1 cKO male mice (n = 18). Data are presented as mean ± SEM. *p<0.05; ***p<0.001; ****p<0.0001 by two-way ANOVA with Tukey’s post hoc analysis for multiple comparisons. p=0.8980 by linear regression analysis (i). *p<0.05 by two-tailed Student’s t-test (j–k).
-
Figure 6—source data 1
Deletion of Dnm1l in AgRP neurons affects metabolic phenotype in male mice.
- https://cdn.elifesciences.org/articles/64351/elife-64351-fig6-data1-v3.xlsx
Figure 6—figure supplement 1
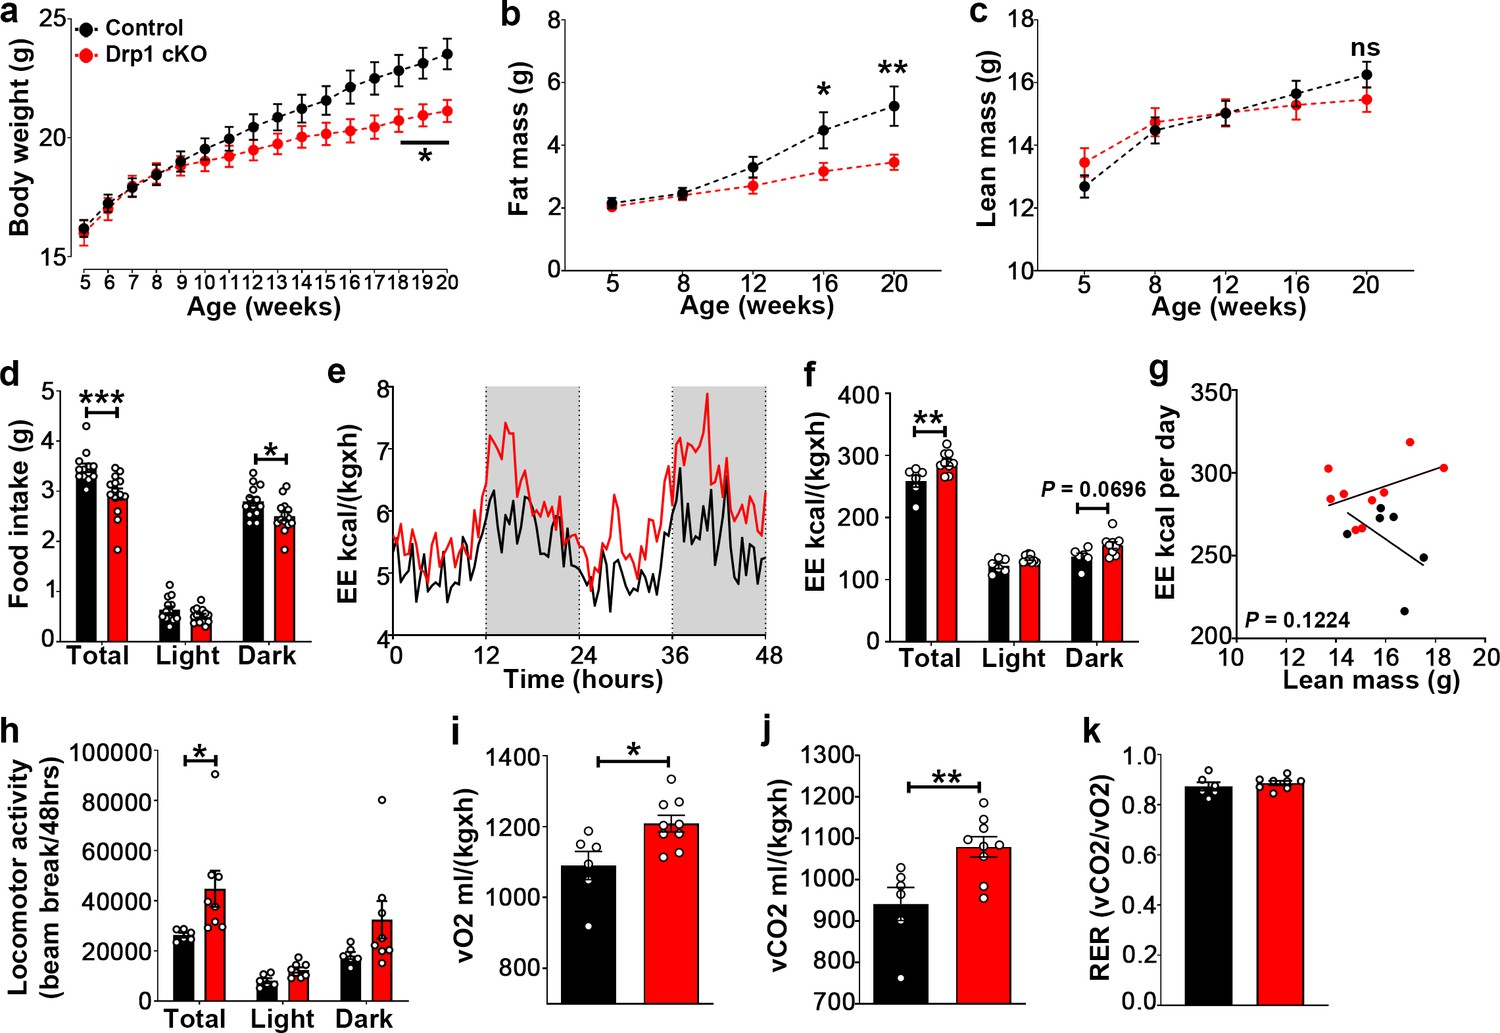
Selective Dnm1l deletion in AgRP neurons affects metabolic phenotype in female mice.
(a) Graphs showing body weight of control mice injected with tamoxifen (n = 20 mice) as control groups, and Drp1 cKO mice injected with tamoxifen (n = 22 mice). Data are presented as mean ± SEM. *p<0.05 by two-way ANOVA with Tukey’s post hoc analysis for multiple comparisons. (b and c) Graph showing fat mass (b), and lean mass (c) of control mice (n = 11 mice) and Drp1 cKO mice (n = 10 mice). Data are presented as mean ± SEM. *p<0.05; **p<0.01 by two-way ANOVA with Tukey’s post hoc analysis for multiple comparisons. ns = not significant. (d) Graphs showing 24 hr food intake (average of 3 days) in 4-month-old female control (n = 13) and Drp1 cKO mice (n = 14) and results of food intake as total in the 24 hr cycle and in the dark and light phases of the cycle. Data are presented as mean ± SEM. *p<0.05; ***p<0.001 by two-way ANOVA with Tukey’s post hoc analysis for multiple comparisons. (e–k) Graphs showing energy expenditure (e–g), locomotor activity (h), consumed O2 (i), produced CO2 (j), and the respiratory exchange ratio (RER) (k) in 4-month-old control (n = 13) and Drp1 cKO female mice (n = 14). Gray area represents dark phases (e). Data are presented as mean ± SEM. *p<0.05; **p<0.01 by two-way ANOVA with Tukey’s post hoc analysis for multiple comparisons (f and h). p=0.1224 by linear regression analysis (g). *p<0.05; **p<0.01 by two-tailed Student’s t-test (i and j).
-
Figure 6—figure supplement 1—source data 1
Selective Dnm1l deletion in AgRP neurons affects metabolic phenotype in female mice.
- https://cdn.elifesciences.org/articles/64351/elife-64351-fig6-figsupp1-data1-v3.xlsx
Figure 6—figure supplement 2
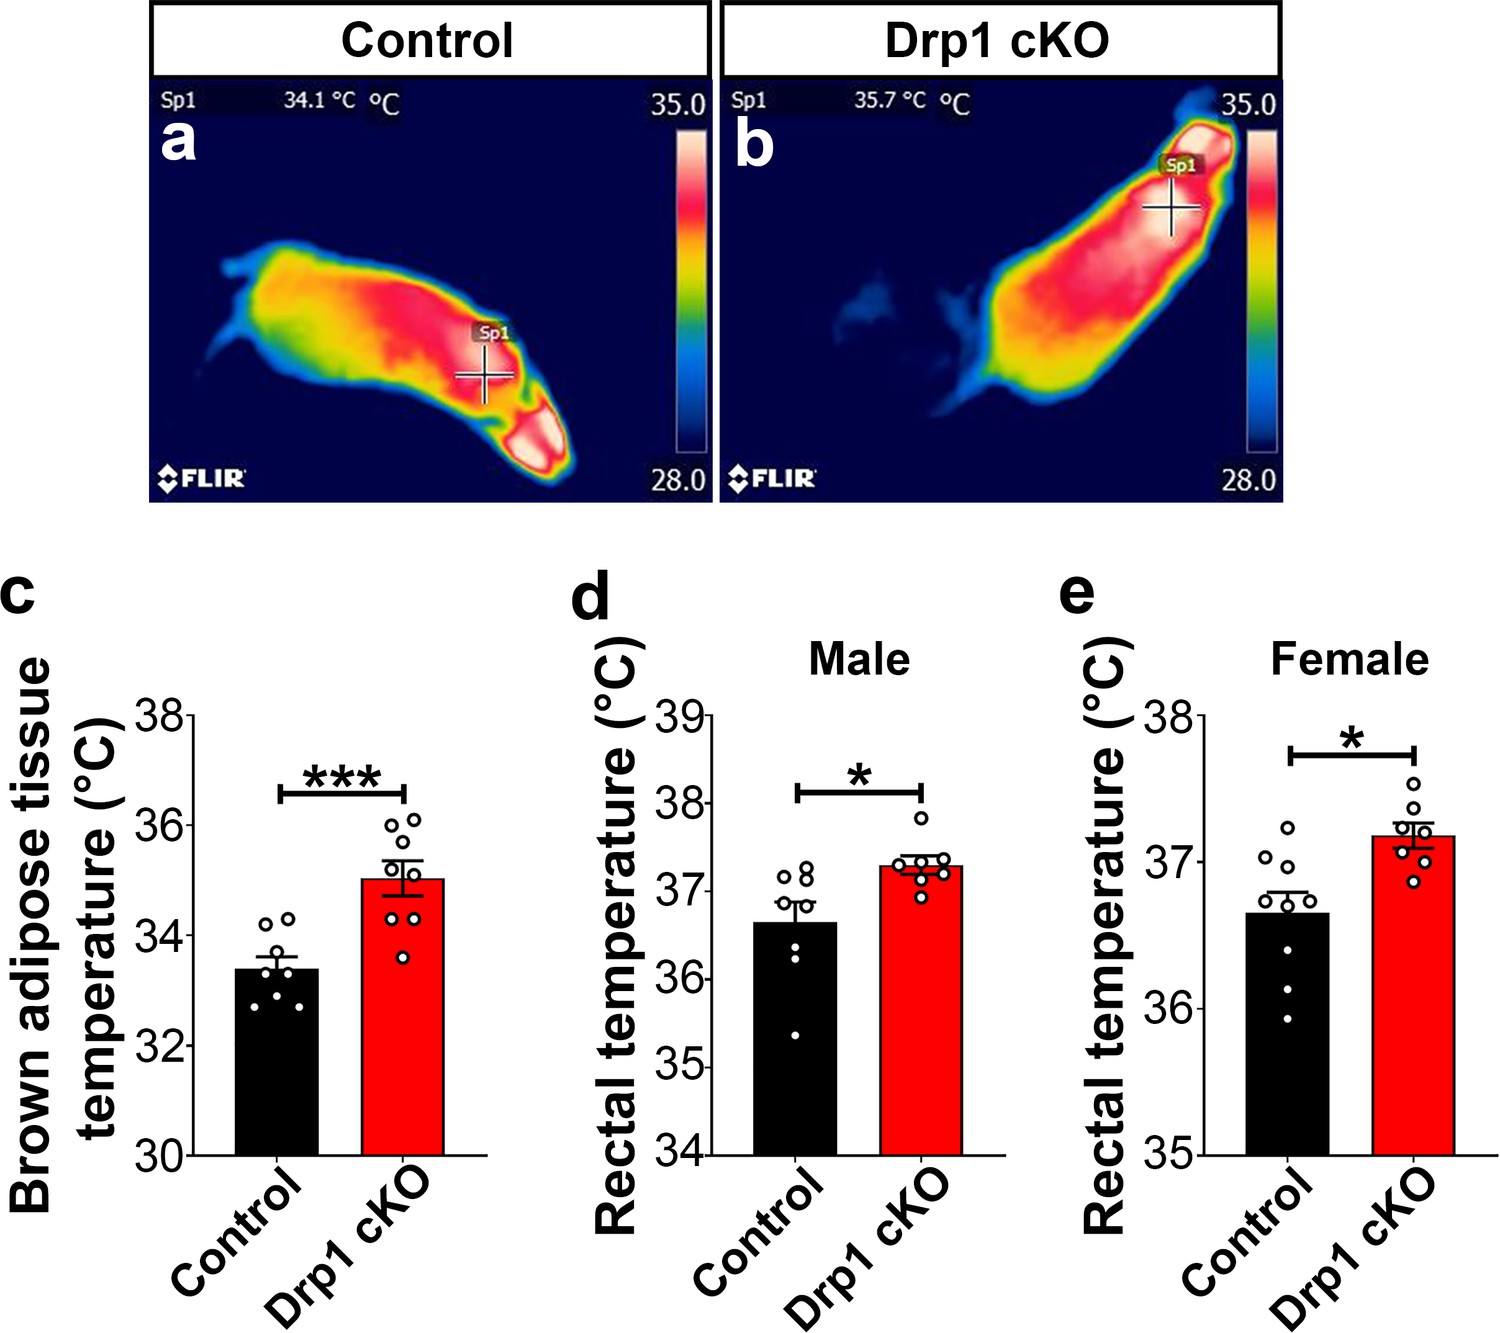
Deletion of Dnm1l in AgRP neurons results in increased BAT and core body temperature.
(a and b) Representative infrared thermography images showing the temperature of the surface overlying BAT in control (a) and Drp1 cKO male mouse (b). (c) Graph showing quantification of BAT temperature of the control (n = 8 mice) and Drp1 cKO male mice (n = 8 mice) at 4 months of age. Data are presented as mean ± SEM. ***p<0.001 by unpaired two-tailed Student’s t-tests. (d) Graph showing rectal temperature in 4-month-old control (n = 8 mice) and Drp1 cKO male mice (n = 7 mice). Data are presented as mean ± SEM. *p<0.05 by unpaired two-tailed Student’s t-tests. (e) Graph showing rectal temperature of 4-month-old control (n = 9 mice) and Drp1 cKO female mice (n = 7 mice). Data are presented as mean ± SEM. *p<0.05 by unpaired two-tailed Student’s t-tests.
-
Figure 6—figure supplement 2—source data 1
Deletion of Dnm1l in AgRP neurons results in increased BAT and core body temperature.
- https://cdn.elifesciences.org/articles/64351/elife-64351-fig6-figsupp2-data1-v3.xlsx
Figure 7 with 1 supplement

Deletion of Dnm1l in AgRP neurons attenuates ghrelin-induced neuronal activation and feeding.
(a–f) Immunostaining for Fos (green, a and b) and tdTomato (red, representing AgRP, c and d) and merged (e and f) in the ARC of a ghrelin-injected male control (a, c, and e) and a Drp1 cKO mouse (b, d, and f) at 5 months of age. (g) Graph showing the percentage of Fos expression in AgRP neurons of ghrelin-injected control and Drp1 cKO mice (n = 4–5 mice). Data are presented as mean ± SEM. ***p<0.001 by two-tailed Student’s t-test. (h) Graph showing the number of AgRP neurons of ghrelin-injected control and Drp1 cKO mice in the hypothalamic ARC (n = 4–5 mice). Data are presented as mean ± SEM. (i) Food intake in 4-month-old control and Drp1 cKO female mice at 5 months of age (n = 7–9 mice/group) after either saline or ghrelin injection. *p<0.05; **p<0.01; ***p<0.001; ****p<0.0001; Two-way ANOVA with Tukey’s post hoc analysis for multiple comparisons was performed. (j) Graph showing the membrane potential in AgRP neurons of 9–11-week-old control (n = 20 cells/10 mice) and Drp1 cKO male mice (n = 19 cells/10 mice) in response to ghrelin. *p<0.05; Two-way ANOVA with Tukey’s post hoc analysis for multiple comparisons was performed. (k) Graph showing normalized firing rate in AgRP neurons of 9–11-week-old control (n = 20 cells/10 mice) and Drp1 cKO male mice (n = 19 cells/10 mice) in response to ghrelin. Data are presented as mean ± SEM. **p<0.01 for artificial CSF-treated control versus ghrelin-treated control; *p<0.05 for ghrelin-treated control versus washed out control by two-way ANOVA with Tukey’s post hoc analysis for multiple comparisons. (l) Representative tracers of AgRP neurons from a control and a Drp1 cKO mouse in response to ghrelin. Scale bar represents 100 µm. Scale bar in high magnification image represents 20 µm. 3V = third ventricle; ME = median eminence.
-
Figure 7—source data 1
Deletion of Dnm1l in AgRP neurons attentuates ghrelin in induced neuronal activation and feeding.
- https://cdn.elifesciences.org/articles/64351/elife-64351-fig7-data1-v3.xlsx
Figure 7—figure supplement 1
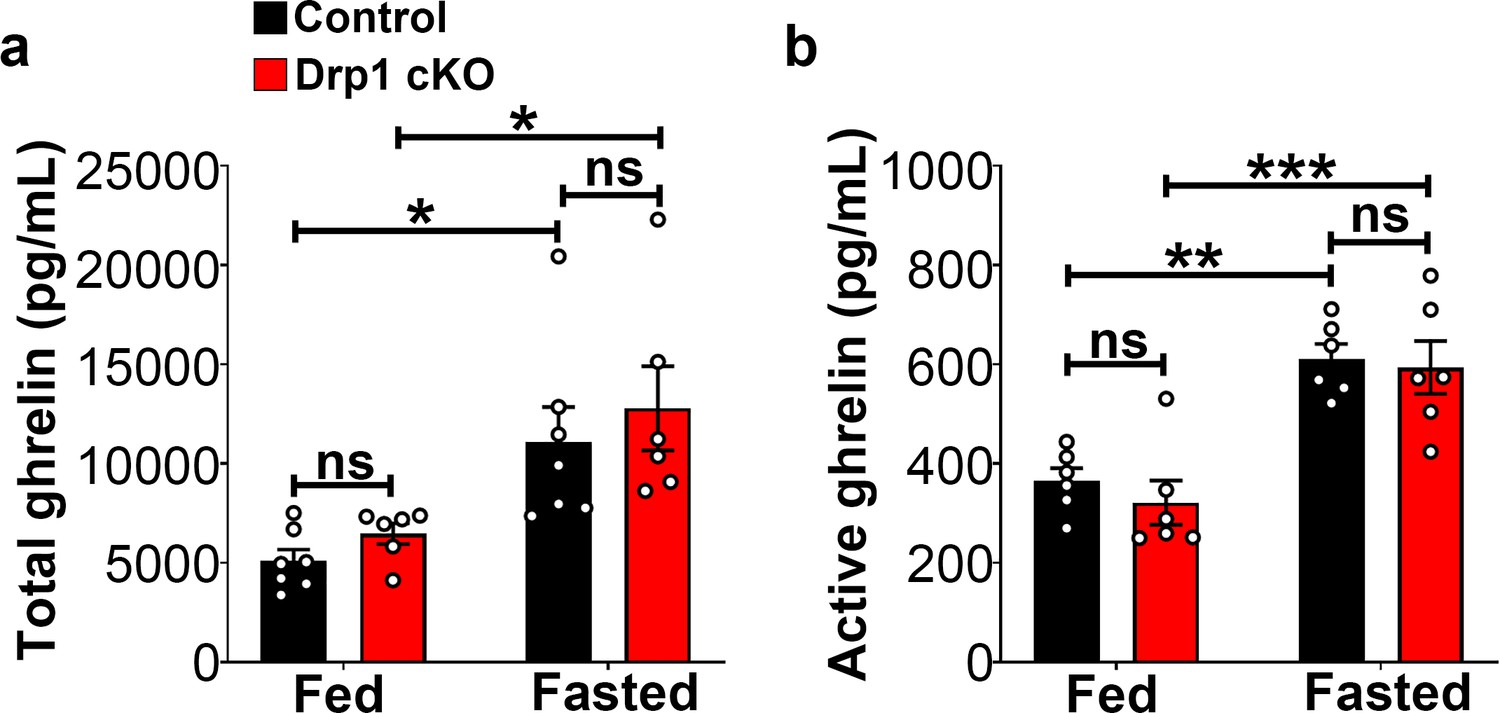
Ghrelin levels in male mice.
(a) Graph showing serum total ghrelin levels of 5-month-old control male (n = 7 mice) and Drp1 cKO male mice (n = 6 mice) on fed and fasted states. Data are presented as mean ± SEM. *p<0.05 by two-way ANOVA with Tukey’s post hoc analysis for multiple comparisons. ns = not significant. (b) Graph showing serum active ghrelin levels of 5-month-old control male (n = 6), and Drp1 cKO male mice (n = 6) on fed and fasted states. Data are presented as mean ± SEM. **p<0.01; ***p<0.001 by two-way ANOVA with Tukey’s post hoc analysis for multiple comparisons. ns = not significant.
-
Figure 7—figure supplement 1—source data 1
Ghrelin levels in male mice.
- https://cdn.elifesciences.org/articles/64351/elife-64351-fig7-figsupp1-data1-v3.xlsx
Tables
Key resources table
| Reagent type (species) or resource | Designation | Source or reference | Identifiers | Additional information |
|---|---|---|---|---|
| Strain, strain background (M. musculus) | AgrpCre:ERT2 | Wang et al., 2013 | ||
| Strain, strain background (M. musculus) | Ai14(Rosa-CAG-LSL-tdTmoato) | The Jackson Laboratory | Stock No: #007914 | |
| Strain, strain background (M. musculus) | Dnm1l floxed mouse | Kageyama et al., 2014 | ||
| Strain, strain background (M. musculus) | Rpl22 floxed mouse | The Jackson Laboratory | Stock No #029977 | |
| Biological sample (M. musculus) | Primary hypothalamic neuronal cells | This paper | Freshly isolated from M. musculus in S. Diano Lab. | |
| Antibody | Anti-HA antibody (Mouse monoclonal) antibody | Biolegend | Cat# 901513, RRID:AB_2565335 | Immunoprecipitation (5 µl/sample) |
| Antibody | Anti-phosphorylated DRP1 (Ser-616) antibody (Rabbit monoclonal antibody) | Cell Signaling Technology | Cat# 4494, RRID:AB_11178659 | IHC (1:500) |
| Antibody | Anti-Fos antibody (Rabbit polyclonal) antibody | Santa Cruz Biotechnology | Cat# sc-52, RRID:AB_2106783 | IHC (1:2000) |
| Antibody | Anti-POMC (Rabbit polyclonal) antibody | Phoenix Pharmaceuticals | Cat# H-029–30, RRID:AB_2307442 | IHC (1:2000) |
| Antibody | Anti-AgRP (Rabbit polyclonal) antibody | Phoenix Pharmaceuticals | Cat# H-003–57, RRID:AB_2313909 | IHC (1:1000) |
| Antibody | Anti-Melanocyte Stimulating Hormone (Sheep polyclonal) antibody | Millipore Sigma | Cat#: ab5087, RRID:AB_91683 | IHC (1:1000) |
| Antibody | Anti-rabbit Alexa Fluor 488 (donkey polyclonal antibody) | Life Technologies | Cat# A21206, RRID:AB_2535792 | IHC (1:500) |
| Antibody | Anti-sheep Alexa Fluor 488 (donkey polyclonal antibody) | Life Technologies | Cat# A11015, RRID:AB_141362 | IHC (1:1000) |
| Antibody | Alexa Fluor 594 anti-goat IgG (donkey polyclonal antibody) | Life Technologies | Cat# A11058, RRID:AB_2534105 | IHC (1:500) |
| Antibody | Biotinylated anti-rabbit IgG (goat polyclonal antibody) | Vector Laboratories | Cat# BA-1000, RRID:AB_2313606 | IHC (1:250) |
| Peptide, recombinant protein | Streptavidin-conjugated Alexa Fluor 488 | Life Technologies | Cat# A21370 | IHC (1:2000) |
| Sequence-based reagent | Dnm1l | Thermo Fisher Scientific | Assay ID Mm01342903_m1 | TaqMan Gene Expression Assay (FAM) |
| Sequence-based reagent | Agrp | Thermo Fisher Scientific | Assay ID Mm00475829_g1 | TaqMan Gene Expression Assay (FAM) |
| Sequence-based reagent | Npy | Thermo Fisher Scientific | Assay ID Mm01410146_m1 | TaqMan Gene Expression Assay (FAM) |
| Sequence-based reagent | Pomc | Thermo Fisher Scientific | Assay ID Mm00435874_m1 | TaqMan Gene Expression Assay (FAM) |
| Sequence-based reagent | Nr5a1 | Thermo Fisher Scientific | Assay ID Mm00446826_m1 | TaqMan Gene Expression Assay (FAM) |
| Sequenced-based reagent | Actb | Thermo Fisher Scientific | Assay ID Mm02619580_g1 | TaqMan Gene Expression Assay (FAM) |
| Sequenced-based reagent | Rn18s | Thermo Fisher Scientific | Assay ID Mm04277571_s1 | TaqMan Gene Expression Assay (FAM) |
| Peptide, recombinant protein | Ghrelin | ProSpec | Cat# HOR-297-B | |
| Commercial assay or kit | Ghrelin ELISA kit | Millipore Sigma | Cat# EZRGRT-91K | |
| Commercial assay or kit | Rat/Mouse Total Ghrelin ELISA kit | Millipore Sigma | Cat# EZRGRT-90K | |
| Chemical compound, drug | 4-hydroxytamoxifen | Sigma-Aldrich | Cat# H7904 | |
| Chemical compound, drug | Seahorse XF Palmitate-BSA FAO substrate | Agilent Technologies | Cat# 1102720–100 | |
| Chemical compound, drug | Oligomycin | Sigma-Aldrich | Cat# 495455 | |
| Chemical compound, drug | Carbonyl cyanide-p-(trifluoromethoxy) phenylhydrazone | Sigma-Aldrich | Cat# C2920 | |
| Chemical compound, drug | Antimycin A | Sigma-Aldrich | Cat# A8674 | |
| Chemical compound, drug | Rotenone | Sigma-Aldrich | Cat# R8875 | |
| Chemical compound, drug | Avidin–biotin–peroxidase | Vector Laboratories | ABC Elite kit | IHC (1:250) |
| Software, algorithm | FLIR Tools | FLIR Thermal Imaging System | FLIR C2 | |
| Software, algorithm | AxoGraph | AxoGraph Scientific | AxoGraph X | |
| Software, algorithm | KaleidaGraph | Synergy Software | KaleidaGraph v4.5.4 | |
| Software, algorithm | Leading Analysis Software | WaveMetrics | Igor Pro | |
| Software, algorithm | Prism software | GraphPad Software | Prism 7.01 software | |
| Other | Standard chow diet | Harlan Teklad | 2018; 18% calories from fat | |
| Other | DAPI | Thermo Fisher Scientific | Cat# P36962 |
Additional files
Download links
A two-part list of links to download the article, or parts of the article, in various formats.
Downloads (link to download the article as PDF)
Open citations (links to open the citations from this article in various online reference manager services)
Cite this article (links to download the citations from this article in formats compatible with various reference manager tools)
Drp1 is required for AgRP neuronal activity and feeding
eLife 10:e64351.
https://doi.org/10.7554/eLife.64351


