Microbiota functional activity biosensors for characterizing nutrient metabolism in vivo
- Edison Family Center for Genome Sciences and Systems Biology, Washington University School of Medicine, United States
- Center for Gut Microbiome and Nutrition Research, Washington University School of Medicine, United States
- Chemical Sciences Division, Oak Ridge National Laboratory, United States
- Mondelez International, United States
Figures
Figure 1

Isolation of an arabinose-rich fraction from pea fiber.
(A) Mole fraction of neutral monosaccharides from PFABN and SBABN. Mean values ± s.d. from triplicate technical measurements are shown. (B) Proposed structure of arabinan isolated from pea fiber and sugar beet as determined by glycosyl-linkage analysis. The colored arabinose monosaccharides highlight the different glycosyl branching patterns found in arabinan isolated from the two sources. (C) Growth curves of four Bacteroides strains cultured in minimal medium containing either glucose or arabinan as the sole carbon source. Data from samples where no exogenous carbon source was added are subtracted from all curves. Solid lines represent the mean and shaded area the s.e.m. of quadruplicate cultures (data shown are representative of 3 independent experiments). (See also Supplementary file 1).
Figure 2 with 1 supplement
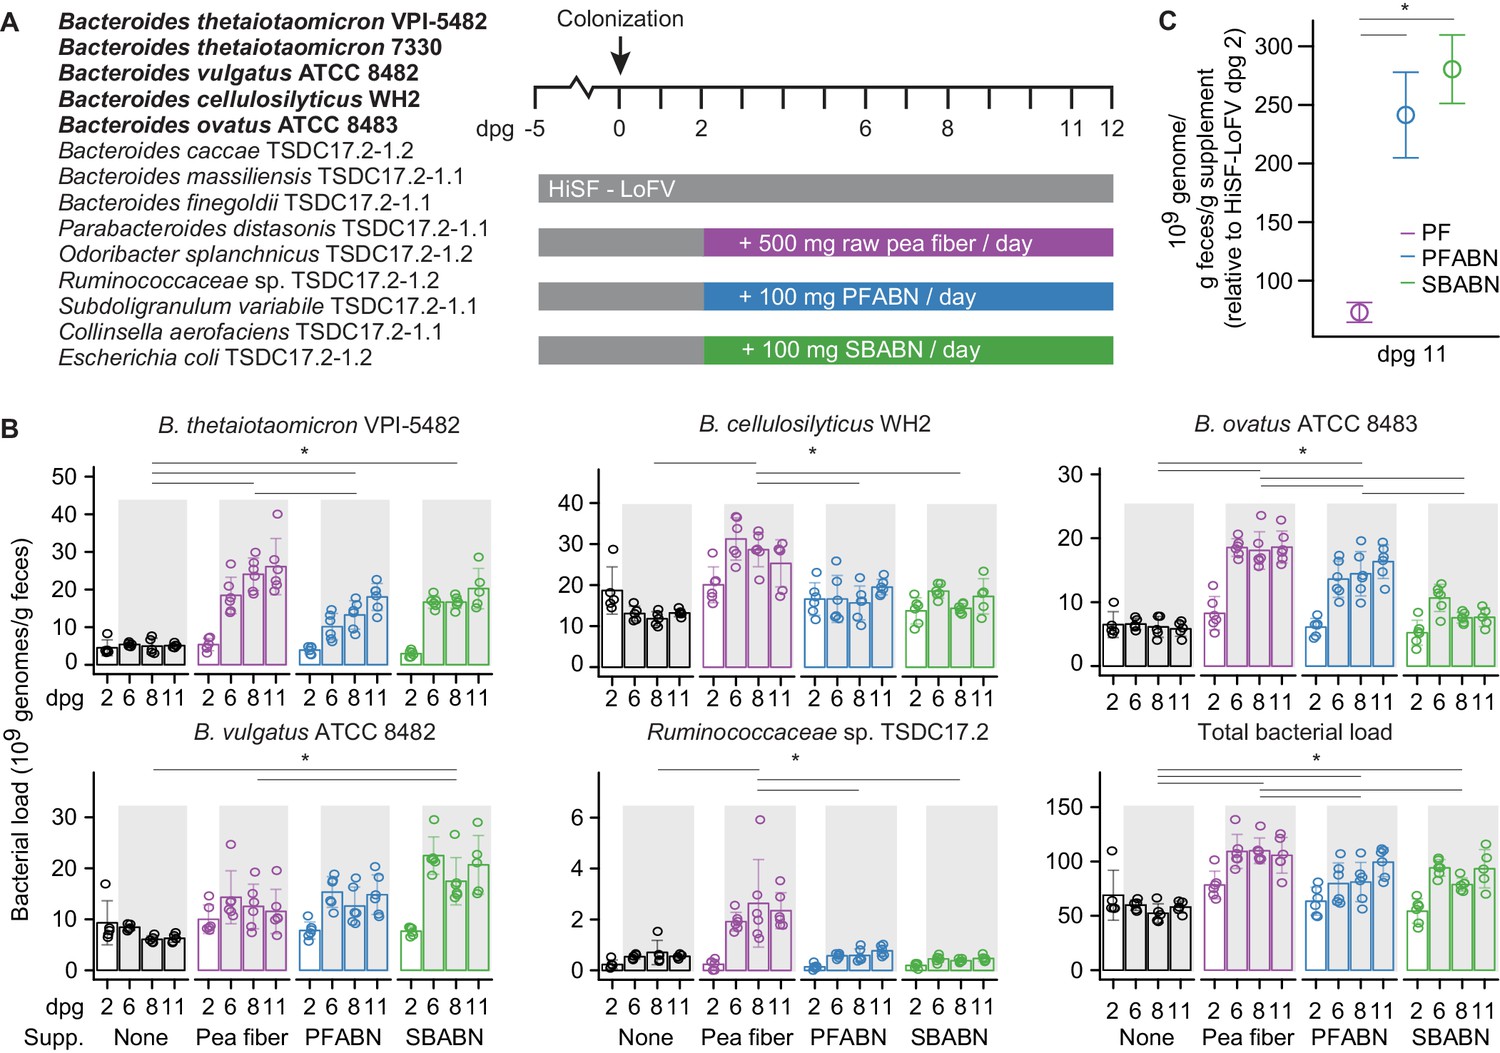
Assessing the biological activity of PFABN in gnotobiotic mice colonized with a defined consortium of human gut bacterial strains.
(A) Experimental design. Germ-free mice were fed the unsupplemented HiSF-LoFV diet for 5 days then colonized with the indicated group of 14 bacterial strains (the five Bacteroides strains represented in the form of Tn mutant libraries are highlighted in boldface). Two days after gavage of the consortium different groups of animals were switched to a HiSF-LoFV diet supplemented with raw pea fiber, PFABN or SBABN and fed that diet monotonously for 10 days (average dose of supplement consumed/per day is shown). Control animals were maintained on the unsupplemented HiSF-LoFV diet. (B) Absolute abundances of supplement-responsive bacterial strains, plus the total bacterial load of all 14 strains in fecal samples obtained at the indicated time points (each dot represents a single animal; bar height represents the mean; error bars represent s.d.). *p<0.01 for comparisons denoted by horizontal lines (generalized linear mixed-effects model [Gaussian]; two-way ANOVA with Tukey’s HSD, FDR corrected; the data shown are from Experiment two in Supplementary file 2 and are representative of two independent biological experiments). (C) Specific activity of each diet supplement on the summed total absolute abundances of the four diet-responsive Bacteroides. Open circles represent mean values and error bars the s.e.m. of two independent biological experiments (n = 10–11 mice/treatment arm). *p<0.01 for comparisons defined by the horizontal lines (generalized linear mixed-effects model [Gaussian]; two-way ANOVA with Tukey’s HSD, FDR corrected). (See also Supplementary files 2–4).
-
Figure 2—source data 1
Identifying PULs that function as key fitness determinants in the different diet contexts.
Plots represent of the log2 fitness score versus log2 fold change in protein abundance for all genes from a given organism: (A) B. thetaiotaomicron VPI-5482, (B) B. vulgatus ATCC 8482, (C) B. ovatus ATCC 8483, and (D) B. cellulosilyticus WH2, under the specified diet condition. Genes from the specified PUL are highlighted in blue. The overrepresentation of genes positioned in the right lower quadrants of the plots (i.e., those showing high expression and low fitness when they are disrupted by a transposon), was defined with a chi-square test using all other genes with both proteomic and INSeq data as the null. The central shaded region represents an ellipse of the inter-quartile range of both the fitness score and protein abundance for that organism under the specified diet condition. This region was excluded from the chi-square calculation of a PUL being overrepresented in the lower right quadrant to increase the stringency of the test. Presented p-values are FDR corrected.
- https://cdn.elifesciences.org/articles/64478/elife-64478-fig2-data1-v1.pdf
Figure 2—figure supplement 1
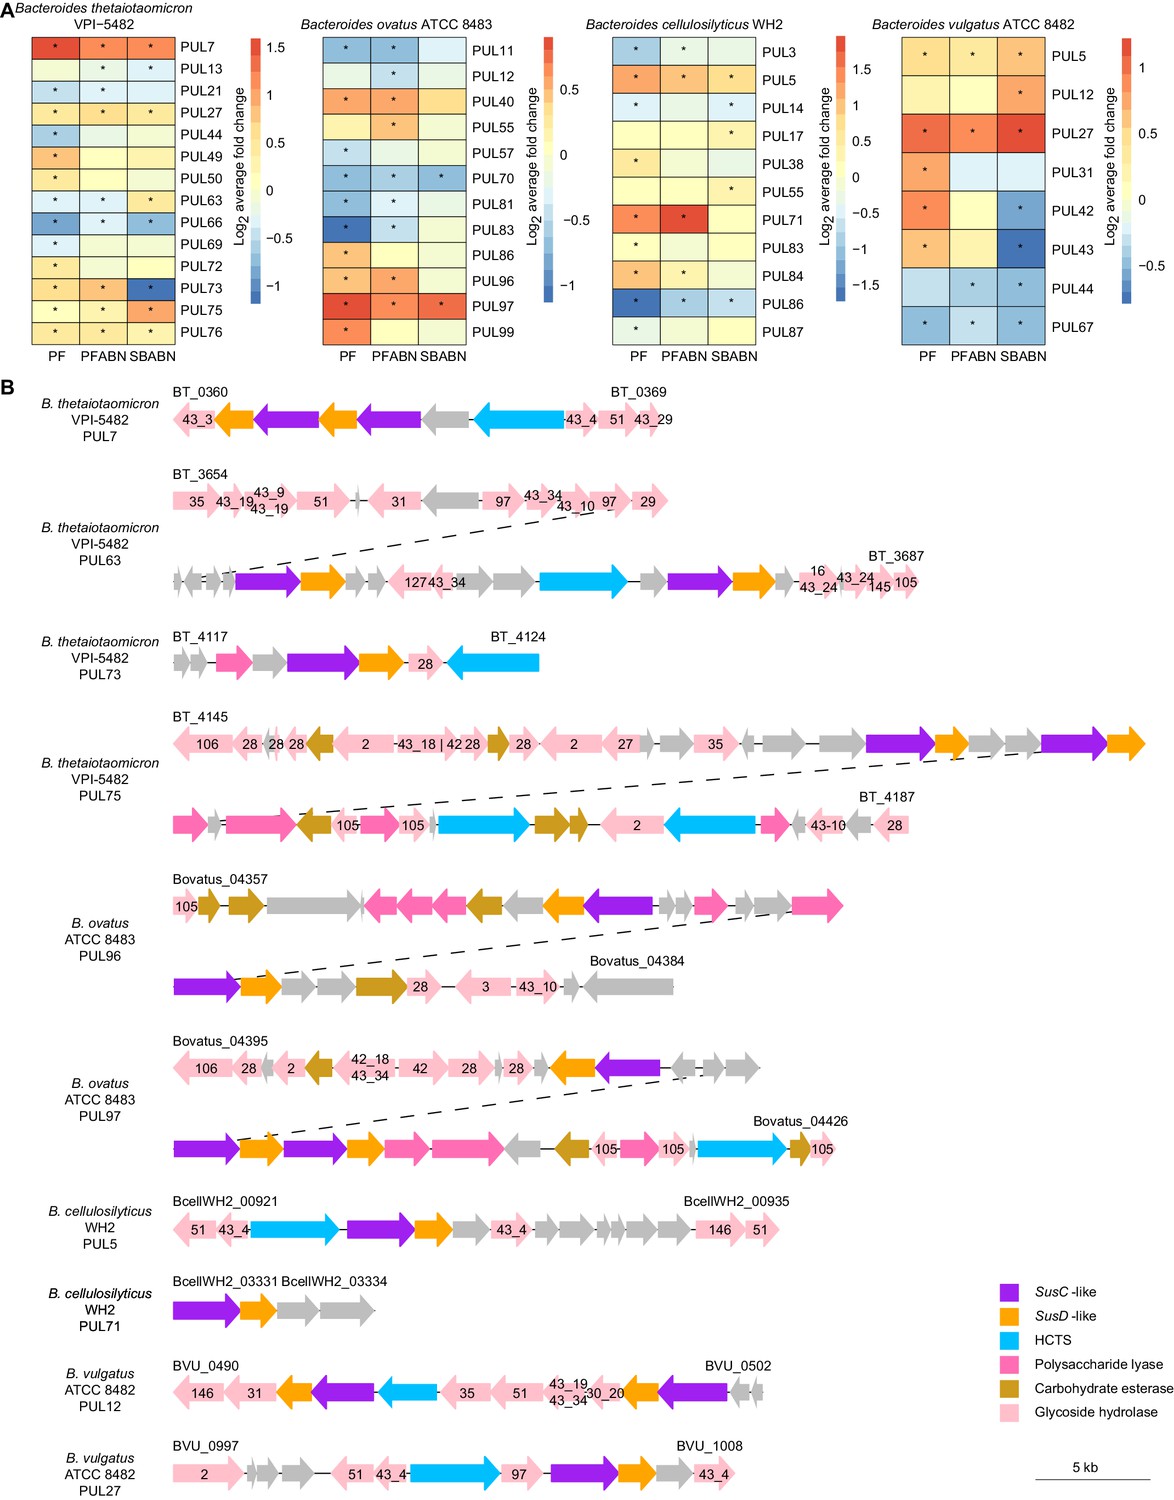
The effects of supplementing the HiSF-LoFV diet with unfractionated pea fiber, PFABN, or SBABN on PUL gene expression.
(A) Heat map of the average log2 fold change in abundance of proteins within PULs identified as supplement-responsive using GSEA. *p<0.05 (unpaired one-sample Z-test, FDR corrected) compared to PUL protein abundance when mice were fed the base HiSF-LoFV diet. (B) Organization of supplement-responsive PULs. GH family annotations are included within the colored arrow and are based on PULDB (http://www.cazy.org/PULDB/) accessed on December 6, 2019. Genes denoting the beginning and end of each PUL are noted with their locus tags above the left and right boundaries of the PUL. Dashed lines represent the continuation of a single PUL. PUL annotations and boundaries are identical to those described in Patnode et al., 2019.
Figure 3 with 3 supplements
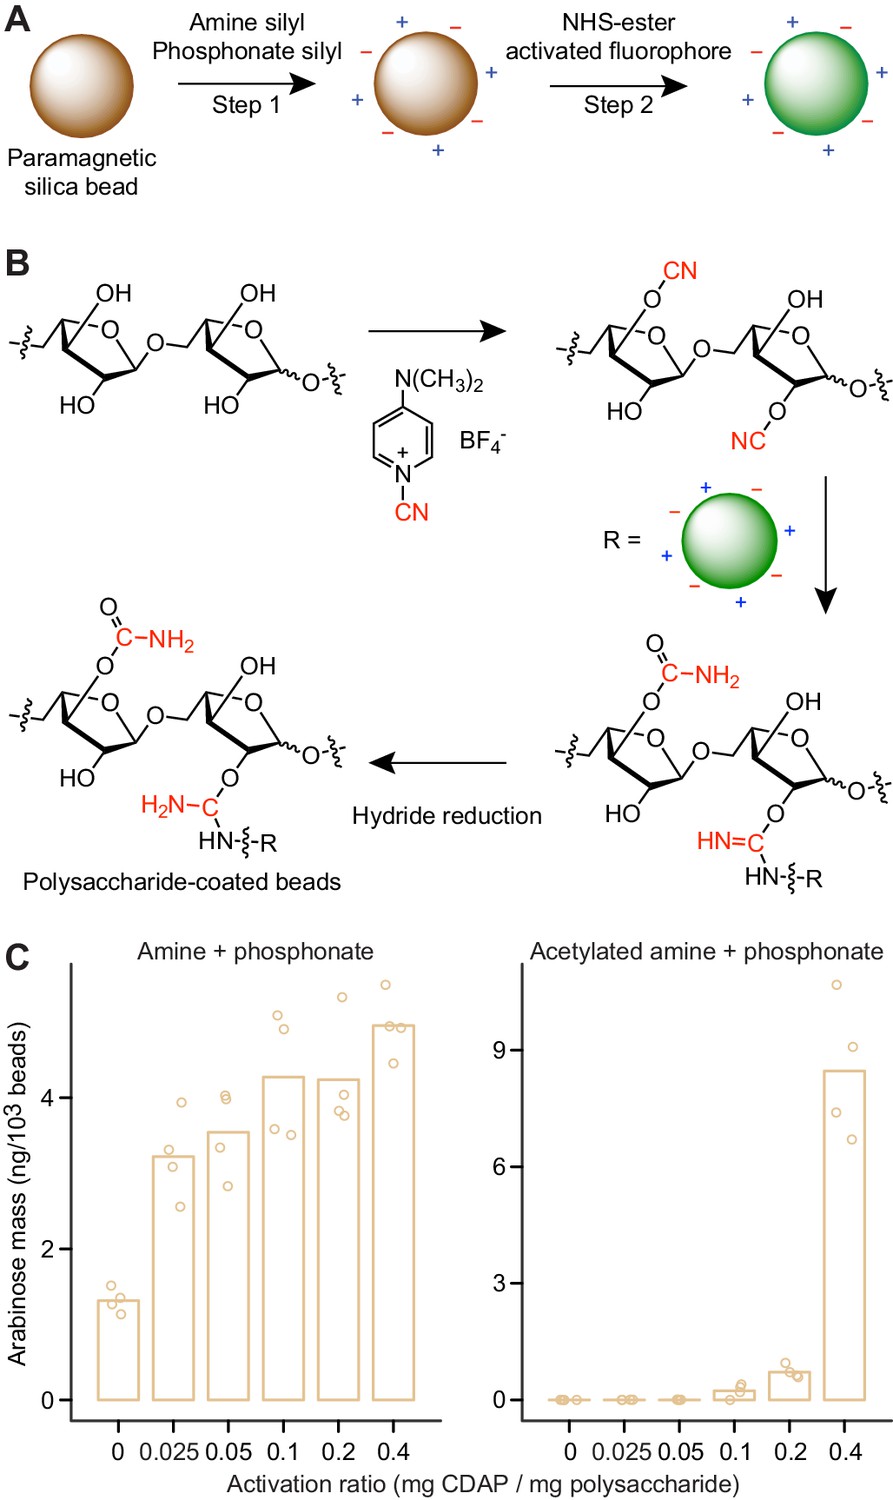
Generating microscopic paramagnetic glass beads with covalently attached fluorophores and glycans.
(A,B) Steps used for producing MFABs. The transferred cyano-group from 1-cyano-4-dimethylaminopyridinium tetrafluoroborate (CDAP), and its modification during ligand immobilization are highlighted in red (panel b). Arabinose oligosaccharide is shown as a representative ligand for immobilization. Amine and phosphonate functional groups are denoted by ‘+’ and ‘–’ symbols, respectively. See Figure 3—figure supplement 2 for a more complete depiction of the chemical linkages represented on the surface of an MFAB with bound arabinan. (C) Arabinose released during acid hydrolysis from amine plus phosphonate beads with and without surface amine groups acetylated. Beads were coated with SBABN that had been activated using increasing mass ratios of CDAP. Each point represents a single technical measurement (n = 4). Bar height represents the mean value.
Figure 3—figure supplement 1
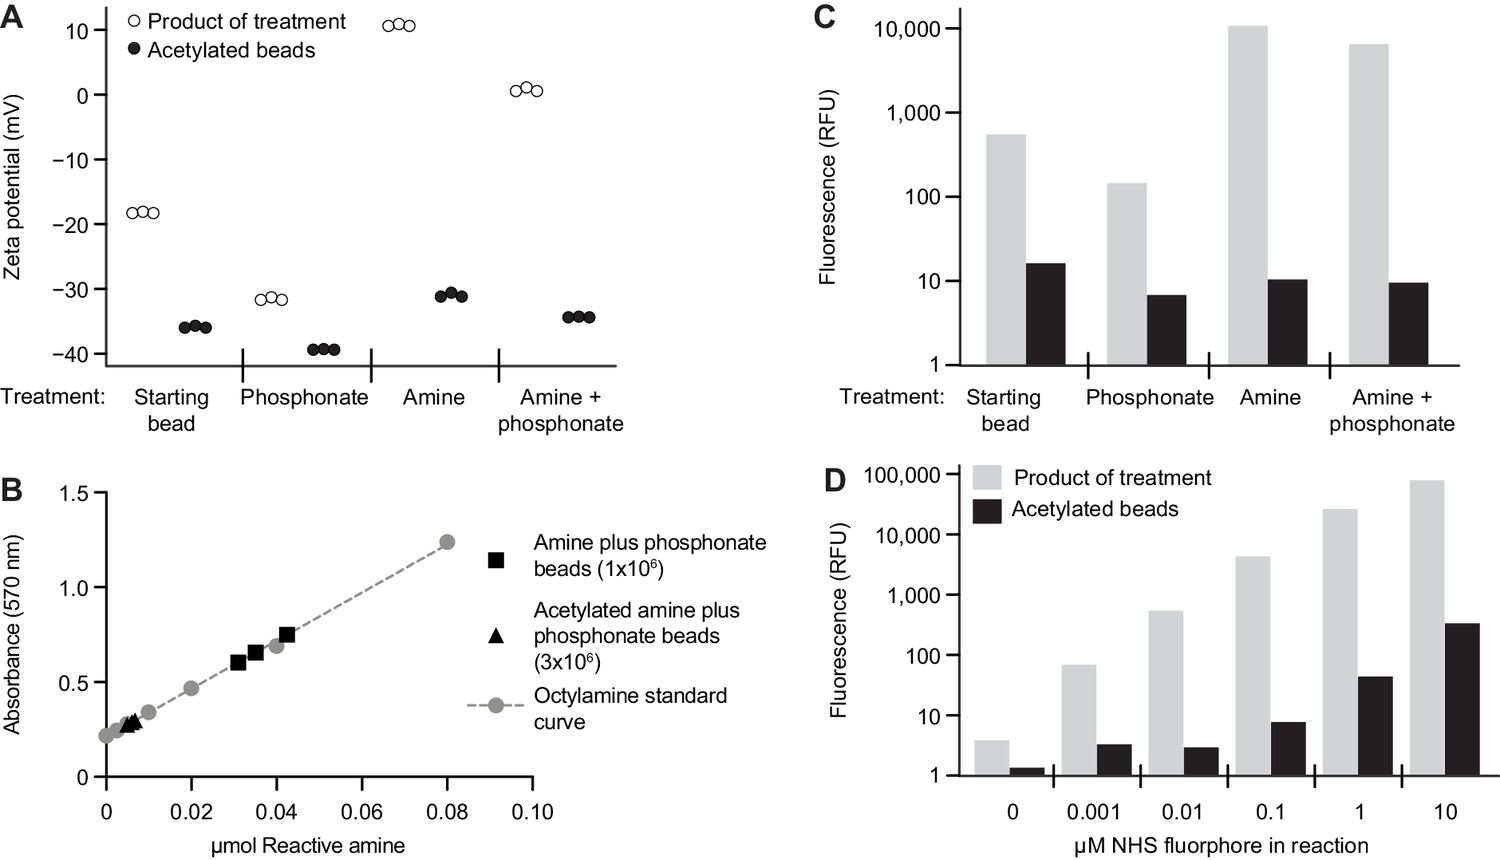
Characterizing the modified surface chemistry of paramagnetic glass beads.
(A) Alteration in bead surface zeta potential after modification with organosilanes, with and without amine acetylation. Each point represents the average of at least 12 technical replicate measurements. (B) Quantification of reactive surface amine functional groups on amine plus phosphonate beads with and without surface amine acetylation. Octylamine was used to generate a standard curve. Each bead type was analyzed in triplicate. Each point represents a single technical measurement. (C) Fluorophore immobilization on the surface of beads after modification with organosilanes, with and without amine acetylation. The height of each bar represents the geometric mean of values obtained from greater than 1000 beads. The concentration of NHS ester-activated fluorophore was 0.1 μM. Results are representative of three independent experiments. (D) Level of fluorophore immobilized on an amine plus phosphonate bead after reaction with increasing concentrations of NHS ester-activated fluorophore, with and without bead surface amine acetylation. The height of each bar represents the geometric mean of values obtained from greater than 1000 beads. Results are representative of those obtained in three independent experiments.
Figure 3—figure supplement 2
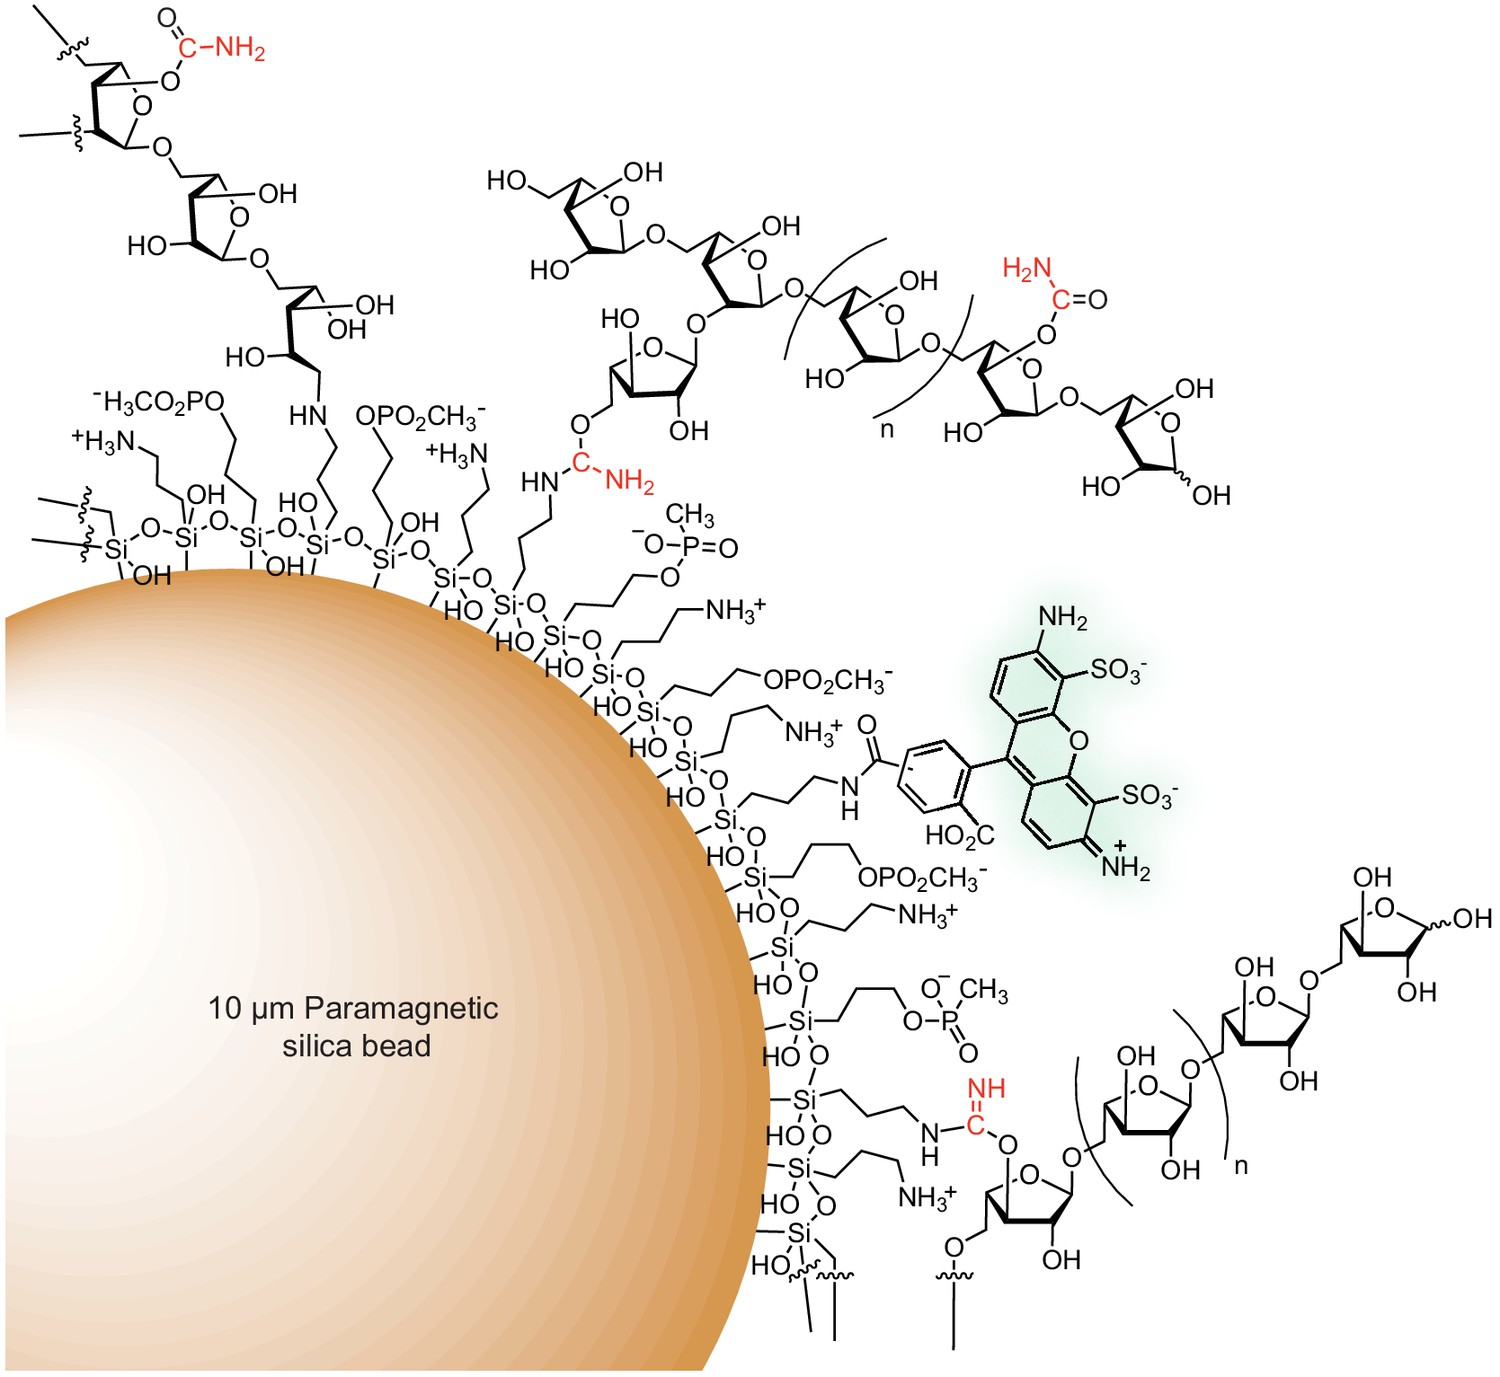
Schematic of a fluorescent arabinan-coated MFAB.
Amine and phosphonate functional groups are covalently attached to the surface of a paramagnetic silica bead via organosilane reagents. Polysaccharide is depicted attached to the bead surface via (1) reductive amination, (2) the product of isourea reduction (an aminal-like linkage), or (3) an isourea bond. An Alexa Fluor 488 (mixed isomer) fluorophore is attached to the bead surface via an amide bond. The product of cyanate-ester hydrolysis, a carbamate, is shown. The carbon and nitrogen atoms from the transferred cyano-group are shown in red.
Figure 3—figure supplement 3
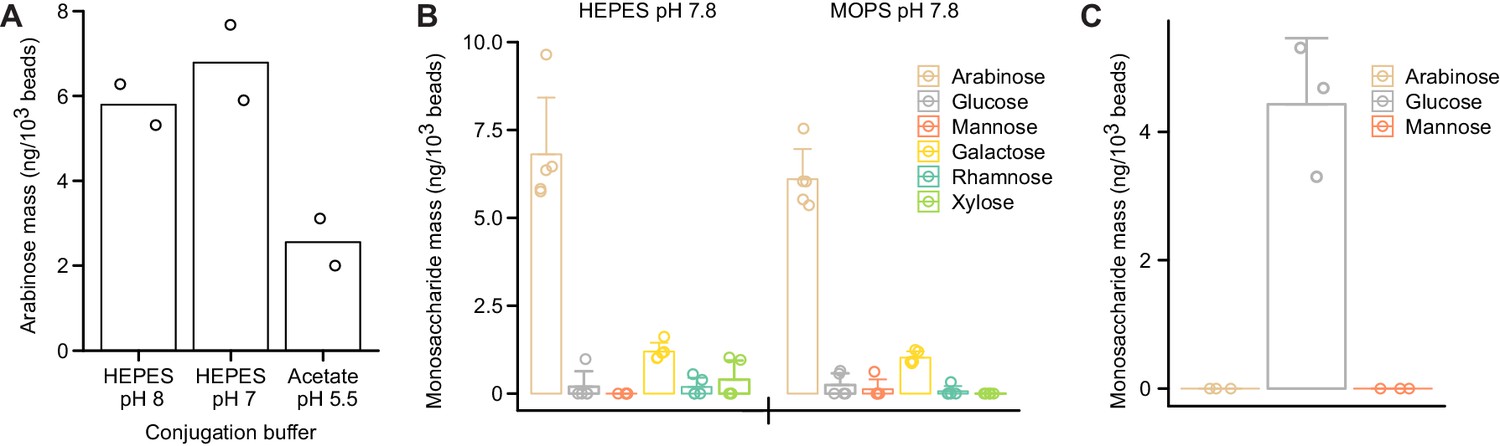
Conjugation reaction conditions influence immobilization of polysaccharides on the surfaces of the paramagnetic glass beads.
(A) SBABN subjected to CDAP-based bead immobilization across a range of pH values. Immobilized arabinose was quantified using GC–MS. (B) SBABN immobilization in the presence of a HEPES or MOPS-based buffer at an identical pH. Monosaccharides were quantified using GC–MS. (C) Maltodextrin oligosaccharide immobilization after CDAP activation. In (A–C), each data point represents a single technical measurement while bar heights depict the mean values and error bars the s.d.
Figure 4 with 3 supplements
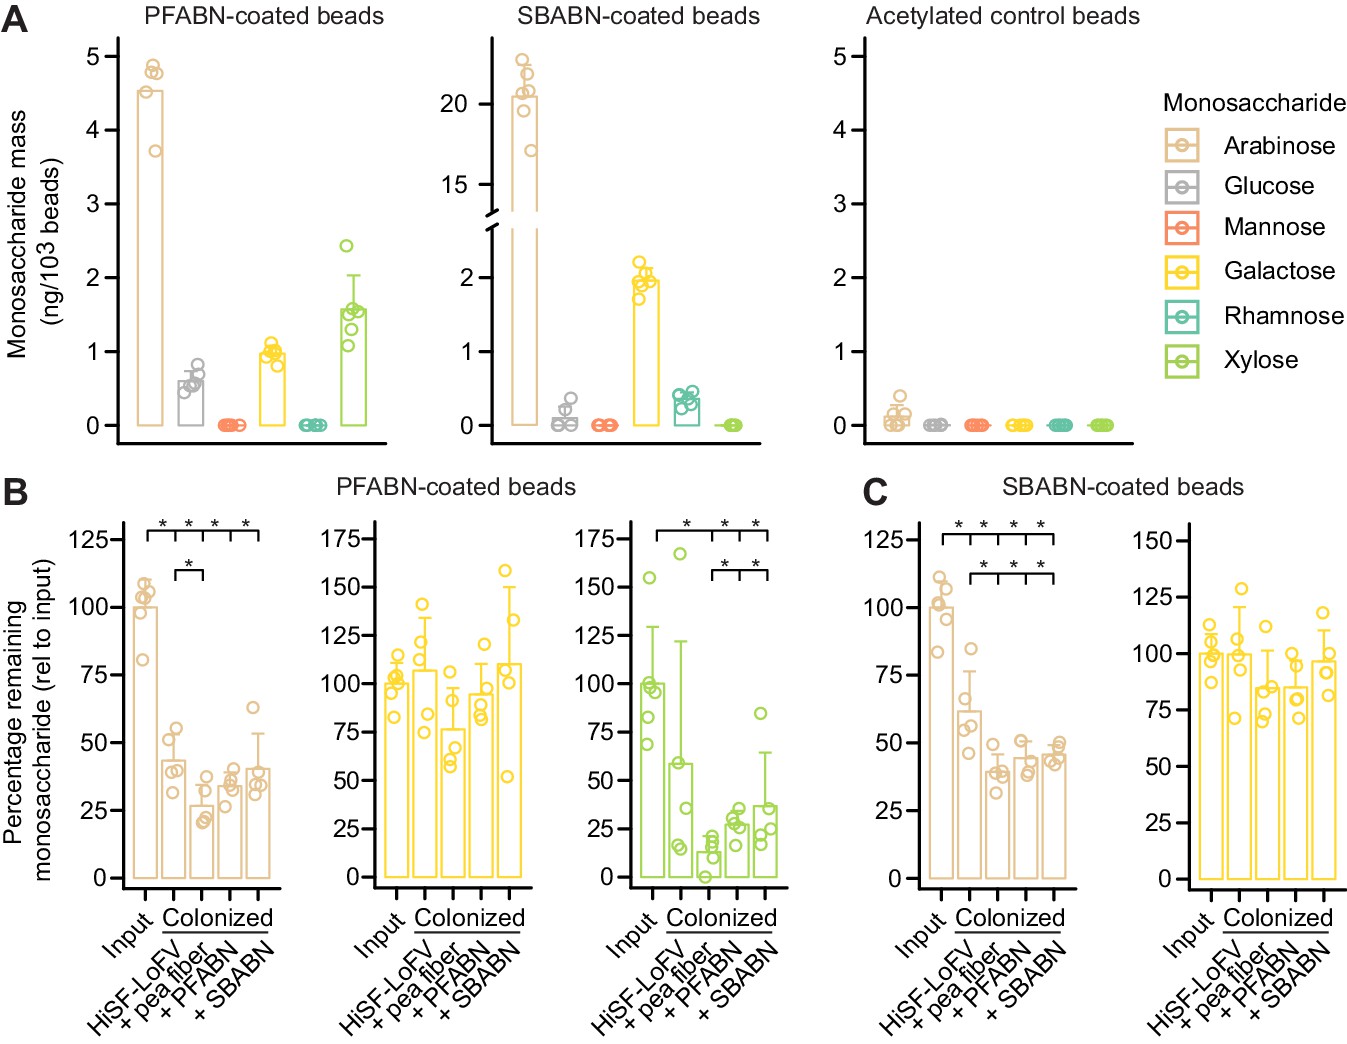
Quantifying microbial degradation of PFABN- and SBABN-coated beads in colonized gnotobiotic mice fed unsupplemented or supplemented HiSF-LoFV diets.
(A) Monosaccharide composition of beads containing covalently bound PFABN or SBABN. Control beads were subjected to surface amine acetylation. The amount of monosaccharide released after acid hydrolysis was quantified by GC-MS. Each point represents a single measurement. Bar height denotes the mean while error bars represent the s.d. (n = 6 biological replicates). (B,C) Percentage of arabinose, galactose and xylose remaining on the surface of beads recovered from the cecums of mice fed the indicated diets (n = 5 mice/treatment group). Each point represents a single animal. Bar height denotes the mean while error bars represent the s.d. p<0.05 (Mann–Whitney U test compared to the group furthest to the left). (See also Supplementary file 5).
Figure 4—figure supplement 1
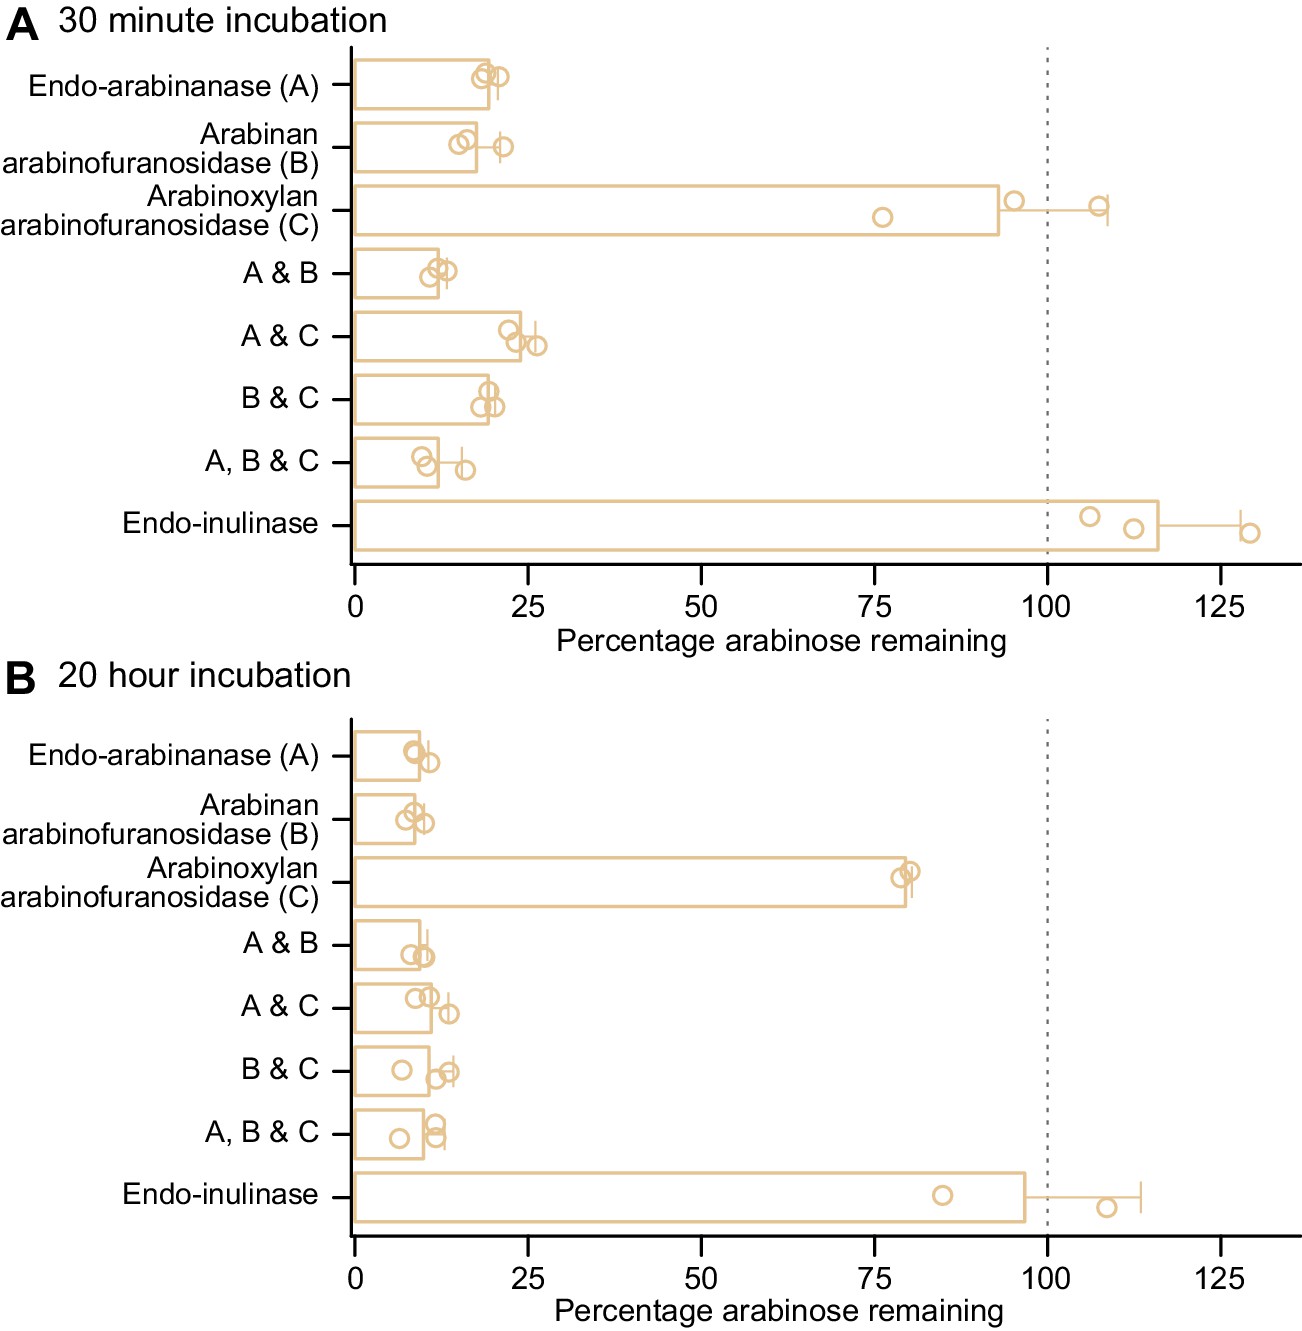
Enzyme degradation of PFABN immobilized on an MFAB surface using CDAP chemistry.
(A,B) Soluble glycosyl hydrolases (named and abbreviated as A, B, and C) were added to PFABN-coated MFABs and the fraction of arabinan remaining on the bead surface after 30 min and 20 hr was quantified (by GC–MS). Data are expressed relative to the input preparation of beads that were not exposed to the indicated enzyme alone or to a combination of two or three of the enzymes. Each point represents a single technical measurement (n = 2or three for beads exposed to a single or multiple enzymes). Mean values ± s.d. are plotted. (Note that the modest difference in the amount of bound arabinan remaining on PFABN beads after a 30 min versus a 20 hr incubation with just the commercially available arabinoxylan arabinofuranosidase preparation [enzyme C] is consistent with the fact that it has modest activity against other arabinan polysaccharides.)
Figure 4—figure supplement 2
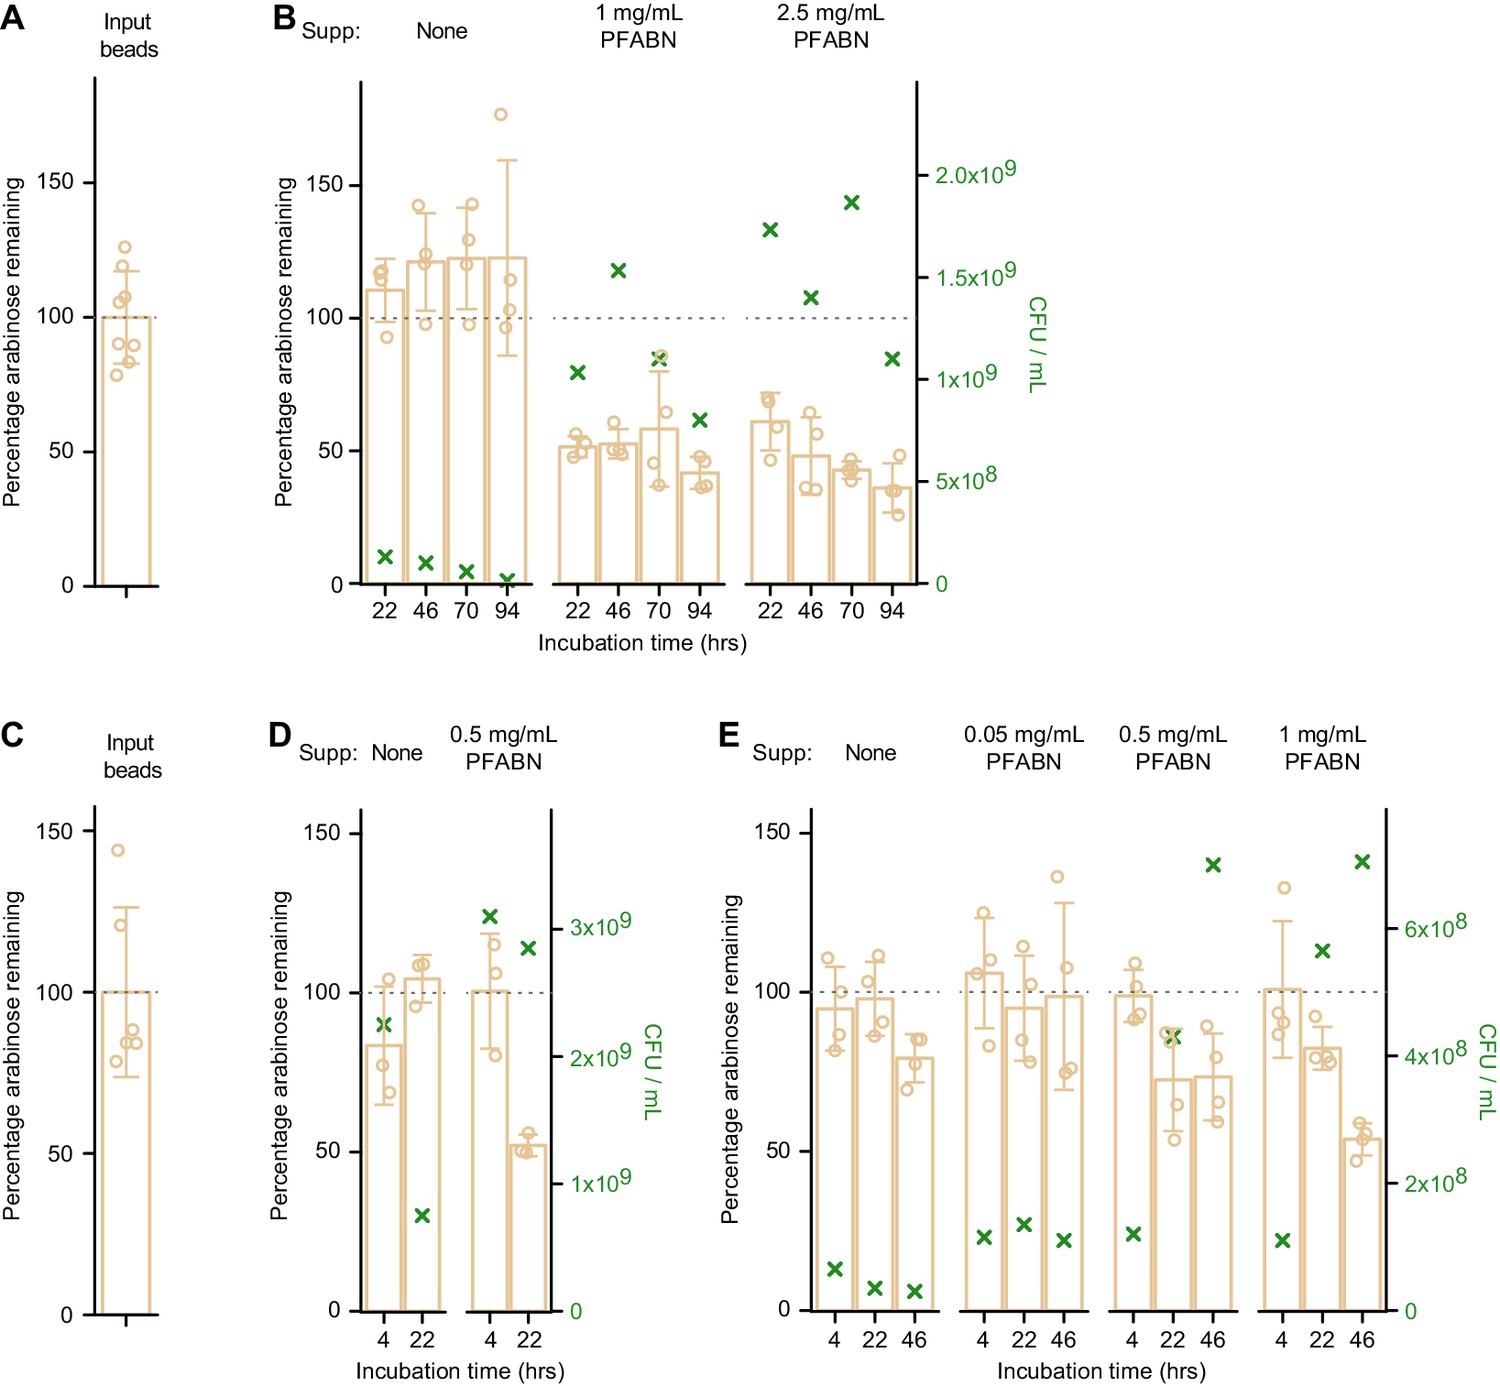
Degradation of MFAB-bound PFABN by B. thetaiotaomicron VPI-5482 and B. cellulosilyticus WH2 in vitro.
(A,B) Input beads (A) were incubated with B. thetaiotaomicron VPI-5482 that had been grown in BMM medium to mid-log phase with glucose as the carbon source. Cells were harvested and resuspended in BMM with or without different concentrations of supplemented destarched PFABN. PFABN-MFABs were added and the mixture was incubated at 37°C: aliquots of the reaction mixture were withdrawn at the time points shown (B). (C–E) Input beads (C) were incubated with B. cellulosilyticus WH2 that had been grown to mid-log phase in BMM containing glucose (D) or PFABN (E) as the carbon sources. Cells were harvested and resuspended in BMM with or without different concentrations of destarched PFABN. MFABs were harvested at the indicated time points and the percentage of arabinose remaining on the bead was calculated from the mean absolute mass of arabinose on the input preparation of MFABs used in that experiment. Each point in (A) – (E) represents a single technical measurement (n = 6 or eight for input beads; 3 or 4 for beads exposed to the Bacteroides strains). Mean values ± s.d. are plotted. The green ‘X’ denotes the mean number (triplicate technical measurements) of colony forming units (CFU) in the incubation mixture at time of bead harvest (see right y-axis).
Figure 4—figure supplement 3
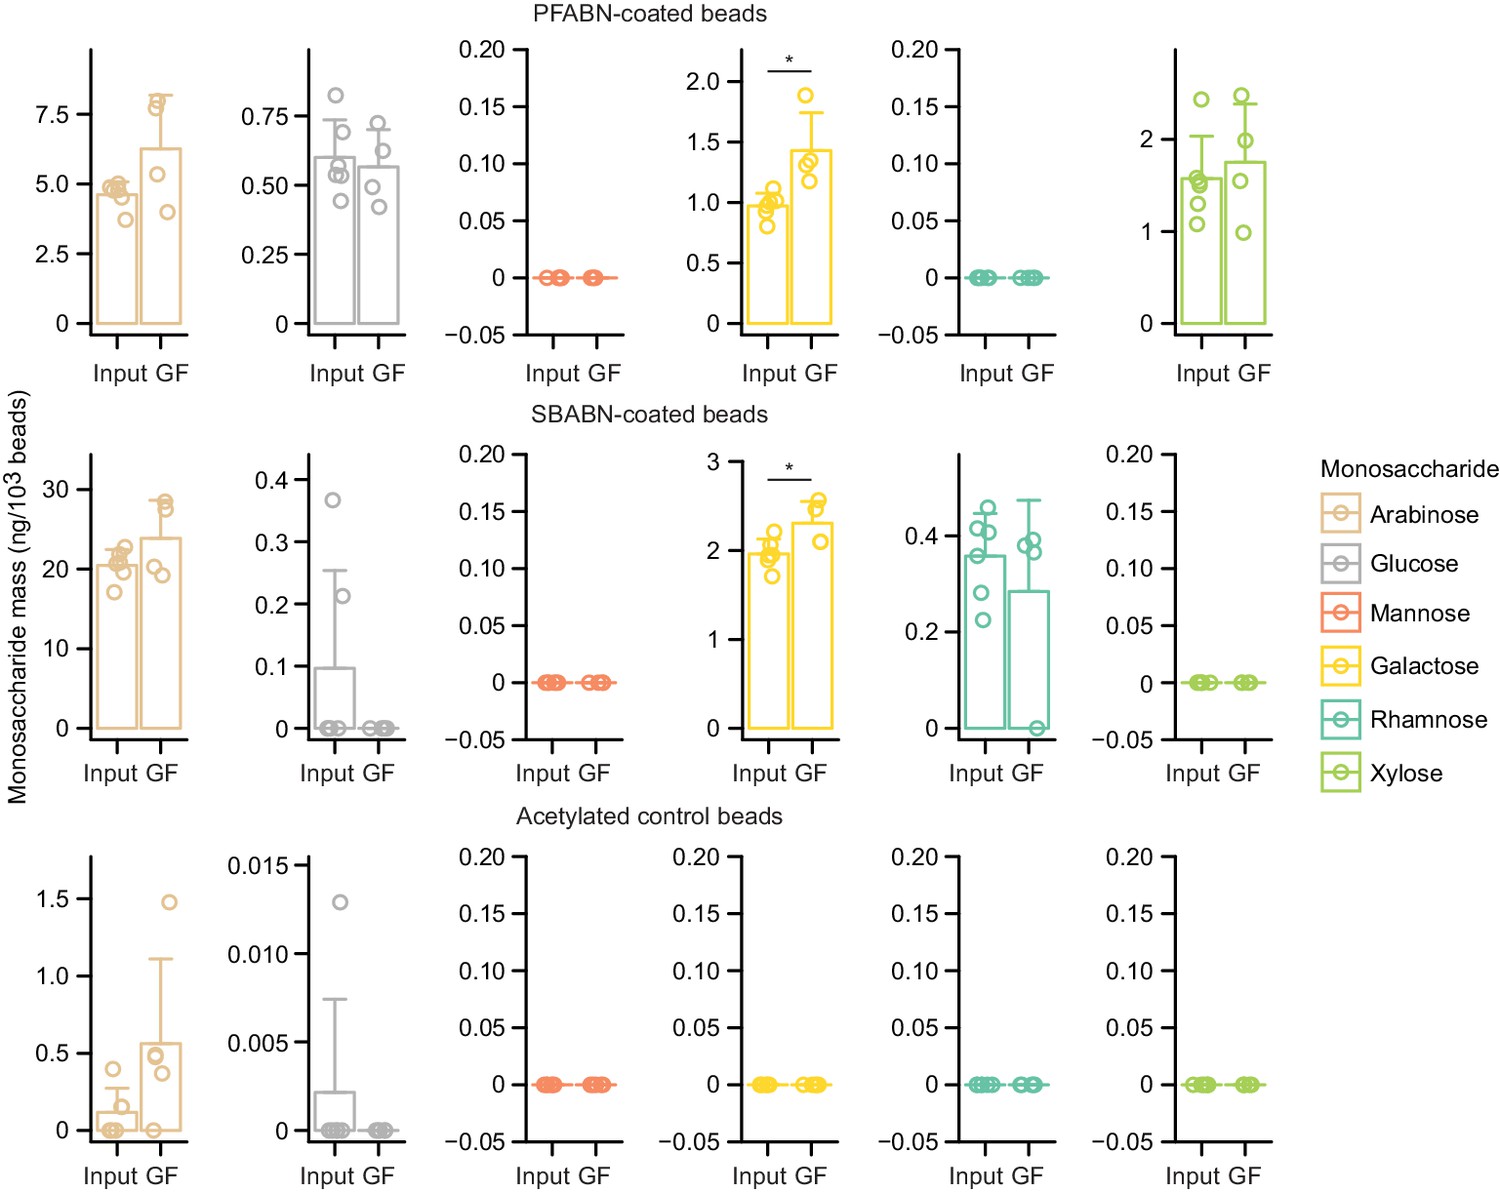
Assaying whether bead-linked polysaccharides are degraded in germ-free mice.
Absolute mass of monosaccharide released from three bead types prior to or after gavage, collection, and purification from germ-free (GF) mice fed the HiSF-LoFV diet supplemented with PFABN. Beads were collected from the cecum 4 hr after gavage. Each point represents a single biological replicate (n = 6 for input beads, four for germ-free animals). Bar height represents the mean while error bars denote the s.d. *p<0.05, Mann–Whitney U test.
Figure 5

Colocalization of PFABN and glucomannan on the same bead results in augmented degradation of glucomannan in gnotobiotic mice colonized with the defined consortium and fed the pea fiber supplemented HiSF-LoFV diet.
(A) In vitro growth of supplement-responsive Bacteroides species in minimal medium containing glucose or glucomannan as the sole carbon source. Data from samples where no exogenous carbon source was added are subtracted from all curves. The line represents the mean and shaded regions the s.e.m. of quadruplicate measurements. (B) Monosaccharide compositions of beads with covalently bound PFABN, glucomannan, or both PFABN and glucomannan. Control beads were subjected to surface amine acetylation. The amount of monosaccharide released after acid hydrolysis was quantified by GC-MS. Each point represents a single measurement. Bar height represents the mean and error bars the s.d. (n = 6 biological replicates). (C) Beads containing PFABN alone, glucomannan alone, or both glycans, as well as ‘empty’ acetylated control beads, each containing a unique fluorophore, were simultaneously introduced by oral gavage into gnotobiotic mice, recovered 4 hr later from their cecums. Each bead-type is subsequently purified by FACS. A representative flow cytometry plot of beads isolated from the cecum is shown. (D) Monosaccharide remaining on beads coated with PFABN alone, glucomannan alone, or both glycans after collection and purification from the cecums of mice fed the unsupplemented or pea fiber-supplemented HiSF-LoFV diet. Colors are identical to those used in panel b. The amount of remaining monosaccharide is expressed relative to the absolute mass of monosaccharide immobilized on the surface of each type of input bead. Each point represents a single animal. Bar height represents the mean and error bars the s.d. (n = 5–8 biological replicates). *p<0.05 (Mann–Whitney U test). (See also Supplementary file 5).
Tables
Appendix 1—key resources table
| Reagent type (species) or resource | Designation | Source or reference | Identifiers | Additional information |
|---|---|---|---|---|
| Strain, strain background (Bacteroides cellulosilyticus) | INSeq library (B. cellulosilyticus WH2) | Wu et al., 2015 | ||
| Strain, strain background (Bacteroides ovatus) | INSeq library (B. ovatus ATCC 8483) | Wu et al., 2015 | ||
| Strain, strain background (Bacteroides thetaiotaomicron) | INSeq library (B. thetaiotaomicron 7330) | Wu et al., 2015 | ||
| Strain, strain background (Bacteroides thetaiotaomicron) | INSeq library (B. thetaiotaomicron VPI-5482) | Wu et al., 2015 | ||
| Strain, strain background (Bacteroides vulgatus) | INSeq library (B. vulgatus ATCC 8482) | Hibberd et al., 2017 | ||
| Strain, strain background (Bacteroides cellulosilyticus) | B. cellulosilyticus WH2 | McNulty et al., 2013 | ||
| Strain, strain background (Bacteroides ovatus) | B. ovatus ATCC 8483 | ATCC | Cat. No. ATCC 8483 | |
| Strain, strain background (Bacteroides thetaiotaomicron) | B. thetaiotaomicron 7330 | Hibberd et al., 2017 | ||
| Strain, strain background (Bacteroides thetaiotaomicron) | B. thetaiotaomicron VPI-5482 | ATCC | Cat. No. ATCC 29148 | |
| Strain, strain background (Bacteroides vulgatus) | B. vulgatus ATCC 8482 | ATCC | Cat. No. ATCC 8482 | |
| Strain, strain background (Bacteroides caccae) | B. caccae TSDC17.2–1.2 | Ridaura et al., 2013 | Donor fecal sample F60T2 | |
| Strain, strain background (Bacteroides finegoldii) | B. finegoldii TSDC17.2–1.1 | Ridaura et al., 2013 | Donor fecal sample F60T2 | |
| Strain, strain background (Bacteroides massiliensis) | B. massiliensis TSDC17.2–1.1 | Ridaura et al., 2013 | Donor fecal sample F60T2 | |
| Strain, strain background (Collinsella aerofaciens) | C. aerofaciens TSDC17.2–1.1 | Ridaura et al., 2013 | Donor fecal sample F60T2 | |
| Strain, strain background (Escherichia coli) | E. coli TSDC17.2–1.2 | Ridaura et al., 2013 | Donor fecal sample F60T2 | |
| Strain, strain background (Odoribacter splanchnicus) | O. splanchnicus TSDC17.2–1.2 | Ridaura et al., 2013 | Donor fecal sample F60T2 | |
| Strain, strain background (Parabacteroides distasonis) | P. distasonis TSDC17.2–1.1 | Ridaura et al., 2013 | Donor fecal sample F60T2 | |
| Strain, strain background (Ruminococcaceae sp.) | Ruminococcaceae sp. TSDC17.2–1.2 | Ridaura et al., 2013 | Donor fecal sample F60T2 | |
| Strain, strain background (Subdoligranulum variabile) | S. variabile TSDC17.2–1.1 | Ridaura et al., 2013 | Donor fecal sample F60T2 | |
| Strain, strain background (Alicyclobacillus acidiphilus) | A. acidiphilus DSM 14558 | DSMZ; Stämmler et al., 2016 | Cat. No. 14558 | |
| Strain, strain background (Agrobacterium radiobacter) | A. radiobacter DSM 30147 | DSMZ; Stämmler et al., 2016 | Cat. No. 30147 | |
| Strain, strain background (Mus musculus, male) | C57BL/6J mice; rederived germ-free | The Jackson Laboratory | Cat. No. 00064 | |
| Sequence-based reagent | M12 oligonucleotide, double stranded | Wu et al., 2015 | CTGTCCGTTCCGACTACCCTCCCGAC | |
| Sequence-based reagent | INSeq PCR primer; F | Wu et al., 2015 | CAAGCAGAAGACGGCATACG | |
| Sequence-based reagent | INSeq PCR primer; R | Wu et al., 2015 | AATGATACGGCGACCACCGAACACTCTTTCCCTACACGA | |
| Sequence-based reagent | INSeq Indexing primer | Wu et al., 2015 | ACAGGTTGGATGATAAGTCCCCGGTC | |
| Peptide, recombinant protein | Amyloglucosidase | Megazyme | Cat. No. E-AMGFR | |
| Peptide, recombinant protein | alpha-Amylase | Megazyme | Cat. No. E-PANAA | |
| Peptide, recombinant protein | Endo-1,5-α-Arabinanase | Megazyme | Cat. No. E-EARAB | |
| Peptide, recombinant protein | α-l-Arabinofuranosidase (Aspergillus niger) | Megazyme | Cat. No. E-AFASE | |
| Peptide, recombinant protein | α-l-Arabinofuranosidase (Cellvibrio japonicus) | Megazyme | Cat. No. E-ABFCJ | |
| Peptide, recombinant protein | Endo-Inulinase | Megazyme | Cat. No. E-ENDOIAN | |
| Peptide, recombinant protein | MmeI restriction endonuclease | NEB | Cat. No. R0637L | |
| Peptide, recombinant protein | T4 DNA ligase | NEB | Cat. No. M0202M | |
| Peptide, recombinant protein | Superfi DNA polymerase | Fisher Scientific | Cat. No. 12351050 | |
| Commercial assay or kit | Bicinchoninic acid protein assay kit | Thermo Scientific | Cat. No. 23225 | |
| Commercial assay or kit | Nextera DNA library prep kit | Illumina | Cat. No. 15028211 | |
| Commercial assay or kit | QIAquick 96 PCR purification kit | Qiagen | Cat. No. 28181 | |
| Commercial assay or kit | MinElute gel extraction kit | Qiagen | Cat. No. 28604 | |
| Commercial assay or kit | Quant-iT dsDNA assay kit, high sensitivity | Thermo Scientific | Cat. No. Q33120 | |
| Commercial assay or kit | CountBright absolute counting beads | Thermo Scientific | Cat. No. C36950 | |
| Commercial assay or kit | Ninhydrin test kit | Anaspec | Cat. No. AS-25241 | |
| Commercial assay or kit | Biotin quantitation kit | Thermo Scientific | Cat. No. 28005 | |
| Software, algorithm | R, version 3.5.2 | https://www.r-project.org/ | ||
| Software, algorithm | metaMS | Wehrens et al., 2014 | ||
| Software, algorithm | COPRO-Seq pipeline | Hibberd et al., 2017 | https://gitlab.com/hibberdm/COPRO-Seq | |
| Software, algorithm | INSeq pipeline | Wu et al., 2015 | https://github.com/mengwu1002/Multi-taxon_analysis_pipeline | |
| Software, algorithm | lme4 | Bates et al., 2015 | https://github.com/lme4/lme4/ | |
| Software, algorithm | emmeans | https://github.com/rvlenth/emmeans | ||
| Software, algorithm | GAGE | Luo et al., 2009 | ||
| Software, algorithm | limma | Ritchie et al., 2015 | http://bioconductor.org/packages/release/bioc/html/limma.html | |
| Software, algorithm | FlowJo V10.5.3 | https://www.flowjo.com/ | ||
| Other | Teklad Global 18% Protein Rodent diet | Envigo | Cat. No. 2018S | |
| Other | High saturated fats low fruits and vegetables mouse chow (HiSF-LoFV) | Ridaura et al., 2013 | ||
| Other | Pea fiber | Rattenmaier | Cat. No. Pea Fiber EF 100 | |
| Other | Sugar beet arabinan | Megazyme | Cat. No. P-ARAB | |
| Other | Glucomannan | Megazyme | Cat. No. P-GLCML | |
| Other | Maltodextrin (DE 13–17) | Sigma–Aldrich | Cat No. 419680 | |
| Other | Gut microbiota medium, for bacterial culture | Goodman et al., 2011 | ||
| Other | Bacteroides minimal medium, for bacterial culture | McNulty et al., 2013 | ||
| Other | Pullulan length standards | Shodex | Cat. No. Standard P-82 | |
| Other | [1,2,3,4,5,6-2H]-Myo-inositol | CDN Isotopes | Cat. No. D3019 | |
| Other | MSTFA (N-methyl-N-trimethylsilyltrifluoro)acetamide plus 1% TCMS (2,2,2-trifluoro-N-methyl-N-(trimethylsilyl)-acetamide, chlorotrimethylsilane) | Thermo Scientific | Cat. No. TS-48915 | |
| Other | PureProteome NHS flexibind magnetic beads | Millipore Sigma | Cat. No. LSKMAGN01 | |
| Other | (3-Aminopropyl)triethoxysilane | Sigma–Aldrich | Cat. No. 440140 | |
| Other | 3-(Trihydroxysilyl)propylmethylphosphonate | Sigma–Aldrich | Cat. No. 435716 | |
| Other | Alexa Fluor 488 NHS ester | Thermo Scientific | Cat. No. A20000 | |
| Other | Promofluor 415 NHS ester | PromoKine | Cat. No. PK-PF415-1-01 | |
| Other | Promofluor 633P NHS ester | PromoKine | Cat. No. PK-PF633P-1–01 | |
| Other | Promofluor 510-LSS NHS ester | PromoKine | Cat. No. PK-PF510LSS-1–01 | |
| Other | 1-Cyano-4-dimethylaminopyridinium tetrafluoroborate | Sigma–Aldrich | Cat. No. RES1458C | |
| Other | 2-Picoline borane | Sigma–Aldrich | Cat. No. 654213 | |
| Other | PureProteome streptavidin magnetic beads | Millipore Sigma | Cat. No. LSKMAGT02 | |
| Other | Percoll Plus | GE Healthcare | Cat. No. 17544502 |
Additional files
-
Supplementary file 1
Characterization of fractions isolated from pea fiber.
(A) Initial procedure that yielded eight fractions during sequential extraction. (B) Glycosyl-linkage analysis of PFABN and SBABN. (C) Summary data of Bacteroides growth in defined minimal medium supplemented with glucose, PFABN, and SBABN.
- https://cdn.elifesciences.org/articles/64478/elife-64478-supp1-v1.xlsx
-
Supplementary file 2
Effects of pea fiber, PFABN, and SBABN supplementation of the HiSF-LoFV diet on the absolute abundances of members of the defined community in gnotobiotic mice.
- https://cdn.elifesciences.org/articles/64478/elife-64478-supp2-v1.xlsx
-
Supplementary file 3
Metaproteomic analysis of the effects of pea fiber, PFABN, and SBABN supplementation of the HiSF-LoFV diet on gene expression in members of the defined community.
Cyclic loess normalized protein abundance Z-scores of (A) Bacteroides caccae TSDC17.2–1.2, (B) Bacteroides cellulosilyticus WH2, (C) Bacteroides finegoldii TSDC17.2–1.1, (D) Bacteroides massiliensis TSDC17.2–1.1, (E) Bacteroides ovatus ATCC8483, (F) Bacteroides thetaiotaomicron VPI-5482, (G) Bacteroides vulgatus ATCC8482, (H) Collinsella aerofaciens TSDC17.2–1.1, (I) Escherichia coli TSDC17.2–1.2, (J) Odoribacter splanchnicus TSDC17.2–1.2, (K) Parabacteroides distasonis TSDC17.2–1.1, (L) Ruminococcaceae sp TSDC17.2–1.2, (M) Subdoligranulum variabile TSDC17.2–1.1.
- https://cdn.elifesciences.org/articles/64478/elife-64478-supp3-v1.xlsx
-
Supplementary file 4
INSeq analysis of fitness determinants in diet-responsive Bacteroides represented in the defined community as a function of pea fiber, PFABN and SBABN supplementation of the HiSF-LoFV diet.
Summary statistics from linear models of gene fitness during (A) pea fiber, (B) PFABN, and (C) SBABN supplementation in (1) Bacteroides cellulosilyticus WH2, (2) Bacteroides ovatus ATCC8483, (3) Bacteroides thetaiotaomicron VPI-5482, and (4) Bacteroides vulgatus ATCC8482.
- https://cdn.elifesciences.org/articles/64478/elife-64478-supp4-v1.xlsx
-
Supplementary file 5
GC–MS analysis of the mass of monosaccharides bound to the surface of MFABs prior to and after their introduction into gnotobiotic mice (related to Figures 4 and 5).
- https://cdn.elifesciences.org/articles/64478/elife-64478-supp5-v1.xlsx
-
Transparent reporting form
- https://cdn.elifesciences.org/articles/64478/elife-64478-transrepform-v1.docx
Download links
A two-part list of links to download the article, or parts of the article, in various formats.
Downloads (link to download the article as PDF)
Open citations (links to open the citations from this article in various online reference manager services)
Cite this article (links to download the citations from this article in formats compatible with various reference manager tools)
Microbiota functional activity biosensors for characterizing nutrient metabolism in vivo
eLife 10:e64478.
https://doi.org/10.7554/eLife.64478


