Chondrocytes in the resting zone of the growth plate are maintained in a Wnt-inhibitory environment
- University of Michigan School of Dentistry, United States
- University of Texas Health Science Center at Houston School of Dentistry, United States
- Ishikawa Prefectural Nursing University, Japan
- Endocrine Unit, Massachusetts General Hospital and Harvard Medical School, United States
Figures
Figure 1 with 1 supplement
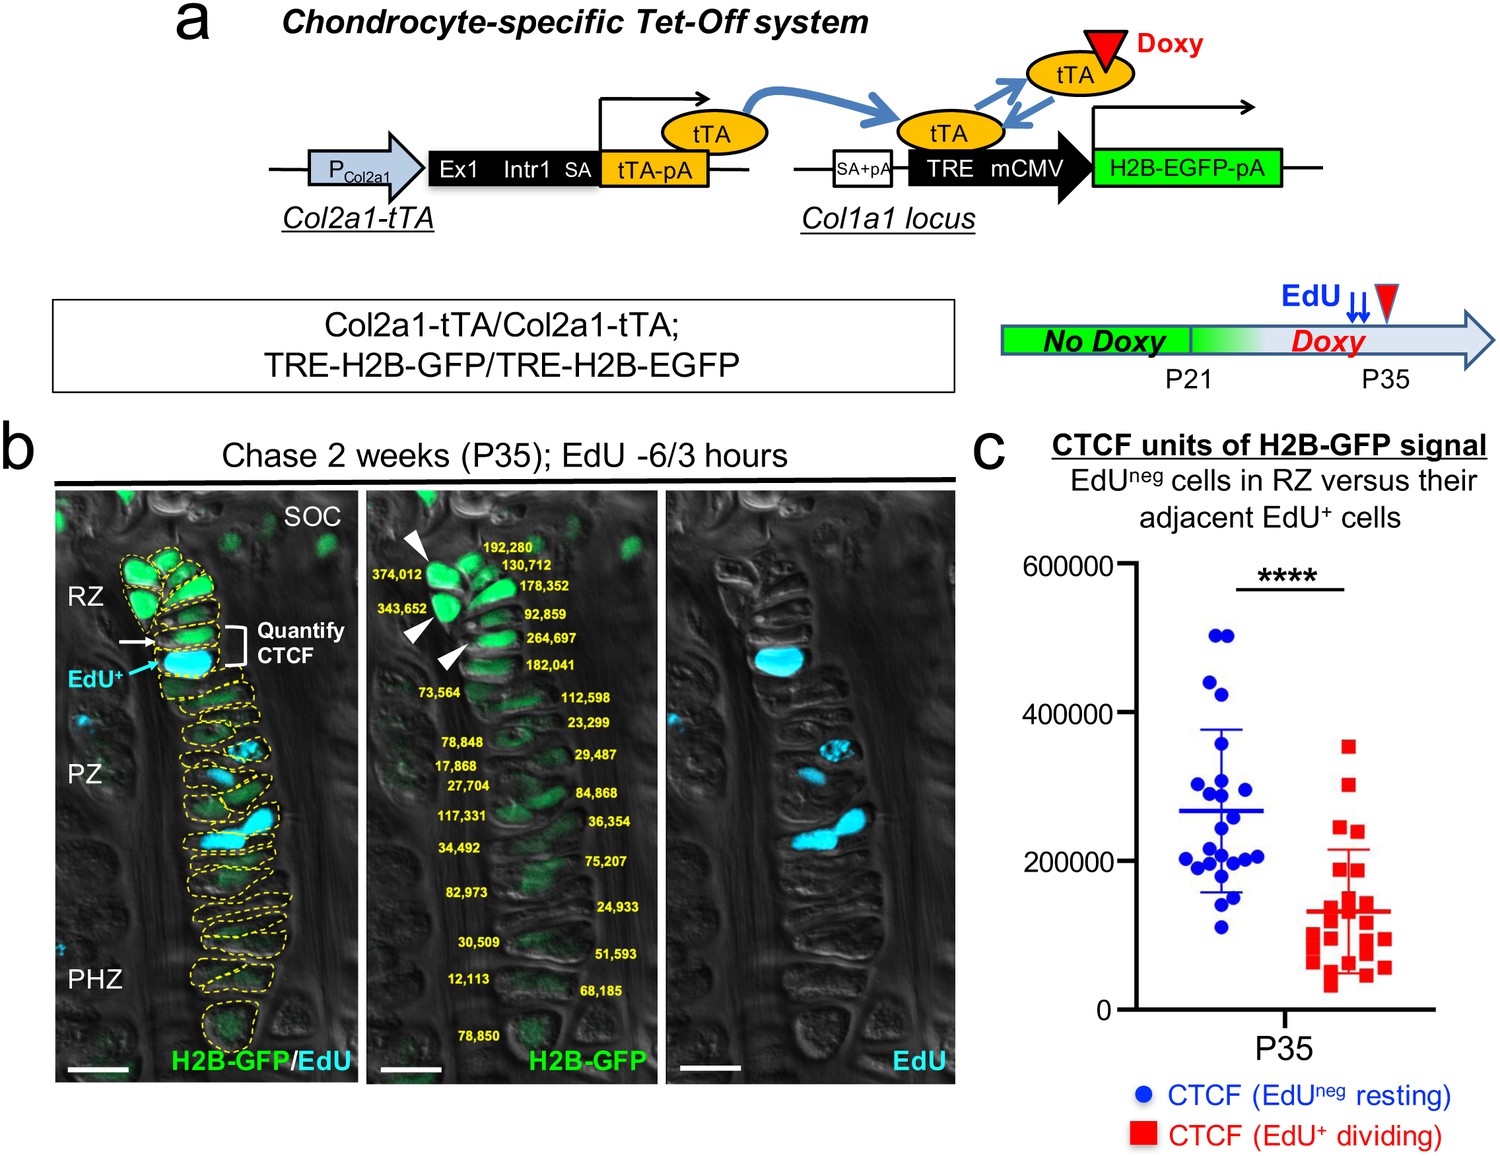
A genetic label-retention strategy to identify slow-cycling chondrocytes.
(a) Chondrocyte-specific Tet-Off system by Col2a1-tTA and TRE-H2B-EGFP transgenes. During development, Col2a1+ cells accumulate H2B-EGFP in the nucleus. Binding of tetracycline controlled transactivator (tTA) to Tet-responsive element (TRE) is prevented in the presence of doxycycline. As a result of this chase, slow-cycling cells retain a high level of H2B-EGFP, whereas proliferating cells dilute H2B-EGFP signal as they continue to divide. (b) Proximal tibial growth plates of Col2a1-tTA/Col2a1-tTA; TRE-H2B-EGFP/TRE-H2B-EGFP double homozygous mice after 2 weeks of chase at P35, with EdU administration shortly before analysis (6 and 3 hr prior to sacrifice). Shown is a representative 27 chondrocyte-long column highlighting gradient of H2B-GFP signal across different layers. (Left): Merged image of H2B-GFP, EdU-Alexa647, and DIC with tracing of individual chondrocytes. (Middle): Quantification of corrected total cell fluorescence (CTCF) values of H2B-GFP signal in chain. (Right): EdU-Alexa647 signal. SOC: secondary ossification center, RZ: resting zone, PZ: proliferating zone, PHZ: pre-hypertrophic zone. Arrows and a bracket: a pair of an H2B-GFPhigh cell in RZ (white) and its adjacent EdU+ cell (blue) in PZ. Arrowheads: the top three brightest cells in the column in RZ. Dotted lines: individual chondrocytes in column. Yellow: CTCF values. Green: H2B-GFP, blue: EdU, gray: DIC. Scale bars: 100 µm. (c) Quantification of CTCF values of H2B-GFP signal in a pair of a H2B-GFPhigh cell in RZ and its adjacent EdU+ dividing cell. Twenty-four cell pairs from n=four mice. ****p<0.0001. Mann-Whitney’s U-test. Data are represented as mean ± s.d.
-
Figure 1—source data 1
Quantification of corrected total cell fluorescence (CTCF) values of H2B-GFP signal in chain.
- https://cdn.elifesciences.org/articles/64513/elife-64513-fig1-data1-v1.xlsx
-
Figure 1—source data 2
Quantification of CTCF values of H2B-GFP signal in a pair of a H2B-GFPhighcell in RZ and its adjacent EdU+dividing cell.
- https://cdn.elifesciences.org/articles/64513/elife-64513-fig1-data2-v1.xlsx
Figure 1—figure supplement 1

A genetic label-retention strategy to identify slow-cycling chondrocytes.
(a) Chondrocyte-specific Tet-Off system by Col2a1-tTA and TRE-H2B-EGFP transgenes. During development, Col2a1+ cells accumulate H2B-EGFP in the nucleus. Binding of tetracycline-controlled transactivator (tTA) to Tet-responsive element (TRE) is prevented in the presence of doxycycline. As a result of this chase, slow-cycling cells retain a high level of H2B-EGFP, while proliferating cells dilute H2B-EGFP signal as they continue to divide. (b,c) Distal femur growth plates of Col2a1-tTA/+; TRE-H2B-EGFP/+ double heterozygous mice at P7 (b) and P21 (c). Note that only a small fraction of growth plates marked by GFP in (c). Scale bars: 500 µm. (d) Distal femur growth plates of Col2a1-tTA/Col2a1-tTA; TRE-H2B-EGFP/TRE-H2B-EGFP double homozygous mice at P21. Note that a greater number of growth plate cells are marked by GFP than in (c). Scale bars: 500 µm. (e) Distal femur growth plates of Col2a1-tTA/+; Col1a1-TRE-H2B-EGFP/+ mice, after 5 weeks of chase at P56. Arrowheads: GFPhigh label-retaining chondrocytes, arrows: GFP+ osteoblasts/cytes. Scale bars: 500 µm, 200 µm (inset). (f) Distal femur growth plates of +/+; Col1a1-TRE-H2B-EGFP/+ mice at P28. Arrows: GFP+ osteoblasts/cytes. Scale bars: 500 µm, 200 µm (inset).
Figure 2
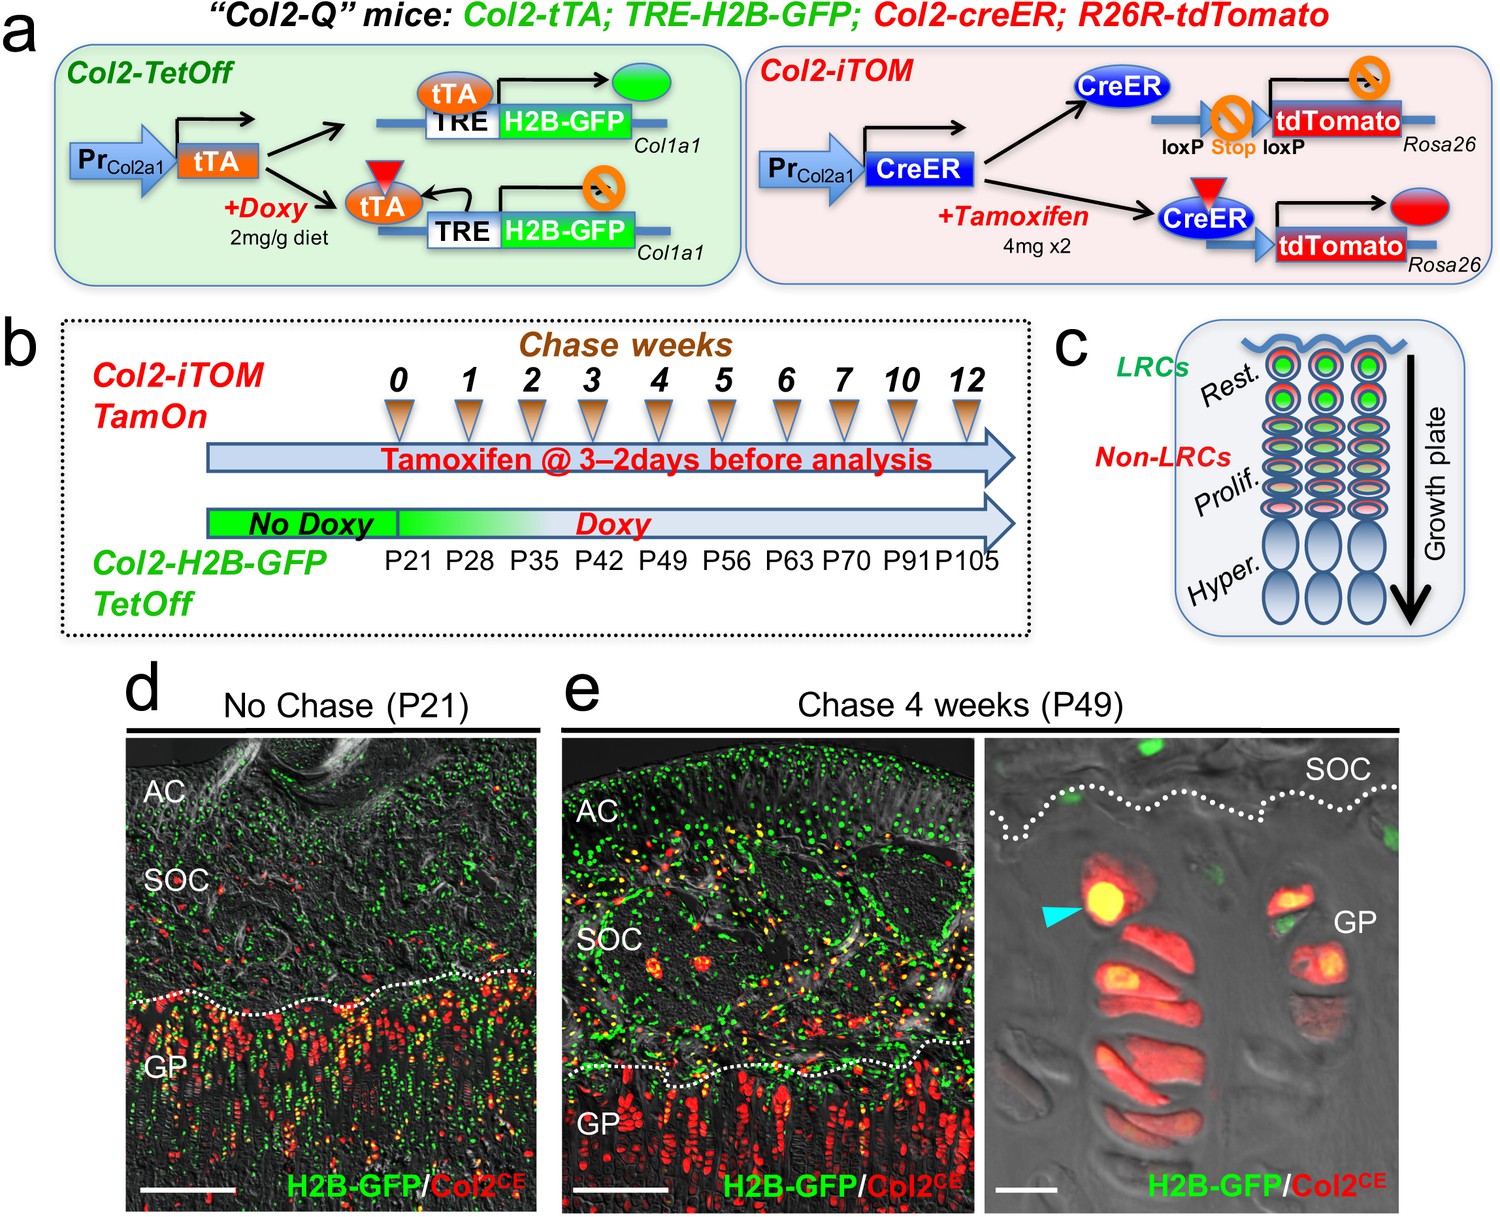
Col2-Q system: a double-color genetic label-retaining strategy to identify and isolate slow-cycling chondrocytes of the growth plate.
(a) ‘Col2-Q’ quadruple transgenic system composed of two chondrocyte-specific bigenic Col2-Tet-Off (Col2a1-tTA; TRE-H2B-EGFP) and Col2-iTOM (Col2a1-creER; R26R-tdTomato) systems. H2B-EGFP expression can be shut off by doxycycline diet (2 mg/g diet), while tdTomato expression can be induced by two doses of tamoxifen (4 mg) administered shortly prior to analysis (3 and 2 days before). (b) Experimental design to identify label-retaining chondrocytes (LRCs) in the growth plate. Col2-Q mice are fed with doxycycline (Doxy) starting from postnatal day (P) 21 (Chase). The mice are analyzed after the indicated number of weeks; at each time point, two doses of tamoxifen are administered shortly before analysis to induce tdTomato expression. (c) Diagram for predicted outcomes. LRCs are expected to retain green nuclei with red cytoplasm and located at the resting zone. Non-LRCs have increasingly dilute levels of H2B-GFP as they become proliferative and further differentiated. Rest.: resting zone, Prolif.: proliferating zone, Hyper.: hypertrophic zone. (d,e) Col2-Q distal femur growth plates with tamoxifen injection shortly before analysis. (d): No chase, without Doxy at P21. (e): After 4 weeks of chase, on Doxy for 4 weeks at P49, right panel: high-power confocal image. Arrowhead: label-retaining chondrocytes. AC: articular cartilage, SOC: secondary ossification center, GP: growth plate. Dotted line: border between growth plate and secondary ossification center. Blue: DAPI, gray: DIC. Scale bars: 500 µm, 20 µm (fluorescent scope in e).
Figure 3
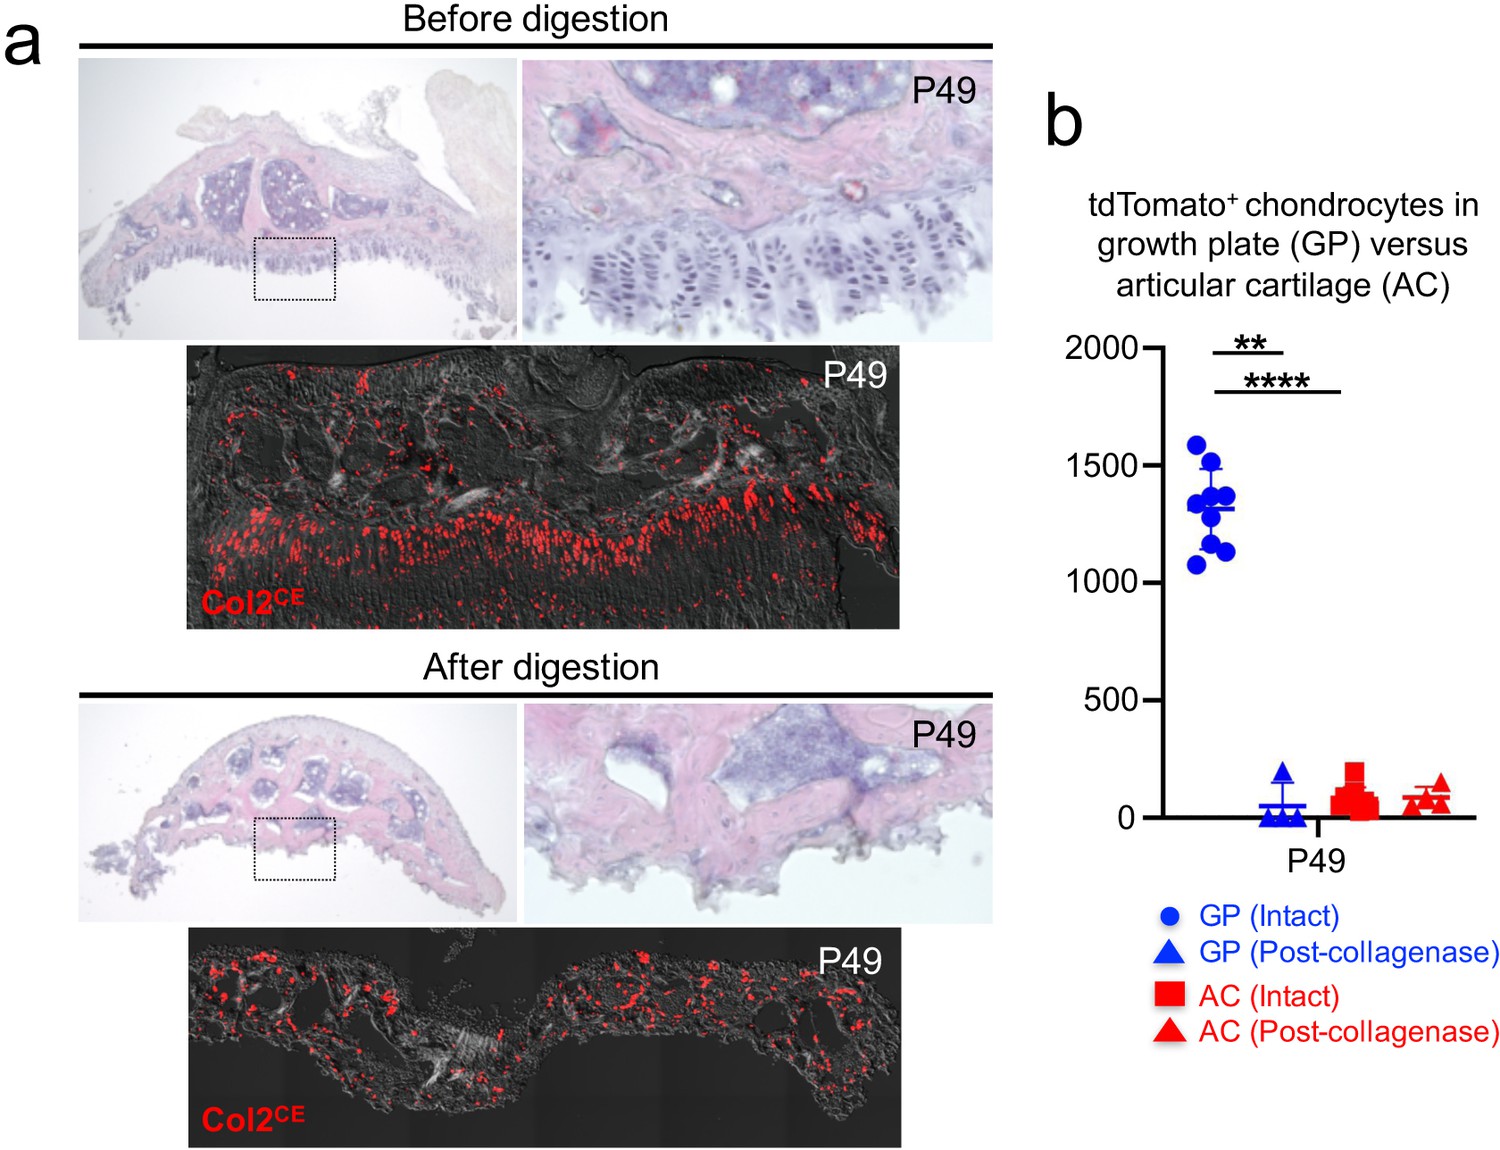
A protocol to preferentially isolate growth plate chondrocytes from postnatal epiphyses.
(a) Representative epiphyses of Col2a1-creER; R26R-tdTomato proximal tibia at P49, before (upper) and after (lower) serial collagenase digestions. (Top panels): H and E staining, (bottom panels): tdTomato epifluorescence. Red: tdTomato, gray: DIC. (b) Quantification of tdTomato+ chondrocytes in growth plate (GP) and articular cartilage (AC) before and after collagenase digestion. Blue: GP, red: AC. n=nine mice (Intact), n=four mice (Post-collagenase). **p<0.01, ****p<0.0001. Mann-Whitney’s U-test. Data are represented as mean ± s.d.
-
Figure 3—source data 1
Quantification of tdTomato+chondrocytes in growth plate (GP) and articular cartilage (AC) before and after collagenase digestion.
- https://cdn.elifesciences.org/articles/64513/elife-64513-fig3-data1-v1.xlsx
Figure 4 with 1 supplement

A flow cytometry-based identification and isolation of LRCs from Col2-Q mice.
(a–c) Flow cytometry analysis of dissociated Col2-Q growth plate cells. (a): Pseudo-color plots of CD45neg cells at the indicated number of weeks in chase. Red gates: Col2a1-creER/tdTomato+ (Col2CE-tdT+) cells. (b): Histogram of CD45negCol2CE-tdT+ cells showing the distribution of H2B-EGFP+ cells as the percentage of the maximum count. Red line: P21 (No Doxy), blue line: P28 (+Doxy 1wk), green line: P35 (+Doxy 2wk), orange line: P56 (+Doxy 5wk), light blue line: P91 (+Doxy 10wk), pink line: No Col2-tTA control at P21. (c): Percentage of >104 H2B-EGFP+ LRCs among total Col2CE-tdT+ cells. x axis: weeks in chase, y axis: % of cells > 104 unit of GFP. n=nine mice (0 week, 1 week), n=seven mice (2 weeks, 5 weeks), n=six mice (3 weeks, 4 weeks), n=five mice (6 weeks) and n=three mice (7 weeks, 8 weeks, 10 weeks, 12 weeks). Data are presented as mean ± s.d. (d) Flow cytometry analysis of cell proliferation in LRCs and Non-LRCs of Col2-Q growth plates at P35, with EdU administration shortly before analysis (6 and 3 hr prior to sacrifice). LRCs are defined as Col2CE-tdT+ cells with the top 10 percentile H2B-GFP brightness (red box), while Non-LRCs are defined as Col2CE-tdT+ cells with 10–50 percentile H2B-GFP brightness. Top left panel: forward/side scatter plot, top right panel: CD45-eFlour450neg fraction. Bottom panels: EdU-Alexa647 (x axis) signal of LRCs (right) and Non-LRCs (left). (e) Quantification of % EdU-Alexa647+ cells among LRCs and non-LRCs, harvested from Col2-Q growth plates at P28 (+1 week; n=six mice), P35 (+2 weeks; n=eight mice) and P49 (+4 weeks; n=four mice). **p<0.01. Mann-Whitney’s U-test. Data are represented as mean ± s.d.
-
Figure 4—source data 1
Percentage of >104H2B-EGFP+LRCs among total Col2CE-tdT+cells.
- https://cdn.elifesciences.org/articles/64513/elife-64513-fig4-data1-v1.xlsx
-
Figure 4—source data 2
Quantification of % EdU-Alexa647+cells among LRCs and non-LRCs.
- https://cdn.elifesciences.org/articles/64513/elife-64513-fig4-data2-v1.xlsx
Figure 4—figure supplement 1

A flow cytometry-based approach to define cell proliferation of LRCs and Non-LRCs.
Flow cytometry-based approach to define EdU incorporation of Non-LRCs (blue) and LRCs (red), following 1 week (a) and 4 weeks (b) of doxycycline feeding in Col2-Q mice. These mice were treated with two doses of EdU shortly before sacrifice (6 and 3 hr prior to sacrifice).
Figure 5 with 2 supplements
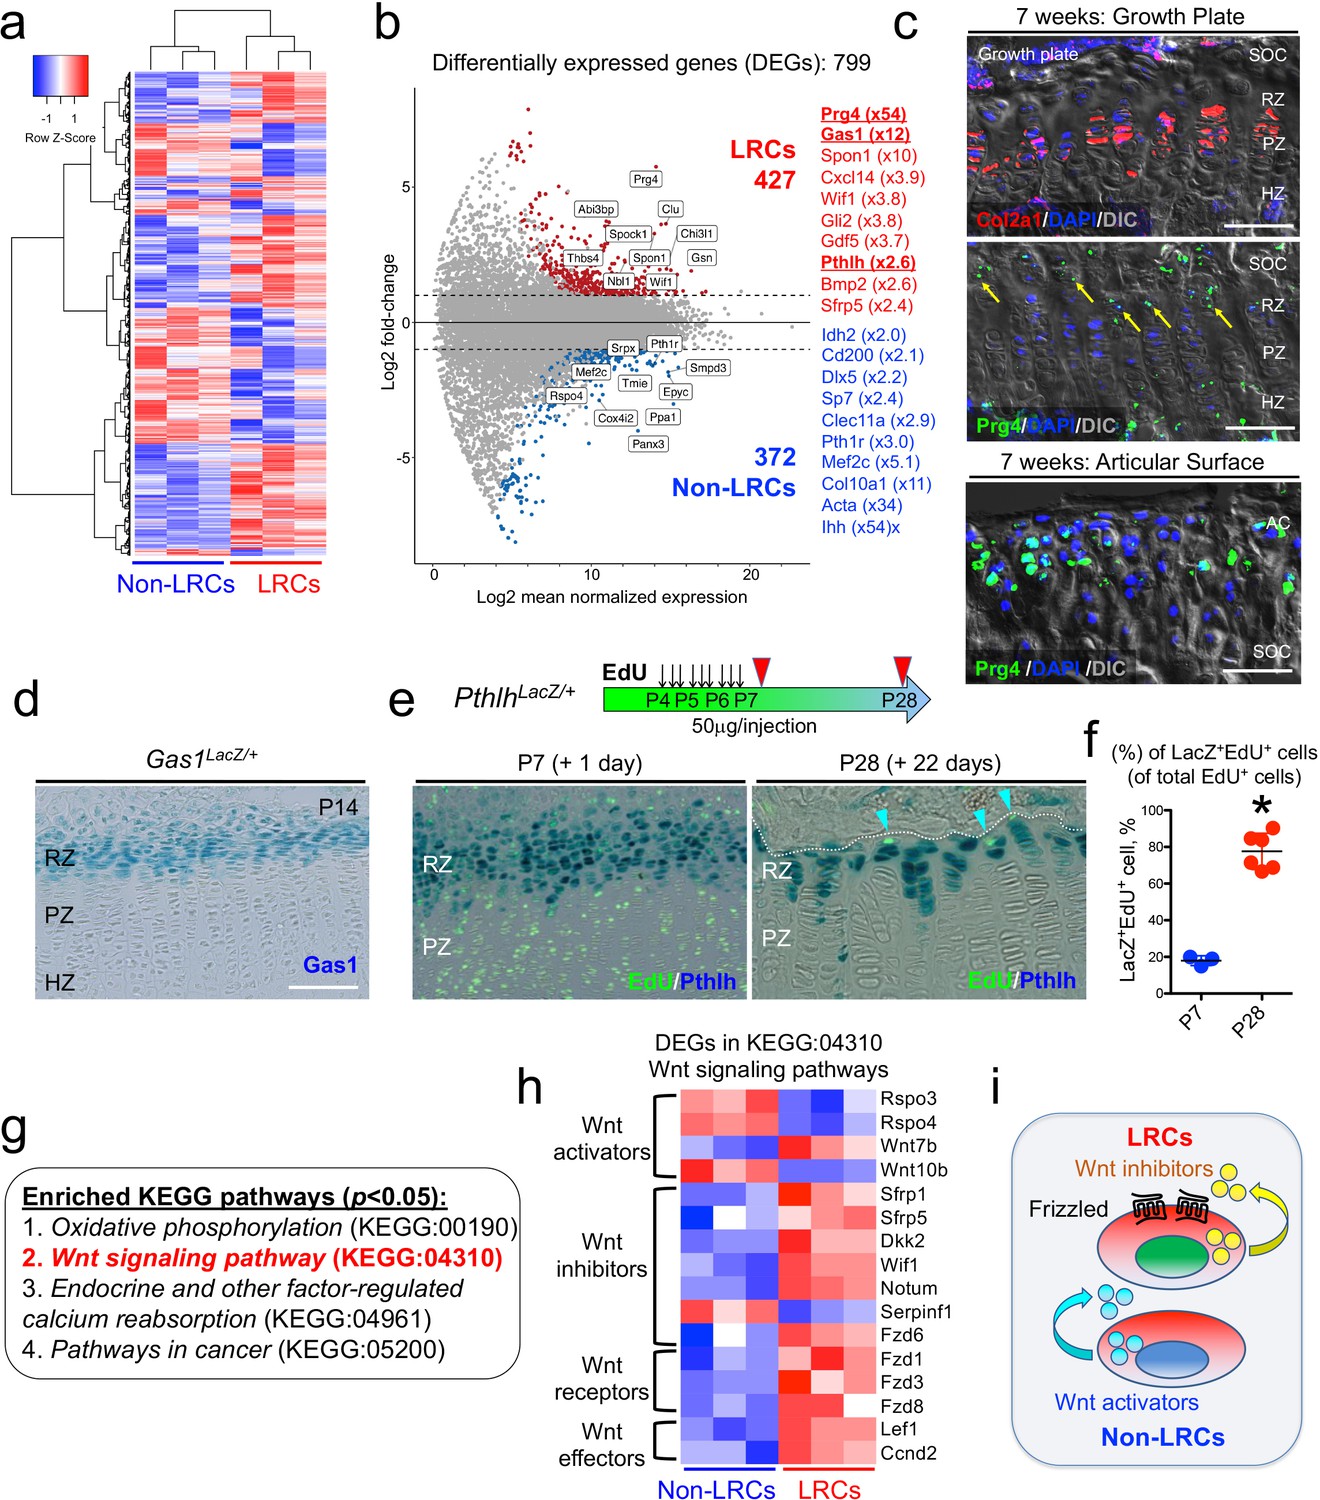
Unique molecular signature of label-retaining chondrocytes (LRCs) in the postnatal growth plate.
(a) Comparative RNA-seq analysis of LRCs and non-LRCs. Heatmap of top 500 differentially expressed genes (DEGs) with hierarchical clustering, between isolated non-LRCs and LRCs. (b) MA plot (Log2 fold change) of differentially expressed genes (DEGs) between isolated non-LRCs (372 total) and LRCs (427 total) with representative upregulated genes in each cell population. (c) Fluorescent RNAscope in situ hybridization analysis of Col2a1 and Prg4 mRNA in growth plate (top) and articular surface (bottom) at 7 weeks of age. SOC: secondary ossification center, RZ: resting zone, PZ: proliferating zone, HZ: hypertrophic zone. Blue: DAPI, red: Col2a1, green: Prg4, gray: DIC. Scale bar 100 µm. (d) Gas1LacZ/+ distal femur growth plates at P14. Scale bar: 100 µm. (e,f) PthlhLacZ/+ distal femur growth plates with EdU administration, serially pulsed nine times between P4 and P6. (e, left panel): Immediately after the pulse at P7. (e, right panel): After 22 days of chase at P28. Arrowheads: EdU label-retaining LacZ+ cells. RZ: resting zone, PZ: proliferating zone. Scale bars: 100 µm. (f): The percentage of LacZ+EdU+ cells among total EdU+ cells, at P7 (n=three mice) and P28 (n=six mice). *p<0.05, Mann-Whitney’s U-test. Data are represented as mean ± s.d. (g) Enriched KEGG pathway terms (p<0.05) based on 799 differentially expressed genes (DEGs). (h) Heatmap of differentially expressed genes (DEGs) related to KEGG:04310 (canonical Wnt/β-Catenin signaling pathway). The DEGs were further classified by their functions (e.g. Wnt activators, Wnt inhibitors, Wnt receptors and Wnt effectors). (i) Schematic diagram of Wnt activation and inhibition in non-LRCs and LRCs, respectively.
-
Figure 5—source data 1
The percentage of Pthlh-LacZ+EdU+cells among total EdU+cells.
- https://cdn.elifesciences.org/articles/64513/elife-64513-fig5-data1-v1.xlsx
Figure 5—figure supplement 1
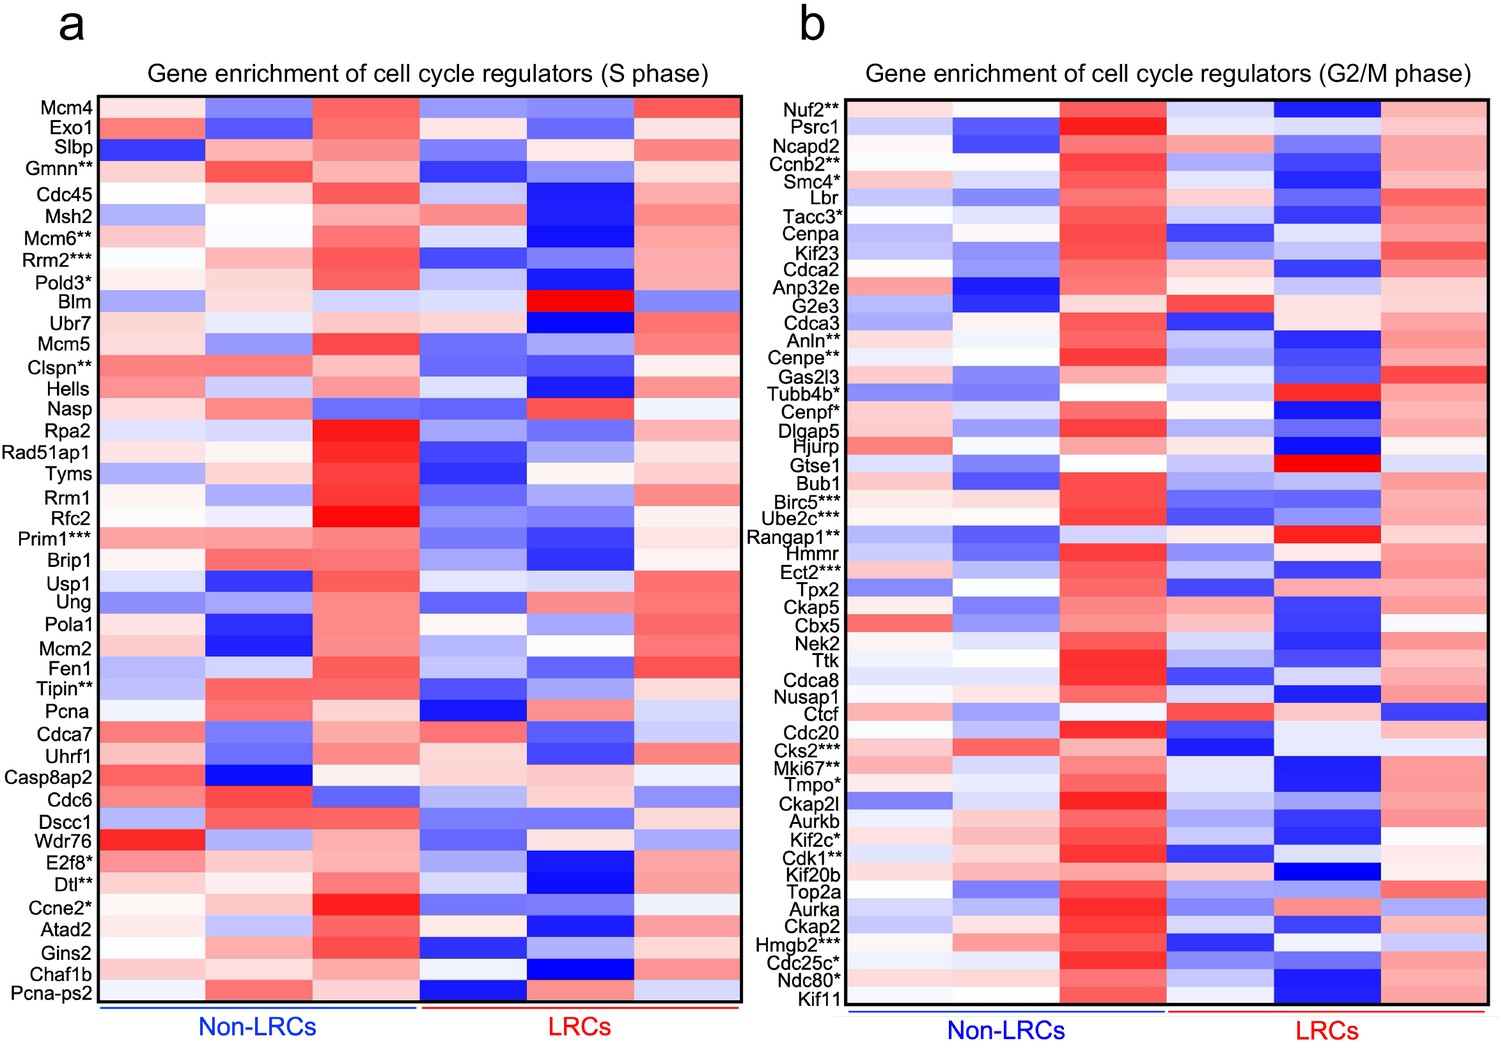
A comparative RNA-seq analysis of S and G2/M phase cell cycle regulators in LRCs and non-LRCs.
Heatmap of 42 genes for S phase (a) and 52 genes for G2/M (b) phase cell cycle regulators, between isolated non-LRCs and LRCs. *p<0.05, **p<0.01, ***p<0.001 Mann-Whitney’s U-test.
Figure 5—figure supplement 2

An RNAscope analysis of Col2a1 and Prg4 expression in postnatal growth plate and articular cartilage.
Fluorescent RNAscope in situ hybridization analysis of Col2a1 (red) and Prg4 (green) mRNA in growth plate (GP) and articular cartilage (AC) at P21 (a) and 7 weeks (b). RZ: resting zone, PZ: proliferating zone, HZ: hypertrophic zone, AC: articular cartilage, SOC: secondary ossification center. Red: Col2a1, Green: Prg4, Blue: DAPI, Gray: DIC. Scale bar 100 µm.
Figure 6 with 1 supplement
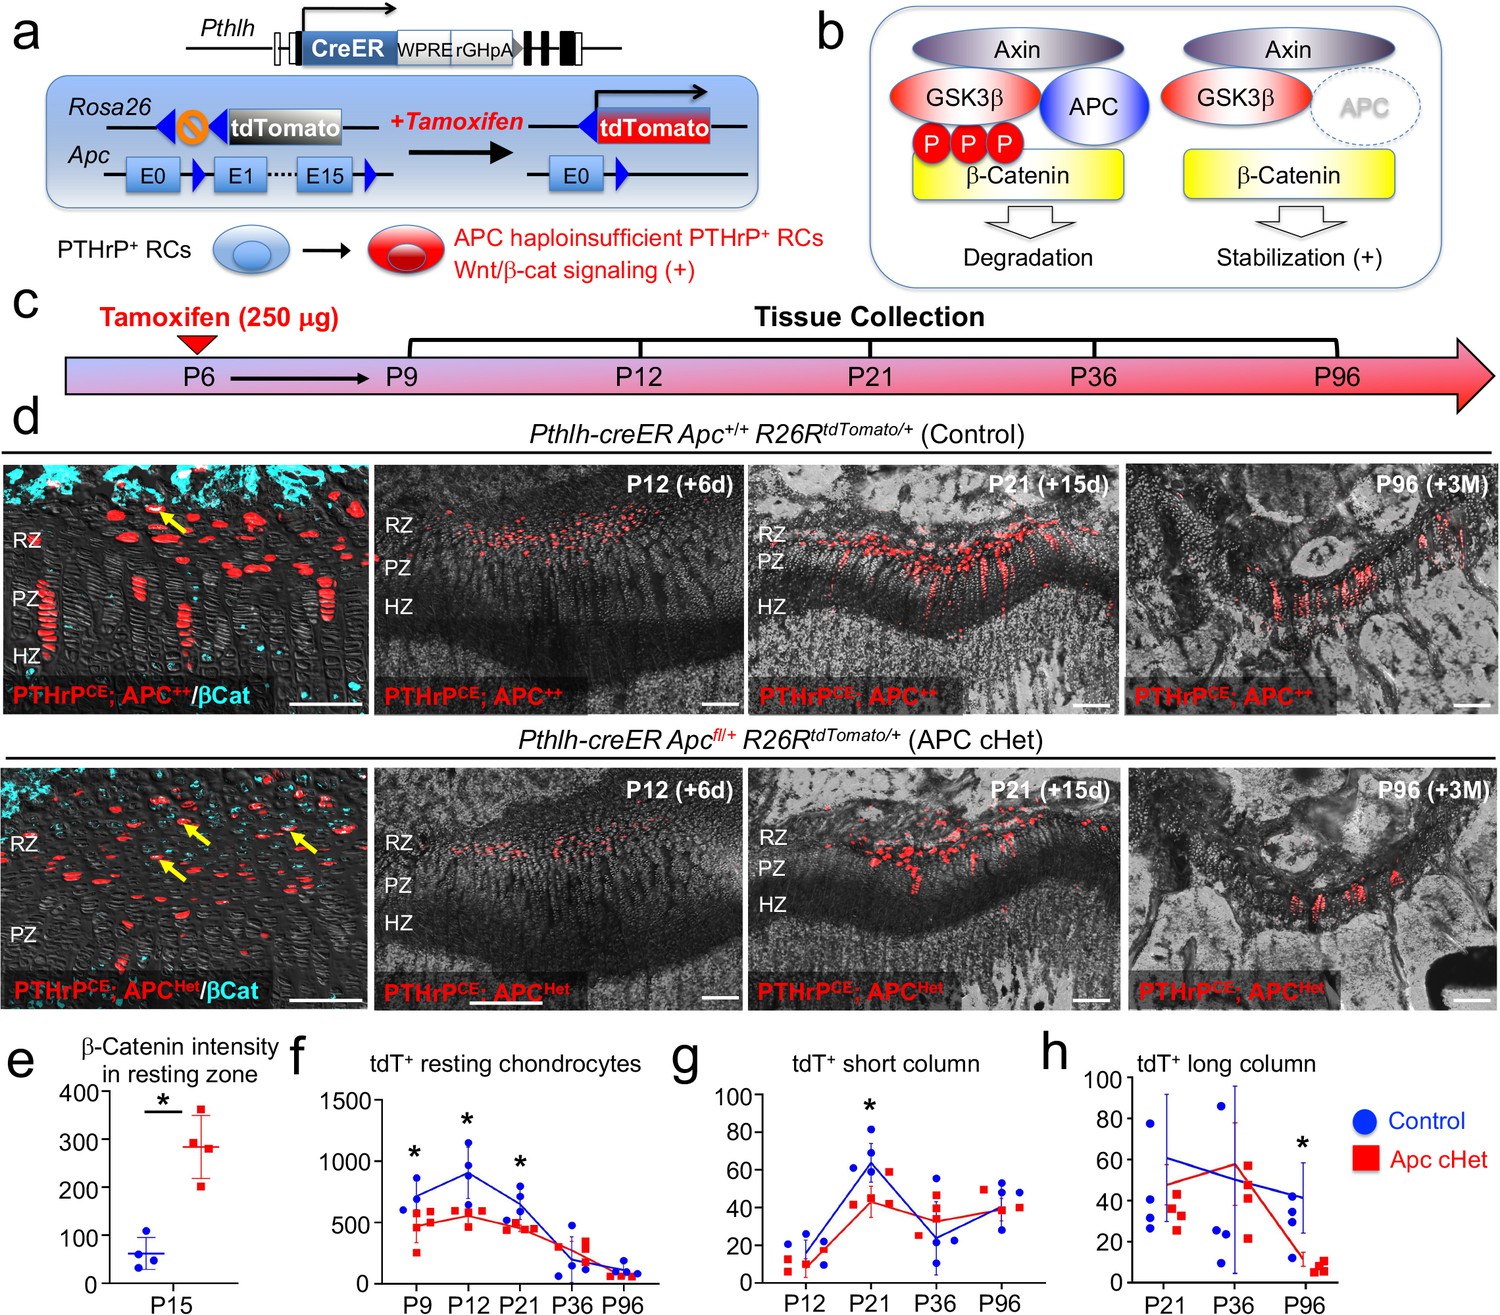
Activation of canonical Wnt/β-catenin signaling causes failure of formation and differentiation of PTHrP+ chondrocytes.
(a) Pthlh-creER; R26RtdTomato lineage-tracing model crossed with an adenomatous polyposis coli (Apc) floxed allele (flanking exons 1 and 15). Single intraperitoneal injection of tamoxifen (0.25 mg) at P6 induces cre recombination, leading to activation of canonical Wnt/β-catenin signaling in PTHrP+ chondrocytes via Apc haploinsufficiency (Pthlh-creER; APCfl/+; R26R-tdTomato). (b) Schematic diagram of β-catenin degradation complex. Phosphorylation of β-catenin protein leads to degradation (left). Apc haploinsufficiency leads to β-catenin stabilization by impairing the degradation complex (right). (c) Timeline for pulse-chase experiment. Tamoxifen injection (0.25 mg) at P6 and chase to P9, P12, P21, P36 and P96. (d) (Leftmost panel): β-catenin staining in Pthlh-creER; Apc+/+; R26RtdTomato (Control) and Pthlh-creER; Apcfl/+; R26RtdTomato (APC cHet) distal femur growth plates at P15. Arrows: β-catenin+tdTomato+ cells in RZ. (2nd-4th panels): Distal femur growth plates of Pthlh-creER; Apc+/+; R26RtdTomato (Control) and Pthlh-creER; Apcfl/+; R26RtdTomato (APC cHet) at P12, P21, and P96. RZ: resting zone, PZ: proliferating zone, HZ: hypertrophic zone. Blue: β-catenin-Alexa633, red: tdTomato, gray: DAPI and DIC. Scale bars 100 µm. n=four mice per genotype per time point. (e–h) Compiled quantification data of (e) β-Catenin intensity in resting zone (n=four mice per genotype) and total numbers of (f) resting chondrocytes (n=4–5 mice per genotype per time point), (g) short columnar chondrocytes (≤10 tdTomato+ cells, n=four mice per genotype per time point) and (h) long columnar chondrocytes (>10 tdTomato+ cells, n=four mice per genotype per time point) collected from serial sections of femur growth plates (two femurs/mouse) at all time points. *p<0.05, Mann-Whitney’s U-test. Data are presented as mean ± s.d. Control versus Apc cHet, resting chondrocytes; P9: p=0.036, mean difference = 243.9±97.4, 95% confidence interval (4.2, 483.5); P12: p=0.029, mean difference = 351.9±109.8, 95% confidence interval (83.3, 620.5); P21: p=0.029, mean difference = 198.5±63.9, 95% confidence interval (42.1, 355.0); P36: p=0.343, mean difference = –76.3±100.3, 95% confidence interval (–321.8, 169.3); P96: p=0.057, mean difference = 55.3±28.7, 95% confidence interval (–18.5, 129.1). Control versus Apc cHet, short columns; P12: p=0.020, mean difference = 7.9±4.3, 95% confidence interval (–2.7, 18.5); P21: p=0.029, mean difference = 20.8±6.5, 95% confidence interval (5.0, 36.5); P36: p=0.343, mean difference = –8.9±10.7, 95% confidence interval (–35.0, 17.3); P96: p=0.343, mean difference = 1.3±7.2, 95% confidence interval (–17.2, 19.7). Control versus Apc cHet, long columns; P21: p=0.886, mean difference = 10.0±12.1, 95% confidence interval (–19.6, 39.6); P36: p=0.686, mean difference = –5.9±18.6, 95% confidence interval (–51.3, 39.5); P96: p=0.029, mean difference = 22.3±6.5, 95% confidence interval (6.2, 38.3).
-
Figure 6—source data 1
Compiled quantification data of (e) B-Catenin intensity in resting zone and total numbers of resting chondrocytes, (g) short columnar chondrocytes and (h) long columnar chondrocytes.
- https://cdn.elifesciences.org/articles/64513/elife-64513-fig6-data1-v1.xlsx
Figure 6—figure supplement 1

Morphology and organization of PTHrPCE lineage-marked APC-insufficient columnar chondrocytes.
Assessment of organization and morphology of PTHrP-creER lineage-marked columnar chondrocytes in Pthlh-creER; Apc+/+ (Control) and Pthlh-creER; Apcfl/+ (APC cHet) growth plates. Mice were pulsed with tamoxifen at P6 and chased to P21 (left), P36 (middle) and P96 (right). Red: tdTomato, gray: DIC. RZ: resting zone, PZ: proliferating zone, HZ: hypertrophic zone. Scale bars: 100 µm. Figure Legends – figure supplements.
Figure 7
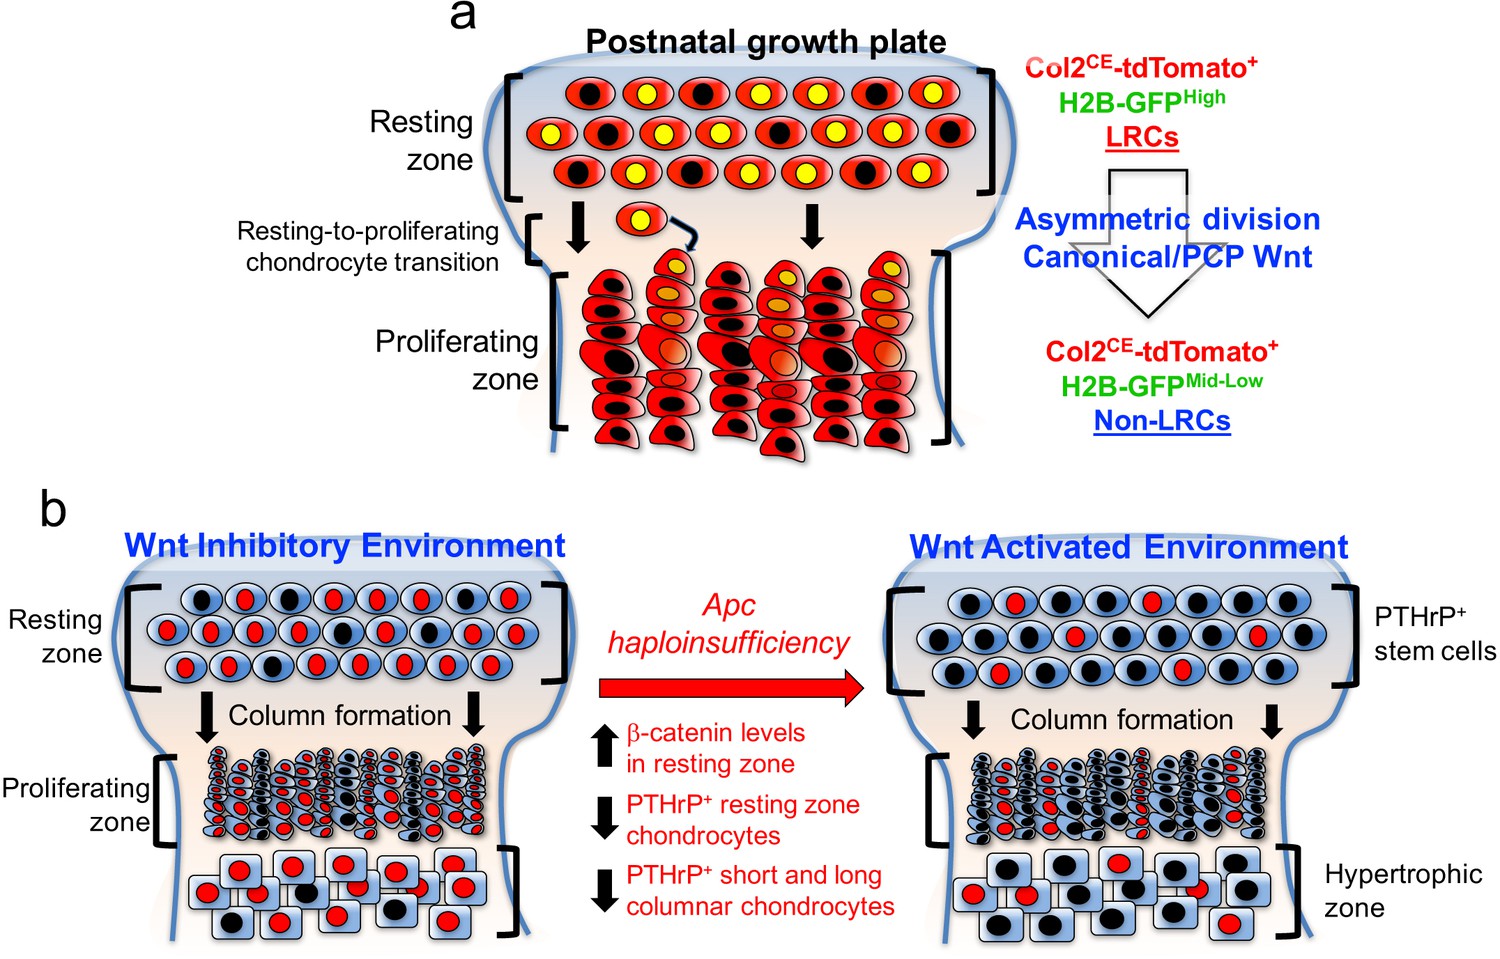
PTHrP+ chondrocytes in the resting zone of the growth plate are maintained in a Wnt-inhibitory environment.
PTHrP+ chondrocytes are maintained in a Wnt inhibitory environment within the resting zone. (a) Transition of chondrocytes from the resting zone (‘label-retaining chondrocytes, LRCs’) to the proliferating zone (‘non-label-retaining chondrocytes, Non-LRCs’) in the postnatal growth plate is concertedly regulated by canonical Wnt/β-catenin and non-canonial Wnt/PCP signaling pathways. (b) Apc haploinsufficiency increases β-catenin level in the resting zone, and subsequently decreases formation of PTHrP+ chondrocytes and their differentiation to columnar chondrocytes. Non-canonical Wnt/PCP pathways also play a role in facilitating asymmetric horizontal cell division of resting chondrocytes. Figure Legends – figure supplements.
Tables
Key resources table
| Reagent type (species) or resource | Designation | Source or reference | Identifiers | Additional information |
|---|---|---|---|---|
| Strain, strain background (Mus musculus) | Col2a1-tTA | Jackson Laboratory | RRIDMGI:6490616 | |
| Strain, strain background (Mus musculus) | TRE-H2B-EGFP | PMID:19060879 | RRIDMGI:5007779 | |
| Strain, strain background (Mus musculus) | Col2a1-creER | PMID:16894608 | RRIDMGI:3665440 | |
| Strain, strain background (Mus musculus) | Pthlh-LacZ/null | PMID:16355280 | RRIDMGI:3829430 | |
| Strain, strain background (Mus musculus) | Gas1-LacZ/null | PMID:11231094 | RRIDMGI:2388397 | |
| Strain, strain background (Mus musculus) | Pthlh-creER | PMID:30401834 | RRIDMGI:6257033 | |
| Strain, strain background (Mus musculus) | Rosa26-CAG-loxP-stop-loxP-tdTomato | Jackson Laboratory | RRIDMGI:3809524 | |
| Strain, strain background (Mus musculus) | Apctm1Tyj | Jackson Laboratory | RRIDMGI:3829069 | |
| Sequence-based reagent | Mm-Col2a1 | ACDbio | Cat# 407221 | (1:500) |
| Sequence-based reagent | Mm-Prg4 | ACDbio | Cat# 437661 | (1:500) |
| Antibody | Rabbit polyclonal anti-β-catenin | Abcam | Cat# 16051 | (4 μg) |
| Antibody | Goat polyclonal Alexa Fluor 633-conjugated anti-Rabbit IgG (H+L) | Invitrogen | Cat# A-21071 | (1:200) |
| Antibody | Rat monoclonal APC-conjugated anti-mouse CD45 | Invitrogen | Cat# 17-0451-82 | (1:500) |
| Antibody | Rat monoclonal eFlour450-conjugated anti-mouse CD45 | Invitrogen | Cat# 14-0451-82 | (1:500) |
| Chemical compound, drug | Opal 520 | Akoya Biosciences | Cat# 1601877 | |
| Chemical compound, drug | Alexa Fluor 488-azide | Invitrogen | Cat# A10266 | |
| Chemical compound, drug | Alexa Fluor 647-azide | Invitrogen | Cat# A10277 | |
| Chemical compound, drug | EdU (5-ethynyl-2’-deoxyuridine) | Invitrogen | Cat# E10187 | |
| Other | DAPI (4',6-Diamidino-2-Phenylindole, Dihydrochloride) | Invitrogen | Cat# D1306 |
Additional files
-
Supplementary file 1
Normalized expression count values of label-retaining chondrocytes (LRCs) and non-LRCs.
Comparative RNA-seq analysis of LRCs and non-LRCs, rlog normalized count values for each biological sample of LRCs (High1_50032, High2_53561, High3_53563) and non-LRCs (Low1_50033, Low2_53562, Low3_53564). Provided is a table of differential expression (DE) statistics, rlog counts per sample, as well as standard deviation and mean across sample counts in rlog scale. This table was used for generating all heatmaps, including restricting only to differentially expressed genes, to input DE statistics for GO term enrichment, and intersected with KEGG gene sets from iPathway Guide for STRING analysis.
- https://cdn.elifesciences.org/articles/64513/elife-64513-supp1-v1.xlsx
-
Transparent reporting form
- https://cdn.elifesciences.org/articles/64513/elife-64513-transrepform-v1.docx
Download links
A two-part list of links to download the article, or parts of the article, in various formats.
Downloads (link to download the article as PDF)
Open citations (links to open the citations from this article in various online reference manager services)
Cite this article (links to download the citations from this article in formats compatible with various reference manager tools)
Chondrocytes in the resting zone of the growth plate are maintained in a Wnt-inhibitory environment
eLife 10:e64513.
https://doi.org/10.7554/eLife.64513


