Global gradients in intertidal species richness and functional groups
- British Antarctic Survey, United Kingdom
- Department of Zoology, University of British Columbia, Canada
- Arctic Research Centre, Department of Bioscience, Aarhus University, Denmark
- Homerton College, University of Cambridge, United Kingdom
- Marine Ecology, Department of Bioscience, Aarhus University, Denmark
Figures
Figure 1
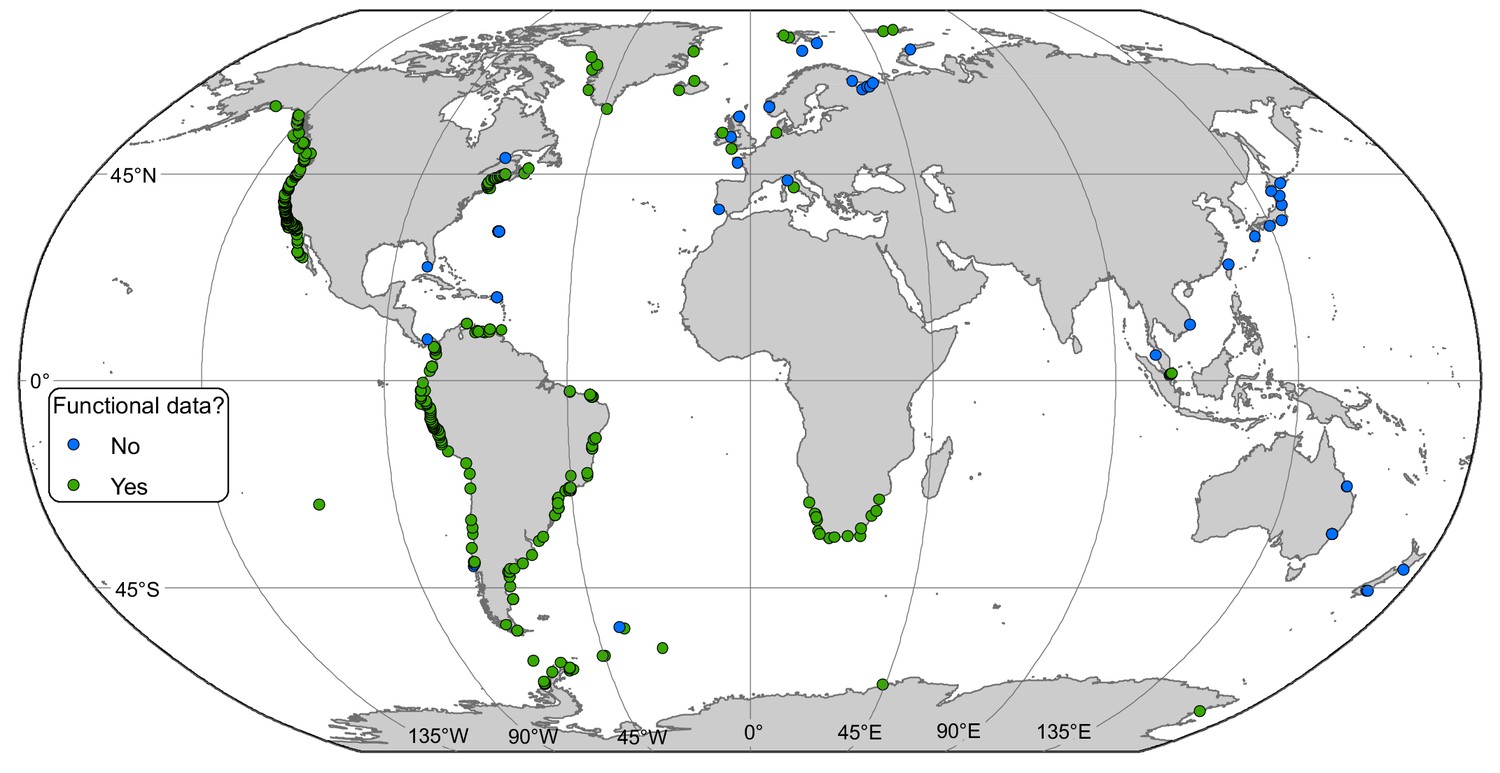
Locations of rocky intertidal sampling sites.
Some sites are not visible because of close proximity. Functional diversity data were available in green sites.
Figure 2
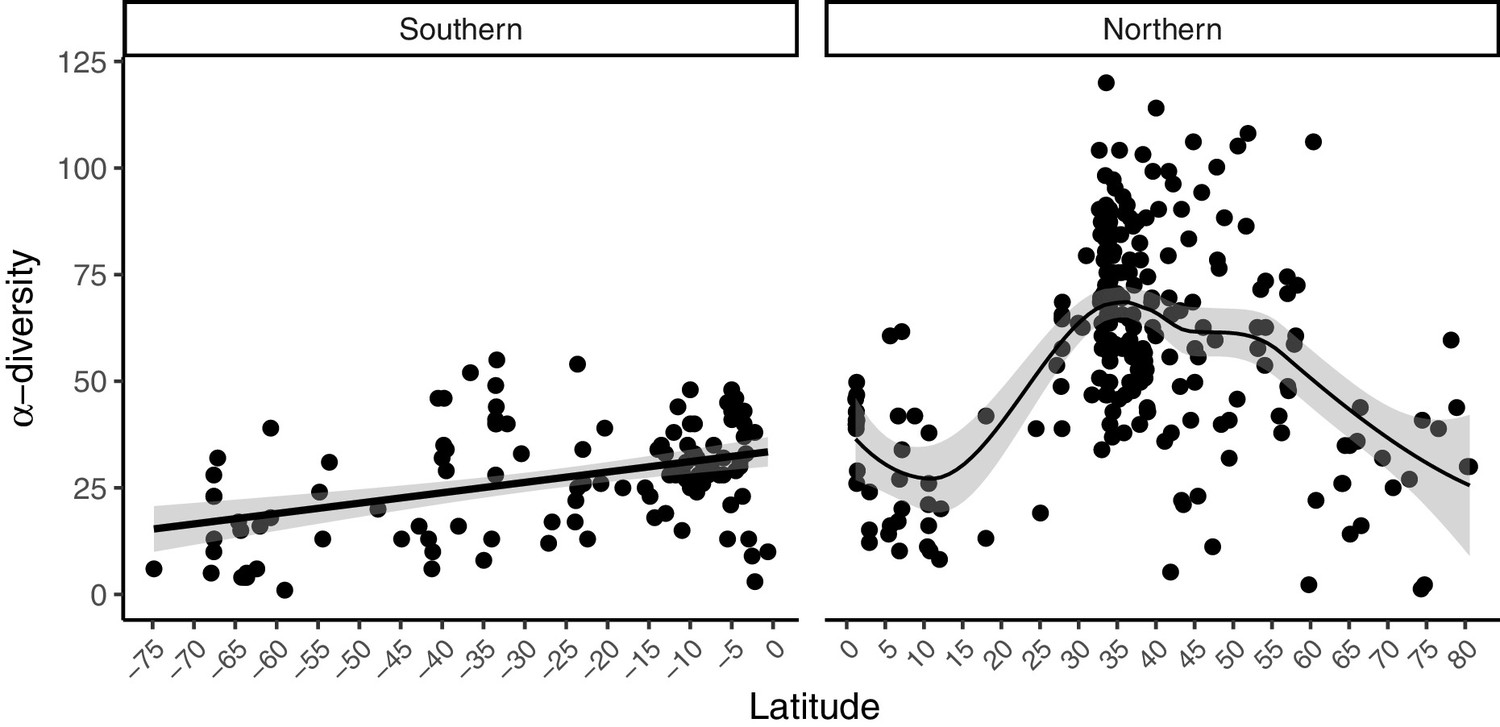
Latitudinal patterns in rocky intertidal α-diversity plotted against latitude.
Data are split into southern and northern hemispheres. A linear regression line (southern hemisphere) and a best-fit locally weighted scatterplot smoother (northern hemisphere) was added with 95% confidence intervals to aid visual interpretation.
Figure 3
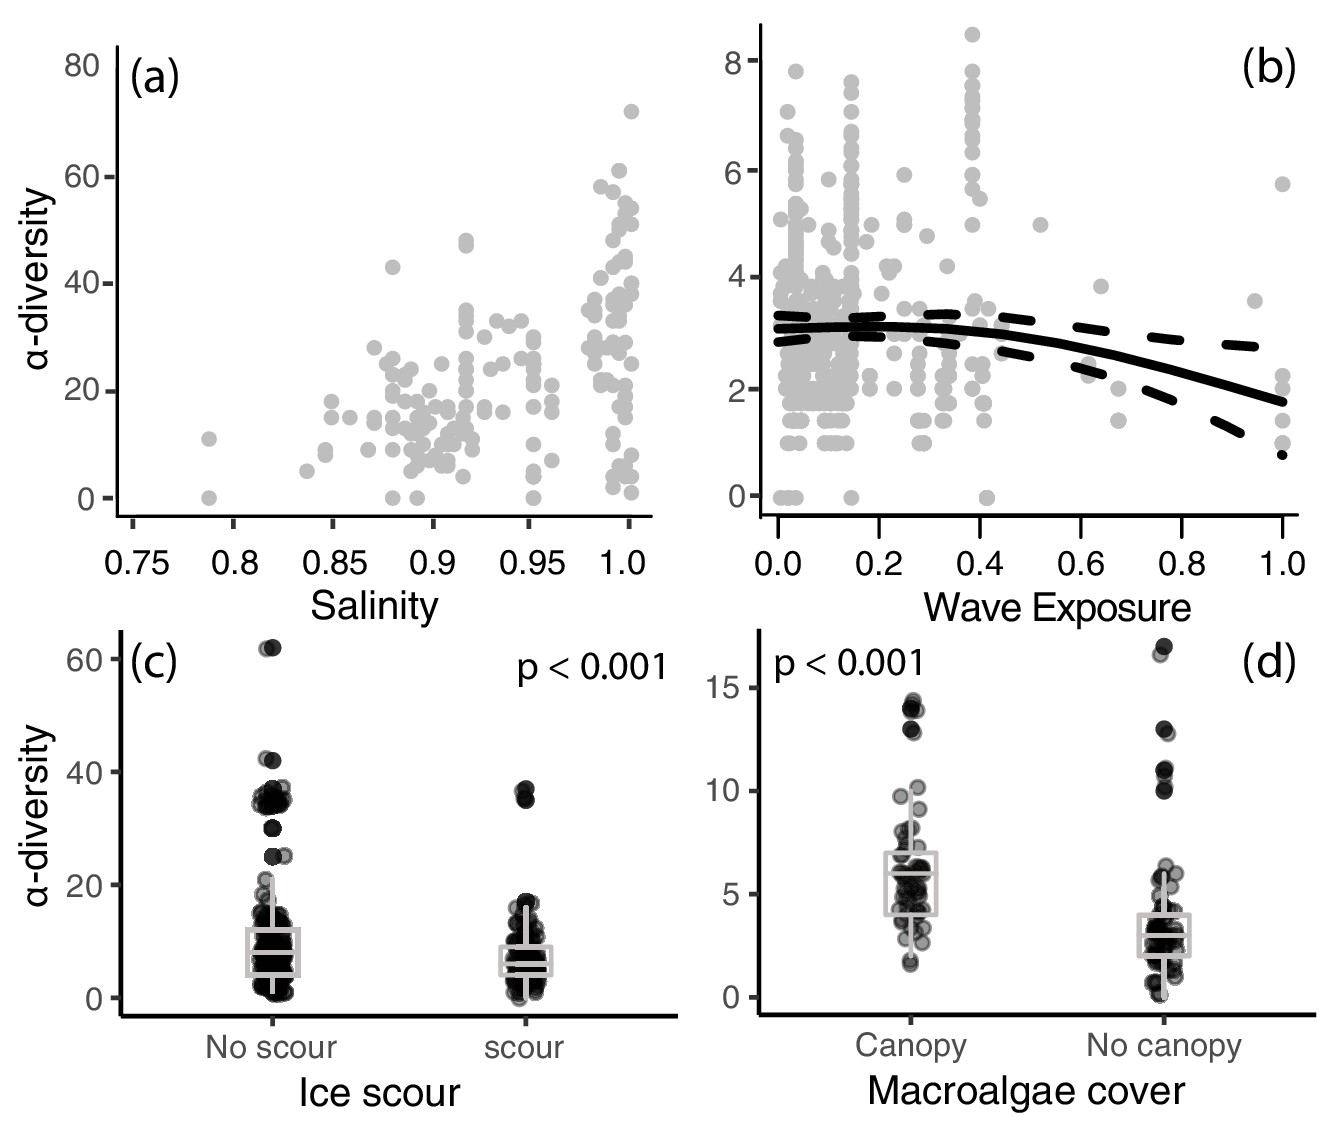
Local-scale relationships between (a) salinity, (b) wave exposure, (c) ice scour, and (d) macroalgal canopy cover on α-diversity.
A best-fit locally weighted scatterplot smoother (LOESS) and 95% confidence intervals (panel b) and boxplots (panels c,d) has been added to aid visual interpretation.
Figure 4
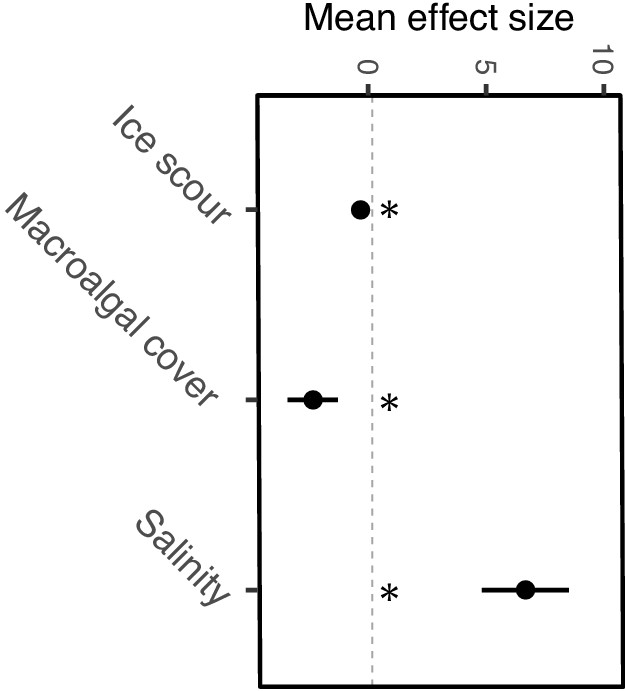
Local-scale mean effect sizes and direction of ice scour, macroalgal cover, and salinity on α-diversity estimated from individual models.
Significance of regression parameters is identified as bootstrapped 95% confidence intervals (error bars) not crossing zero (* indicates significance).
Figure 5
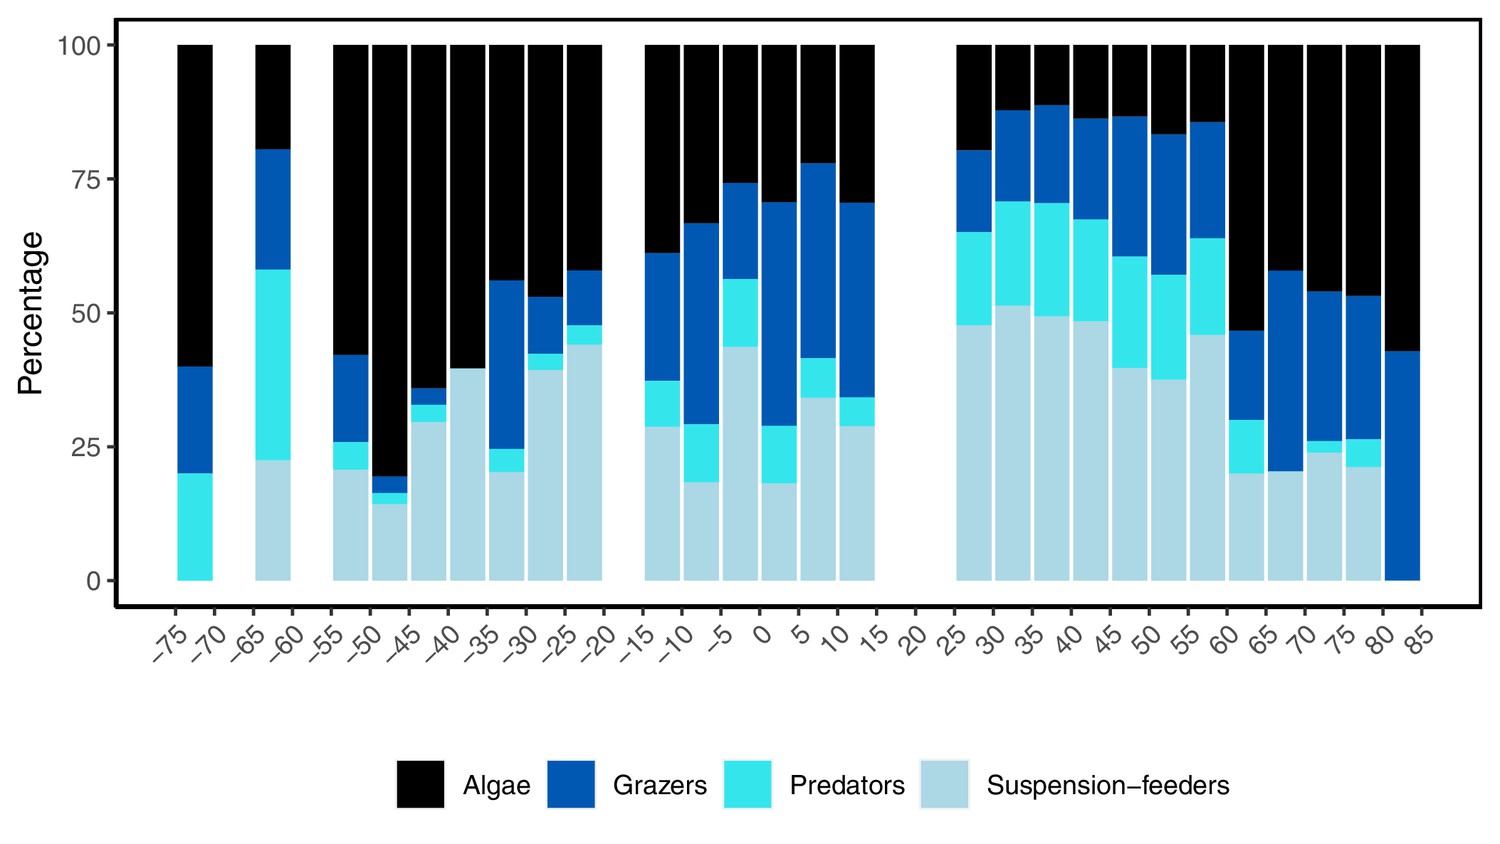
Latitudinal variation in the relative number of species from four functional groups in the rocky intertidal between 74.8°S and 80.5°N, where negative values denote southern hemisphere latitudes.
No data were available within the 5° latitudinal bands where bars are missing.
Tables
Table 1
Results of the mixed effect models for rocky intertidal α-diversity.
The estimate, standard error (SE), z-value, and p-value are presented for each variable. The estimated degree of freedom (ed), and p-value are presented for the smoother in the northern hemisphere*.
| Estimates | SE | z-Value | p-Value | |
|---|---|---|---|---|
| Northern hemisphere | ||||
| (Intercept) | 3.086 | 0.283 | 10.92 | <0.001 |
| Chlorophyll a | −0.004 | 0.088 | 0.05 | 0.959 |
| Phosphate | −0.163 | 0.288 | −0.56 | 0.573 |
| Sea temperature | 0.024 | 0.015 | 1.64 | 0.101 |
| Southern hemisphere | ||||
| (Intercept) | 3.199 | 0.443 | 7.225 | <0.001 |
| Latitude | 0.006 | 0.007 | 0.899 | 0.369 |
| Chlorophyll a | −0.006 | 0.007 | −0.829 | 0.407 |
| Phosphate | −0.240 | 0.234 | −1.029 | 0.303 |
| Sea temperature | −0.010 | 0.016 | −0.653 | 0.514 |
-
*Approximate significance of cubic spline regression smoother: Estimated df = 2.005, p-value=0.023.
Table 2
Local-scale model summaries with individual models indicated for each model.
Estimated parameters, standard error (SE), bootstrapped 95% confidence intervals (95% CI), z-values, and p-values are reported for the relationship between α-diversity and environmental covariates.
| Salinity R2 = 0.19 (GLM) | |||||
|---|---|---|---|---|---|
| Estimates | SE | 95% CI | z-Value | p-Value | |
| (Intercept) | −3.201 | 0.891 | −4.94; −1.47 | −3.6 | <0.0001 |
| Salinity | 6.676 | 0.946 | 4.82; 8.52 | 7.06 | <0.0001 |
| Wave exposure (GAM) R2 = 0.12 | |||||
| Estimates | SE | z-Value | p-Value | ||
| (Intercept)* | 2.435 | 0.029 | 82.4 | <0.0001 | |
| Ice scour (GLM) R2 = 0.05 | |||||
| Estimates | SE | 95% CI | z-Value | p-Value | |
| (Intercept) | 2.353 | 0.055 | 2.24; 2.46 | 42.7 | <0.0001 |
| Ice scour | −0.401 | 0.087 | −0.57; −0.23 | −4.59 | <0.0001 |
| Macroalgal cover (GLM) R2 = 0.14 | |||||
| Estimates | SE | 95% CI | z-Value | p-Value | |
| (Intercept) | 6.133 | 0.386 | 5.37; 6.89 | 15.9 | <0.0001 |
| Cover | −2.35 | 0.547 | −3.42; −1.28 | −4.3 | <0.0001 |
-
*Approximate significance of locally weighted scatterplot wave exposure smoother: Estimated df = 8.40, p-value<0.0001.
Additional files
-
Supplementary file 1
Latitudinal distribution of the intertidal study sites.
- https://cdn.elifesciences.org/articles/64541/elife-64541-supp1-v2.docx
-
Transparent reporting form
- https://cdn.elifesciences.org/articles/64541/elife-64541-transrepform-v2.pdf
Download links
A two-part list of links to download the article, or parts of the article, in various formats.
Downloads (link to download the article as PDF)
Open citations (links to open the citations from this article in various online reference manager services)
Cite this article (links to download the citations from this article in formats compatible with various reference manager tools)
Global gradients in intertidal species richness and functional groups
eLife 10:e64541.
https://doi.org/10.7554/eLife.64541


