The global burden of yellow fever
- WHO Collaborating Centre for Infectious Disease Modelling, MRC Centre for Global Infectious Disease Analysis, Abdul Latif Jameel Institute for Disease and Emergency Analytics (J-IDEA), Imperial College London, United Kingdom
- Maître de conférences, Laboratoire MESuRS - Cnam Paris, France
- Secretariat for Health Surveillance, Brazilian Ministry of Health, Brazil
- World Health Organisation, Switzerland
Figures
Figure 1
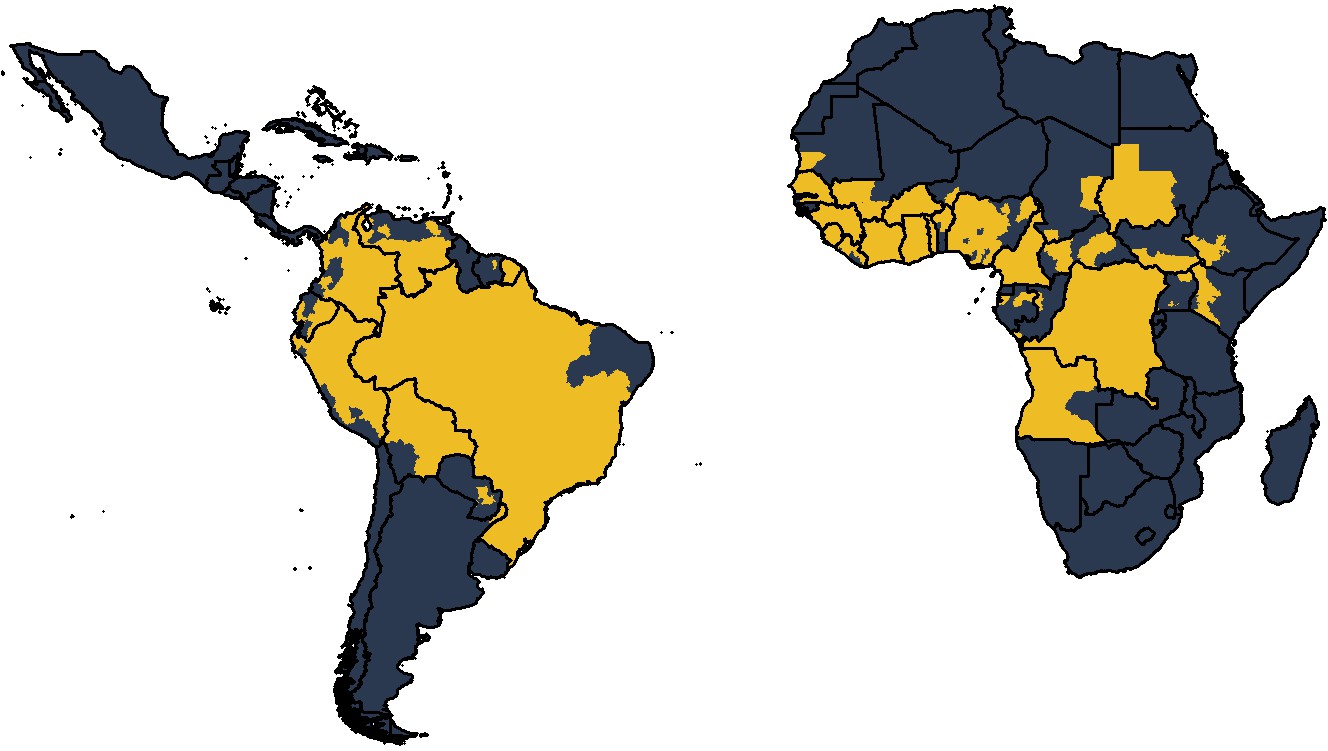
Global occurrence of yellow fever at province level.
Occurrence since 1984 is shown in yellow.
Figure 2
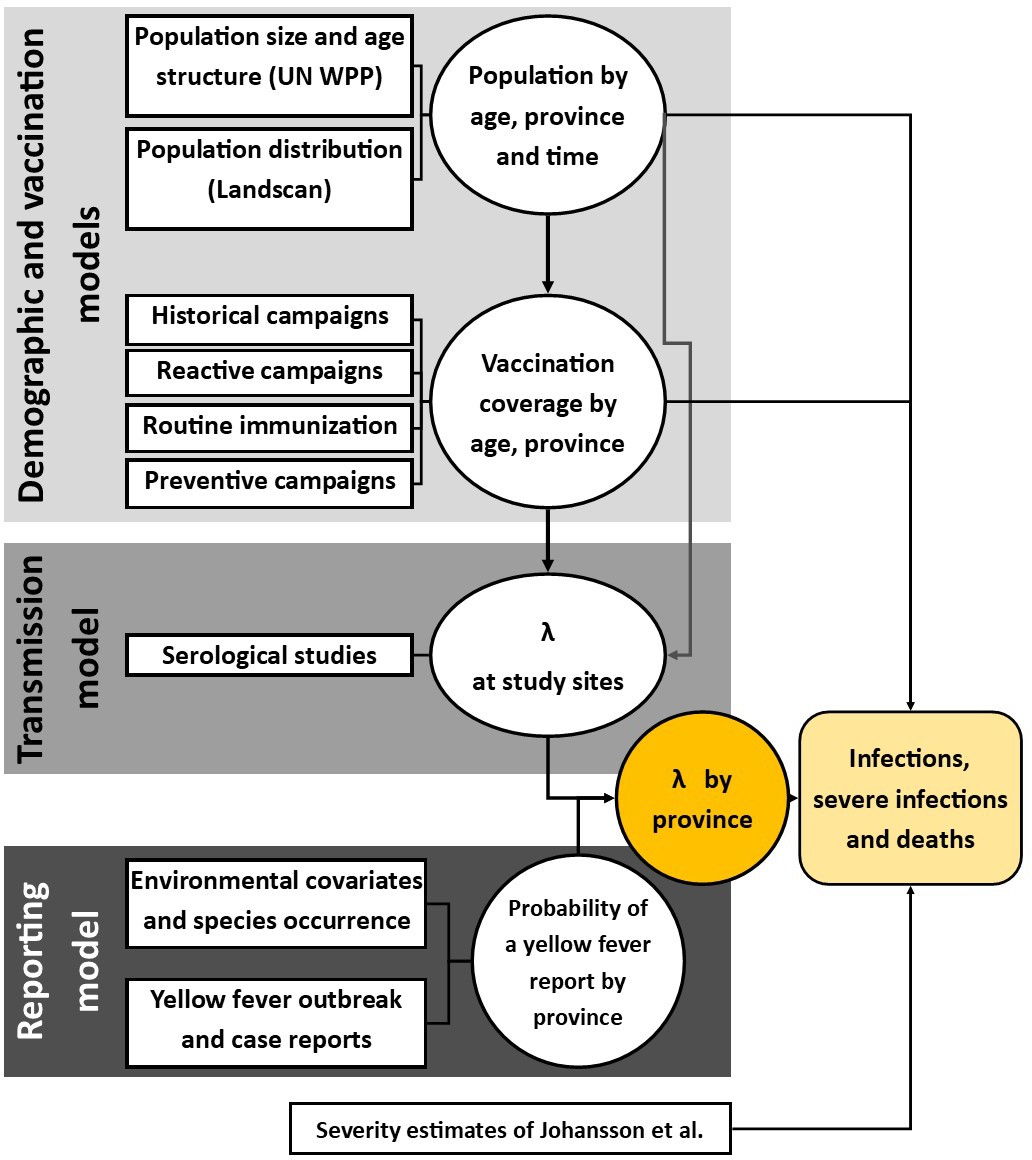
Diagram of models and data sources where denotes the force of infection.
Circles denote a product of calculation or inference; square boxes denote data sources. Adapted from Gaythorpe et al., 2019.
Figure 3 with 4 supplements
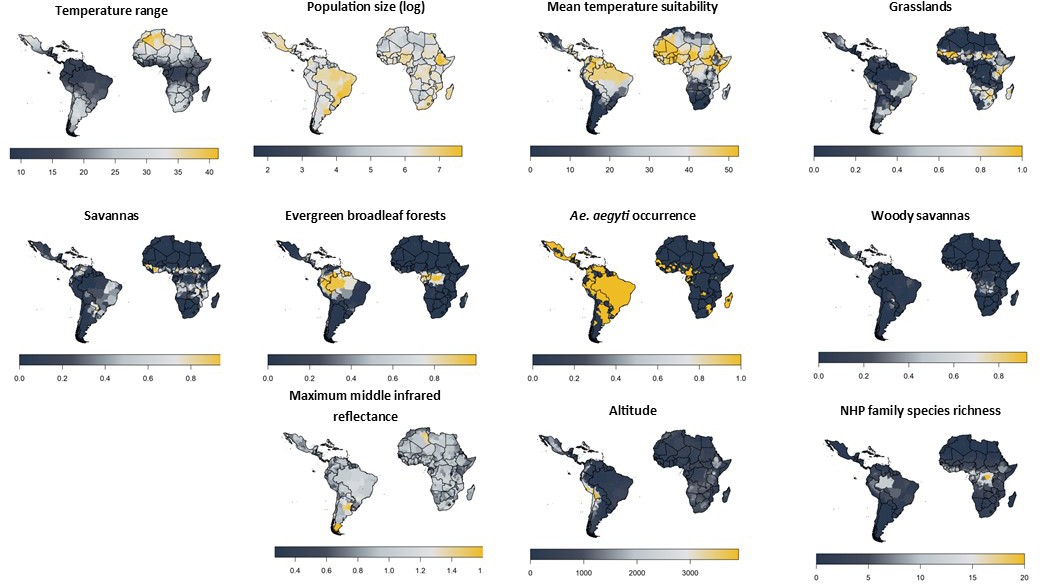
Included model covariates.
Species richness is the sum of all NHP species present per province from families listed in Table 1 and will vary as families are included/excluded. See Figure 3—figure supplement 1–4 for trace plots of all parameters.
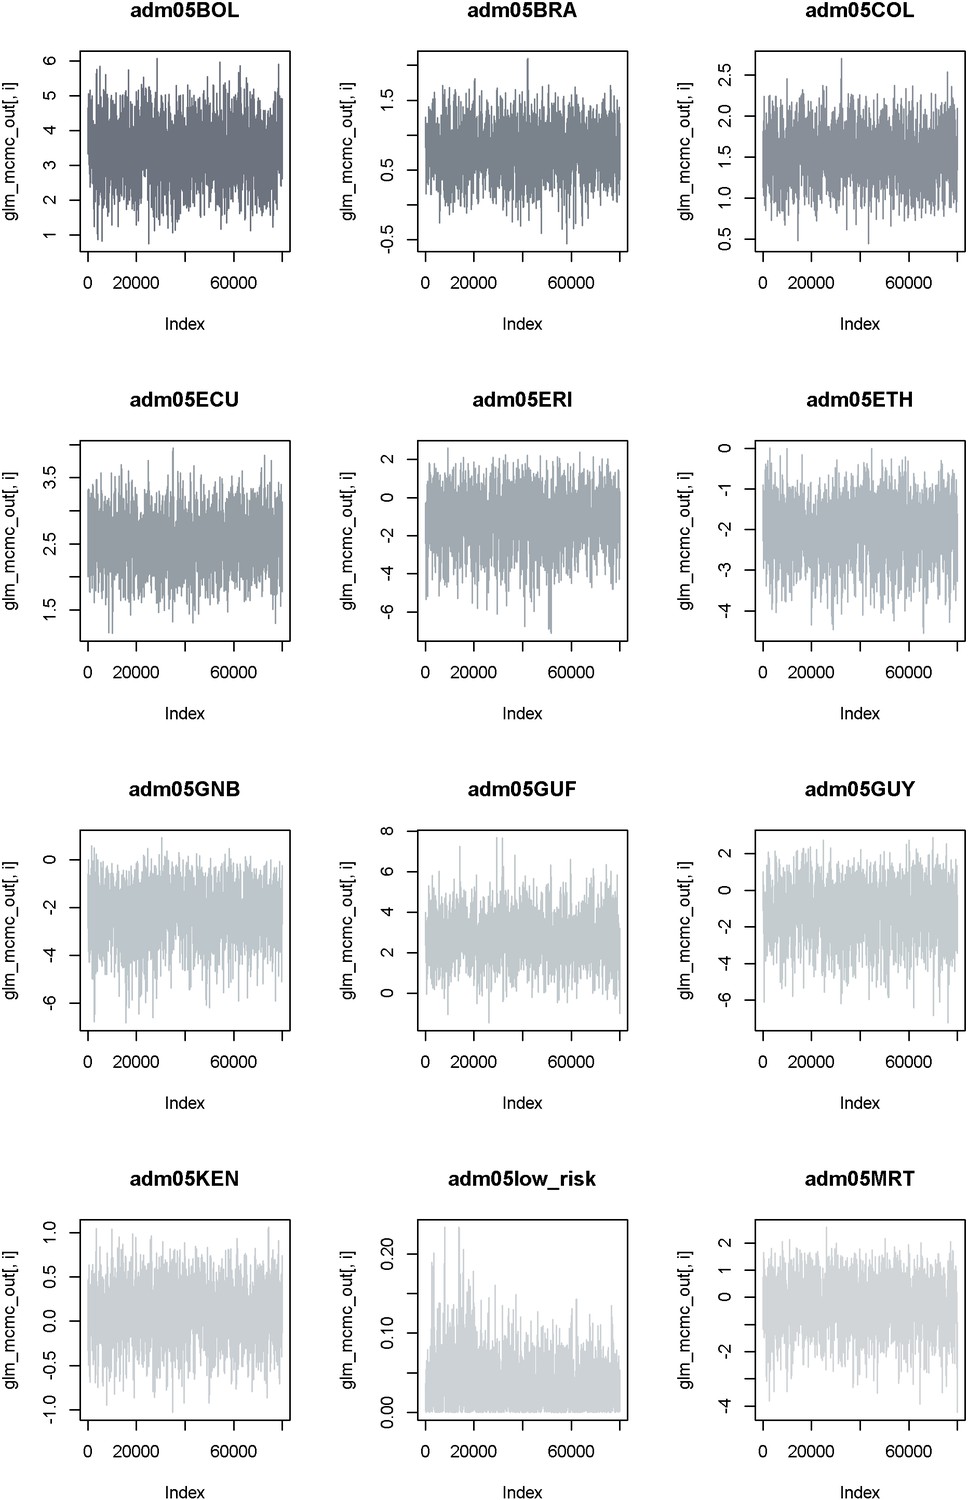
Figure 3—figure supplement 1
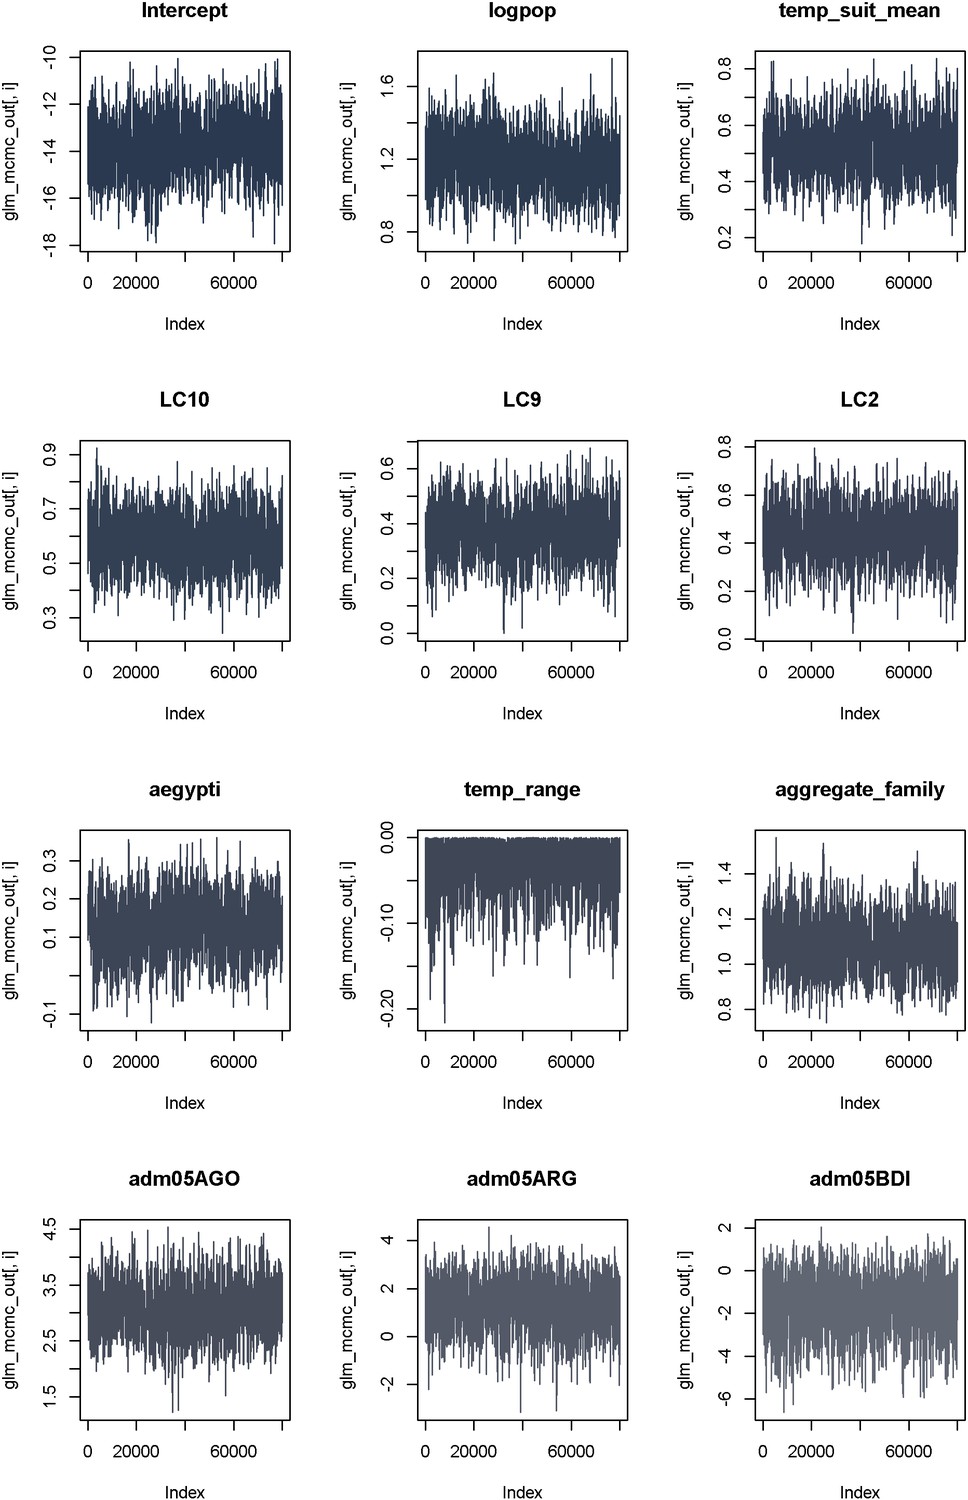
Trace plots from estimation of model variant 17 as an example of convergence.
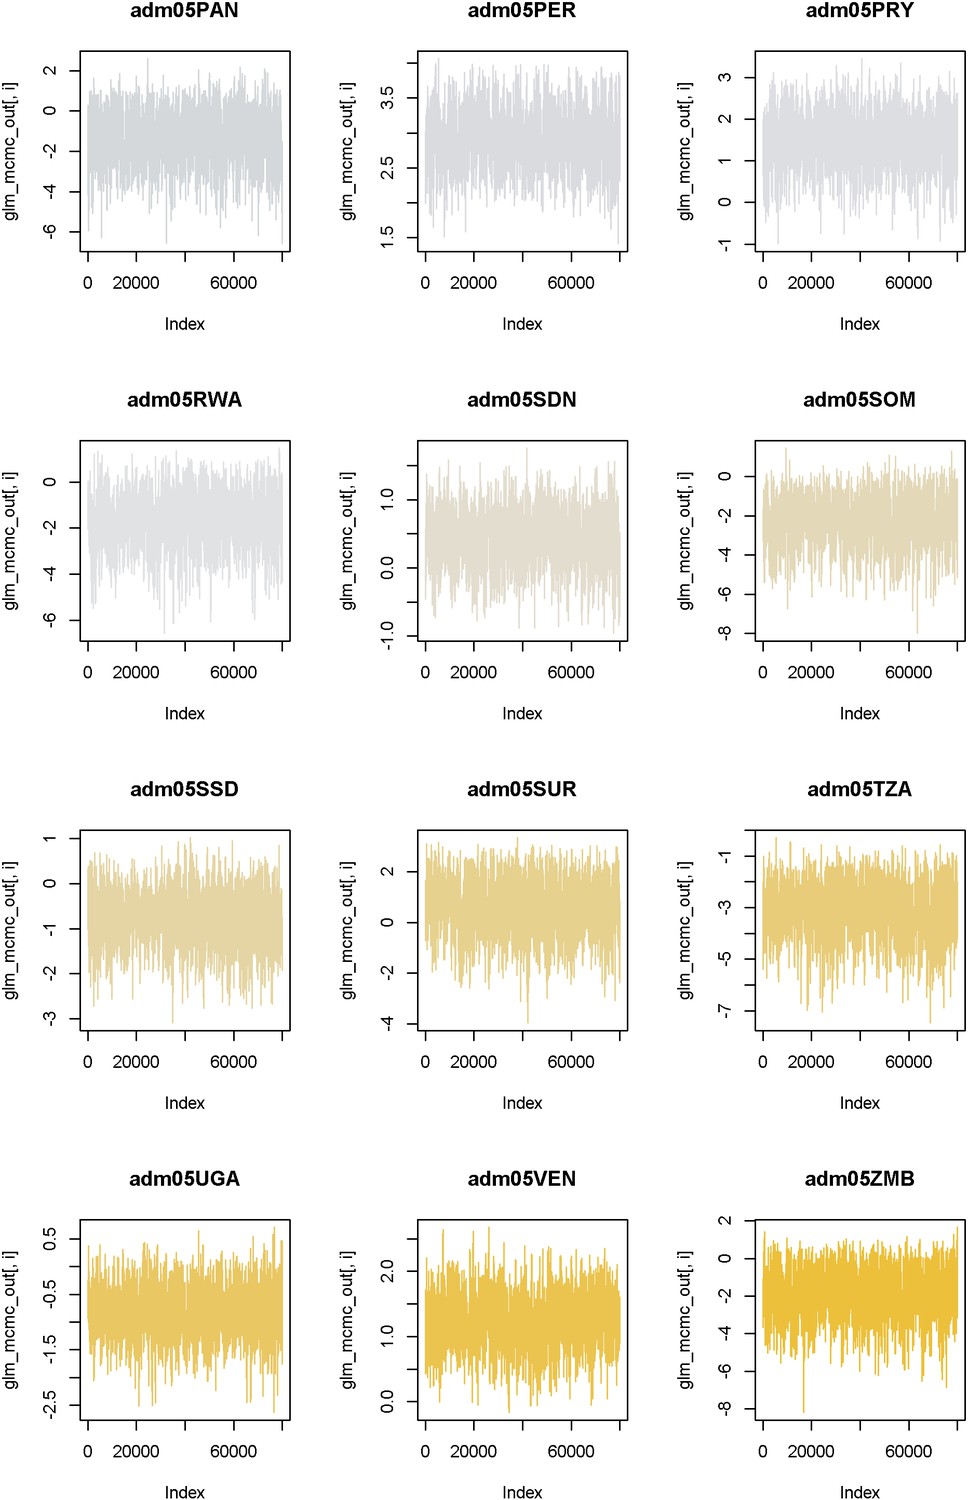
Figure 3—figure supplement 2
Trace plots from estimation of model variant 17 as an example of convergence.
Figure 3—figure supplement 3
Trace plots from estimation of model variant 17 as an example of convergence.
Figure 3—figure supplement 4

Trace plots from estimation of model variant 17 as an example of convergence.
Figure 4

Posterior predicted area under the curve (AUC) for all model variants.
The AUC are calculated for 500 samples from the posterior of each model variant.
Figure 5
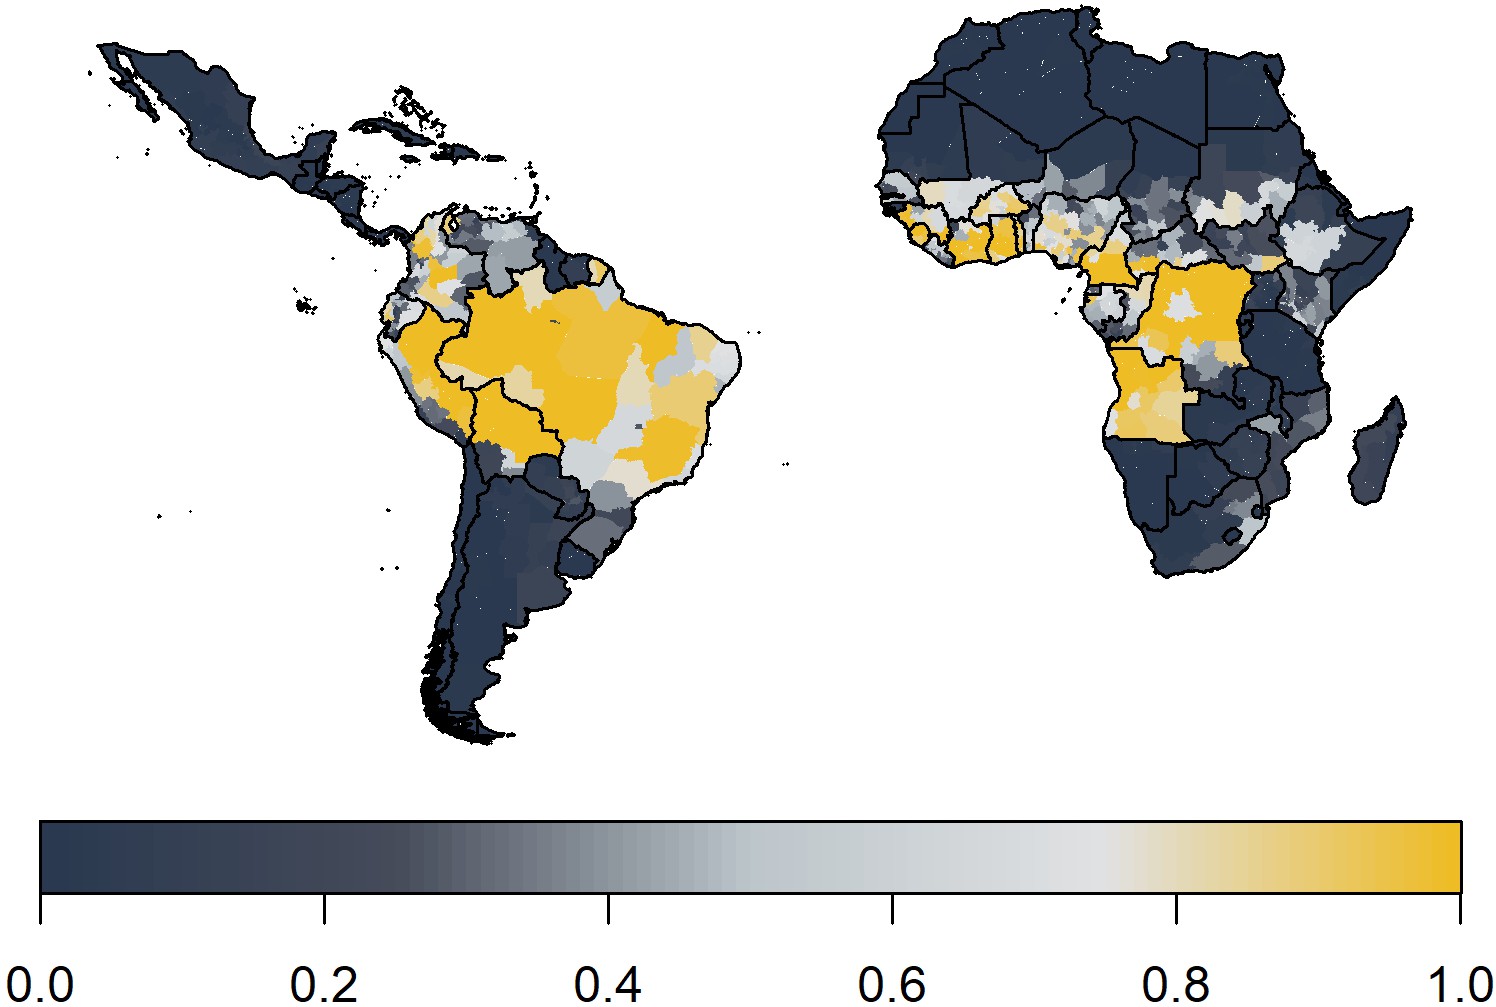
Median posterior predicted probability of a yellow fever report from ensemble predictions of the 20 best GLMs.
This applies over the observation period 1984–2019.
Figure 6 with 2 supplements
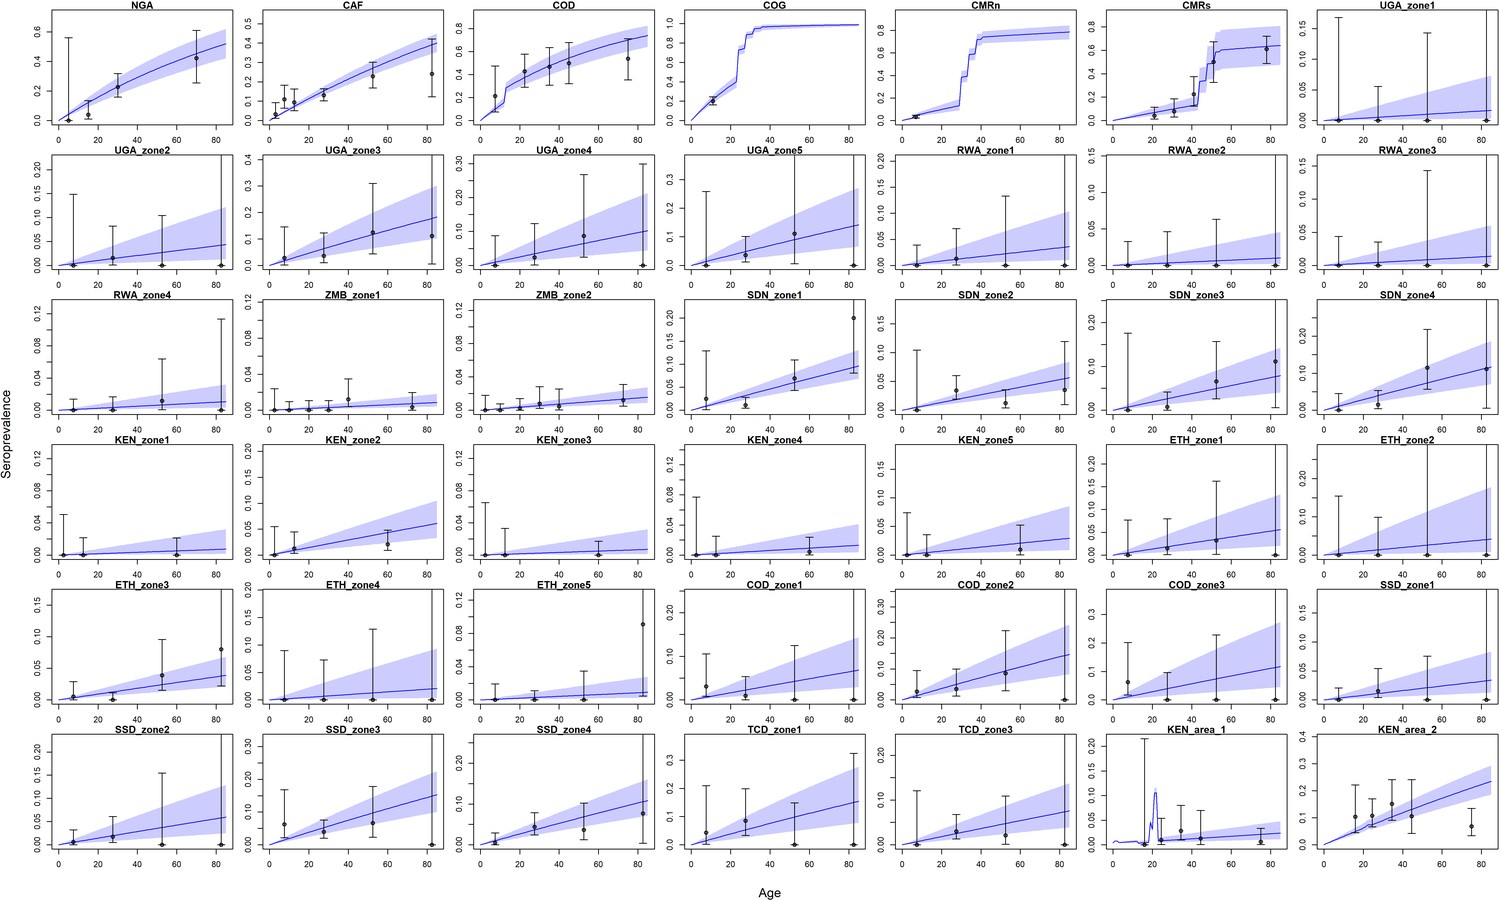
Seroprevalence predictions for each serological survey.
Central blue line indicates median posterior predicted seroprevalence; blue area indicates 95% CrI. Dots indicate the data with error bar representing binomial confidence intervals. Countries are named by their ISO code with different ecological zones indexed ‘zone x’. See Figure 6—figure supplement 1 for posterior distribution of vaccine efficacy and vaccine factor for CMRs; see Figure 6—figure supplement 2 for comparison of force of infection estimates under different prior distributions.
Figure 6—figure supplement 1
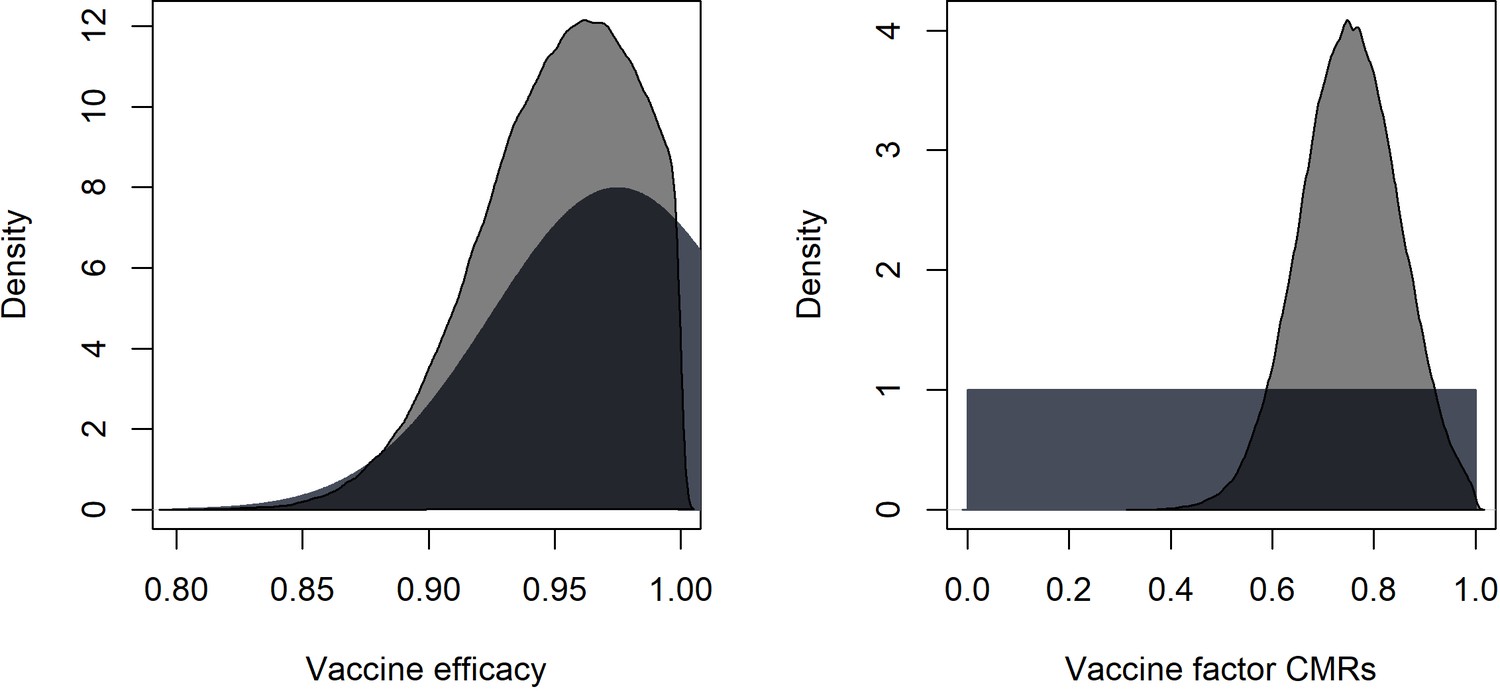
Prior and posterior distributions for vaccine efficacy and vaccine factor for CMRs.
Figure 6—figure supplement 2
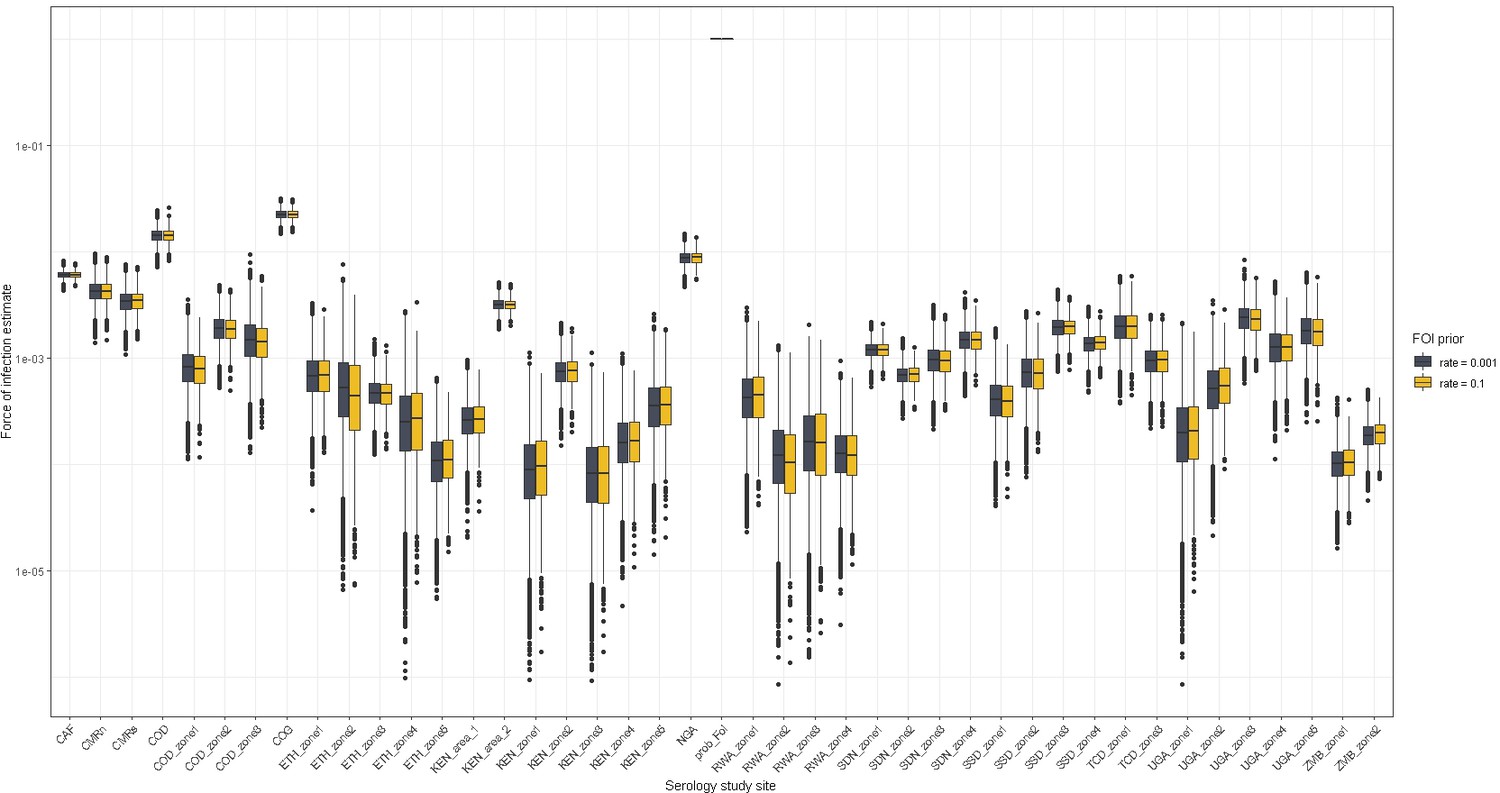
Comparison of force of infection estimates for the serological study sites using two prior formulations.
The first, used throughout the manuscript, is exponential with rate = 0.001. The comparitor is exponential with rate = 0.1.
Figure 7 with 1 supplement
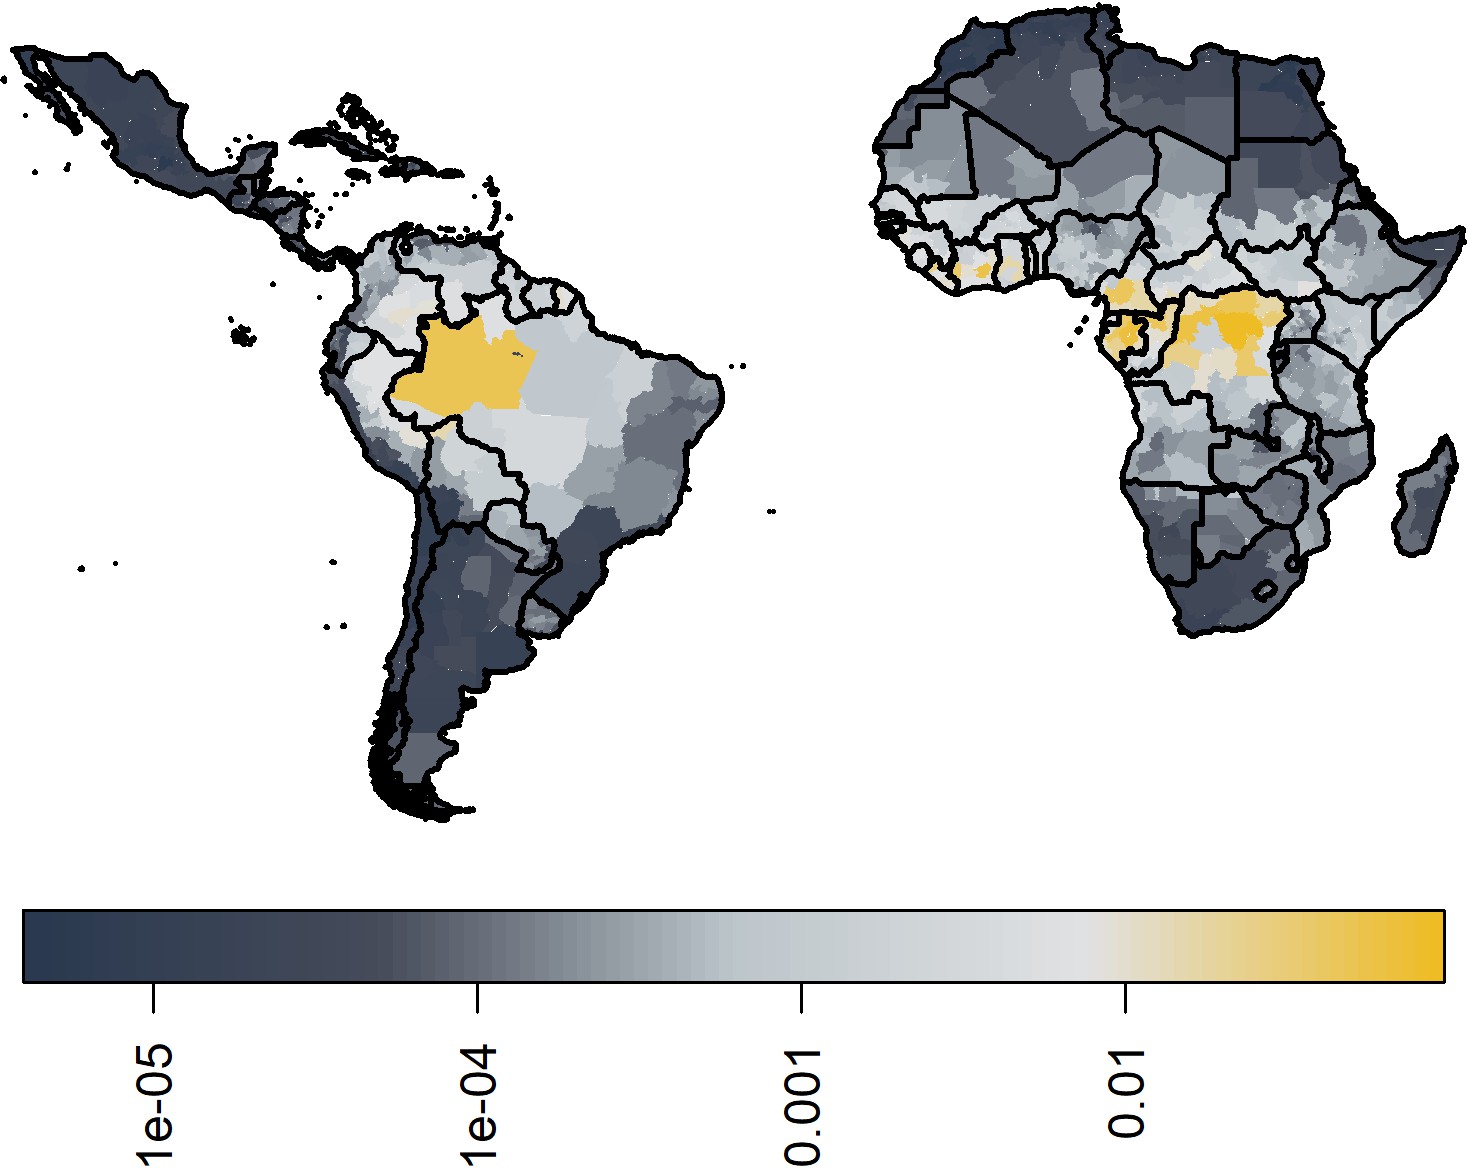
Median posterior predicted force of infection from ensemble predictions of the 20 best GLMs.
Force of infections are assumed to be time invariant as such, these do not correspond to a particular year. See Figure 6—figure supplement 1 for coefficient of variation.
Figure 7—figure supplement 1
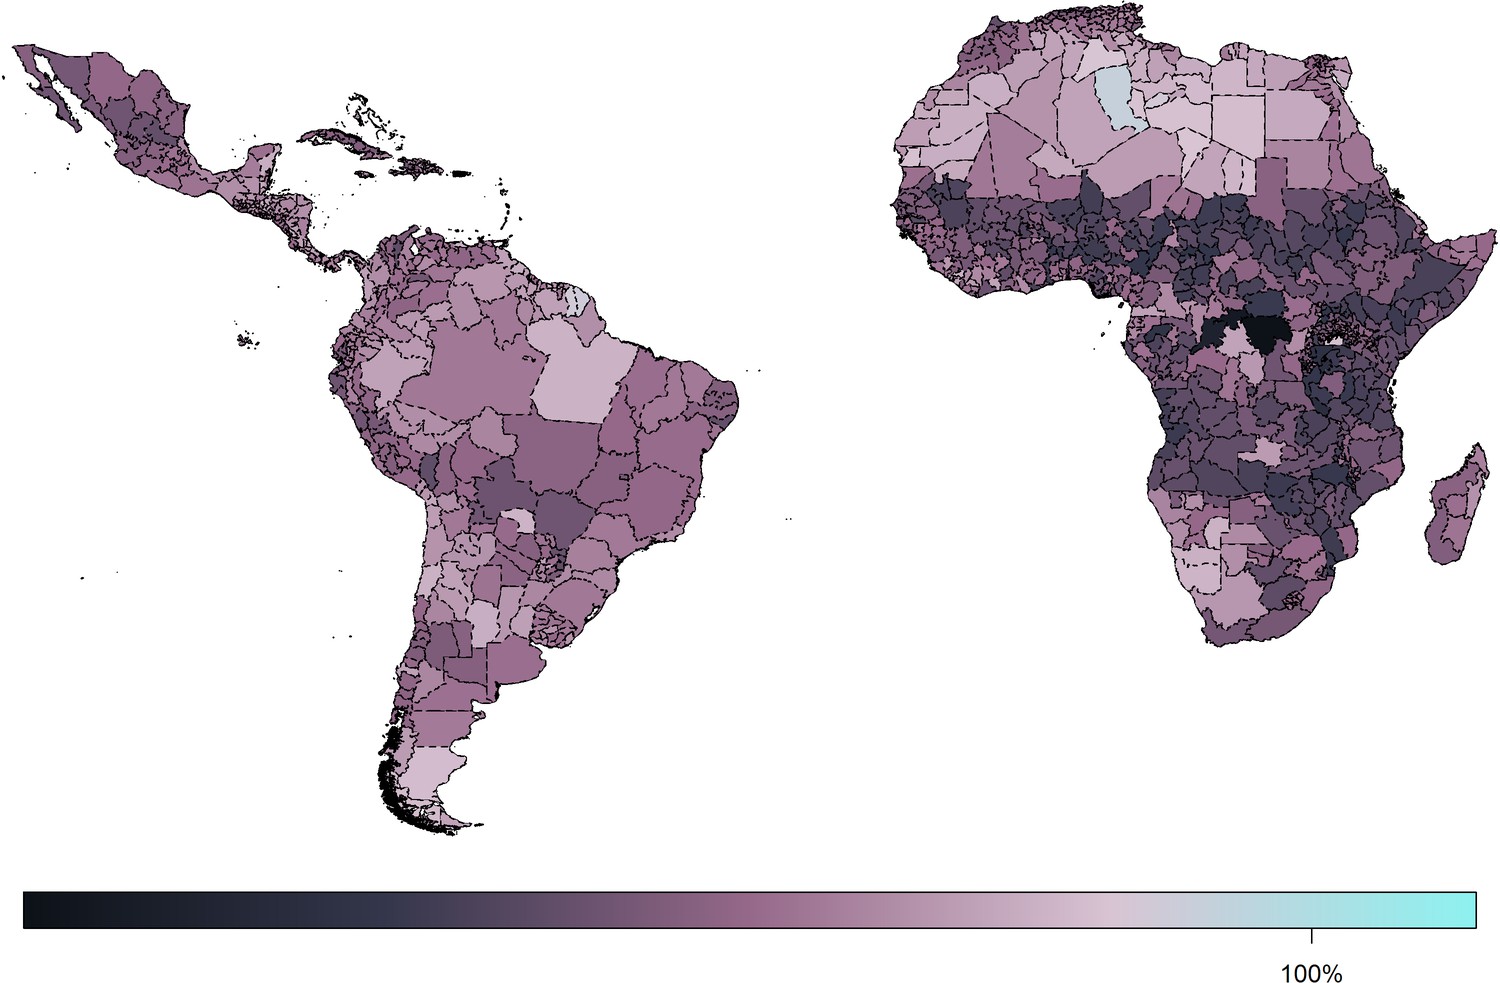
Coefficient of variation in the force of infection estimates between 100 samples of each of the 20 best models.
Figure 8
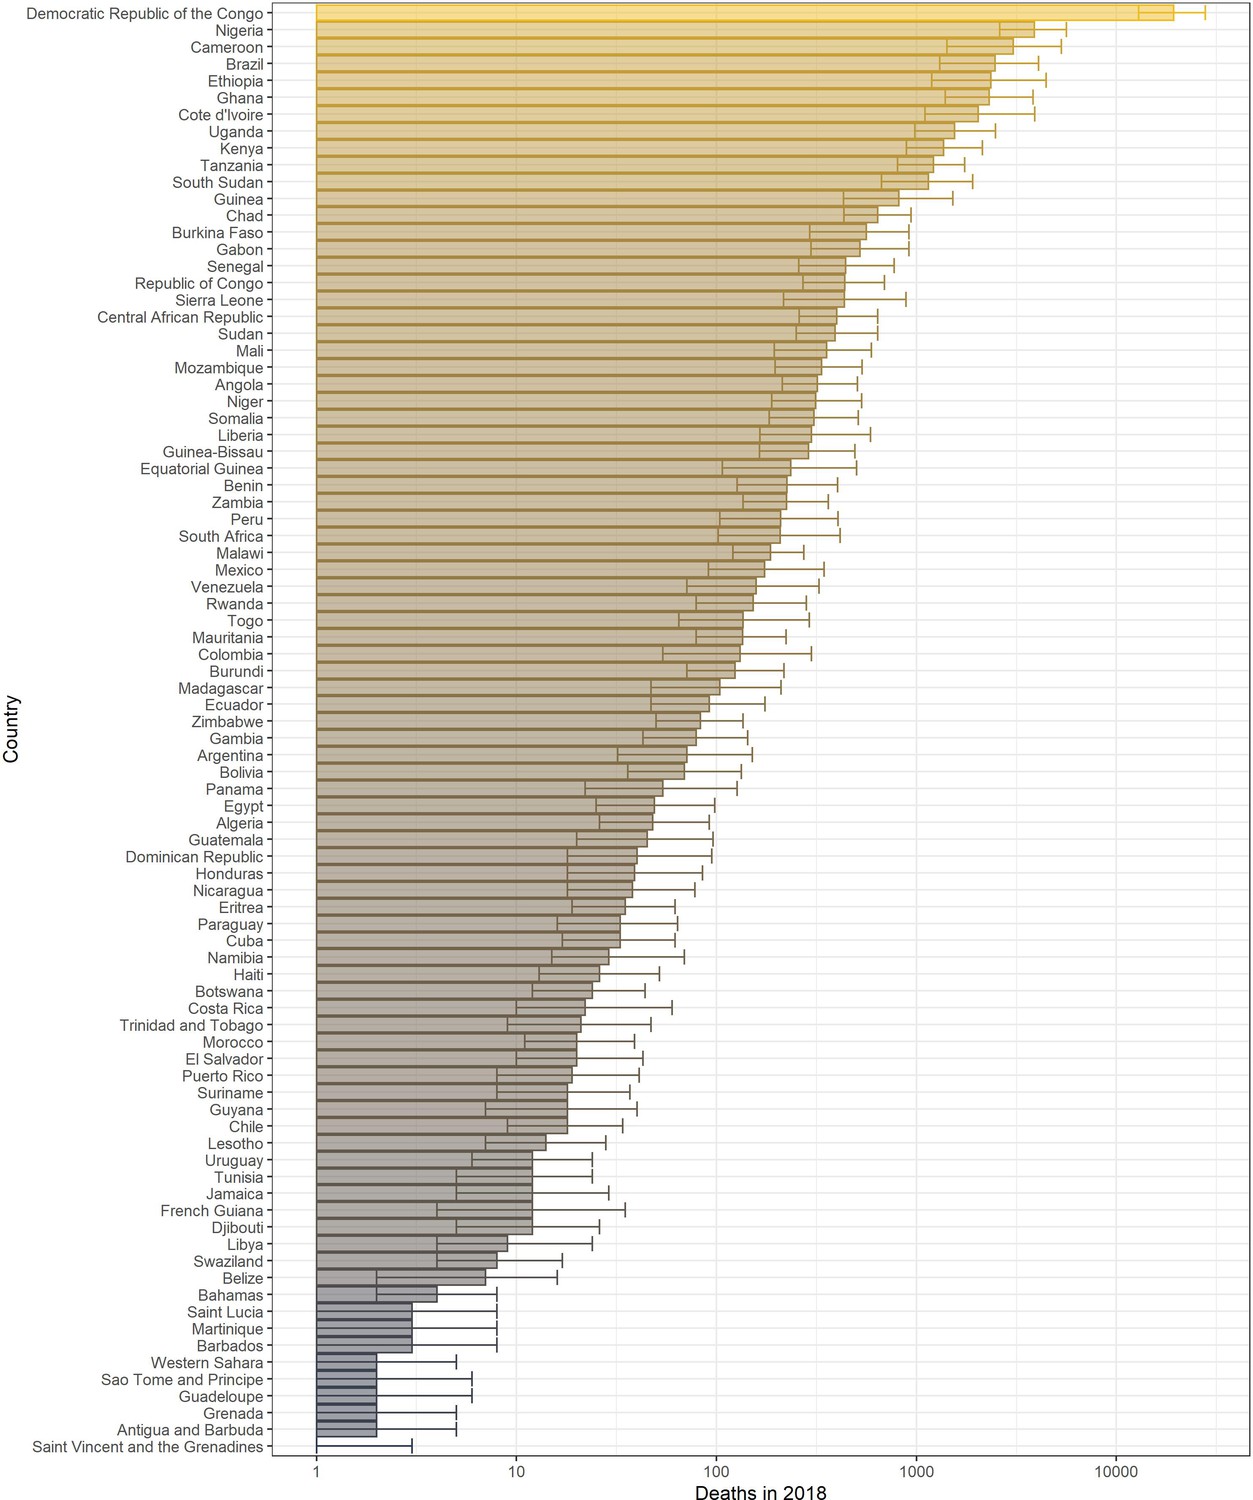
Posterior predicted potential deaths per country in 2018 from the ensemble model projections.
Figure 9 with 1 supplement
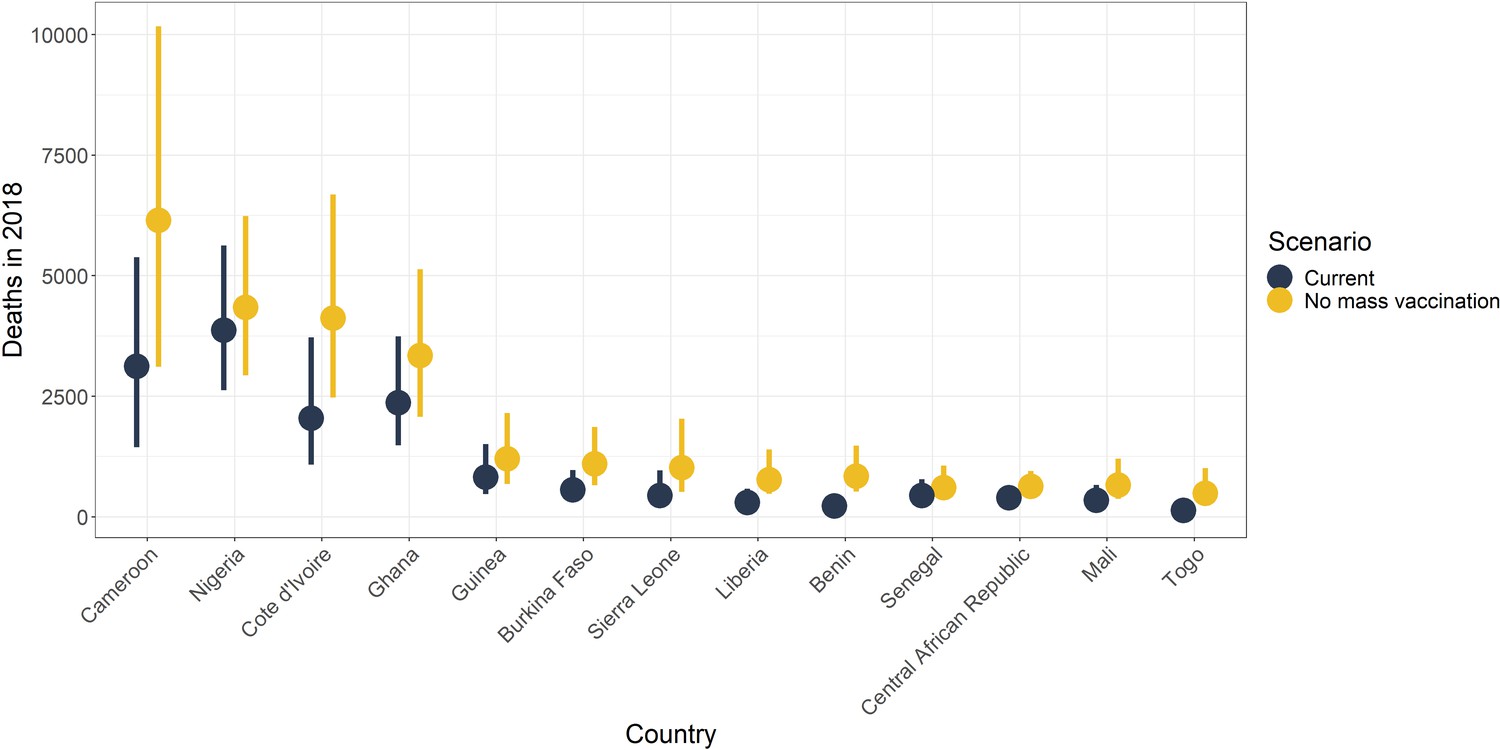
Median posterior predicted deaths averted for 2018 by country.
Yellow represents the number of deaths without mass vaccination campaigns since 2006, and black represents deaths with current vaccination coverage levels. The points denote median and the line shows the 95% credible interval. See Figure 9—figure supplement 1 for results in 2013.
Figure 9—figure supplement 1
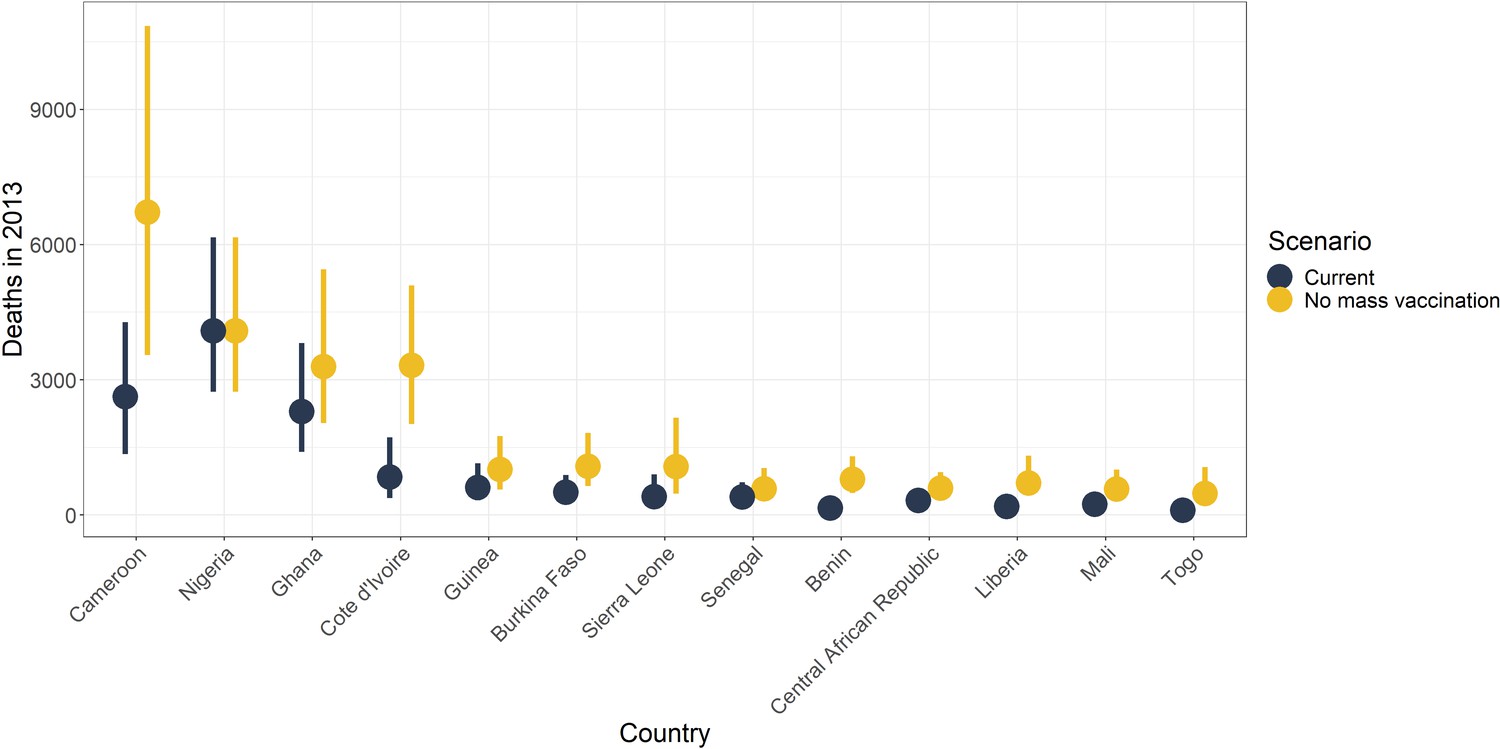
Median posterior predicted deaths averted for 2013 by country.
Yellow represents the number of deaths without mass vaccination campaigns since 2006, and black represents deaths with current vaccination coverage levels. The mid line denotes median, and the box range shows the 95% credible interval.
Tables
Table 1
Composition of the 20 best-fitting generalised linear models of yellow fever reports.
Surveillance quality is also included in all models. If an entry is 1, that covariate is included, if an entry is 0, that covariate is not included. Abbreviations used: MIR = middle infrared reflectance, Temp. = temperature., occ. = occurrence.
| Model | Cercopithecidae occ. | Cebidae occ. | Population (log) | Temp. suitability (mean) | Grasslands | Savanna | Evergreen broadleaf forests | Ae. aegypti occ. | Aotidae occ. | Woody savanna | Temp. range | Maximum MIR | Altitude | BIC |
|---|---|---|---|---|---|---|---|---|---|---|---|---|---|---|
| 1 | 1 | 1 | 1 | 1 | 1 | 0 | 0 | 1 | 1 | 0 | 0 | 1 | 0 | 870 |
| 2 | 1 | 1 | 1 | 1 | 1 | 1 | 1 | 1 | 1 | 1 | 1 | 1 | 1 | 872 |
| 3 | 1 | 1 | 1 | 1 | 1 | 0 | 0 | 1 | 1 | 0 | 0 | 1 | 1 | 872 |
| 4 | 1 | 1 | 1 | 1 | 1 | 1 | 1 | 1 | 1 | 1 | 1 | 0 | 0 | 872 |
| 5 | 1 | 1 | 1 | 1 | 1 | 1 | 1 | 1 | 1 | 1 | 1 | 0 | 1 | 873 |
| 6 | 1 | 1 | 1 | 1 | 1 | 1 | 1 | 1 | 1 | 0 | 0 | 1 | 0 | 873 |
| 7 | 1 | 1 | 1 | 1 | 1 | 1 | 1 | 1 | 1 | 1 | 1 | 1 | 0 | 873 |
| 8 | 1 | 1 | 1 | 1 | 1 | 1 | 1 | 1 | 1 | 0 | 0 | 1 | 1 | 873 |
| 9 | 1 | 1 | 1 | 1 | 1 | 1 | 0 | 1 | 1 | 0 | 0 | 1 | 0 | 873 |
| 10 | 1 | 1 | 1 | 1 | 1 | 1 | 1 | 1 | 1 | 1 | 0 | 1 | 1 | 874 |
| 11 | 1 | 1 | 1 | 1 | 1 | 1 | 1 | 1 | 1 | 0 | 1 | 1 | 0 | 874 |
| 12 | 1 | 1 | 1 | 1 | 1 | 1 | 1 | 1 | 1 | 0 | 1 | 1 | 1 | 874 |
| 13 | 1 | 1 | 1 | 1 | 1 | 1 | 1 | 1 | 1 | 1 | 0 | 1 | 0 | 875 |
| 14 | 1 | 1 | 1 | 1 | 1 | 1 | 1 | 0 | 1 | 0 | 0 | 1 | 0 | 875 |
| 15 | 1 | 1 | 1 | 1 | 1 | 0 | 0 | 0 | 1 | 0 | 0 | 1 | 0 | 875 |
| 16 | 1 | 1 | 1 | 1 | 1 | 0 | 0 | 1 | 1 | 1 | 0 | 1 | 0 | 875 |
| 17 | 1 | 1 | 1 | 1 | 1 | 1 | 1 | 1 | 1 | 0 | 1 | 0 | 0 | 875 |
| 18 | 1 | 1 | 1 | 1 | 1 | 0 | 0 | 1 | 1 | 0 | 1 | 1 | 0 | 875 |
| 19 | 1 | 1 | 1 | 1 | 1 | 1 | 0 | 1 | 1 | 0 | 0 | 1 | 1 | 875 |
| 20 | 1 | 1 | 1 | 1 | 1 | 1 | 1 | 0 | 1 | 1 | 1 | 0 | 0 | 876 |
Table 2
Temperature suitability index parameter values.
The subscripts , and m represent the positive rate constant, minimum temperature, and maximum temperature for each thermal response model. Parameter a corresponds to bite rate, corresponds to extrinsic incubation period, and µ corresponds to mosquito mortality.
| ac | |||||||||
|---|---|---|---|---|---|---|---|---|---|
| Value | 2.72e-4 | 2.24 | 40.13 | −0.75 | 12.71 | 38.05 | 1.36e-4 | 17.33 | 42.20 |
Table 3
Potential deaths and severe infections per year in Africa and South America from ensemble model projections.
| Continent | Year | Severe infections, median | Severe infections, 95% CrI low | Severe infections, 95% CrI high | Deaths, median | Deaths, 95% CrI low | Deaths, 95% CrI high |
|---|---|---|---|---|---|---|---|
| Africa | 1995 | 102,972 | 62,162 | 160,700 | 48,474 | 28,672 | 76,998 |
| Africa | 2005 | 122,101 | 74,915 | 192,773 | 57,182 | 34,446 | 90,736 |
| Africa | 2013 | 98,148 | 62,083 | 150,953 | 45,973 | 28,680 | 72,380 |
| Africa | 2018 | 100,952 | 63,001 | 158,362 | 47,318 | 29,162 | 74,981 |
| Americas | 1995 | 14,349 | 6528 | 26,016 | 6652 | 3026 | 12,577 |
| Americas | 2005 | 10,254 | 4988 | 18,436 | 4827 | 2265 | 8779 |
| Americas | 2013 | 8559 | 4264 | 15,043 | 3999 | 1969 | 7162 |
| Americas | 2018 | 8331 | 4306 | 14,608 | 3883 | 1971 | 7033 |
Table 4
Deaths averted per year due to mass vaccination activites occurring from 2006 onwards in Africa.
| Year | Median deaths averted | Deaths averted, 95% CrI low | Deaths averted, 95% CrI high |
|---|---|---|---|
| 2013 | 11,414 | 6400 | 19,369 |
| 2018 | 10,140 | 5781 | 17,307 |
Additional files
Download links
A two-part list of links to download the article, or parts of the article, in various formats.
Downloads (link to download the article as PDF)
Open citations (links to open the citations from this article in various online reference manager services)
Cite this article (links to download the citations from this article in formats compatible with various reference manager tools)
The global burden of yellow fever
eLife 10:e64670.
https://doi.org/10.7554/eLife.64670


