An expanding manifold in transmodal regions characterizes adolescent reconfiguration of structural connectome organization
- McConnell Brain Imaging Centre, Montreal Neurological Institute and Hospital, McGill University, Canada
- Department of Data Science, Inha University, Republic of Korea
- Autism Research Centre, Department of Psychiatry, University of Cambridge, United Kingdom
- Brain Mapping Unit, Department of Psychiatry, University of Cambridge, United Kingdom
- Institute of Neuroscience and Medicine (INM-1), Forschungszentrum Jülich, Germany
Figures
Figure 1 with 15 supplements
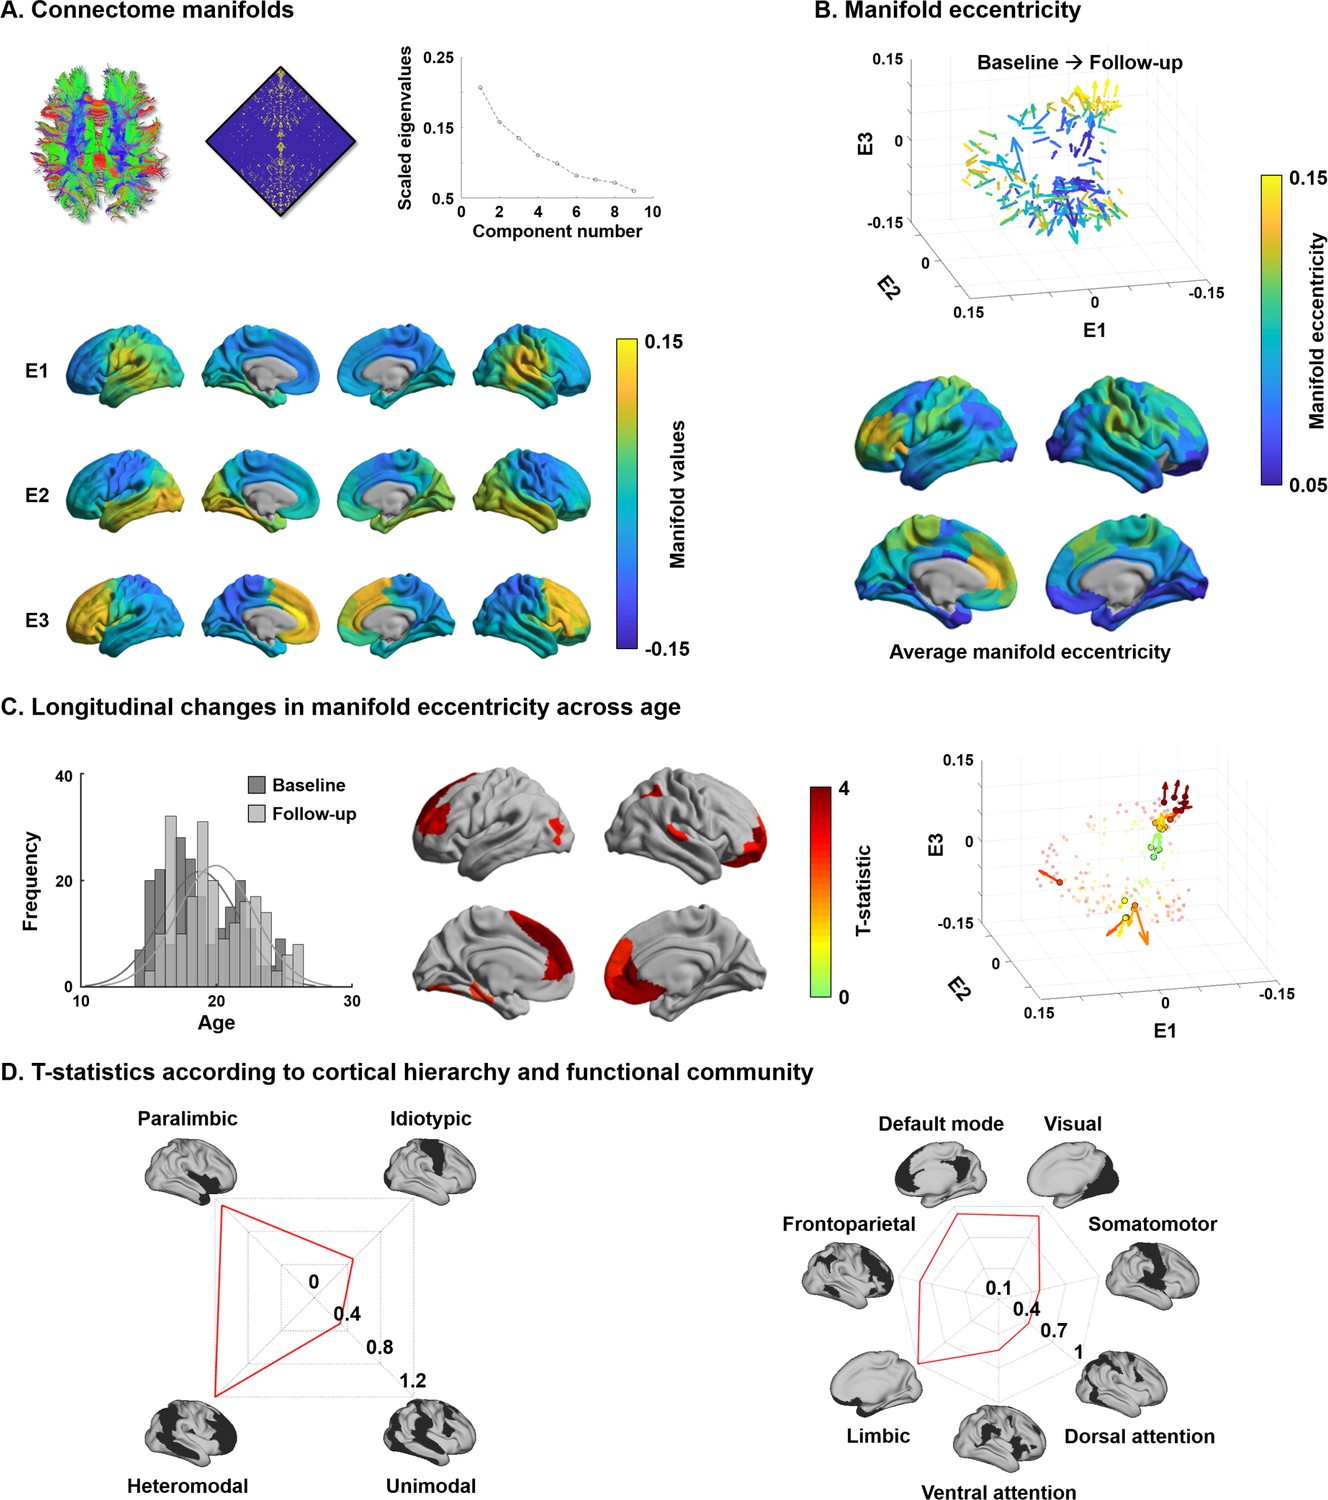
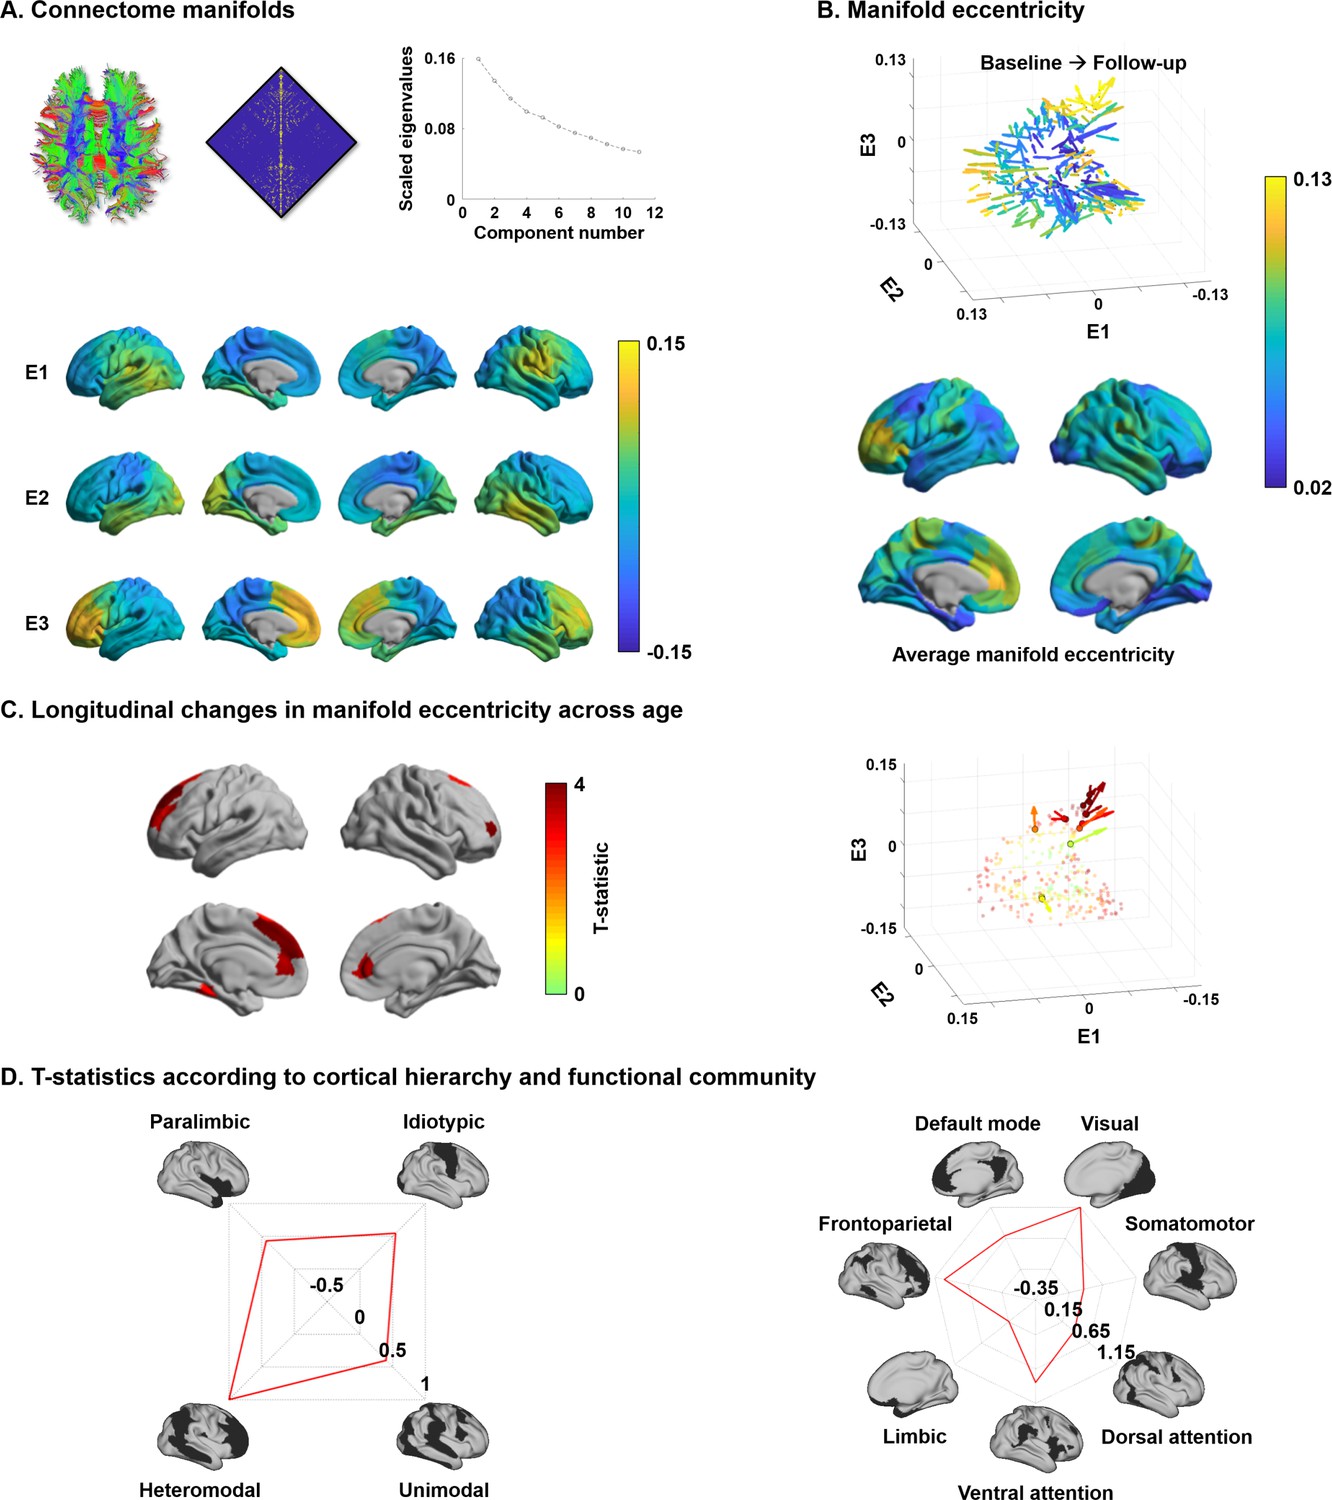
Structural connectome manifolds.
(A) Systematic fiber tracking based on diffusion magnetic resonance imaging generated a cortex-wide structural connectome, which was subjected to diffusion map embedding. As shown in the scree plot, three eigenvectors (E1, E2, E3) accounted for approximately 50% information of connectome data, and each depicted a different gradual transition across the cortical mantle. (B) Manifold eccentricity measured by Euclidean distance between the template center and each data point. Arrows depict average positional change in connectivity space from baseline to follow-up. The color of each arrow represents each brain region mapped on the surface on the bottom. (C) The histogram represents age distribution of all subjects at baseline and follow-up. The colors on brain surfaces indicate t-statistics of regions showing significant longitudinal changes in manifold eccentricity across age, following multiple comparisons correction with a false discovery rate < 0.05. Datapoint colors in the scatter plot represent t-statistics. Identified regions are represented with arrows that originate from baseline to follow-up. (D) Stratification of age-related changes in manifold eccentricity according to prior models of cortical hierarchy (Mesulam, 1998) and functional magnetic resonance imaging communities (Yeo et al., 2011).
-
Figure 1—source data 1
Source files for connectome manifolds and age-related changes in manifold eccentricity.
- https://cdn.elifesciences.org/articles/64694/elife-64694-fig1-data1-v2.xlsx
Figure 1—figure supplement 1
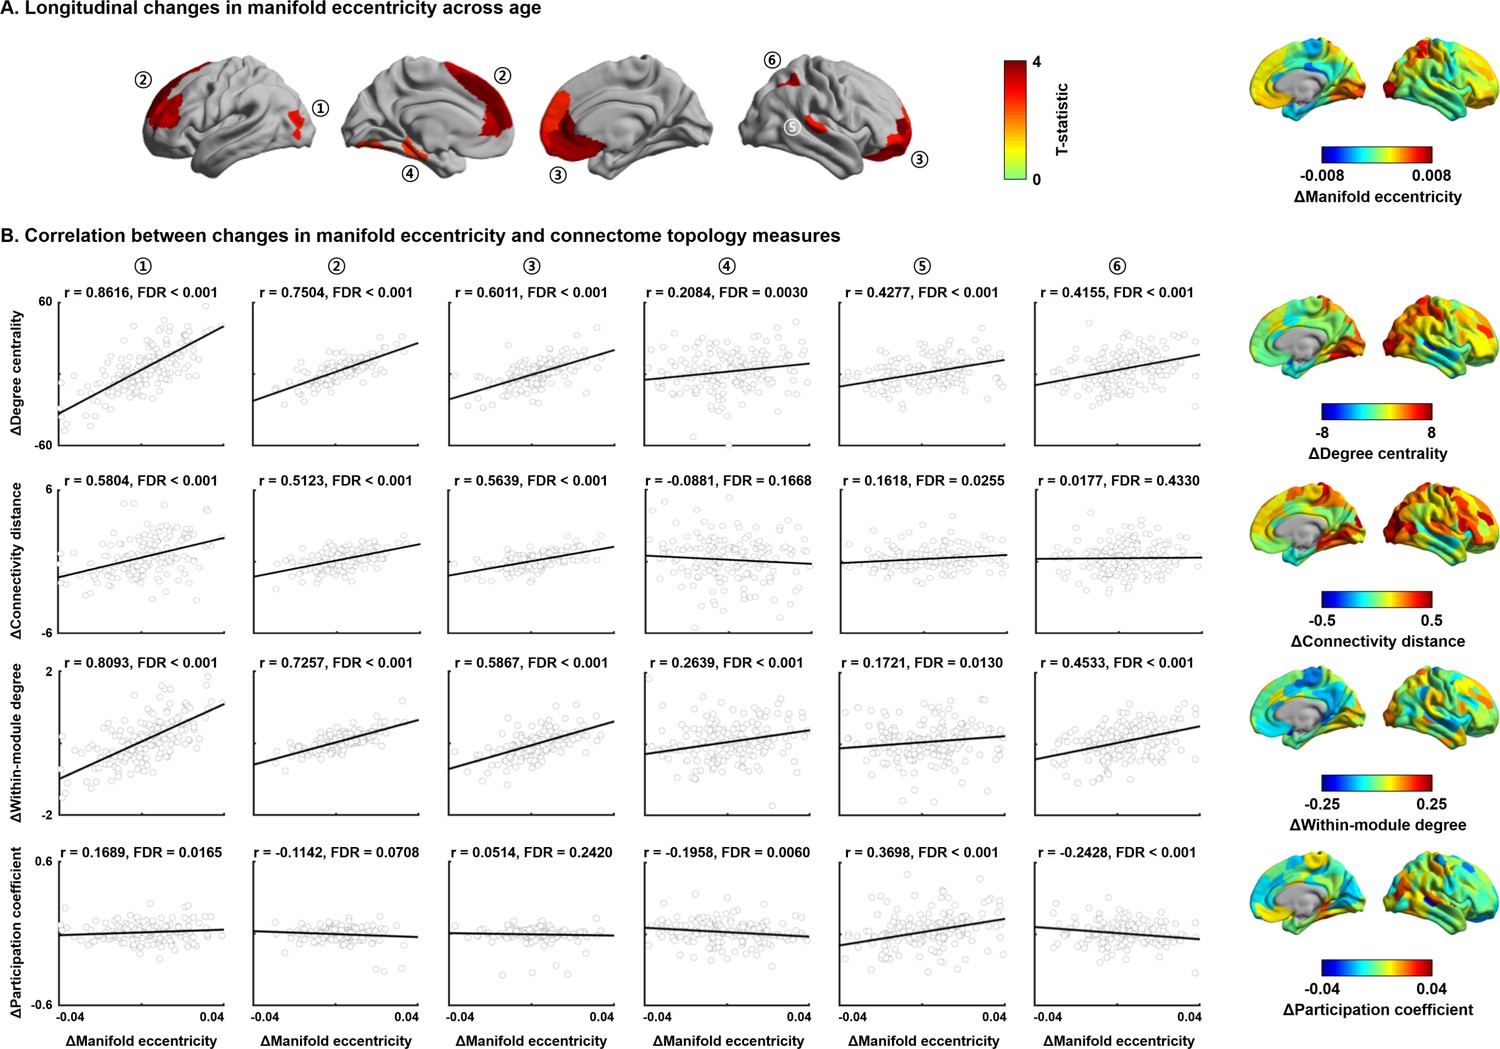
Association between structural connectome manifold and connectome topology measures.
(A) Six clusters defined within the identified regions that showed significant age-related changes in manifold eccentricity (see Figure 1C). (B) Associations between within-subject changes in manifold eccentricity and those of each connectome topology measure. Brain surfaces on the right side represent changes in each measure between baseline and follow-up. Significances were corrected for multiple comparisons using false discovery rate adjustment.
Figure 1—figure supplement 2
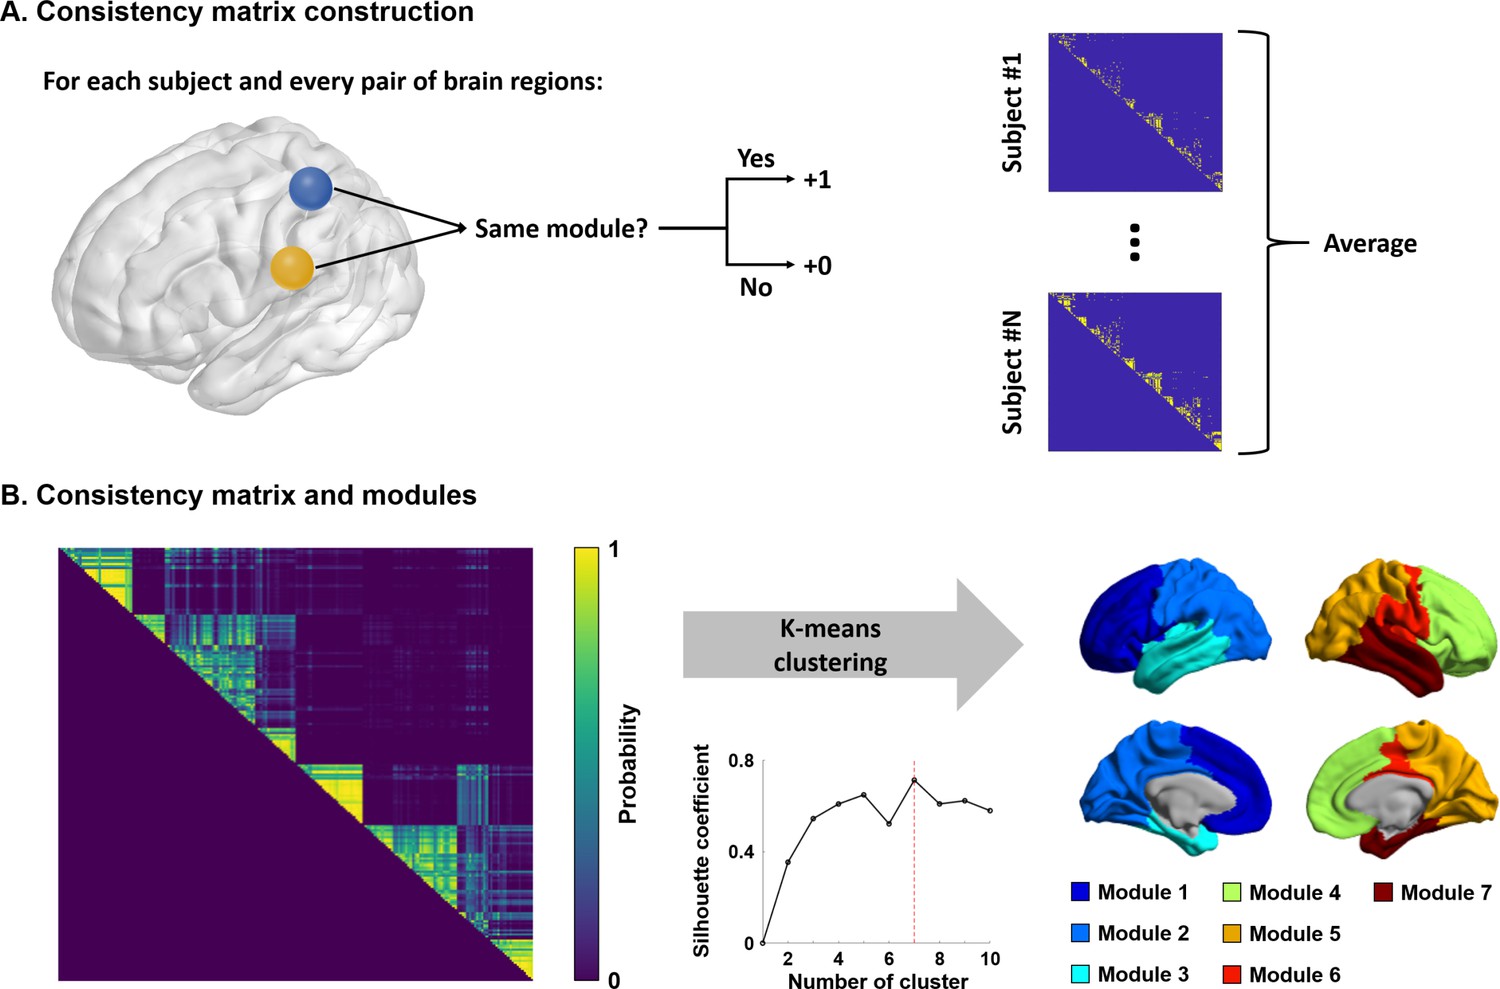
Modular structures.
(A) Pipeline for constructing a connectivity consistency matrix. We constructed individual subject-wise consistency matrices by considering whether two different nodes were involved in the same module. (B) The group-wise consistency matrix was constructed by averaging subject-wise consistency matrices. The k-means clustering with silhouette coefficient was used to define modules. Seven modules on the brain surface are reported on the right side.
Figure 1—figure supplement 3
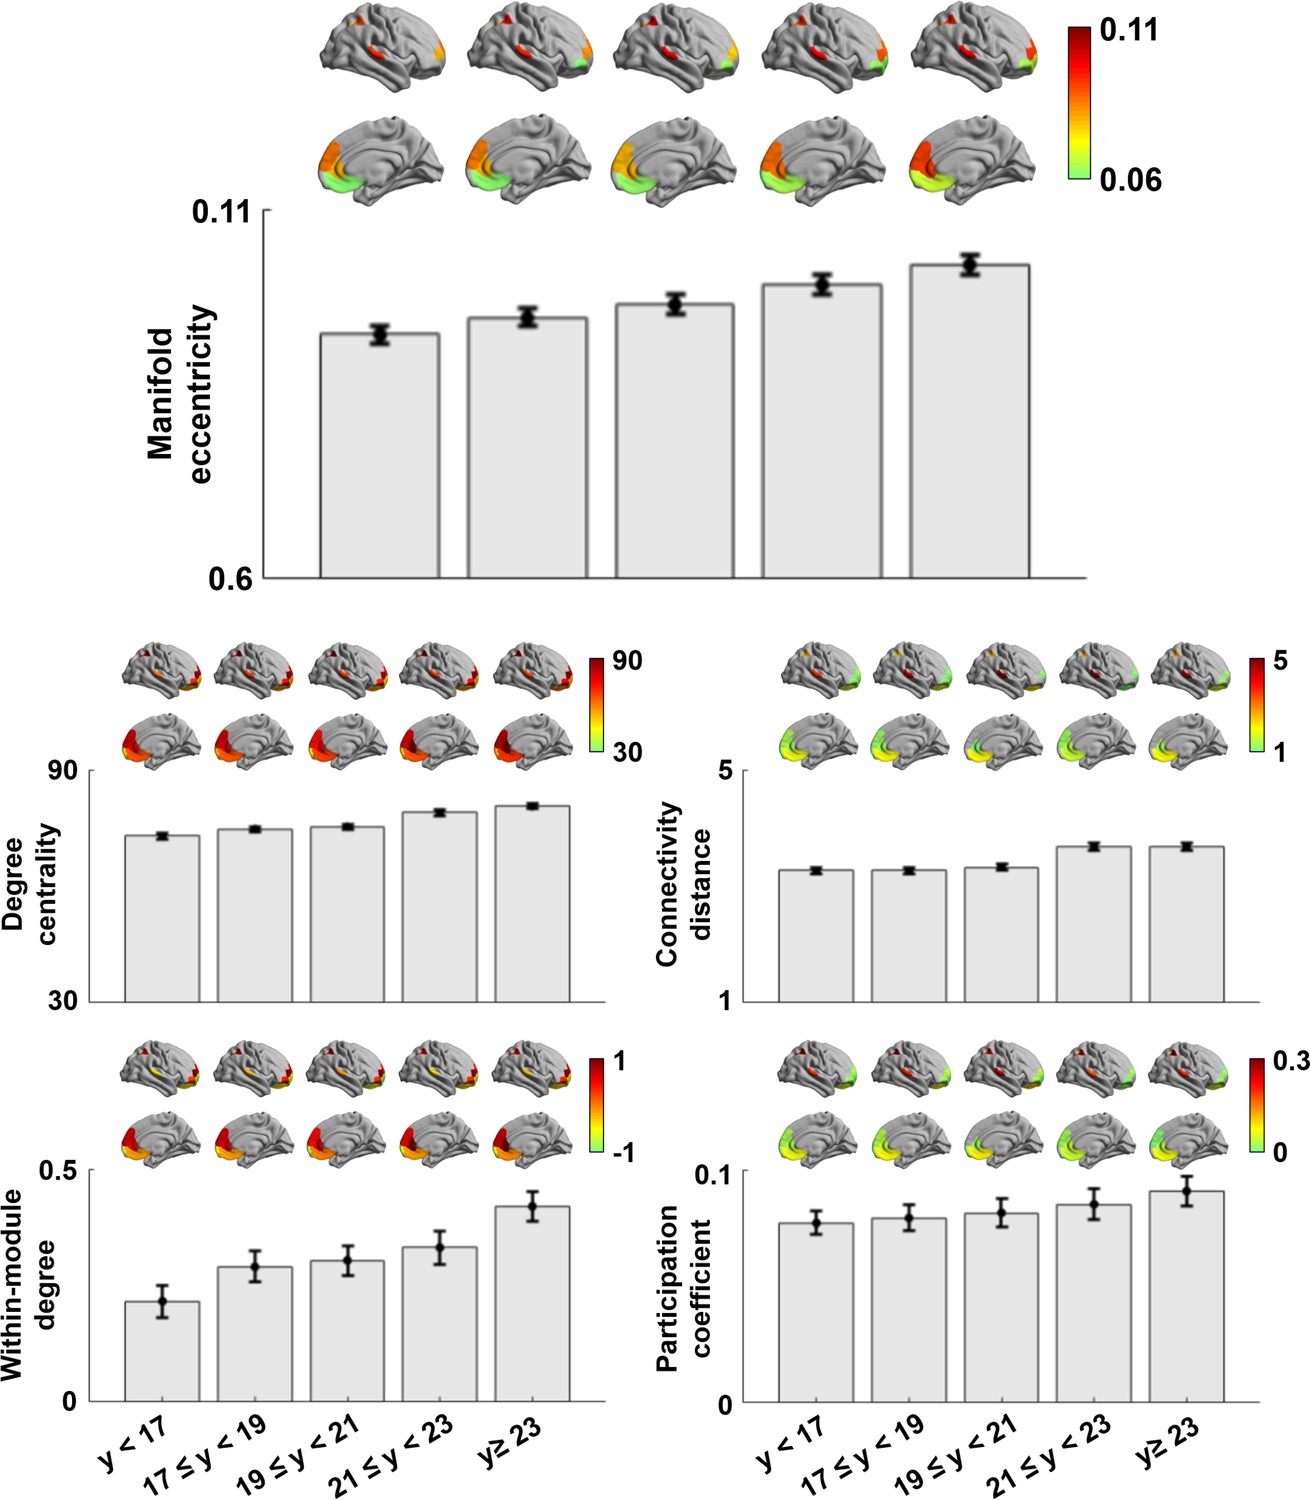
Age-related trends in connectome topology measures.
Age-related changes in manifold eccentricity, degree centrality, connectivity distance, within-module degree, and participation coefficient. y: years.
Figure 1—figure supplement 4
Structural connectome manifolds using Schaefer 300 atlas.
(A–D) Main findings were replicated using a different parcellation scale. For details, see Figure 1.
Figure 1—figure supplement 5
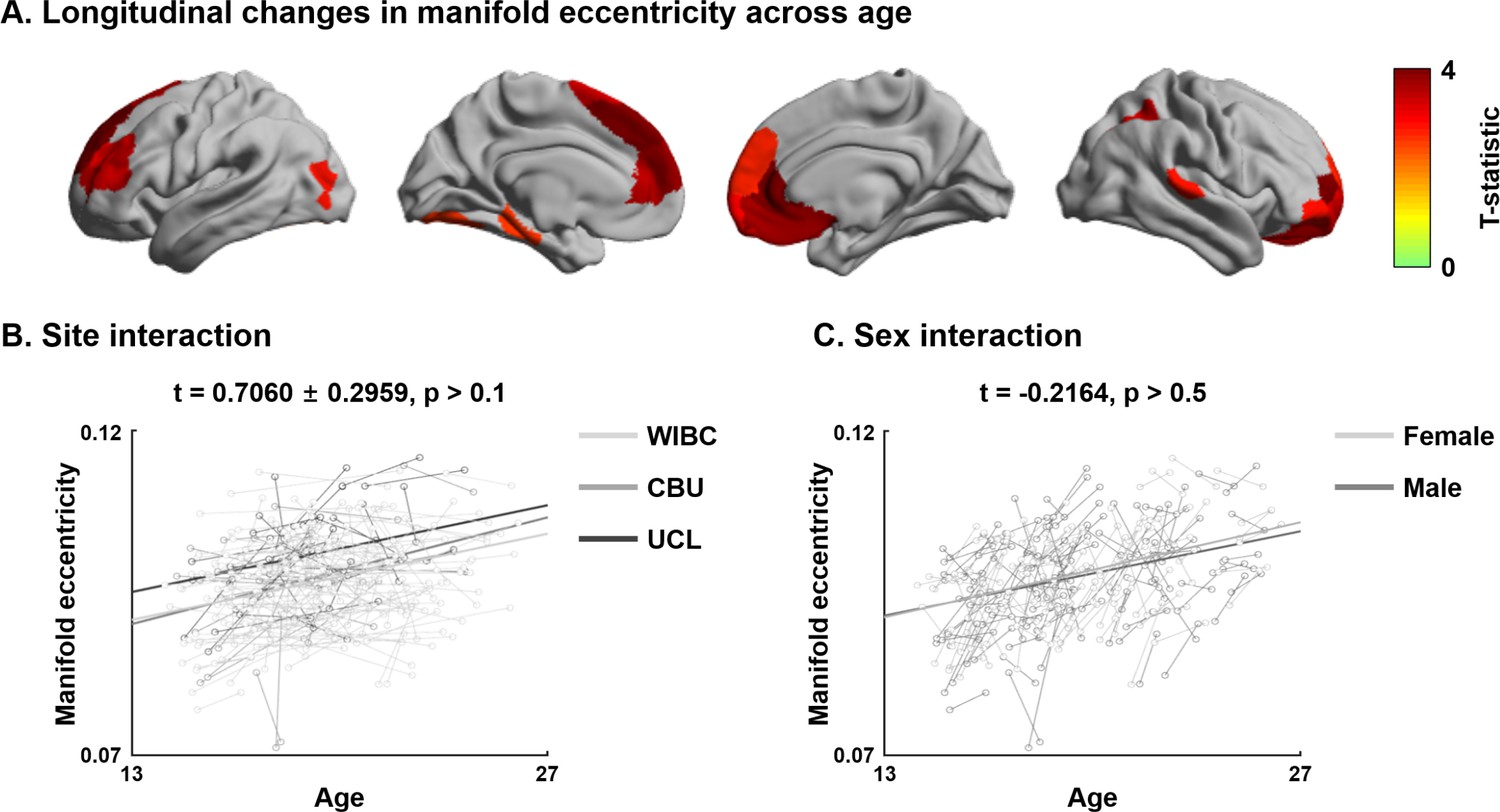
Sensitivity analysis for site and sex.
(A) The t-statistics of identified regions that showed significant age-related changes in manifold eccentricity. (B) Interaction effects of the relationship between age and manifold eccentricity for sites and (C) biological sexes. WIBC: Wolfson Brain Imaging Centre; CBU: MRC Cognition and Brain Sciences Unit; UCL: University College London.
Figure 1—figure supplement 6
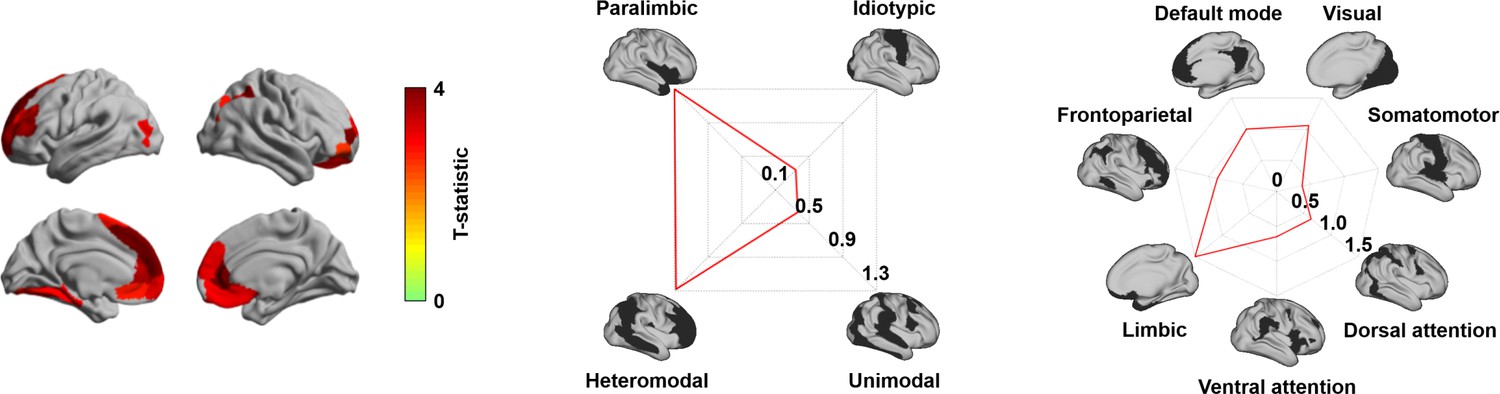
Longitudinal changes in manifold eccentricity, after excluding participants with the lowest correspondence to template manifolds.
The t-statistics of regions showing significant longitudinal changes in manifold eccentricity across age are reported on cortical surfaces. Effects are stratified with respect to levels of cortical hierarchy (Mesulam, 1998) and intrinsic functional communities (Yeo et al., 2011).
Figure 1—figure supplement 7
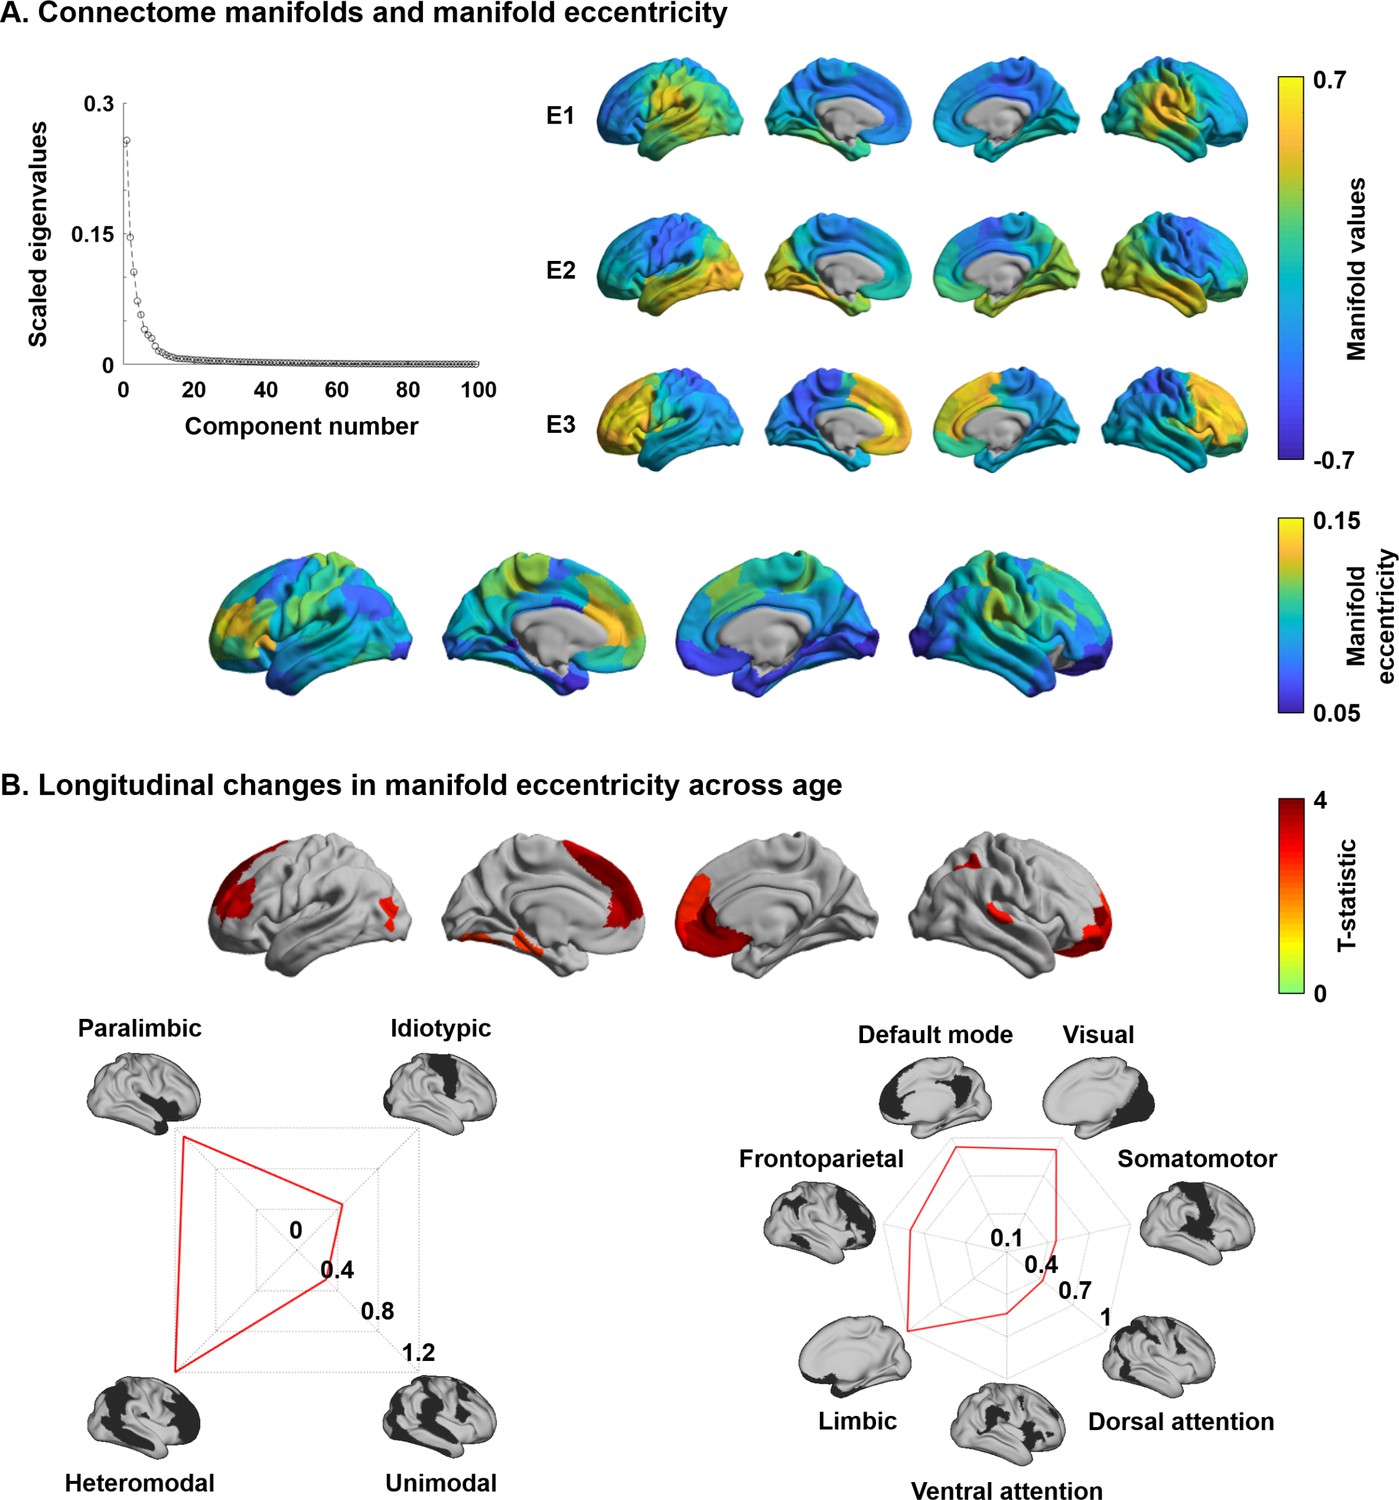
Structural connectome manifolds generated using principal component analysis.
(A) Scree plot showing eigenvalue decay, and the first three eigenvectors (E1, E2, E3) are shown on cortical surfaces. Manifold eccentricity is shown in the bottom panel. (B) Surface plots displaying t-statistics of regions showing significant longitudinal changes in manifold eccentricity across age. Effects are stratified with respect to levels of cortical hierarchy (Mesulam, 1998) and intrinsic functional communities (Yeo et al., 2011).
Figure 1—figure supplement 8
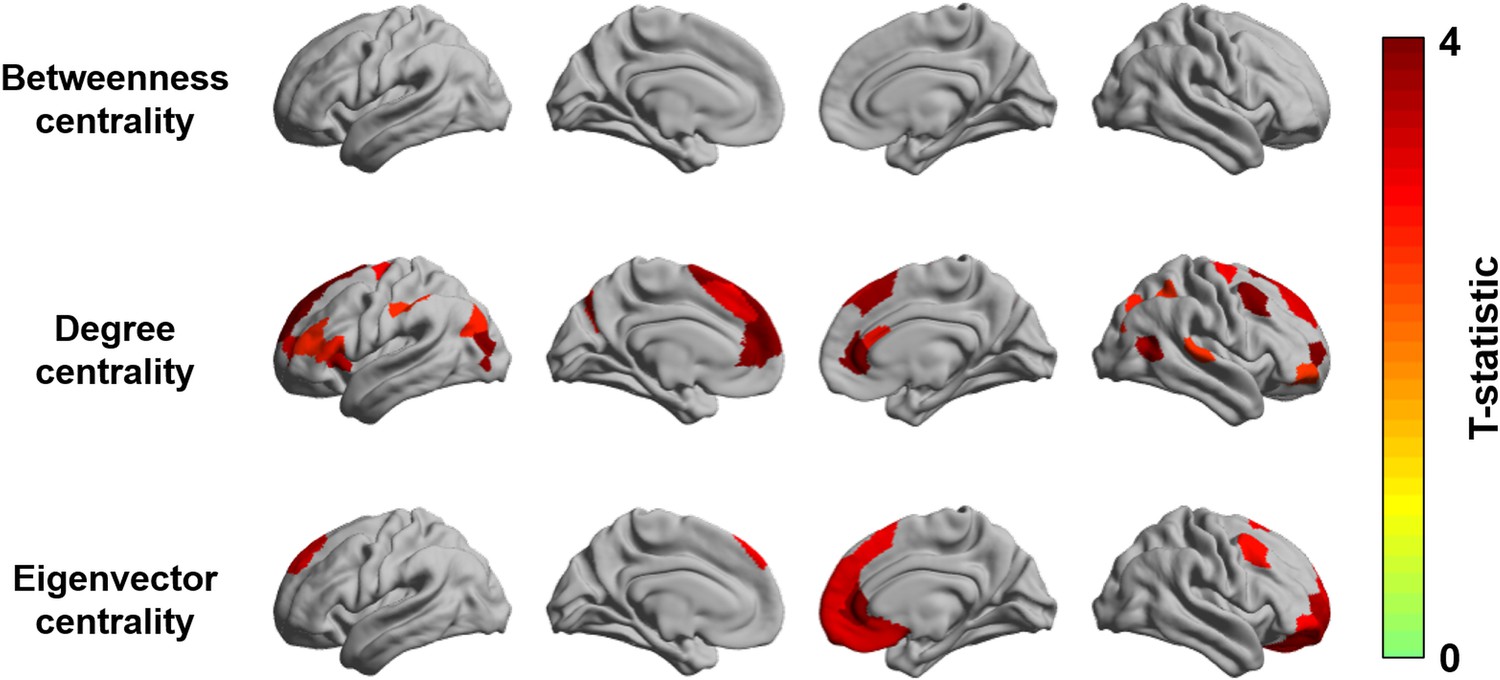
Longitudinal changes in graph measures across age.
Cortical surface map showing t-statistics of significant age-related longitudinal changes in betweenness, degree, and eigenvector centrality.
Figure 1—figure supplement 9
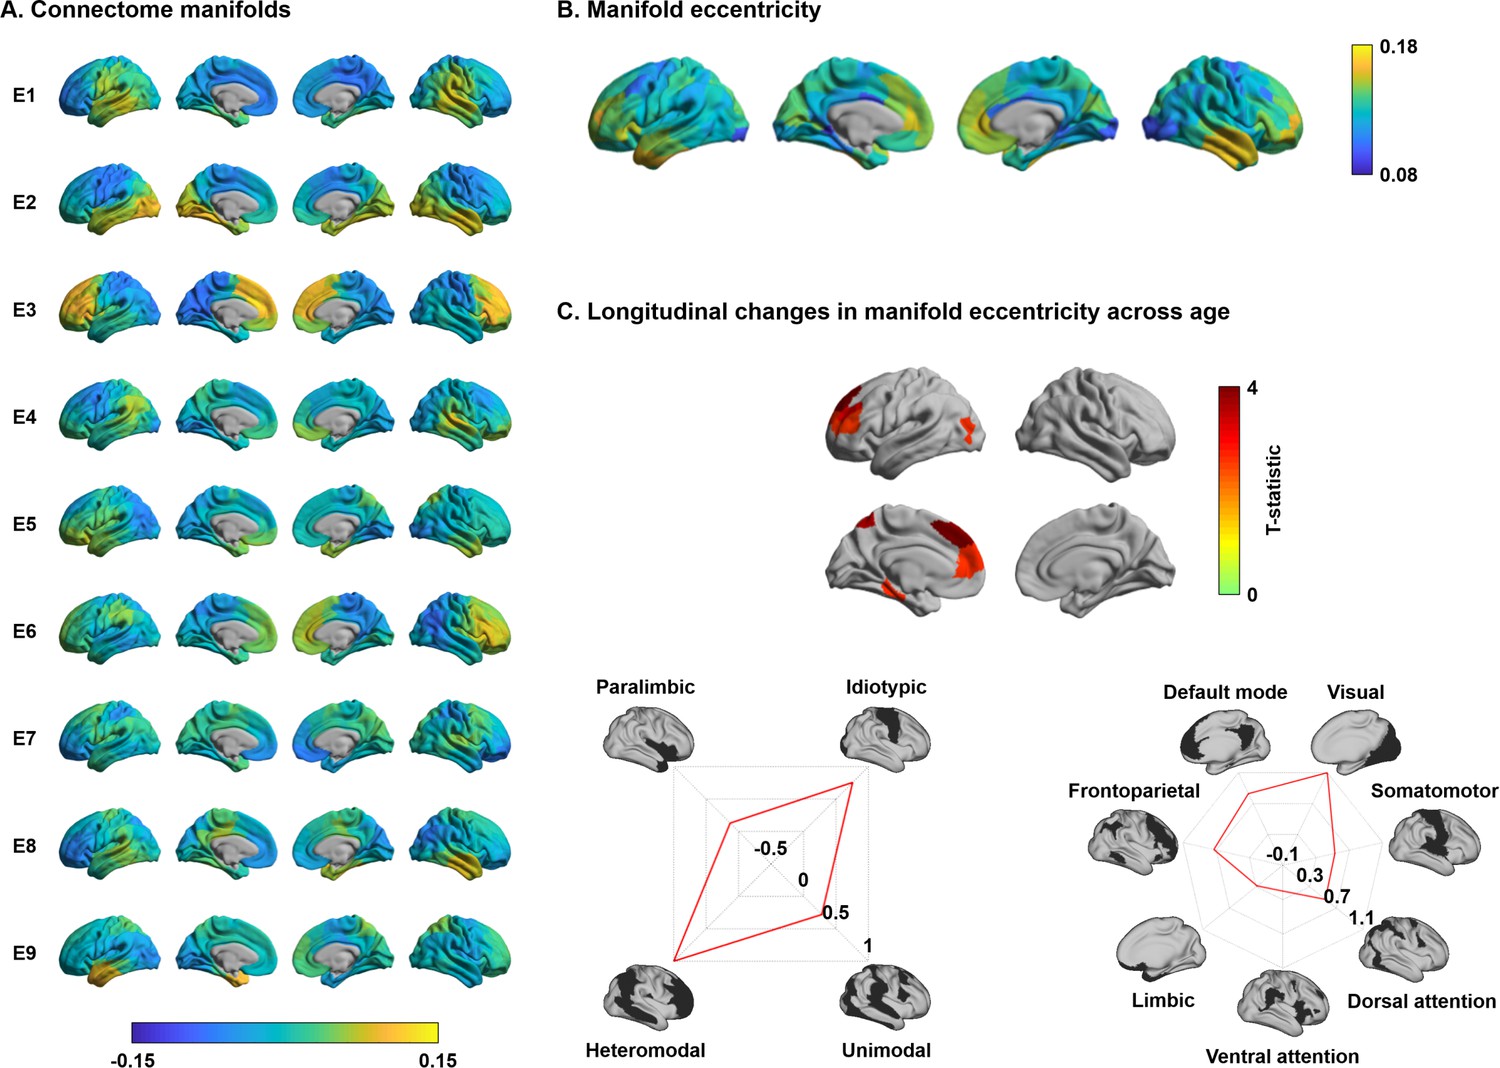
Longitudinal changes in manifold eccentricity calculated using all eigenvectors.
(A) Generated eigenvectors (E1–E9) and (B) correspinding manifold eccentricity. (C) The t-statistics of regions showing significant longitudinal changes in manifold eccentricity across age are reported on the cortical surface. Effects are stratified along levels of cortical hierarchy (Mesulam, 1998) and intrinsic functional communities (Yeo et al., 2011).
Figure 1—figure supplement 10
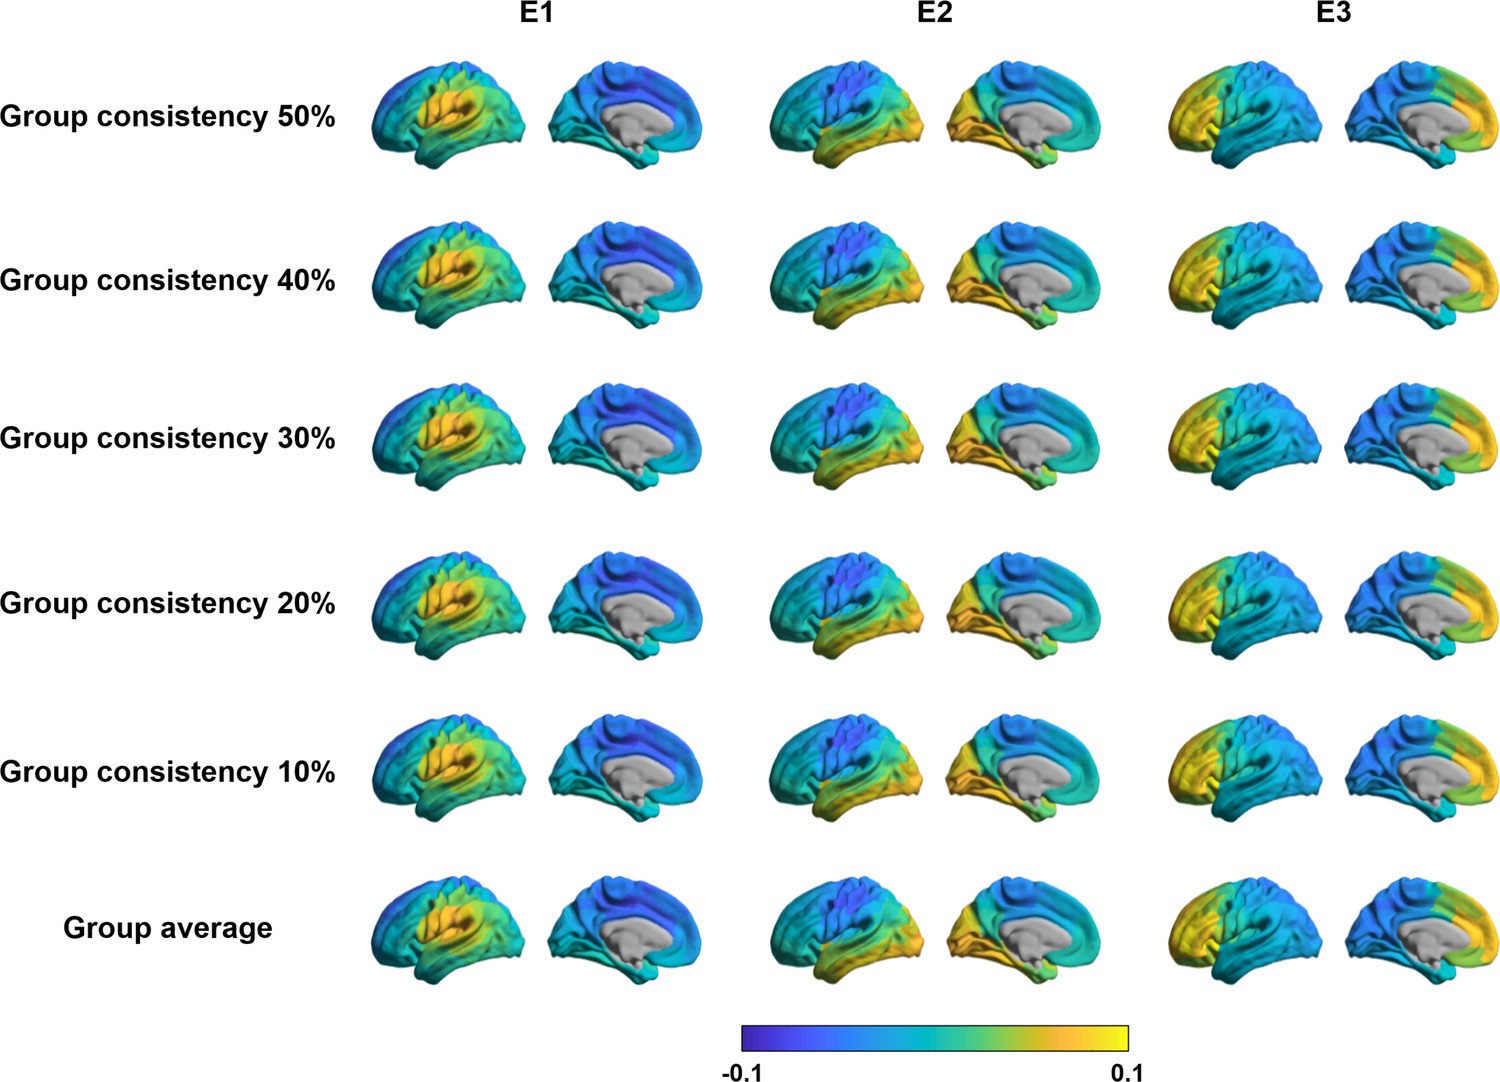
Connectome manifolds estimated using group consistency method.
Spatial maps of three eigenvectors derived from group representative structural connectivity matrices based on different consistency thresholds are reported.
Figure 1—figure supplement 11
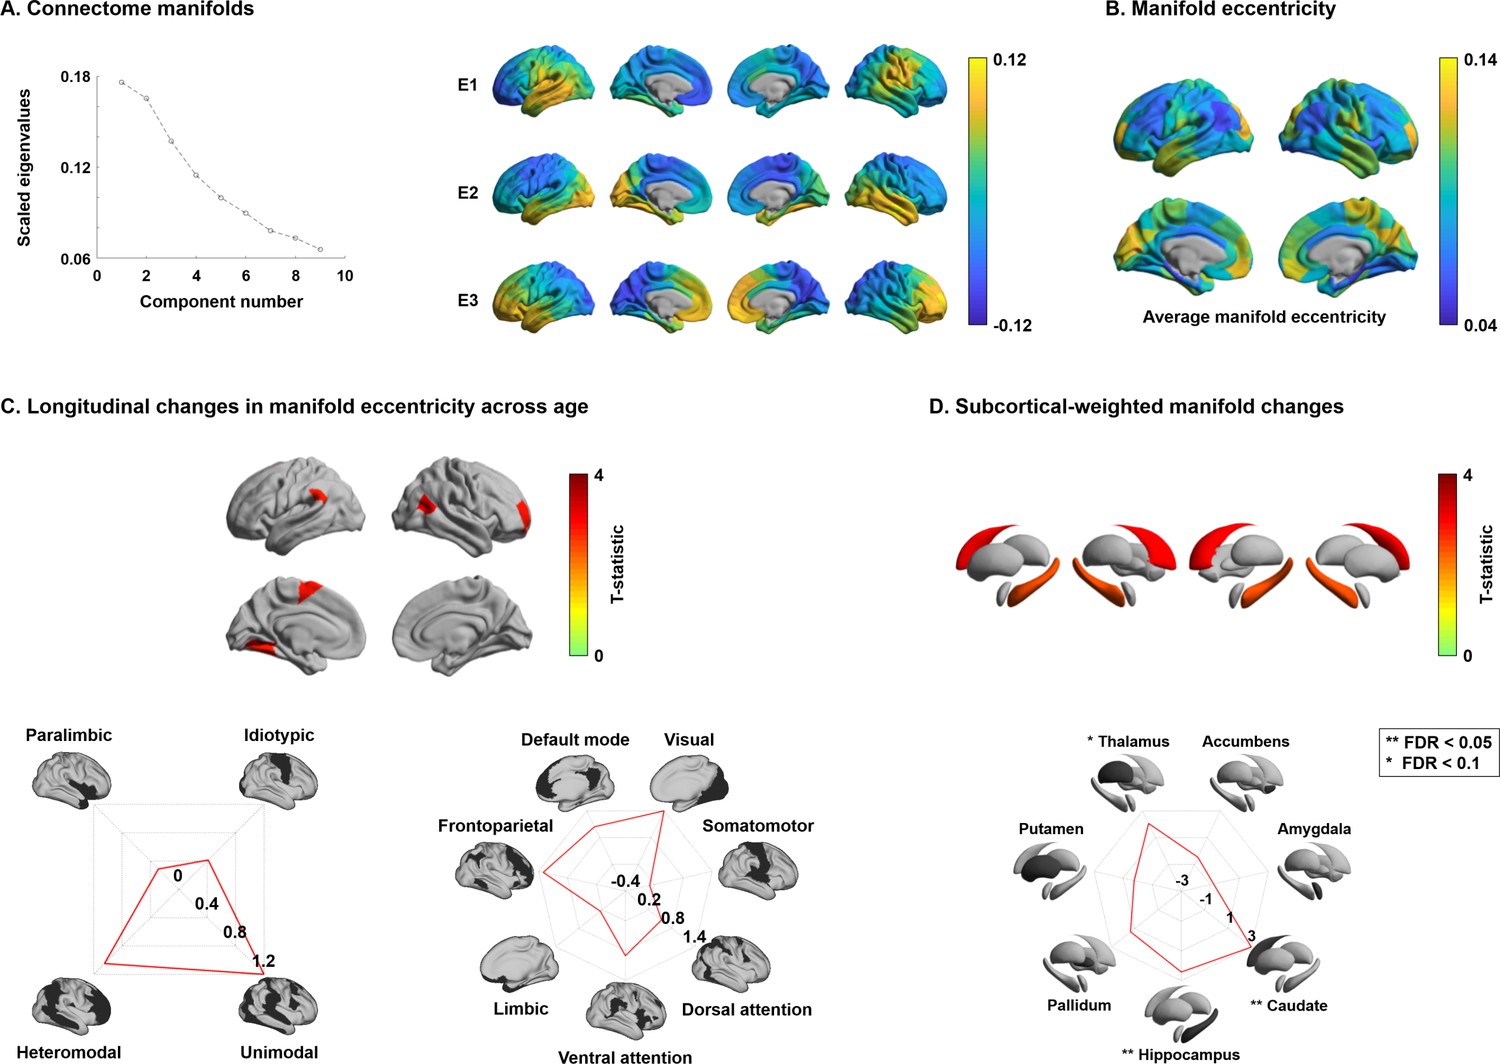
Structural connectome manifolds using a structural parcellation.
(A) A scree plot shows eigenvalues of each component, and the first three eigenvectors (E1, E2, E3) are shown on brain surfaces. (B) Manifold eccentricity. (C) The t-statistics of regions showing significant longitudinal changes in manifold eccentricity and (D) subcortical-weighted manifolds across age. The effects of manifold eccentricity are stratified along cortical hierarchy (Mesulam, 1998) and functional community (Yeo et al., 2011). For details, see Figure 1.
Figure 1—figure supplement 12
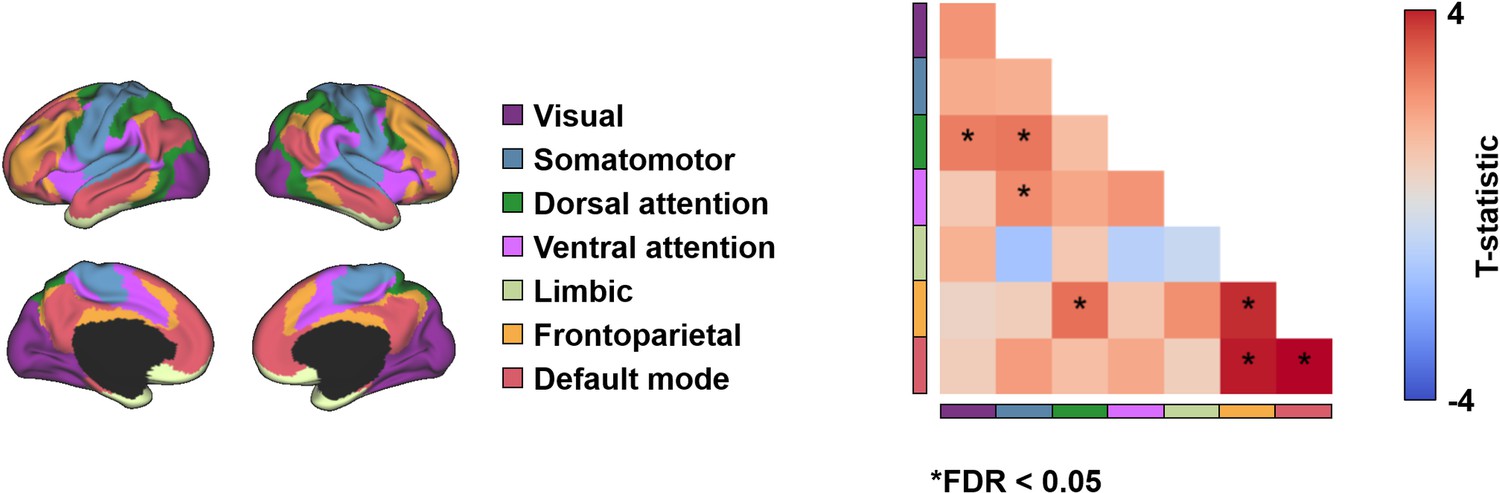
Longitudinal changes in edge weights of structural connectome.
Findings were stratified relative to seven intrinsic functional communities (Yeo et al., 2011). The matrix displays t-statistics of connections showing longitudinal changes in edge weights, and significant (false discovery rate [FDR] < 0.05) results are marked with asterisks.
Figure 1—figure supplement 13
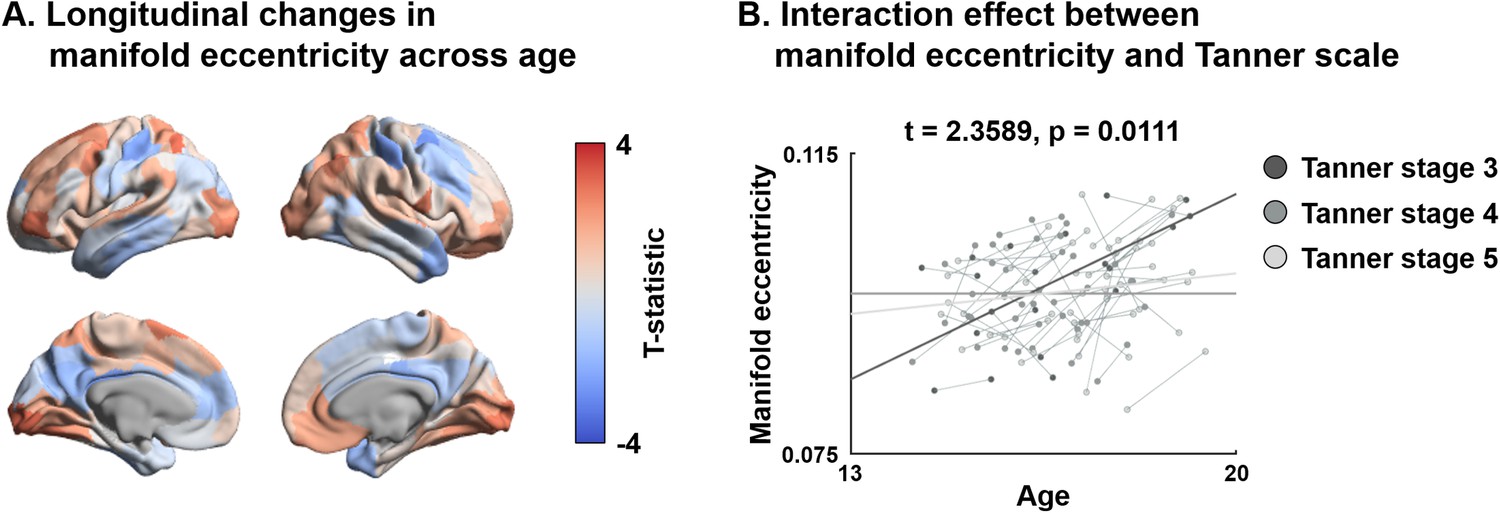
Longitudinal changes in manifold eccentricity using a subset of participants who completed Tanner scale.
(A) Cortex t-statistics of age-related longitudinal effect. (B) Interaction effect between manifold eccentricity and Tanner scale. Colors of dots indicate Tanner stage of individuals, and lines indicate linear correlations between age and manifold eccentricity for individuals with the same Tanner stage.
Figure 1—figure supplement 14
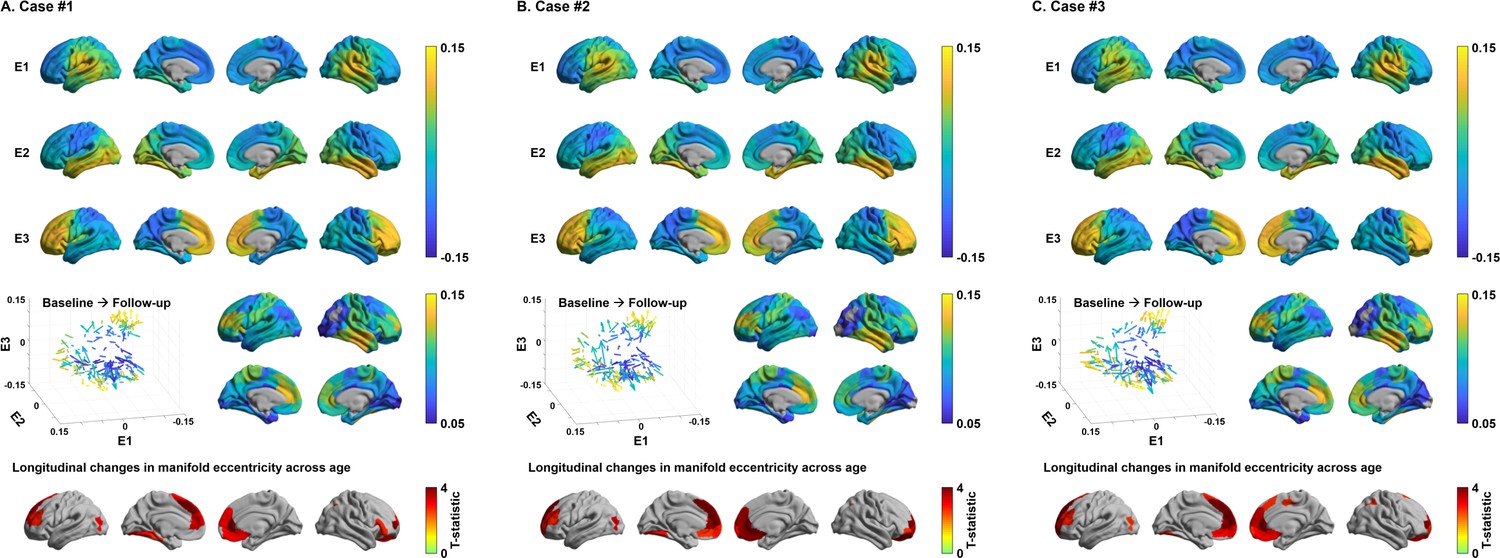
Structural connectome manifolds using different template dataset.
(A–C) Structural connectome manifolds and association to age using different template cohort. Three representative cases are reported. For details, see Figure 1.
Figure 1—figure supplement 15
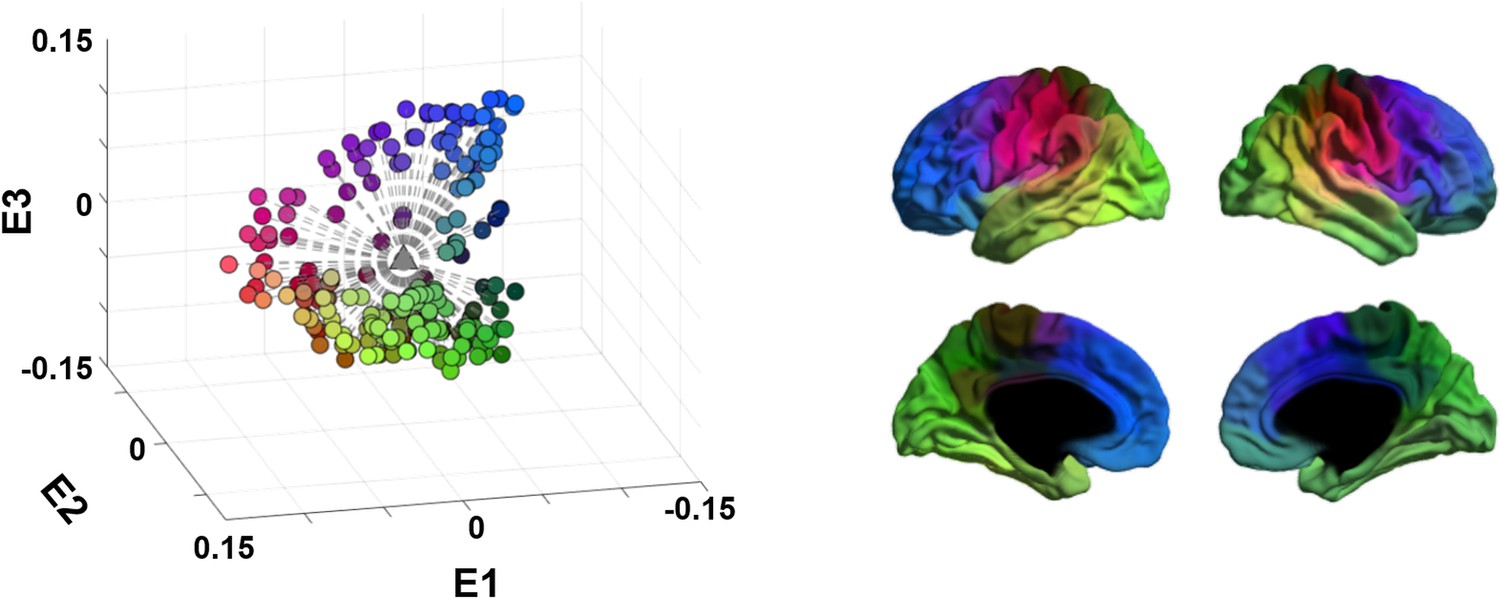
A schema of manifold eccentricity for three eigenvectors.
Each dot in the scatter plot represents a single brain region, and the colors matched with regions on the brain surface. The triangle in the middle of the scatter plot is the manifold origin, and all brain regions (i.e., dots) are connected to the origin with lines. Manifold eccentricity of a given region is the length (i.e., Euclidean distance) of this line.
Figure 2
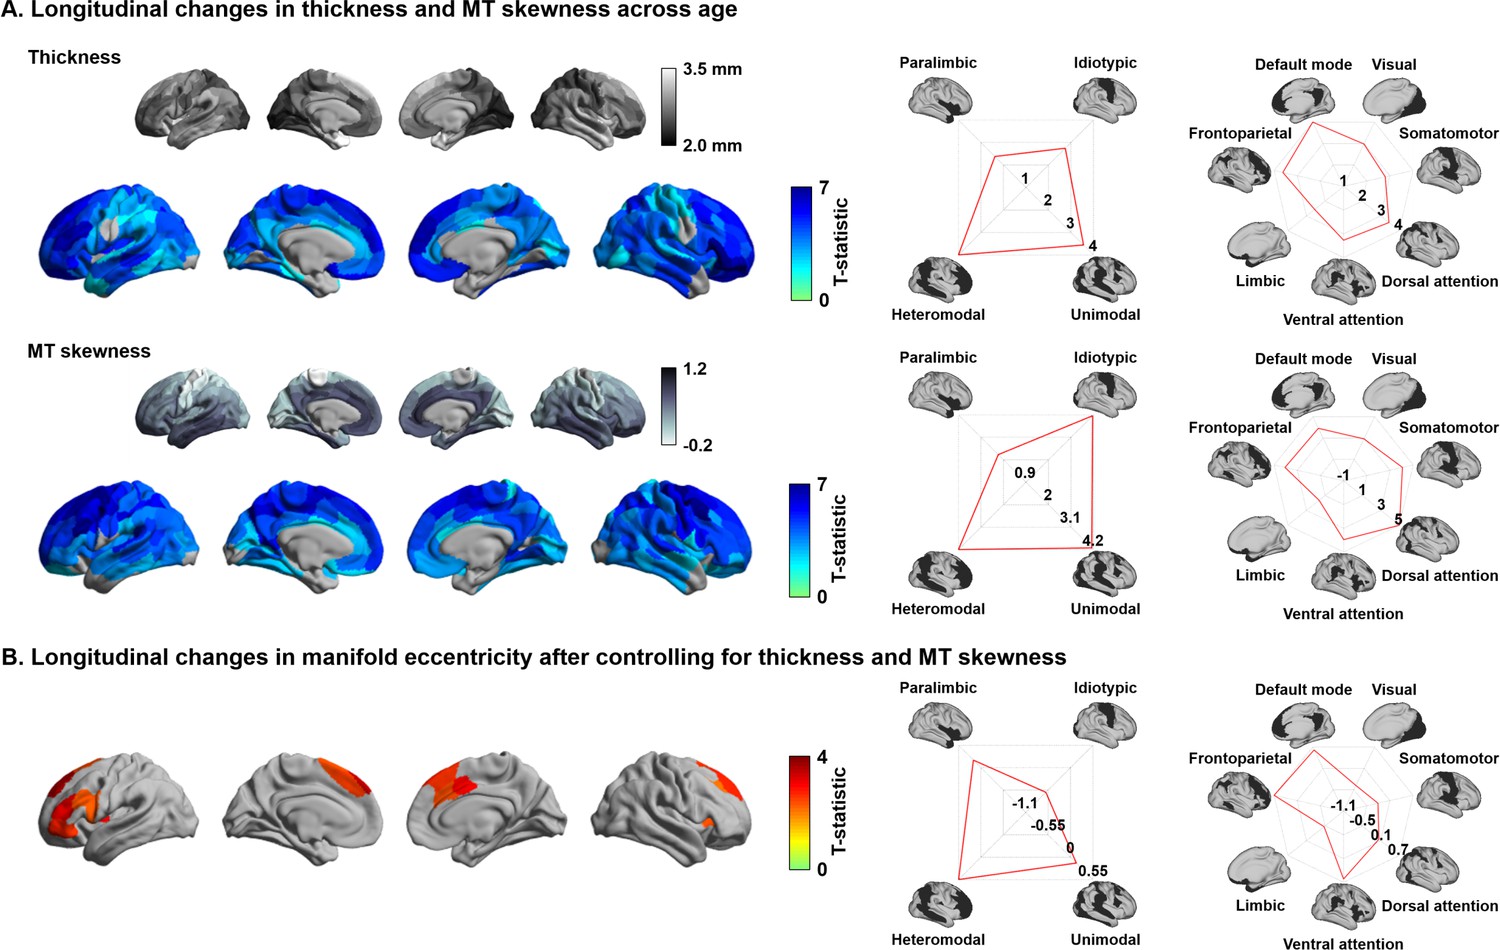
Age-related effects on macro- and microstructural metrics of cortical anatomy.
(A) The t-statistics of identified regions that showed significant age-related changes in cortical thickness (upper row) and magnetization transfer ratio MT (bottom row), and stratification of t-statistics according to cortical hierarchy (Mesulam, 1998) and functional community (Yeo et al., 2011). (B) Age-related changes in manifold eccentricity after controlling for cortical thickness and MT.
-
Figure 2—source data 1
Source files for age-related changes in cortical thickness and magnetization transfer ratio.
- https://cdn.elifesciences.org/articles/64694/elife-64694-fig2-data1-v2.xlsx
Figure 3
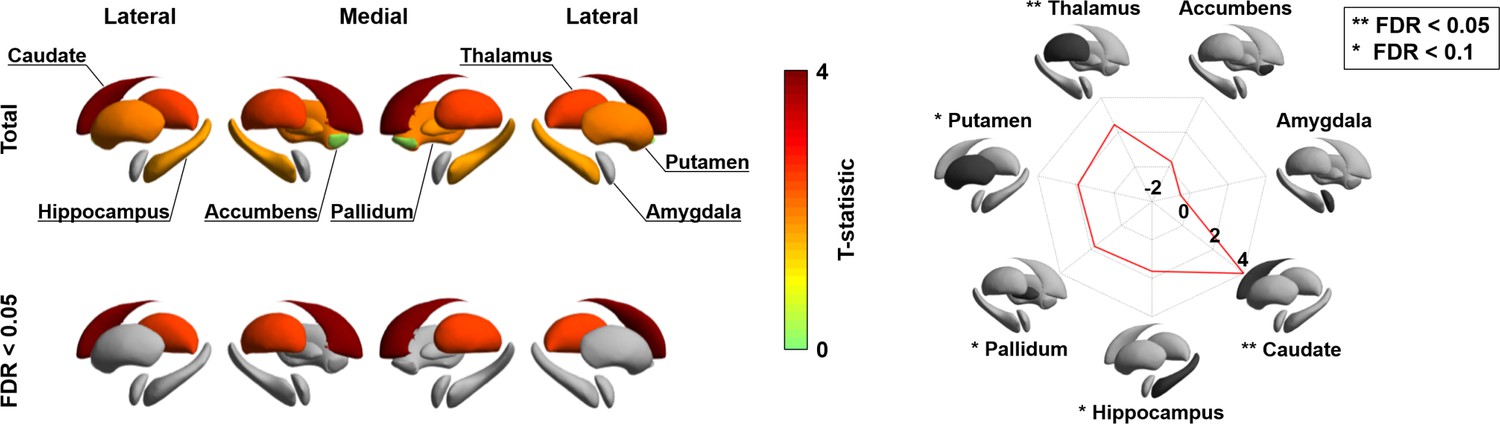
Longitudinal changes in subcortical-weighted manifolds.
The t-statistics of age-related changes in subcortical-weighted manifolds. The effects of each subcortical region are reported on the radar plot. FDR: false discovery rate.
-
Figure 3—source data 1
Source files for age-related changes in subcortical-weighted manifolds.
- https://cdn.elifesciences.org/articles/64694/elife-64694-fig3-data1-v2.xlsx
Figure 4
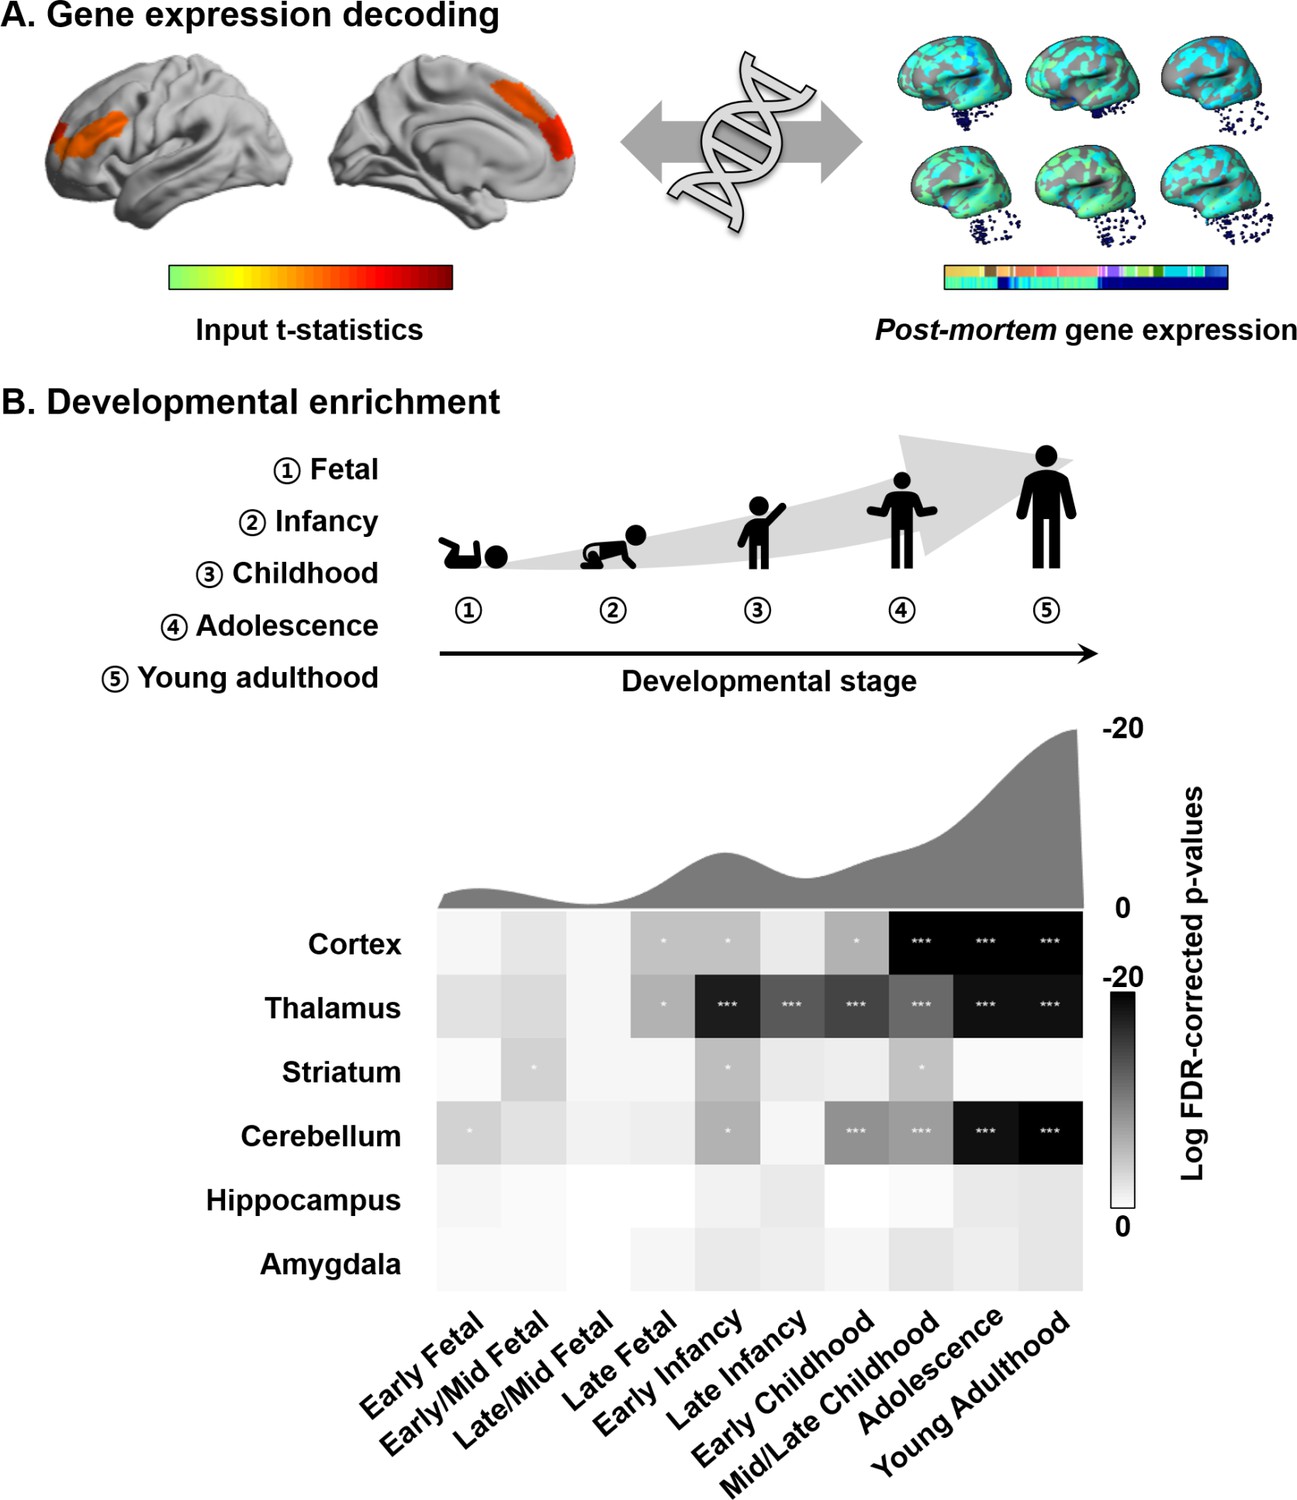
Transcriptomic analysis.
(A) Gene decoding process by associating t-statistics from the linear mixed effect model with post-mortem gene expression maps. (B) We identified genes that were spatially correlated with the input t-statistic map (false discovery rate [FDR] < 0.05) and selected only those that were furthermore consistently expressed across different donors (r > 0.5). These genes were input to a developmental enrichment analysis, showing strong associations with cortex, thalamus, striatum, and cerebellum during the childhood-to-adulthood time window. The degree of gene expression for developmental windows is reported on the bottom. The curve represents log transformed FDR-corrected p-values, averaged across the brain regions for each of the time windows reported on the bottom. ***FDR < 0.001, ** FDR < 0.01, *FDR < 0.05.
-
Figure 4—source data 1
Source files for developmental enrichment profiles.
- https://cdn.elifesciences.org/articles/64694/elife-64694-fig4-data1-v2.xlsx
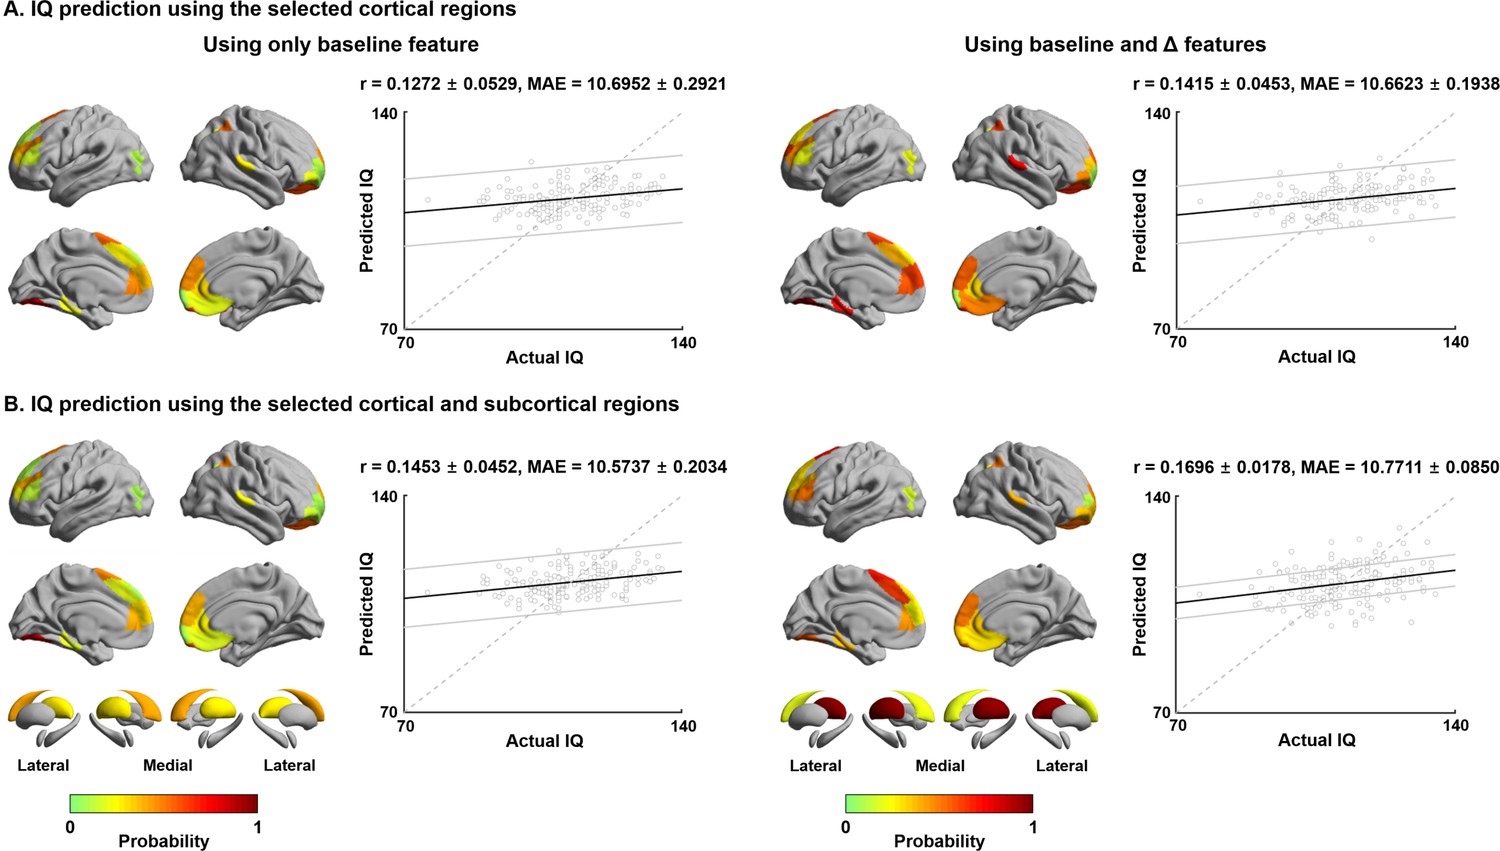
Figure 5 with 2 supplements

Intelligence quotient (IQ) prediction by baseline and follow-up measures of cortical and subcortical manifolds.
(A) Probability of selected brain regions across ten-fold cross-validation and 100 repetitions for predicting future IQ using only baseline manifold eccentricity (left), and both baseline and maturational change in the feature (right). Correlations between actual and predicted IQ are reported. Black lines indicate mean correlation, and gray lines represent 95% confidence interval for 100 iterations with different training/test dataset. (B) The prediction performance when both cortical and subcortical features were considered. MAE: mean absolute error.
-
Figure 5—source data 1
Source files for selected probability as well as actual and predicted intelligence quotient.
- https://cdn.elifesciences.org/articles/64694/elife-64694-fig5-data1-v2.xlsx
Figure 5—figure supplement 1
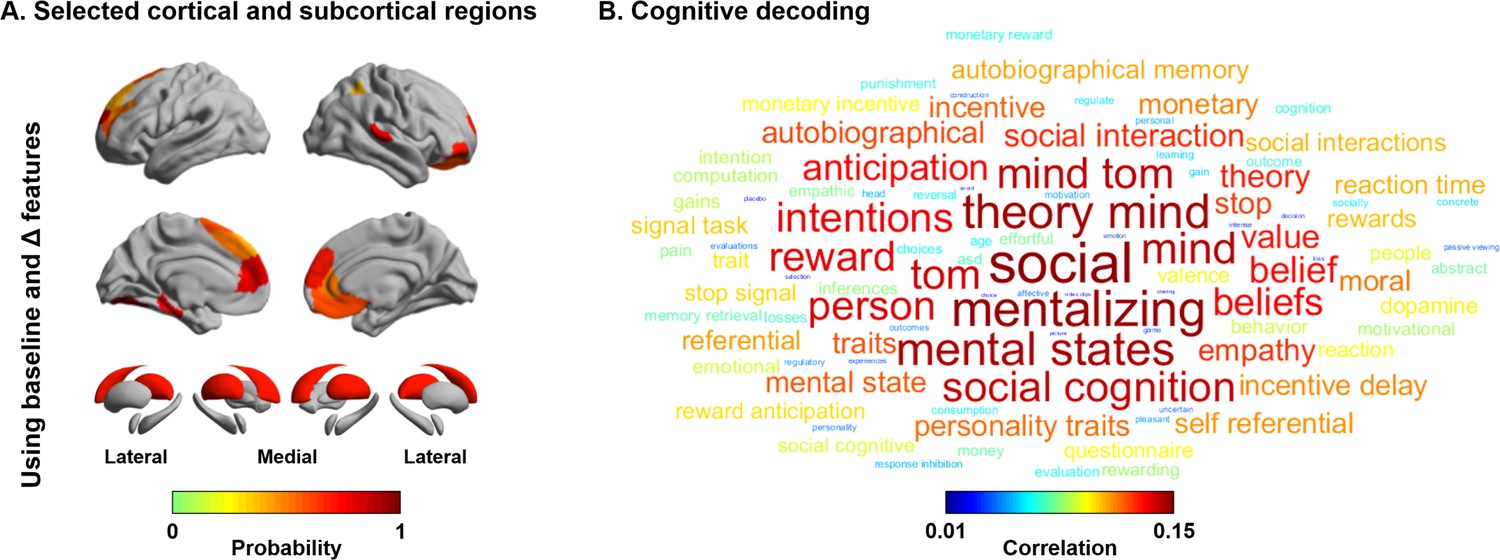
Cognitive decoding of the selected regions for intelligence quotient (IQ) prediction.
(A) Probability of selected cortical and subcortical regions for predicting future IQ using both baseline and maturational changes (see Figure 5). (B) A word cloud derived by cognitive decoding using Neurosynth (Yarkoni et al., 2011).
Figure 5—figure supplement 2
Intelligence quotient (IQ) prediction using regression tree approach.
(A) The prediction performance using cortical features. Probability of selected brain regions across ten-fold cross-validation and 100 repetitions for predicting future IQ are represented on brain surfaces, and correlations between actual and predicted IQ are reported with scatter plots. (B) The prediction performance when both cortical and subcortical features were considered. For details, see Figure 5.
Additional files
-
Supplementary file 1
Significant gene lists correlated with patterns of manifold eccentricity changes across age.
Gene symbols with name and t-statistic as well as false discovery rate-corrected p-value are reported in the Supplementary File (Supplementary_File1.xlsx).
- https://cdn.elifesciences.org/articles/64694/elife-64694-supp1-v2.xlsx
-
Supplementary file 2
Full details for Neuroscience in Psychiatry Network (NSPN) Consortium.
- https://cdn.elifesciences.org/articles/64694/elife-64694-supp2-v2.pdf
-
Transparent reporting form
- https://cdn.elifesciences.org/articles/64694/elife-64694-transrepform-v2.docx
Download links
A two-part list of links to download the article, or parts of the article, in various formats.
Downloads (link to download the article as PDF)
Open citations (links to open the citations from this article in various online reference manager services)
Cite this article (links to download the citations from this article in formats compatible with various reference manager tools)
An expanding manifold in transmodal regions characterizes adolescent reconfiguration of structural connectome organization
eLife 10:e64694.
https://doi.org/10.7554/eLife.64694


