Persistent effects of pair bonding in lung cancer cell growth in monogamous Peromyscus californicus
- Department of Drug Discovery and Biomedical Sciences, College of Pharmacy, University of South Carolina, United States
- Peromyscus Genetic Stock Center, University of South Carolina, United States
- Department of Physiology, Pharmacology, and Neuroscience, School of Medicine and Department of Laboratory Animal Resources, University of South Carolina, United States
- Department of Pathology, Microbiology and Immunology, School of Medicine, University of South Carolina, United States
Figures
Figure 1 with 1 supplement
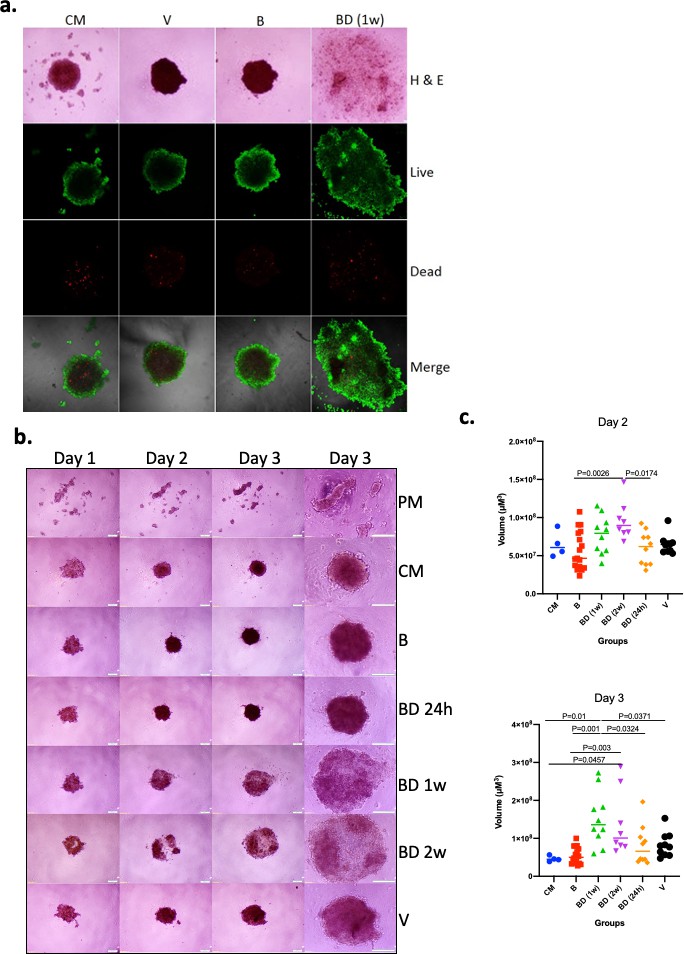
Effects of pair bonding in the pro-oncogenic activity of sera.
(a) Representative microphotographs of tumor spheroids developed by A549 cells 3 days after cell seeding. Cells formed spheroids in the presence of sera from bonded (B), bond-disrupted animals (BD) 1 week after disruption, and virgin animals (V), and control media containing fetal bovine serum (FBS) (CM). Live (green) and dead cells (red) are indicated. Representative images of two independent experiments are shown. (b) Representative microphotographs of tumor spheroids developed by A549 cells on day 1, day 2, and day 3, after cell seeding. Cells formed spheroids in the presence of sera from bonded (B), bond-disrupted animals (BD) 24 hr, 1 week, and 2 weeks after disruption, and virgin animals (V), control media containing FBS (CM) or serum-free plain media (PM). The last column shows images at day three in higher magnification. Bars indicate 200 μM. (c) Scatter dot plots of data shown in (b), indicating the size of tumor spheroids at days 2 and 3 after seeding. Median and p-values are indicated. Sera from 9 (B), 5 (BD, 24 hr), 5 (BD, 1 week), 4 (BD, 2 weeks), and 5 (V) different animals were used and microsphere formation was evaluated in two biological replicas for each (n = 10 for BD [1 week], BD [24 hr] and V; n = 8 for BD [2 weeks] and n = 18 for B). For control media (CM) and plain serum-free media (PM), n = 4. For this experiment, sera from 14 to 17 months old mice that were used for the B and BD groups were bonded for about 1 year. Statistical analyses were performed by ANOVA.
Figure 1—figure supplement 1
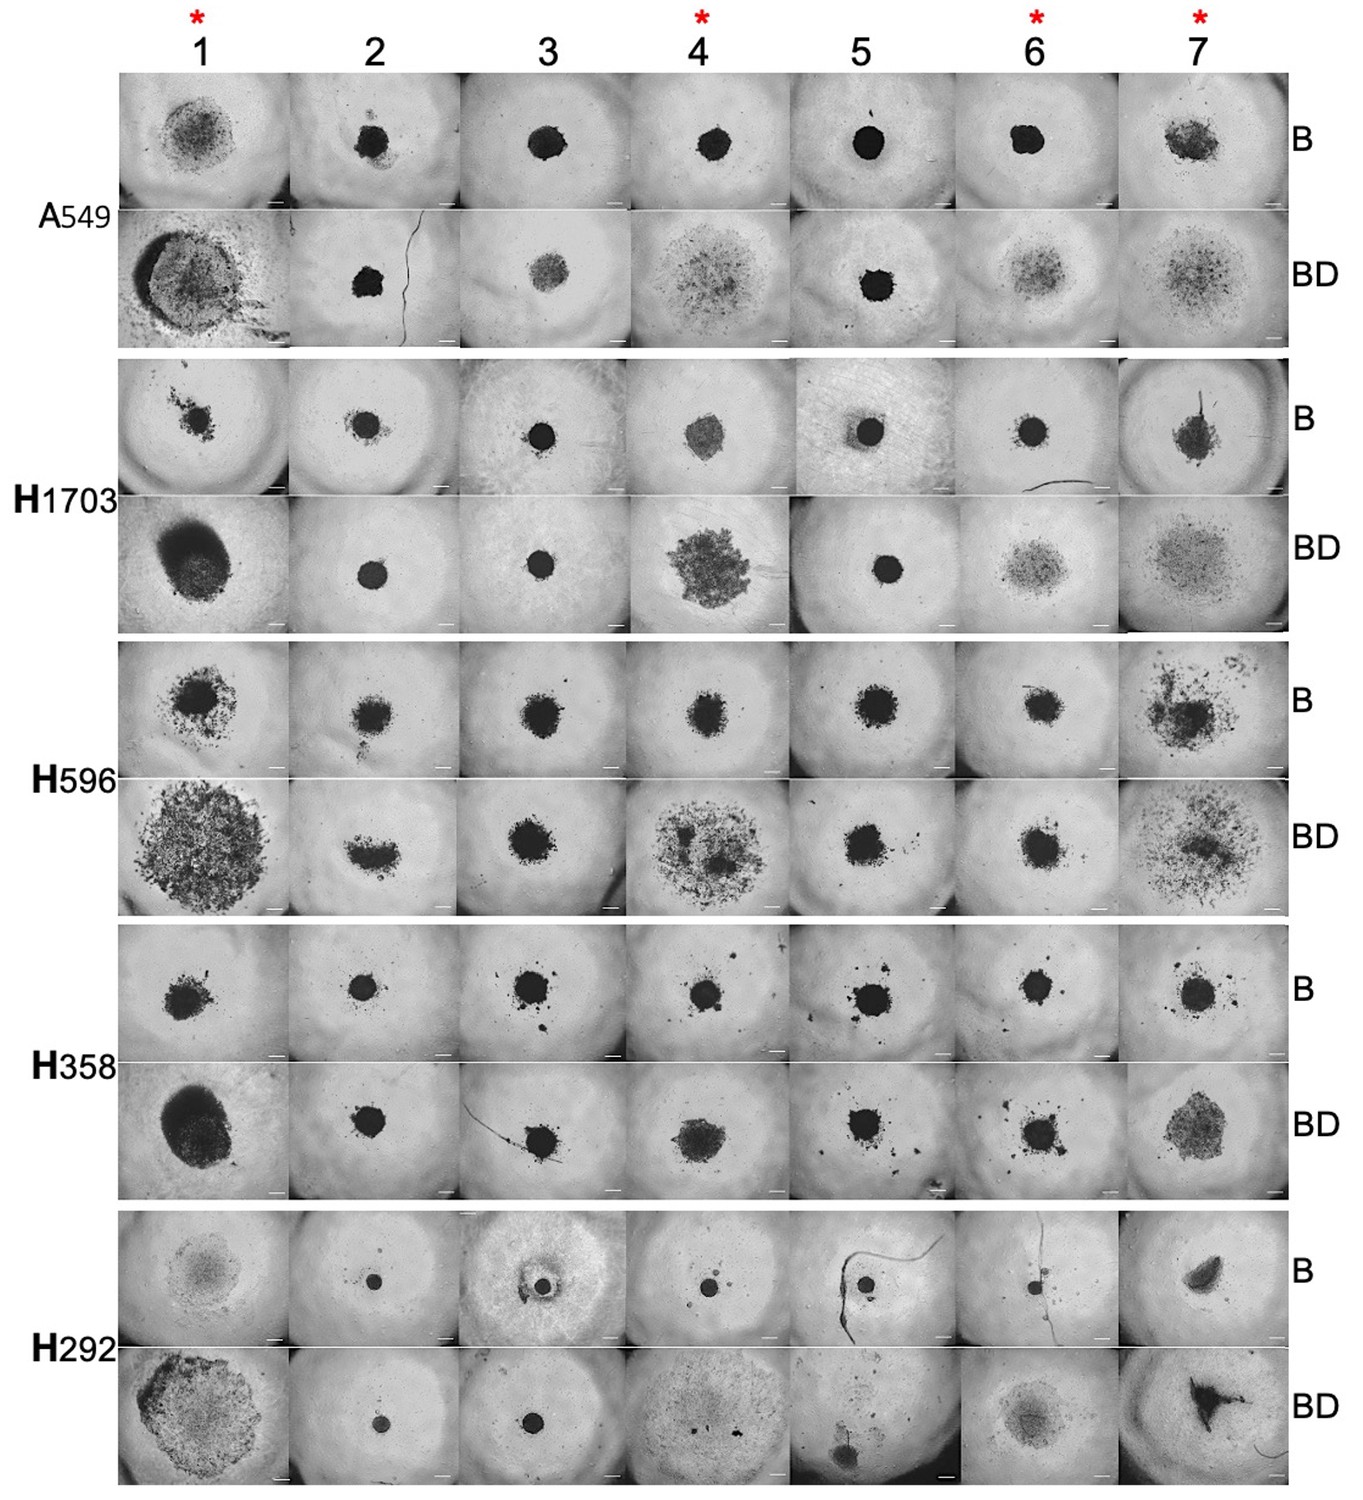
Microsphere morphology of a panel of human lung cancer cells cultured in P. californicus sera.
Figure 2

Growth of A549 human lung cancers in P. californicus (IS stock) and bonding experience.
Vasectomized males were used in all studies. (a) Volume of measurable tumors at day 15 following cancer cell inoculation in the bonded (n = 9), bond-disrupted (n = 8), and virgin (n = 6) groups; out of the 11, 9 and 8 animals implanted originally with A549 cells. (b) Pie graphs indicating the percentage of animals bearing tumors at day 25. (c) Representative hematoxylin and eosin (H and E)-stained sections of P. californicus-grown tumors from bonded (upper panel), and bond-disrupted (lower panel) groups. (*) and (#) indicate necrotic areas and muscle invasion, respectively. (d) Tumor-free nude mice implanted with A549 tumor explants from bonded (n = 9) and bond-disrupted (n = 7) P. californicus. p-values (log-rank [Mantel–Cox] test) are shown. (e) H and E-stained sections of A549 tumors in nude mice derived from explants of A549 tumors from bonded, and bond-disrupted P. californicus. The morphology of A549 tumors from the direct inoculation of A549 cells in nude mice is shown (n). N is indicated in the text. B-IS, tumors growing in bonded P. californicus; BD-IS, tumors growing in bond-disrupted P. californicus; B-n, tumors that originally developed in bonded P. californicus and now growing in nude mice; BD-n, tumors that originally developed in bond-disrupted P. californicus and now growing in nude mice; n, tumors that developed in nude mice following injection of A549 cells.
Figure 3 with 3 supplements
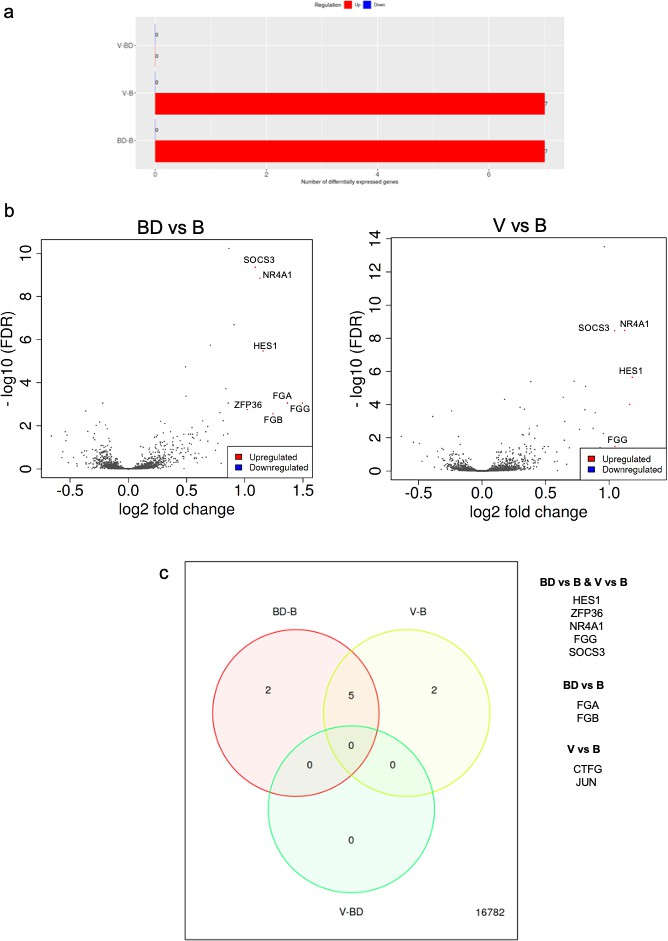
RNAseq analysis of A549 cells cultured in the presence of sera from bonded (B), bond-disrupted (BD), or virgin (V) P. californicus.
(a) Bar graphs showing number of differentially expressed genes in each pairwise comparison group. (b ) Volcano plots showing differentially expressed genes between the B vs BD, and B vs V groups. (c) Venn Diagrams showing overlapping differentially expressed genes. The identity of genes is shown in the right. In the bonded group, mice were paired for 12 months. For the bond-disrupted group, we separated paired mice after 12 months of bonding, and collected the sera 1 week after bond disruption. For virgin mice, we collected sera from mice housed 3/cage.
Figure 3—figure supplement 1
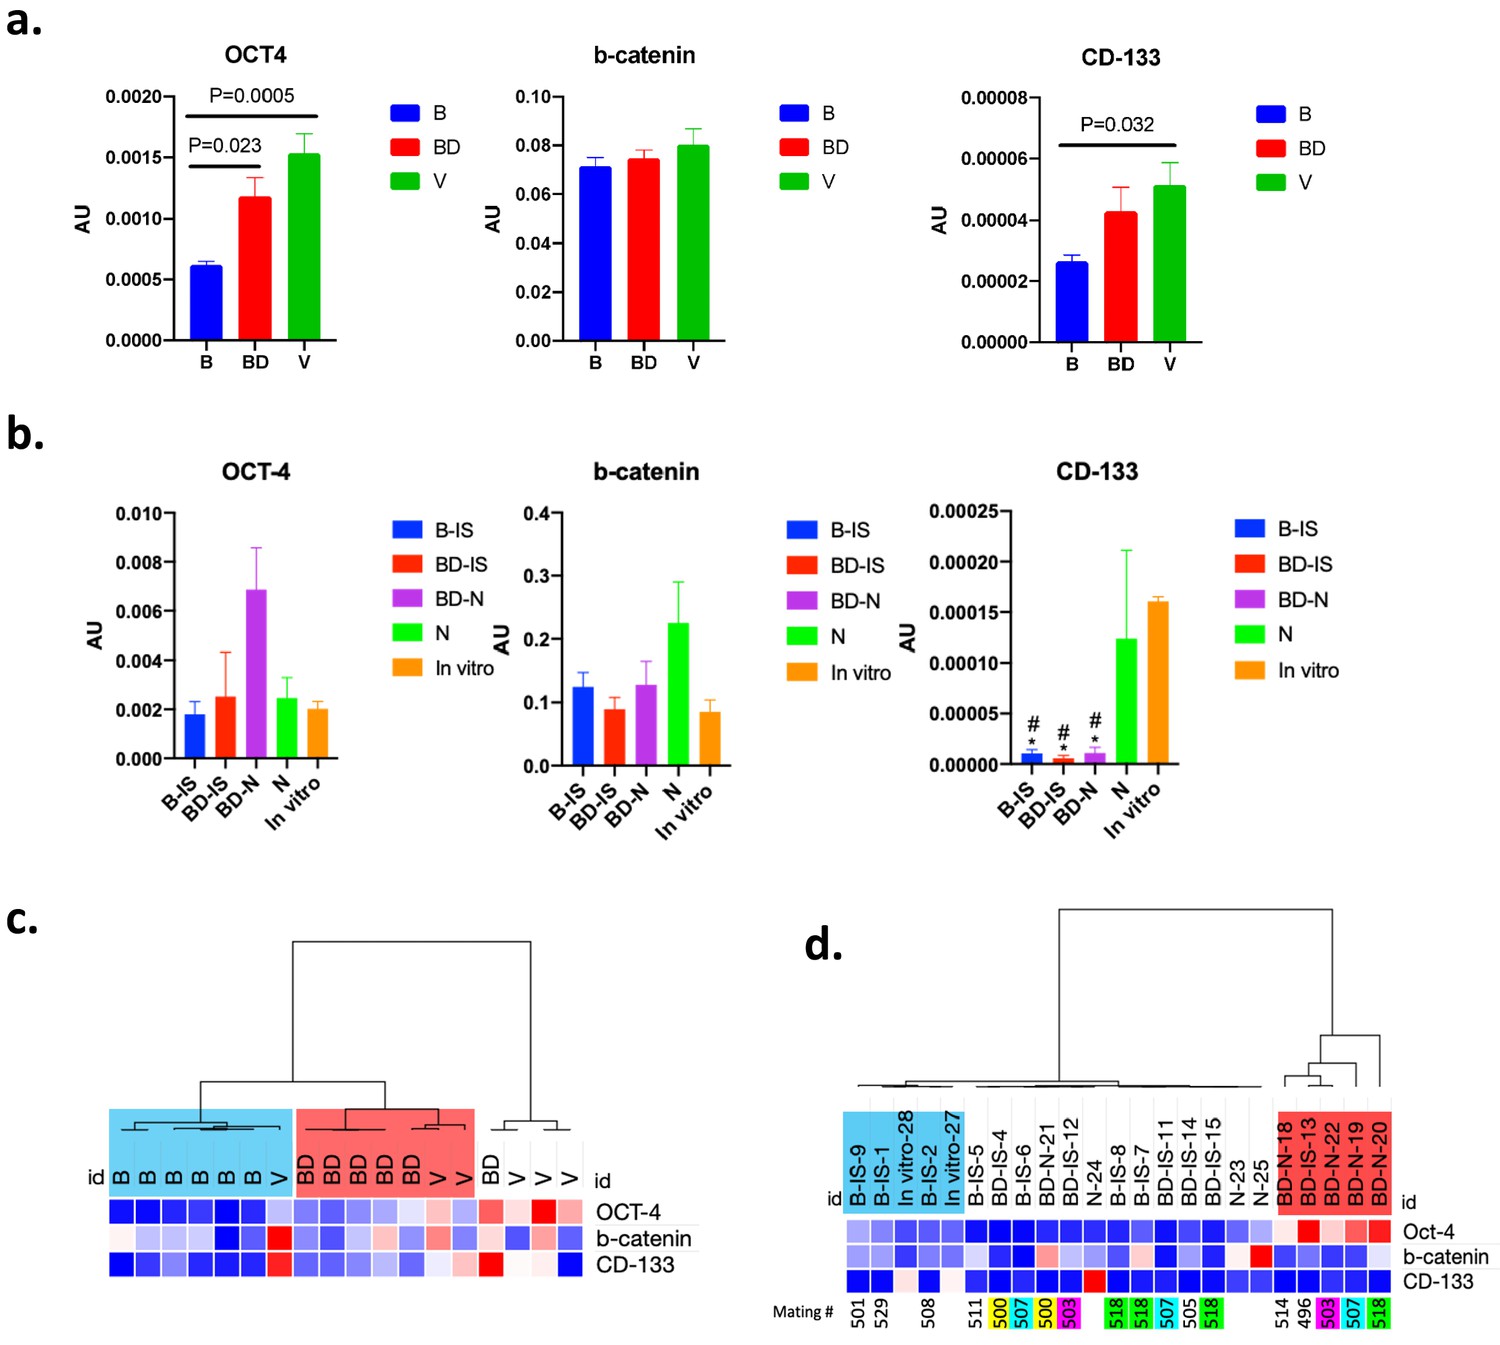
CSC markers in A549 cells cultured in vitro and tumors.
Figure 3—figure supplement 2
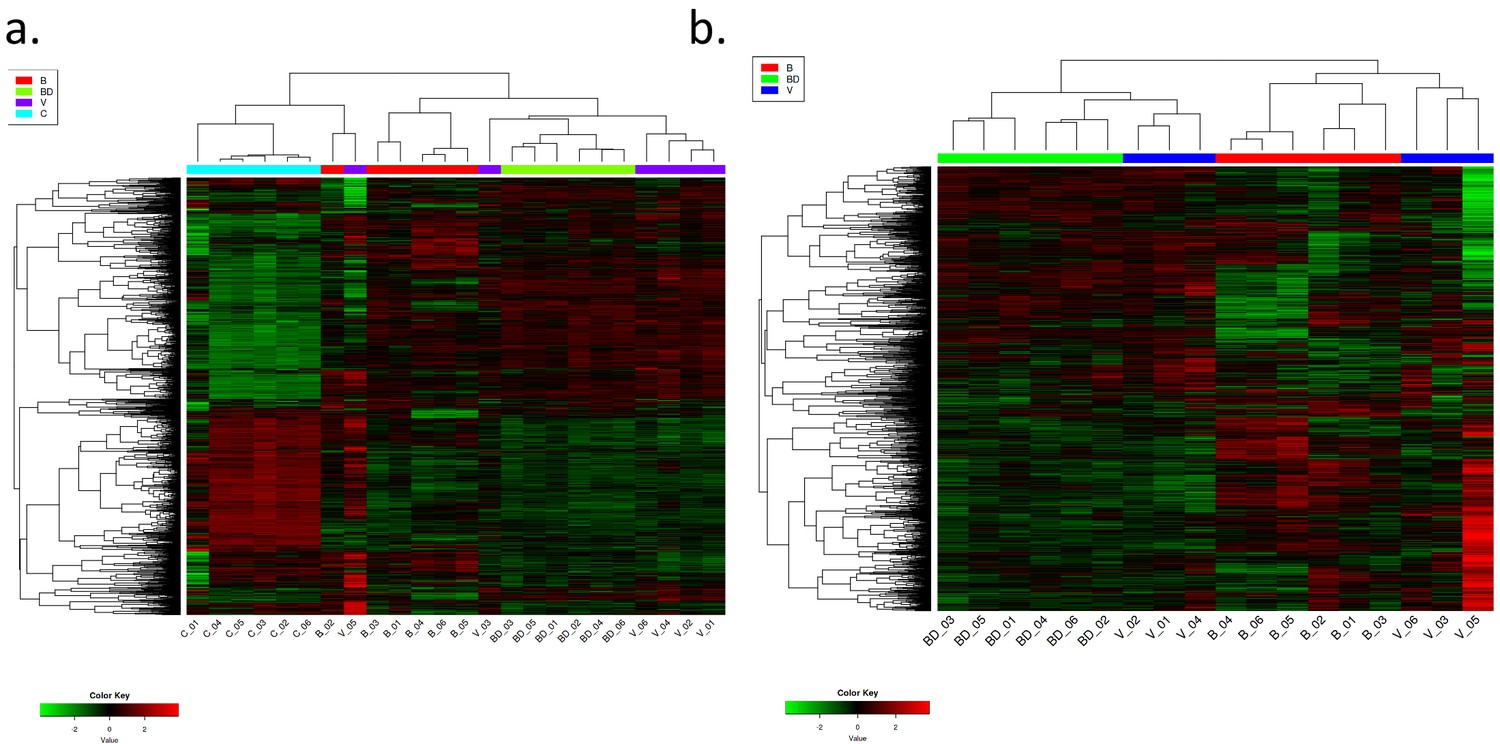
Unsupervised hierarchical clustering based on log2 transformed values on all RNAseq data.
Figure 3—figure supplement 3
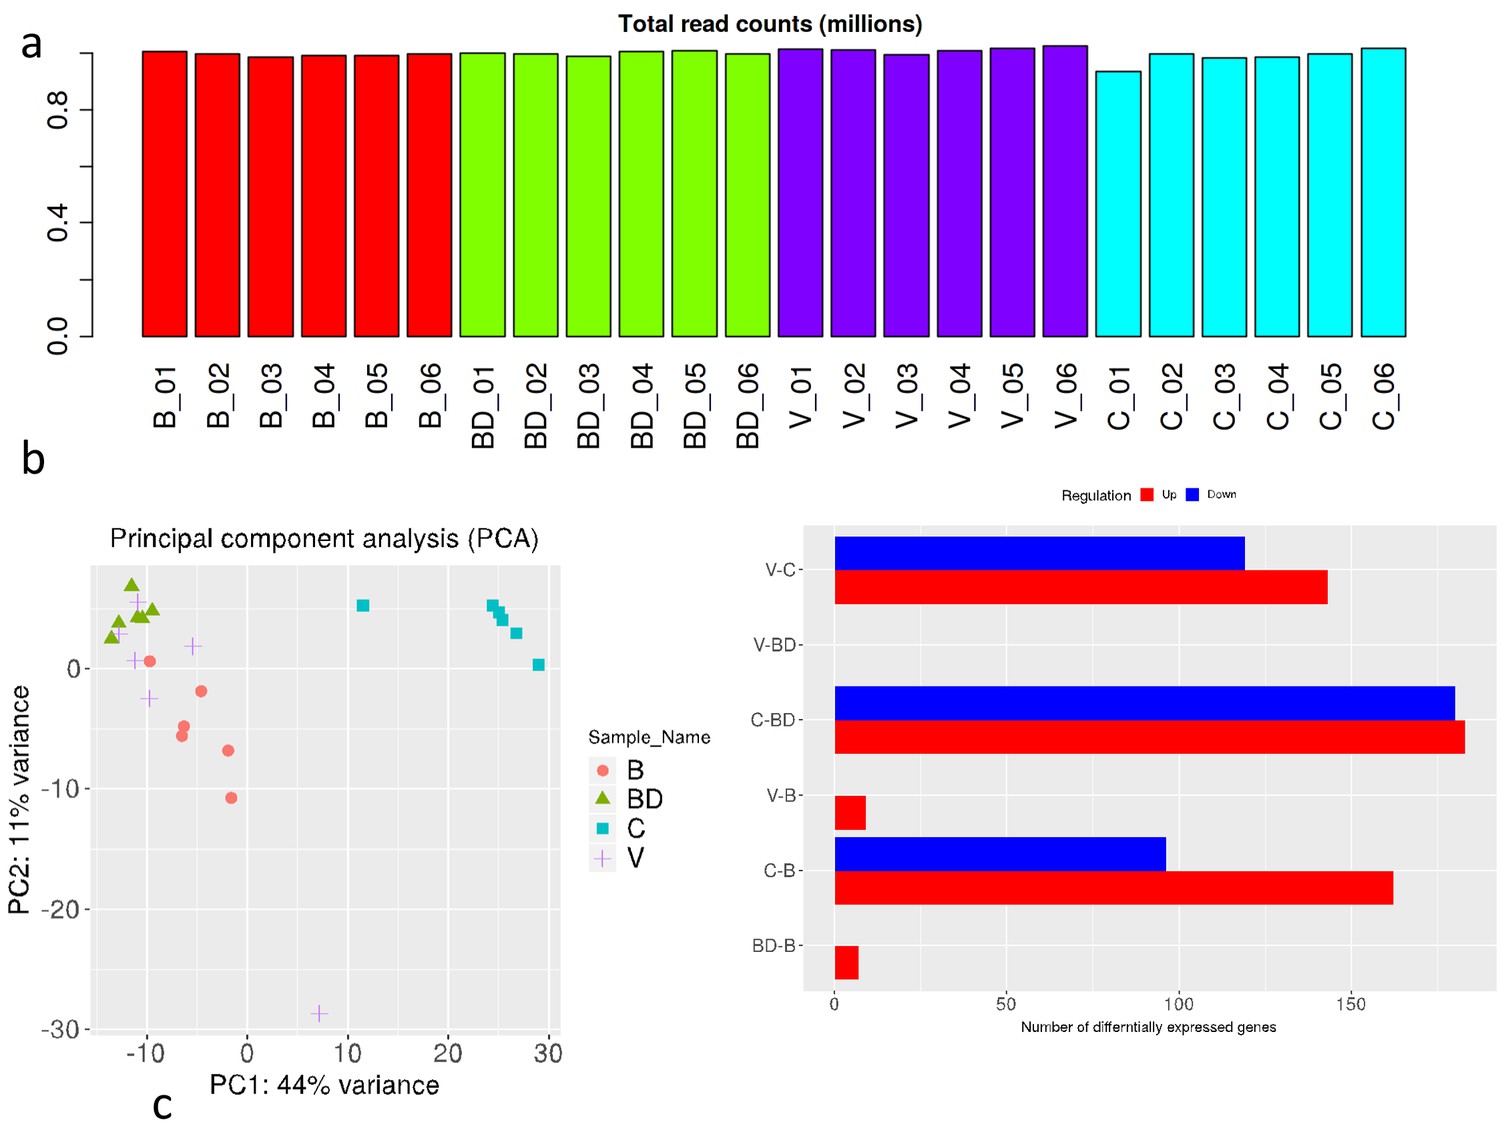
RNAseq analysis summary of A549 cells.
Figure 4 with 1 supplement
Tumor spheroids with sera from P. polionotus and P. maniculatus.
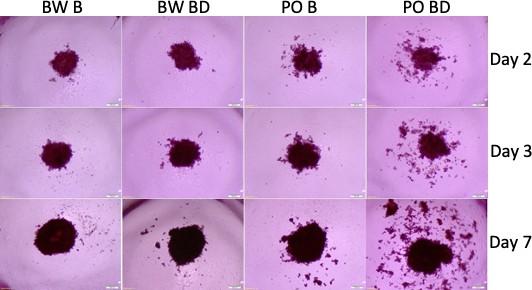
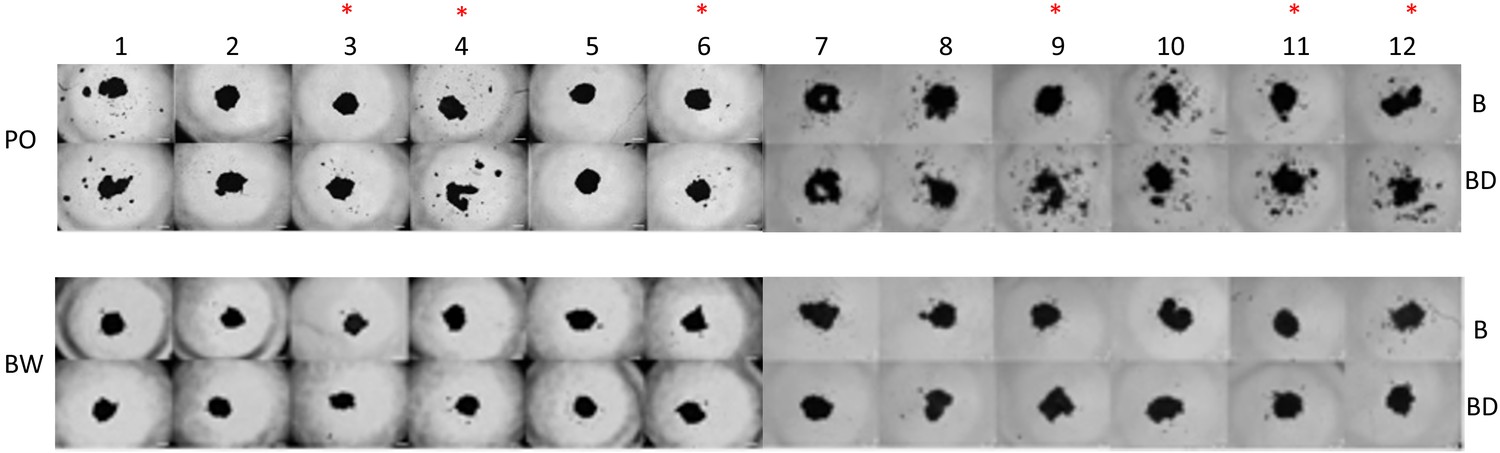
Morphology of tumor spheroids formed after 2, 3, and 7 days in culture with sera isolated from monogamous P. polionotus and polygamous P. maniculatus. In 6 of 12 P. polionotus but none of 12 P. maniculatus enhanced dispersion was noted at bond disruption. For the experiment, sera were obtained from the same animal at bonding for 12 months and after 1 week following bond disruption. Bond-disrupted animals were housed independently after separation from females. BW B, P. maniculatus bonded; BW BD, P. maniculatus bond-disrupted; PO B, P. polionotus bonded; PO BD, P. polionotus bond disrupted.
Figure 4—figure supplement 1
Microsphere morphology of A549 human lung cancer cells cultured in P. maniculatus or P. polionotus sera.
Author response image 1
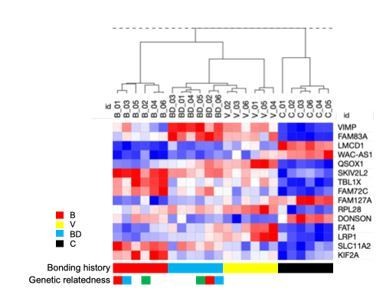
Expression signature of human A549 lung cancer cells cultured in sera from deer mice differing in bonding history.
Author response image 2
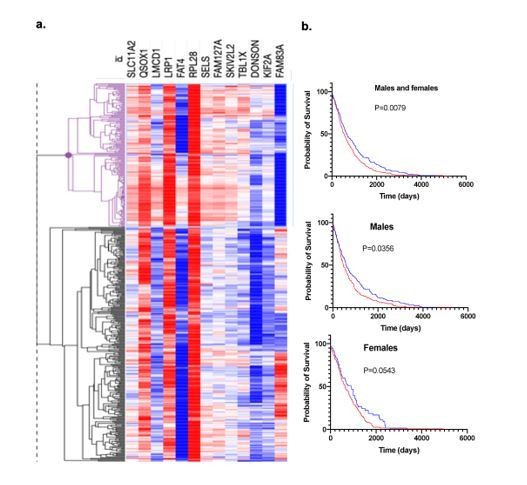
Bonding signature and patients’ prognosis.
a. Hierarchical clustering of lung cancer patients from TCGA based on the 13 genes signature and survival. b. Survival probability of the two groups of TCGA lung cancer patients that emerged by using the 13 gene signature.
Tables
Table 1
Differentially expressed genes between the B, BD, and V groups.
Chromosomal location, fold change (log2), and adjusted p-value are indicated. Genes that are common in the B vs BD and V vs B comparisons are underlined.
| Symbol | Chr | log2 fold change | Adj.pval |
|---|---|---|---|
| BD vs B | |||
| FGG | 4q32.1 | 1.49 | 8.82e-04 |
| FGA | 4q31.3 | 1.37 | 8.82e-04 |
| FGB | 4q31.3 | 1.24 | 2.78e-03 |
| HES1 | 3q29 | 1.16 | 3.36e-06 |
| NR4A1 | 12q13.13 | 1.13 | 1.42e-09 |
| SOCS3 | 17q25.3 | 1.09 | 4.39e-10 |
| ZFP36 | 19q13.2 | 1.02 | 1.77e-03 |
| V vs B | |||
| CTGF | 6q23.2 | 1.26 | 5.68e-02 |
| HES1 | 3q29 | 1.18 | 2.26e-06 |
| ZFP36 | 19q13.2 | 1.16 | 9.80e-05 |
| NR4A1 | 12q13.13 | 1.12 | 3.41e-09 |
| FGG | 4q32.1 | 1.08 | 5.39e-02 |
| JUN | 1p32.1 | 1.04 | 3.36e-02 |
| SOCS3 | 17q25.3 | 1.04 | 3.54e-09 |
Table 2
Biological processes associated with the differentially expressed genes in B vs BD and V vs B groups (He et al., 2003).
The adjusted p-values are indicated.
| Group comparison | Adj.pval | Biological process |
|---|---|---|
| BD vs B | 3.1e-06 | Positive regulation of substrate adhesion-dependent cell spreading |
| V vs B | 4.9e-04 | Blood vessel development |
| 5.3e-04 | Positive regulation of intracellular signal transduction | |
| 5.3e-04 | Anatomical structure morphogenesis | |
| 5.3e-04 | Regulation of cellular protein metabolic process | |
| 5.3e-04 | Negative regulation of apoptotic process | |
| 5.3e-04 | Positive regulation of cell differentiation | |
| 5.3e-04 | Regulation of epithelial cell proliferation |
Additional files
Download links
A two-part list of links to download the article, or parts of the article, in various formats.
Downloads (link to download the article as PDF)
Open citations (links to open the citations from this article in various online reference manager services)
Cite this article (links to download the citations from this article in formats compatible with various reference manager tools)
Persistent effects of pair bonding in lung cancer cell growth in monogamous Peromyscus californicus
eLife 10:e64711.
https://doi.org/10.7554/eLife.64711


