Distinct but overlapping roles of LRRTM1 and LRRTM2 in developing and mature hippocampal circuits
- Neuroscience Research Program, Kleysen Institute for Advanced Medicine, Health Sciences Centre, Canada
- Department of Physiology and Pathophysiology, University of Manitoba, Canada
- Department of Psychiatry and Djavad Mowafaghian Centre for Brain Health, University of British Columbia, Canada
- Department of Biology, York University, Canada
- Department of Cellular and Physiological Sciences, University of British Columbia, Canada
- Department of Molecular Neurobiology, Max Planck Institute for Multidisciplinary Sciences, Germany
- Division of Pathogenetic Signaling, Department of Biochemistry and Molecular Biology, Kobe University Graduate School of Medicine, Japan
- Department of Gerontology, Laboratory of Molecular Life Science, Institute of Biomedical Research and Innovation, Foundation for Biomedical Research and Innovation at Kobe, Japan
- Department of Pharmacology, Gunma University Graduate School of Medicine, Japan
- Division of Neurology, Department of Medicine and Djavad Mowafaghian Centre for Brain Health, University of British Columbia, Canada
- Department of Pharmacology and Therapeutics, University of Manitoba, Canada
- The Children's Hospital Research Institute of Manitoba, Canada
- Program in Biomedical Engineering, University of Manitoba, Canada
Figures
Figure 1 with 3 supplements
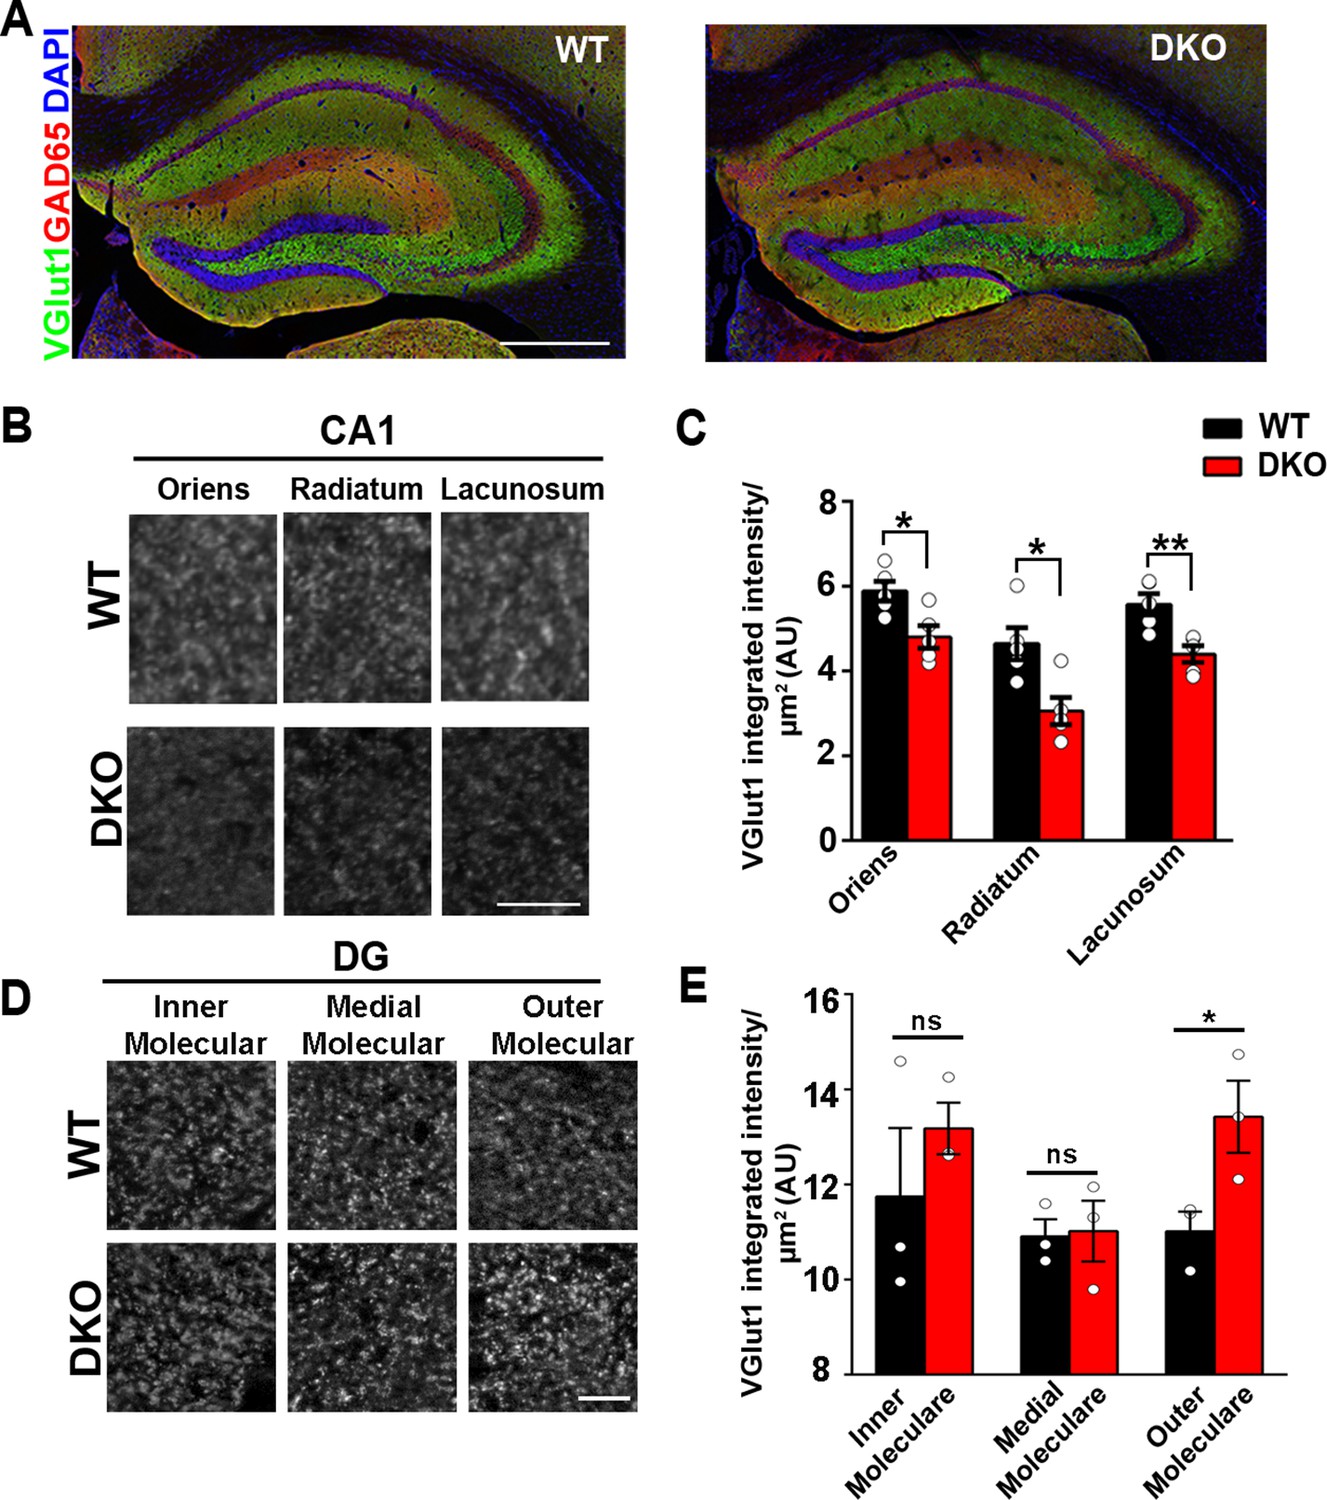
LRRTM1 and LRRTM2 control excitatory presynapse development in the hippocampus.
(A) Confocal immunofluorescence images for VGlut1, GAD65 and the nuclear marker DAPI revealed normal hippocampal morphology and large-scale synaptic organization in LRRTM1/2-DKO mice compared with wild-type (WT) mice. Scale bar is 500 µm. (B and D) High-resolution confocal images revealed a reduction in punctate immunofluorescence for the excitatory presynapse marker VGlut1 in the CA1 dendritic layers oriens, radiatum and lacunosum, and increase in outer molecular layer of dentate gyrus (DG) in LRRTM1/2-DKO mice as compared with WT mice at 6 weeks postnatal. Scale bar is 10 µm for (B) and 20 µm for (D). (C and E) Quantitation of VGlut1 punctate integrated intensity per tissue area (Multiple t-test, *p<0.05, **p<0.01 comparing LRRTM1/2-DKO and wild-type mice for CA1 and DG, n=3–5 mice each after averaging data from 6 sections per mouse). Data presented as mean ± SEM.
-
Figure 1—source data 1
Source data related to Figure 1B, C.
- https://cdn.elifesciences.org/articles/64742/elife-64742-fig1-data1-v1.xlsx
-
Figure 1—source data 2
Source data related to Figure 1D, E.
- https://cdn.elifesciences.org/articles/64742/elife-64742-fig1-data2-v1.xlsx
Figure 1—figure supplement 1
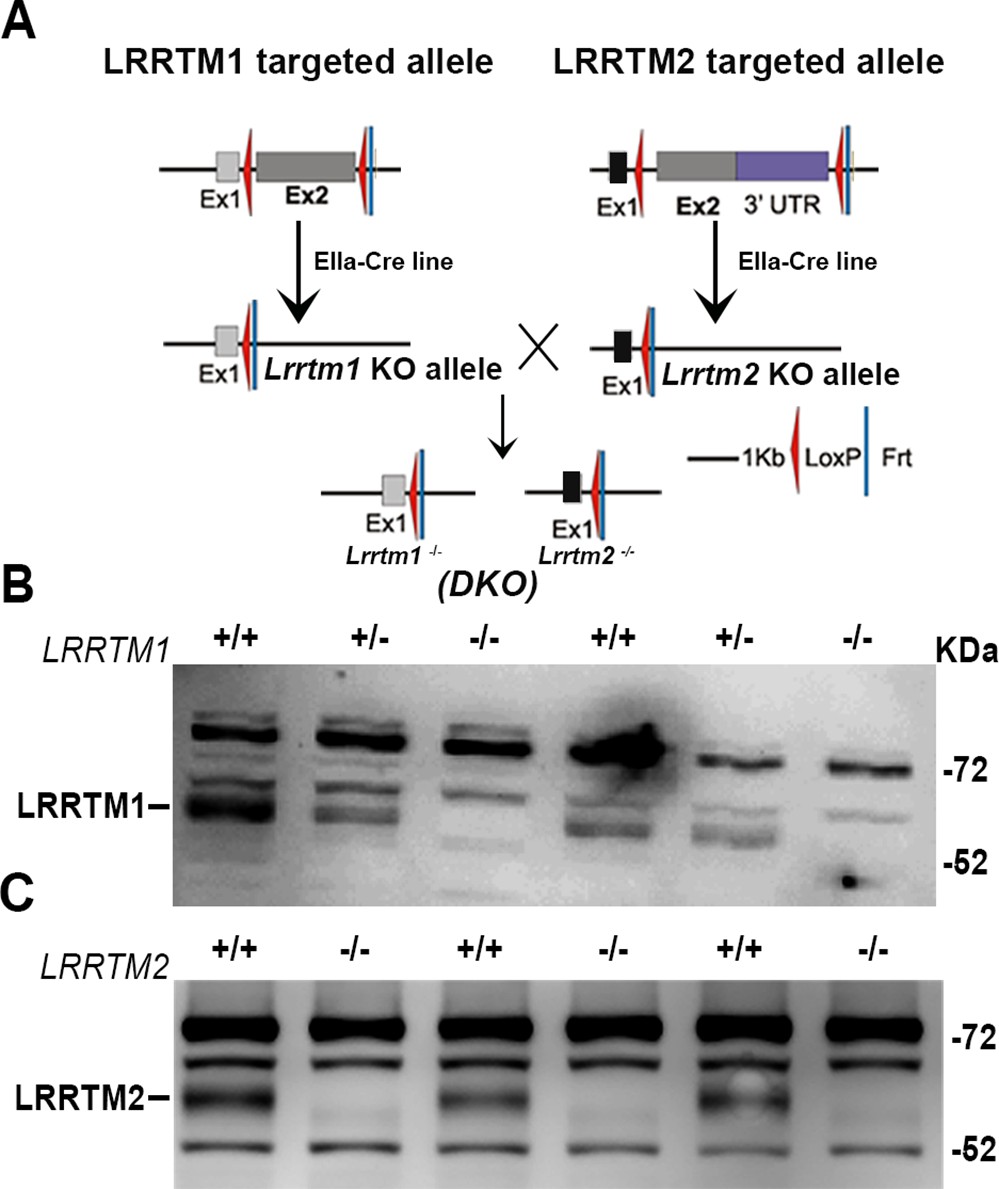
LRRTM1/2-DKO generation and confirmation of loss of LRRTM1 and LRRTM2.
(A) LRRTM1/2-DKO mice generation scheme. (B) Western blot images confirming complete loss of LRRTM1 in LRRTM1/2-DKO mice brain homogenate. (C) Western blot images confirming complete loss of LRRTM2 in LRRTM1/2-DKO mice brain homogenate.
-
Figure 1—figure supplement 1—source data 1
Figure 1—figure supplement 1 source blots.
- https://cdn.elifesciences.org/articles/64742/elife-64742-fig1-figsupp1-data1-v1.zip
Figure 1—figure supplement 2
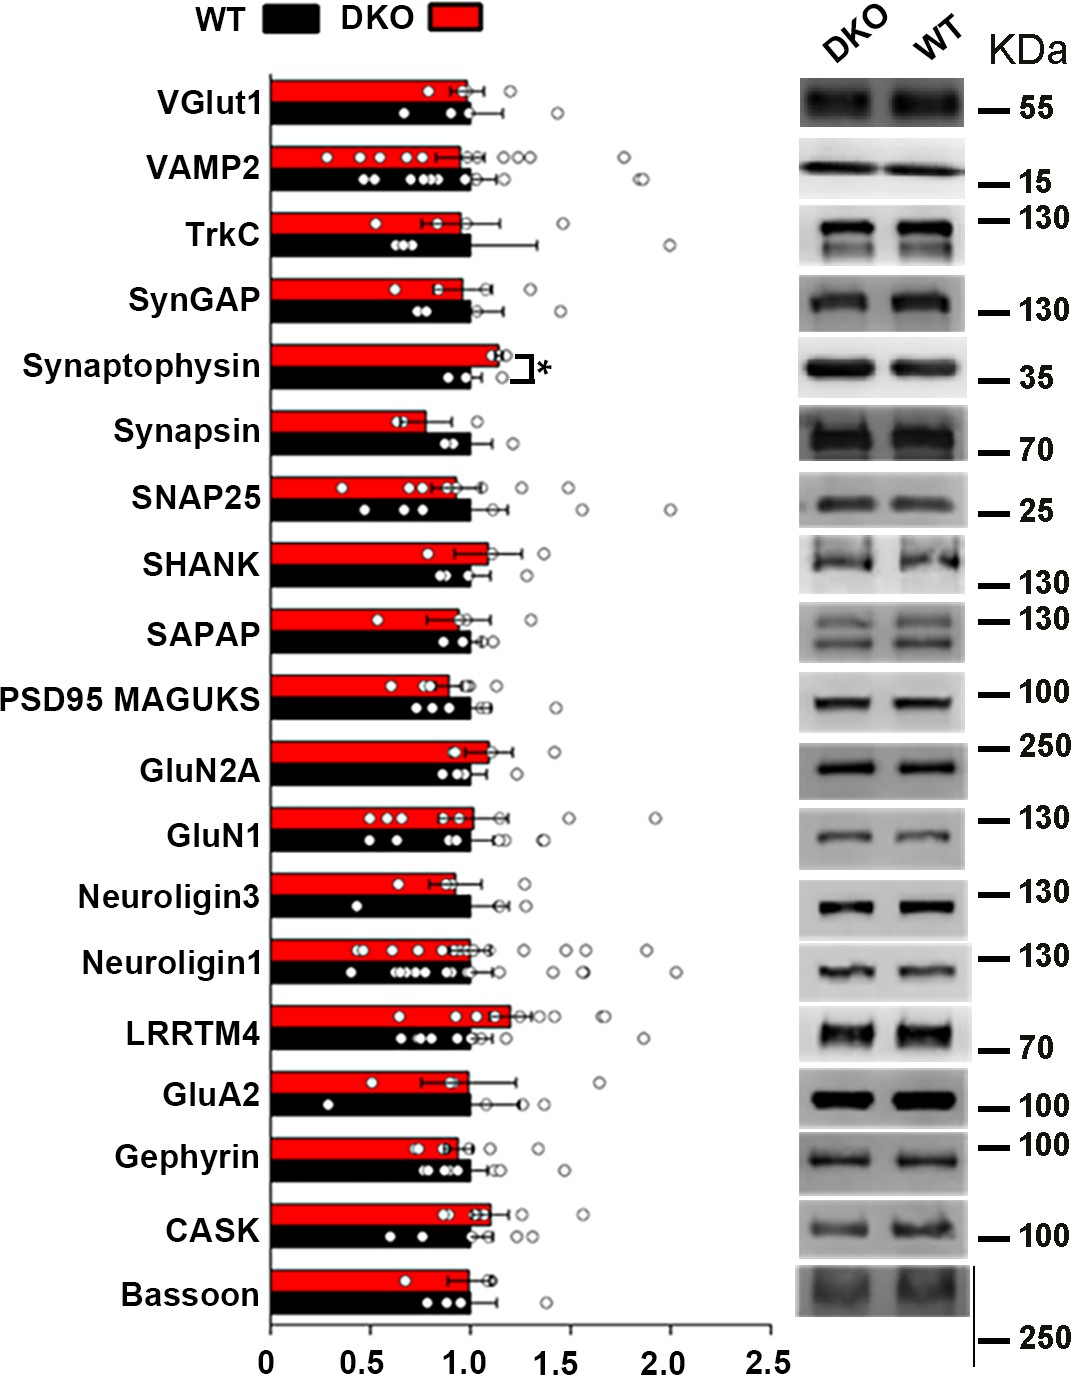
Levels of synaptic proteins in crude synaptosomal brain fractions of LRRTM1/2-DKO mice.
(A) LRRTM1/2-DKO mice had unaltered levels of most synaptic proteins in crude synaptosome fractions as compared with wild type (WT) mice. A small but significant increase in synaptophysin levels was observed (Student’s t-test, *p<0.05, n=4 WT and n=3 LRRTM1/2-DKO). Values are shown as mean ± SEM and were normalized to β-actin loading control. (B) Representative immunoblots of crude synaptosome fractions probed for synaptic vesicle proteins VGlut1 (n=3 WT and n=4 LRRTM1/2-DKO), VAMP2 (n=12 mice for each group), synaptophysin and synapsin (n=3 mice for each group), synaptic adhesion molecules TrkC (n=4 mice for each group), neuroligin 1(n=16 mice for each group), neuroligin 3 (n=4 mice for each group), and LRRTM4 (n=10 mice for each group), postsynaptic scaffolding proteins SynGAP (n=4 mice for each group), SHANK (n=4 WT and n=3 LRRTM1/2-DKO), SAPAP (n=4 mice for each group), PSD-95 family (n=6 WT and n=7 LRRTM1/2-DKO) and gephyrin (n=8 mice for each group), active zone proteins SNAP-25 (n=8 mice for each group), CASK (n=6 WT and n=7 LRRTM1/2-DKO) and bassoon (n=4 mice for each group) and excitatory neurotransmitter receptor subunits GluN2A (n=4 mice for each group), GluN1 (n=8 mice for each group) and GluA2 (n=4 mice for each group). All blots were re-probed for β-actin as loading control.
-
Figure 1—figure supplement 2—source data 1
Figure 1—figure supplement 2 source blots.
- https://cdn.elifesciences.org/articles/64742/elife-64742-fig1-figsupp2-data1-v1.zip
-
Figure 1—figure supplement 2—source data 2
Figure 1—figure supplement 2 source data.
- https://cdn.elifesciences.org/articles/64742/elife-64742-fig1-figsupp2-data2-v1.xlsx
Figure 1—figure supplement 3
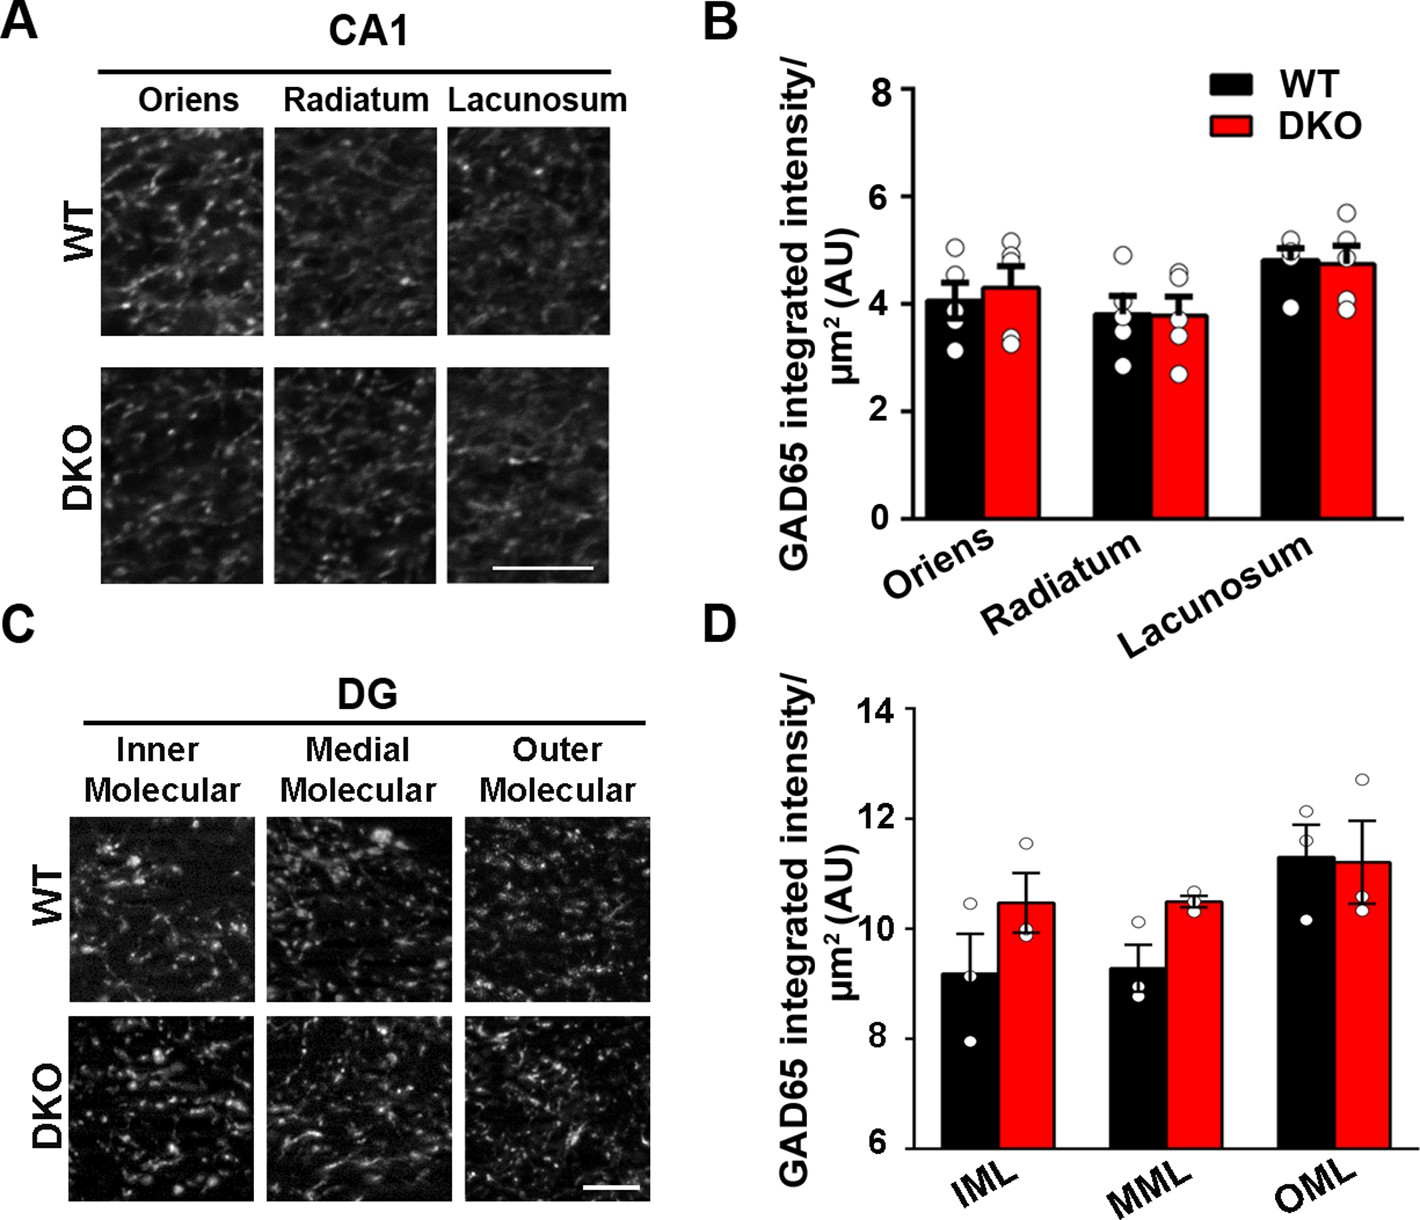
Inhibitory presynapse development is unaltered in CA1 and DG of LRRTM1/2-DKO.
(A and C) High-resolution confocal images revealed no reduction in punctate immunofluorescence for the inhibitory presynapse marker GAD65 in the CA1 dendritic layers and DG molecular layers in LRRTM1/2-DKO mice as compared with WT mice at 6 weeks postnatal. Scale bar is 5 µm. (B and D) Quantitation of GAD65 punctate integrated intensity per tissue area (Multiple t-test comparing LRRTM1/2-DKO and wild-type mice for CA1 and DG, n=3–5 mice each after averaging data from 6 sections per mouse). Data presented as mean ± SEM.
-
Figure 1—figure supplement 3—source data 1
Figure 1—figure supplement 3 source data related to 1B.
- https://cdn.elifesciences.org/articles/64742/elife-64742-fig1-figsupp3-data1-v1.xlsx
-
Figure 1—figure supplement 3—source data 2
Figure 1—figure supplement 3 source data related to 1D.
- https://cdn.elifesciences.org/articles/64742/elife-64742-fig1-figsupp3-data2-v1.xlsx
Figure 2
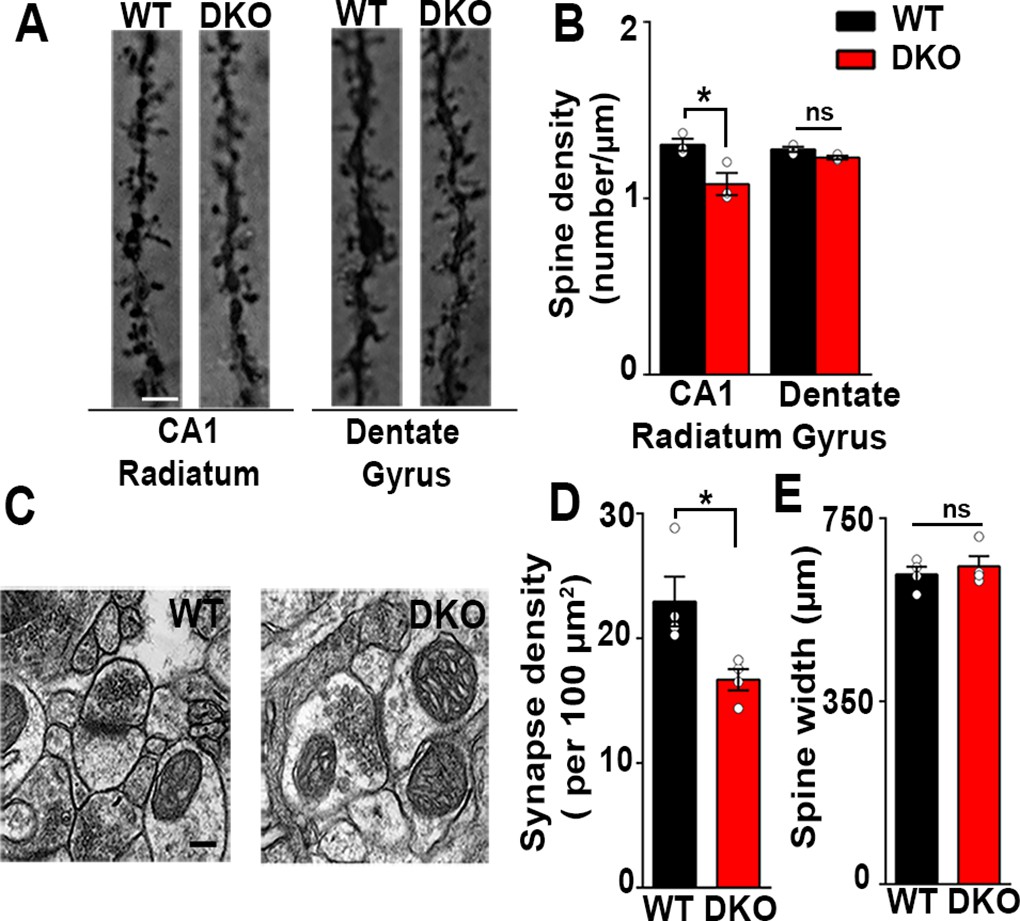
Excitatory synapses are reduced in the CA1 of LRRTM1/2-DKOs.
(A) Golgi staining revealed a reduced density of dendritic spines in CA1 radiatum in the LRRTM1/2-DKO mice as compared with wild-type (WT) mice at 6 weeks postnatal. No differences were observed between genotypes in hippocampal dentate gyrus granule cell medial molecular layer. Scale bar is 1 µm. (B) Quantitation of dendritic spine density along CA1 radiatum and dentate gyrus medial molecular layer dendrites (Two-way ANOVA p<0.0001, *p<0.001, comparing LRRTM1/2-DKO and wild-type mice for each region by Bonferroni posthoc test, n=3 mice each for radiatum and n=3 mice each for outer molecular layer). (C) Representative electron micrographs from CA1 radiatum of wild-type (WT) and LRRTM1/2-DKO mice, scale bar 100 nm. (D) Quantitation of asymmetric synapse density (Student’s t test *p=0.0394, n=4 mice each at 6 weeks postnatal). (E) Quantitation of spine width, Student’s t test (p=0.3533, n=4 mice each at 6 weeks postnatal).
-
Figure 2—source data 1
Source data for Figure 2A, B.
- https://cdn.elifesciences.org/articles/64742/elife-64742-fig2-data1-v1.xlsx
-
Figure 2—source data 2
Source data for Figure 2D,E.
- https://cdn.elifesciences.org/articles/64742/elife-64742-fig2-data2-v1.xlsx
Figure 3

Excitatory synapse function is differentially altered in the CA1 and DG of LRRTM1/2-DKO mice.
(A and D) Representative mEPSC recordings from wild-type (WT) and LRRTM1/2-DKO hippocampus CA1 pyramidal neurons and DG granule cells. (B and C) Cumulative distributions of mEPSC inter-event intervals (B) and amplitudes (C) in wild-type and LRRTM1/2-DKO neurons. Insets display mean ± SEM for mEPSC frequency (B) and amplitude (C) in CA1 pyramidal cells, respectively. Double knockout of Lrrtm1 and Lrrtm2 decreased mEPSC frequency, Student’s t-test, **p=0.0090, without affecting mEPSC amplitude, p=0.6873, n=10–11 neurons per group, three mice each. (E and F) Cumulative distributions of mEPSC inter-event intervals (E) and amplitudes (F) in wild-type and LRRTM1/2-DKO DG granule cells. Insets display mean ± SEM for mEPSC frequency (E) and amplitude (F) in DG granule cells, respectively. Double knockout of Lrrtm1 and Lrrtm2 increased mEPSC frequency, Student’s t-test, ***p=0.0004, without affecting mEPSC amplitude, p=0.4731, n=11–15 neurons per group, three mice each.
-
Figure 3—source data 1
Source data for Figure 3B, C.
- https://cdn.elifesciences.org/articles/64742/elife-64742-fig3-data1-v1.xlsx
-
Figure 3—source data 2
Source data for Figure 3E, F.
- https://cdn.elifesciences.org/articles/64742/elife-64742-fig3-data2-v1.xlsx
Figure 4 with 1 supplement

Impaired hippocampal LTP with hippocampal dependent memory in LRRTM1/2-DKO mice.
(A) The maintenance of long-term potentiation (LTP) is reduced in LRRTM1/2-DKO mouse CA1. Inset: representative fEPSP recordings from wild-type and LRRTM1/2-DKO stratum radiatum CA3-CA1 synapses in acute hippocampal slices taken 10 min into baseline and 55 min after high-frequency stimulation (HFS; 1 sec at 100 Hz). (B) Comparisons of average fEPSP% values LRRTM1/2-DKO and WT mice, (Student’s t-test **p=0.0071, n=10–12 slices per group, three mice each). (C) Diagrammatic representation of contextual fear conditioning protocol where freezing was recorded in both LRRTM1/2-DKO and control groups of mice 24 hr after receiving single (0.7 mA) shocks paired with the contextual conditioning chamber. (D) Contextual memory is impaired in LRRTM1/2-DKO mice. Percentage of time spent freezing following contextual fear conditioning (CFC) training was compared between WT and LRRTM1/2-DKO mice. LRRTM1/2-DKO showed significantly reduced levels of freezing when exposed to the CFC chamber 24 hr after initial training (Student’s t-test, *p=0.0189, n=10 mice for WT and n=16 mice for LRRTM1/2-DKO).
-
Figure 4—source data 1
Source data for Figure 4A, B.
- https://cdn.elifesciences.org/articles/64742/elife-64742-fig4-data1-v1.xlsx
-
Figure 4—source data 2
Figure 4D source data.
- https://cdn.elifesciences.org/articles/64742/elife-64742-fig4-data2-v1.xlsx
Figure 4—figure supplement 1
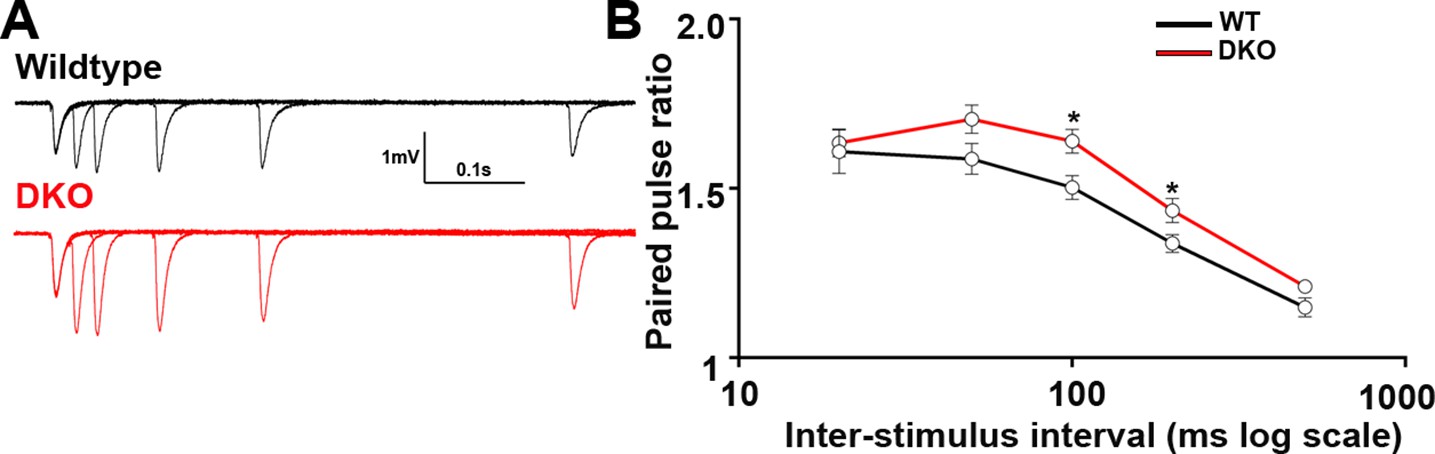
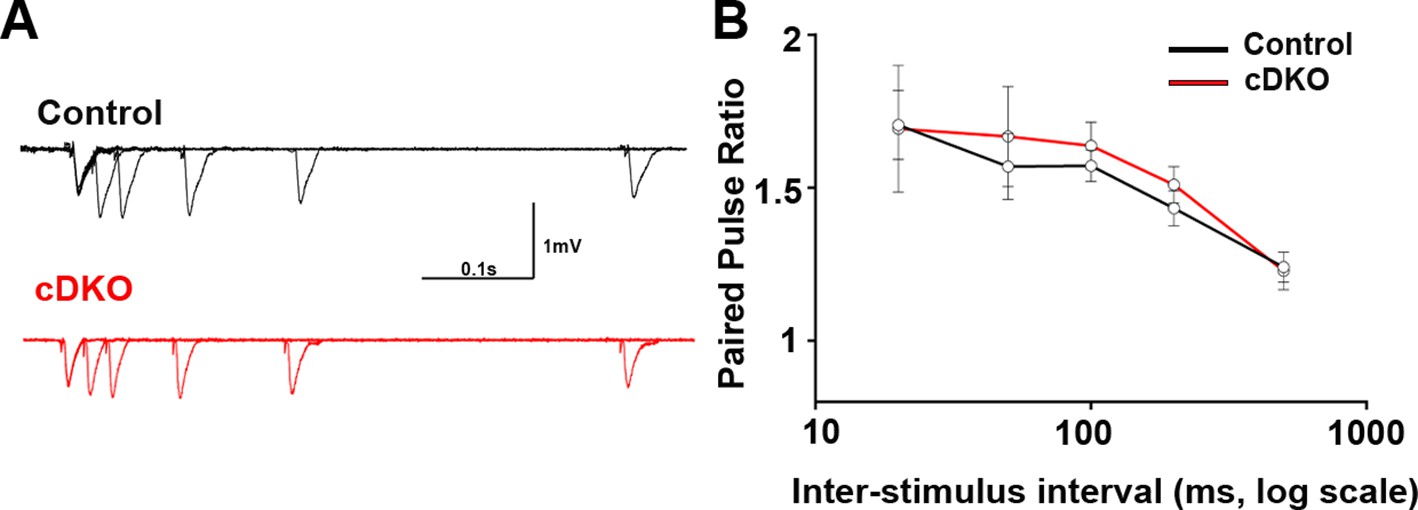
Presynaptic function in CA1 of LRRTM1/2-DKO mice.
(A) Representative traces of five pairs of pulses that were delivered to CA3-CA1 synapses at 20, 50, 100, 200, and 500 ms of LRRTM1/2-DKO and littermate wildtype mice. (B) Summary graph of paired-pulse ratios at various inter-stimulus intervals for wild-type and LRRTM1/2-DKO mice (Multiple t-test, *p>0.05, n=12 slices per group, three mice each).
-
Figure 4—figure supplement 1—source data 1
Figure 4—figure supplement 1 source data.
- https://cdn.elifesciences.org/articles/64742/elife-64742-fig4-figsupp1-data1-v1.xlsx
Figure 5 with 1 supplement

Excitatory synapse function is impaired in the CA1 of P0-CA1-LRRTM1/2-cDKO mice.
(A) Representative mEPSC recordings from control and P0 LRRTM1/2-cDKO hippocampal CA1 pyramidal neurons. (B and C) Cumulative distributions of mEPSC inter-event intervals (B) and amplitudes (C) in control and P0-CA1-LRRTM1/2-cDKO neurons. Insets display mean ± SEM for mEPSC frequency (B) and amplitude (C) in CA1 pyramidal cells, respectively. Double knockout of Lrrtm1 and Lrrtm2 at P0 decreased mEPSC frequency and amplitude (Student’s t-test, *p=0.0157 for frequency and **p=0.0026 for amplitude, n=12–13 per group, three mice each).
-
Figure 5—source data 1
Figure 5 source data for 5B and C.
- https://cdn.elifesciences.org/articles/64742/elife-64742-fig5-data1-v1.xlsx
Figure 5—figure supplement 1
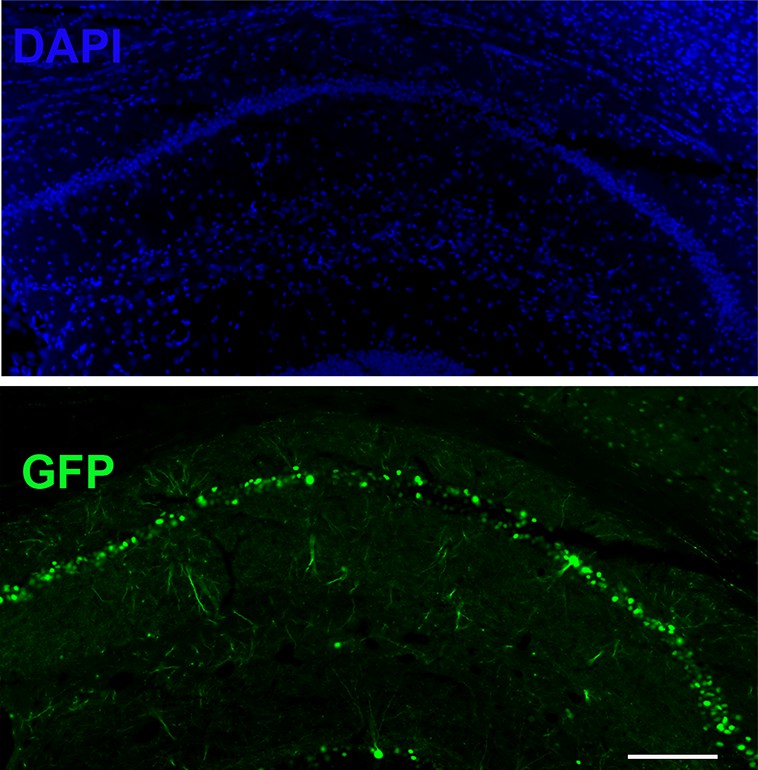
Region-specific injection in CA1 of LRRTM1/2floxed/floxed mice in P0 pups to obtain P0-CA1-LRRTM1/2-cDKO mice.
Region specific injection in CA1 of dorsal hippocampus with AAV8-hSYN-Cre-eGFP of P0 LRRTM1/2floxed/floxed mice to obtain a knockout of LRRTM1 and LRRTM2 in CA1 pyramidal neurons. Scale bar is 200 µm.
Figure 6 with 2 supplements
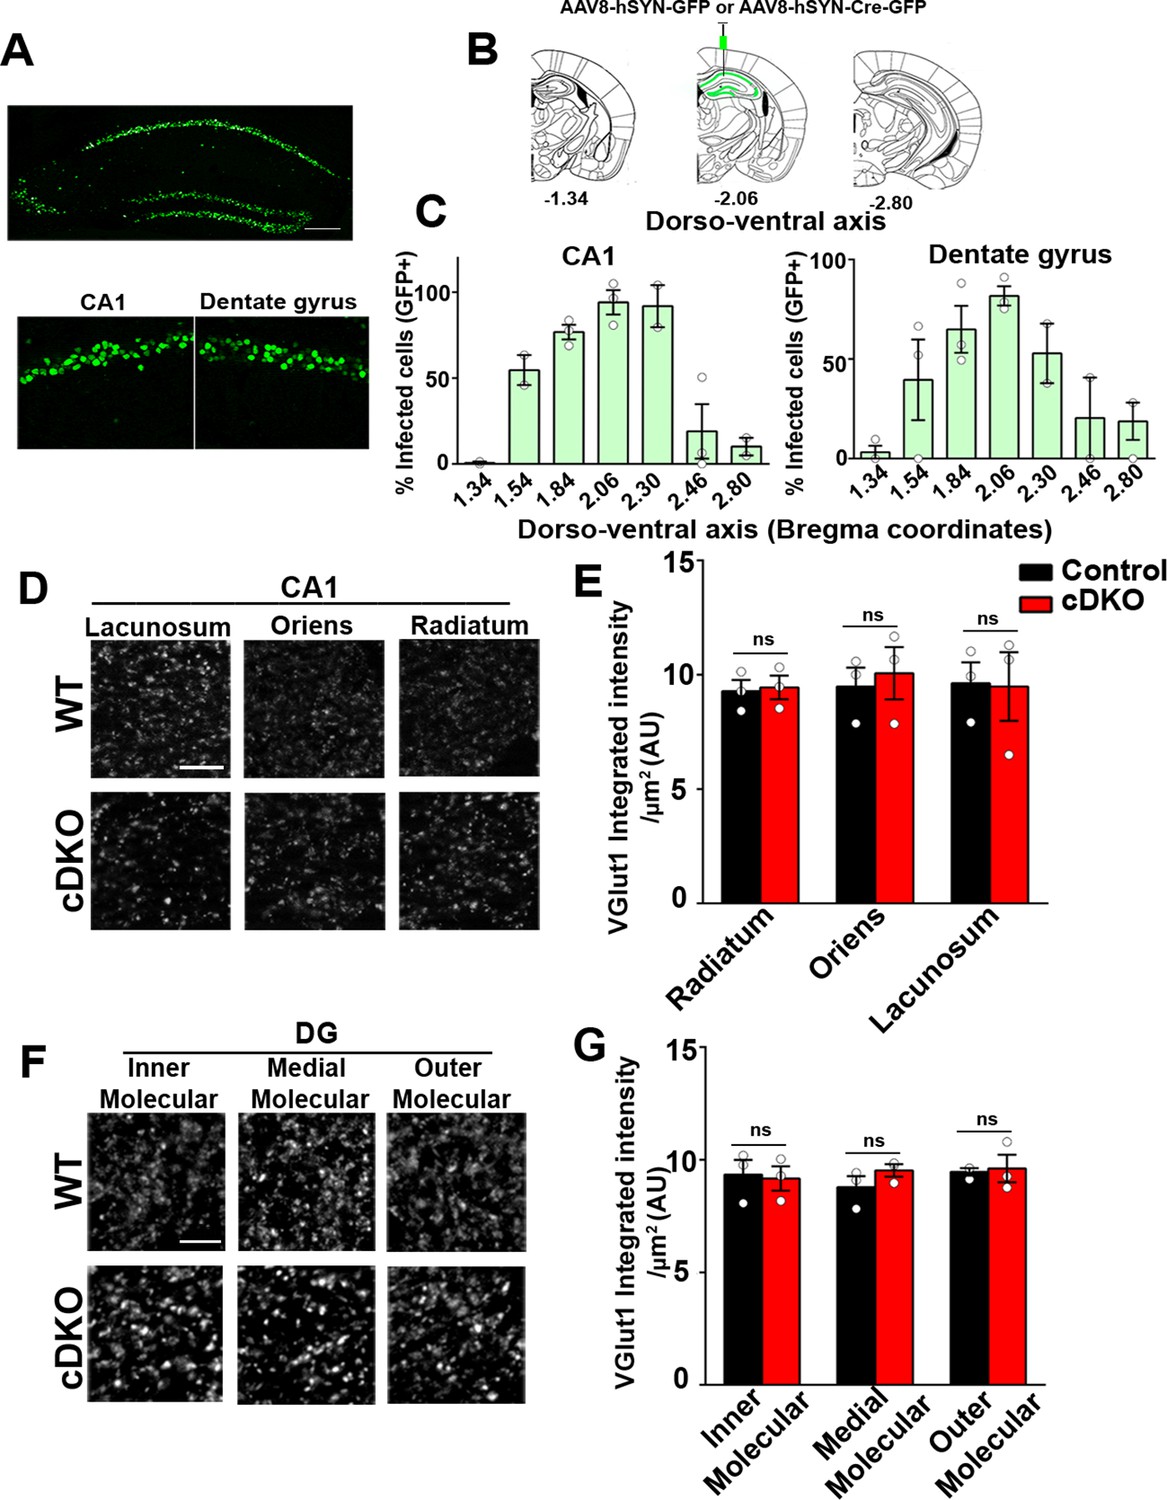
Excitatory presynapse development is unaltered in CA1 dendritic layers and DG molecular layers of LRRTM1/2-cDKO.
(A) Representative image of dorsal hippocampus (injection site) with infected CA1 and dentate gyrus neurons (green) from AAV8-hSYN-Cre-eGFP. Below, zoomed in images of the dorsal CA1 and dentate gyrus. Scale bar is 20 µm. (B) Representative images of whole brain (modified from Allen Brain Institute) showing bregma points −1.34, –2.06, and –2.80, with 2.06 AP as the injection site in LRRTM1/2-cDKO mice and controls. (C) Percent infected cells (Number of GFP +neurons / Number of DAPI +neurons) across the dorso-ventral axis for CA1 and dentate gyrus. (D and F) High-resolution immunofluorescence of VGlut1 punctate was unaltered in the dendritic layers of CA1 and DG molecular layers in LRRTM1/2-cDKO mice as compared with control mice. Scale bar is 5 µm. (E and G) Quantitation of VGlut1 punctate integrated intensity per tissue area, (Multiple t-test, n=3 mice each after averaging data from 6 sections per mouse). Data presented as mean ± SEM.
-
Figure 6—source data 1
Figure 6 source data for 6C.
- https://cdn.elifesciences.org/articles/64742/elife-64742-fig6-data1-v1.xlsx
-
Figure 6—source data 2
Figure 6 source data for 6DG.
- https://cdn.elifesciences.org/articles/64742/elife-64742-fig6-data2-v1.xlsx
Figure 6—figure supplement 1
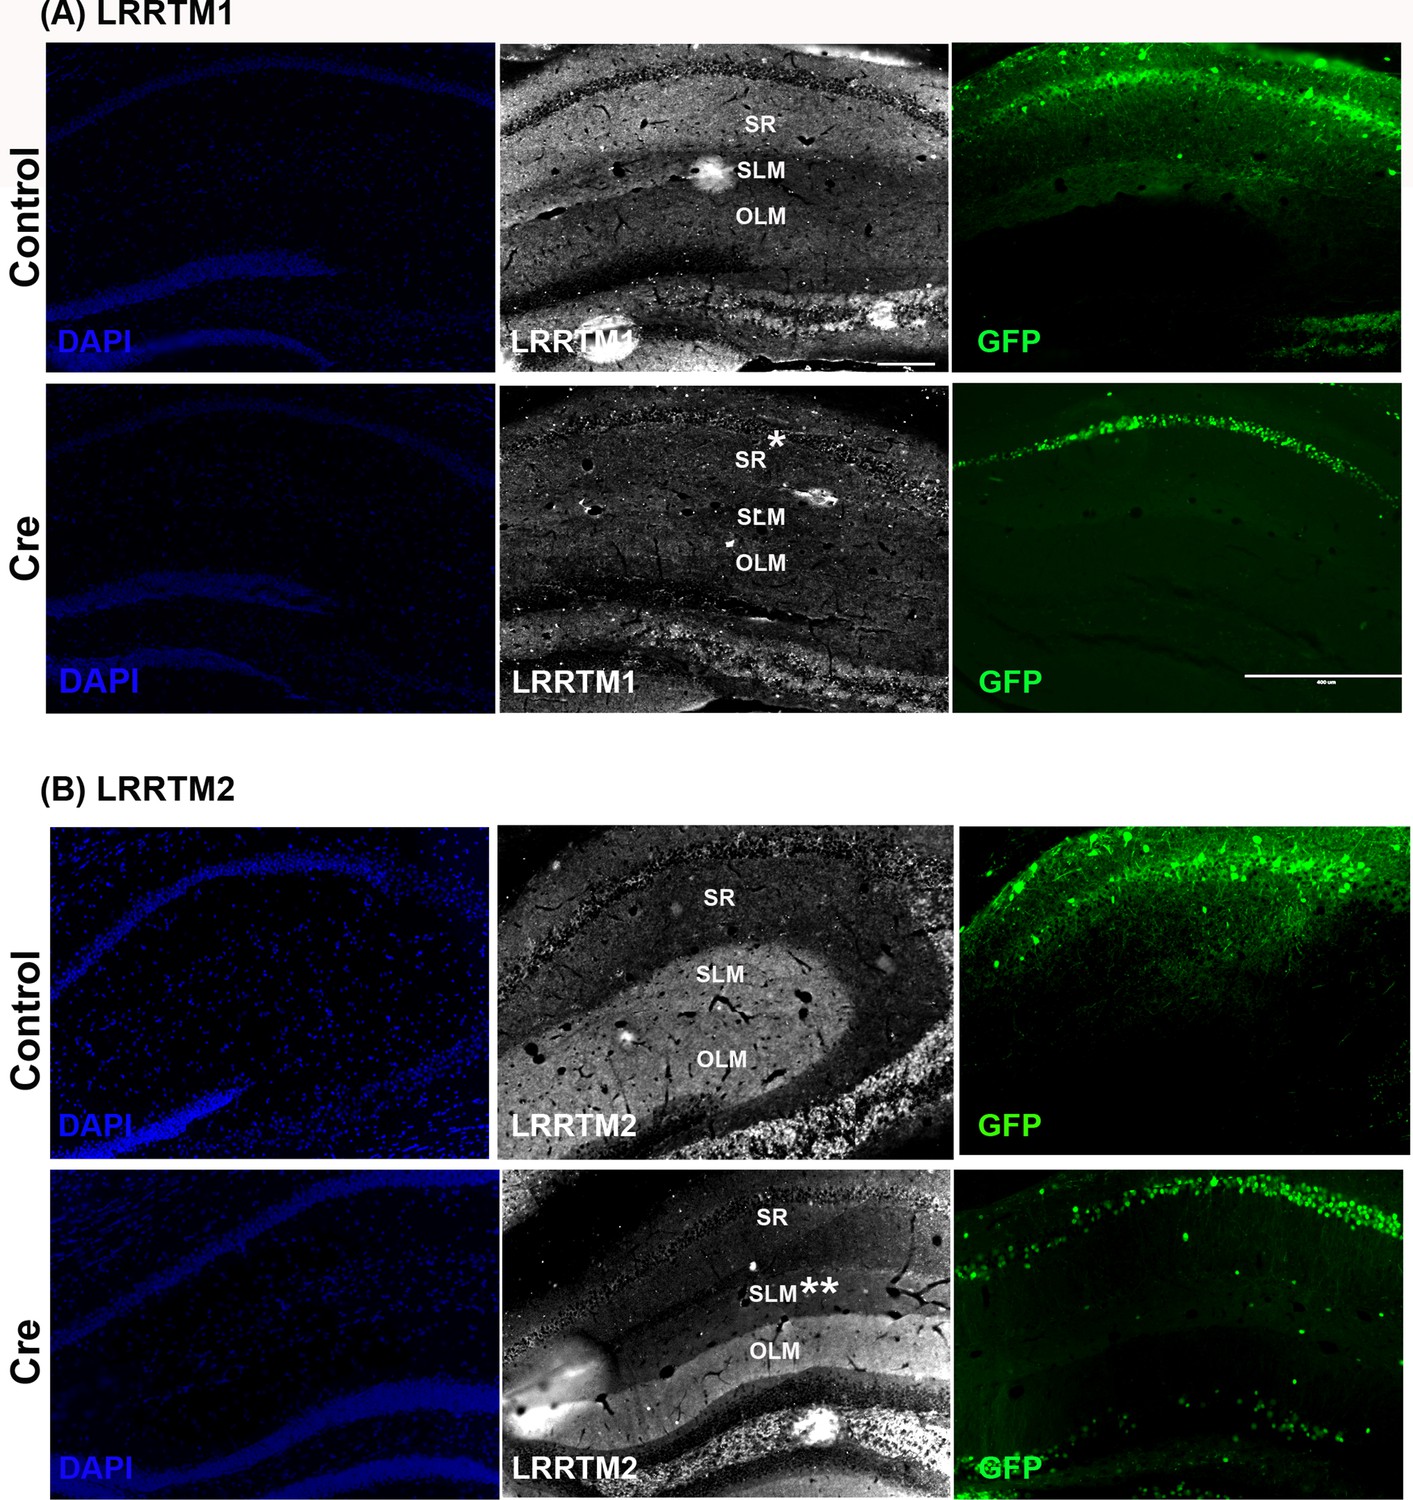
LRRTM1 and LRRTM2 knockout confirmation.
Representative images of LRRTM1 (A) and LRRTM2 (B) in the dorsal hippocampus showing their expression in the CA1 dendritic layers. (A) LRRTM1 is preferentially expressed in stratum radiatum (SR, top). AAV8-hSYN-Cre-GFP expression in the CA1 of dorsal hippocampus leads to reduced levels of LRRTM1 in the SR (*, bottom). (B) LRRTM2 is preferentially expressed in stratum lacunosum moleculare (SLM) of the CA1 and the outer molecular layer of dentate gyrus (top). AAV8-hSYN-Cre-GFP expression in the CA1 of dorsal hippocampus leads to reduced levels of LRRTM2 in the SLM (**) but not in the untargeted dentate gyrus OLM (control). Note that only native GFP is captured in (A) and (B). Some of the native GFP fluorescence was not captured due to low intensity exposure. Scale bar is 200 µm for all panels except GFP panel for (A) which is 100 µm.
Figure 6—figure supplement 2
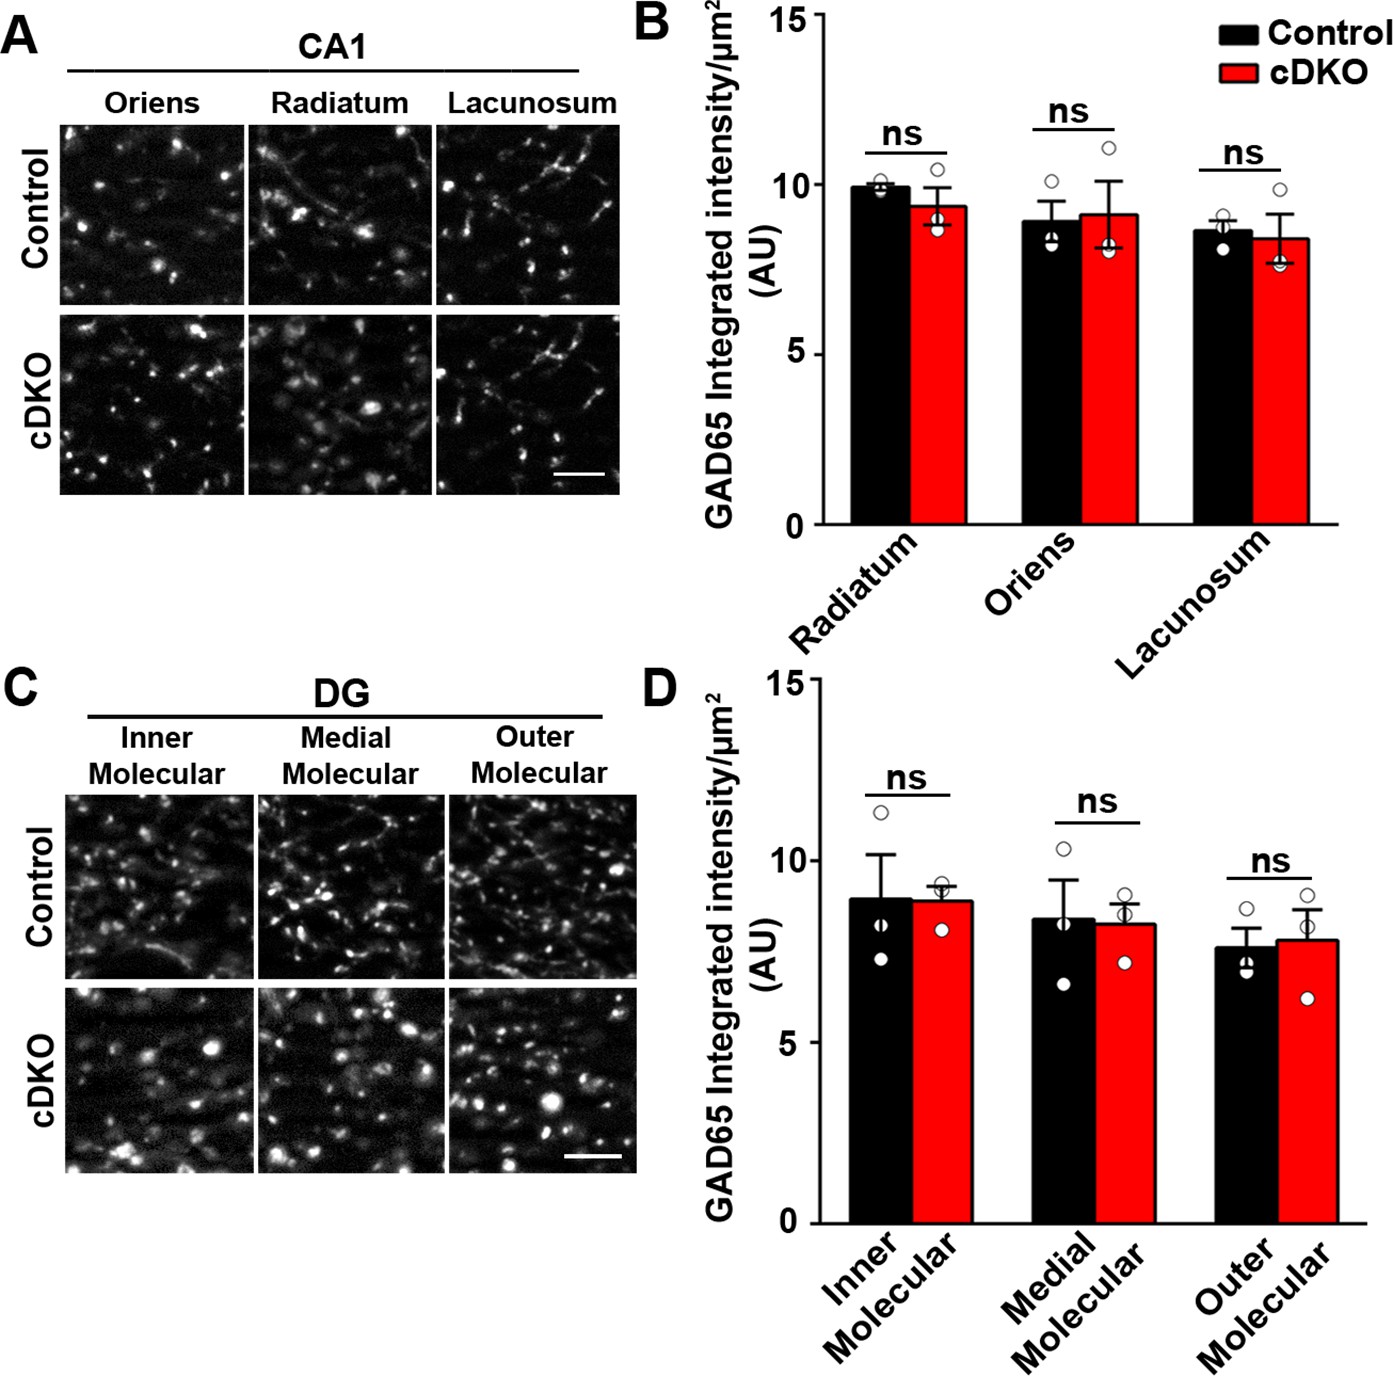
Inhibitory presynapse development is unaltered in CA1 and DG of LRRTM1/2-cDKO mice.
(A and C) High-resolution immunofluorescence images of GAD65 punctate was unaltered in the dendritic layers of CA1 and molecular layers of DG in LRRTM1/2-cDKO mice as compared with control mice. Scale bar 5 µm. (B and D) Quantitation of GAD65 punctate integrated intensity per tissue area in CA1 and DG (Multiple t-test, n=3 mice each after averaging data from 6 sections per mouse). Data presented as mean ± SEM.
-
Figure 6—figure supplement 2—source data 1
Figure 6—figure supplement 2 source data.
- https://cdn.elifesciences.org/articles/64742/elife-64742-fig6-figsupp2-data1-v1.xlsx
Figure 7
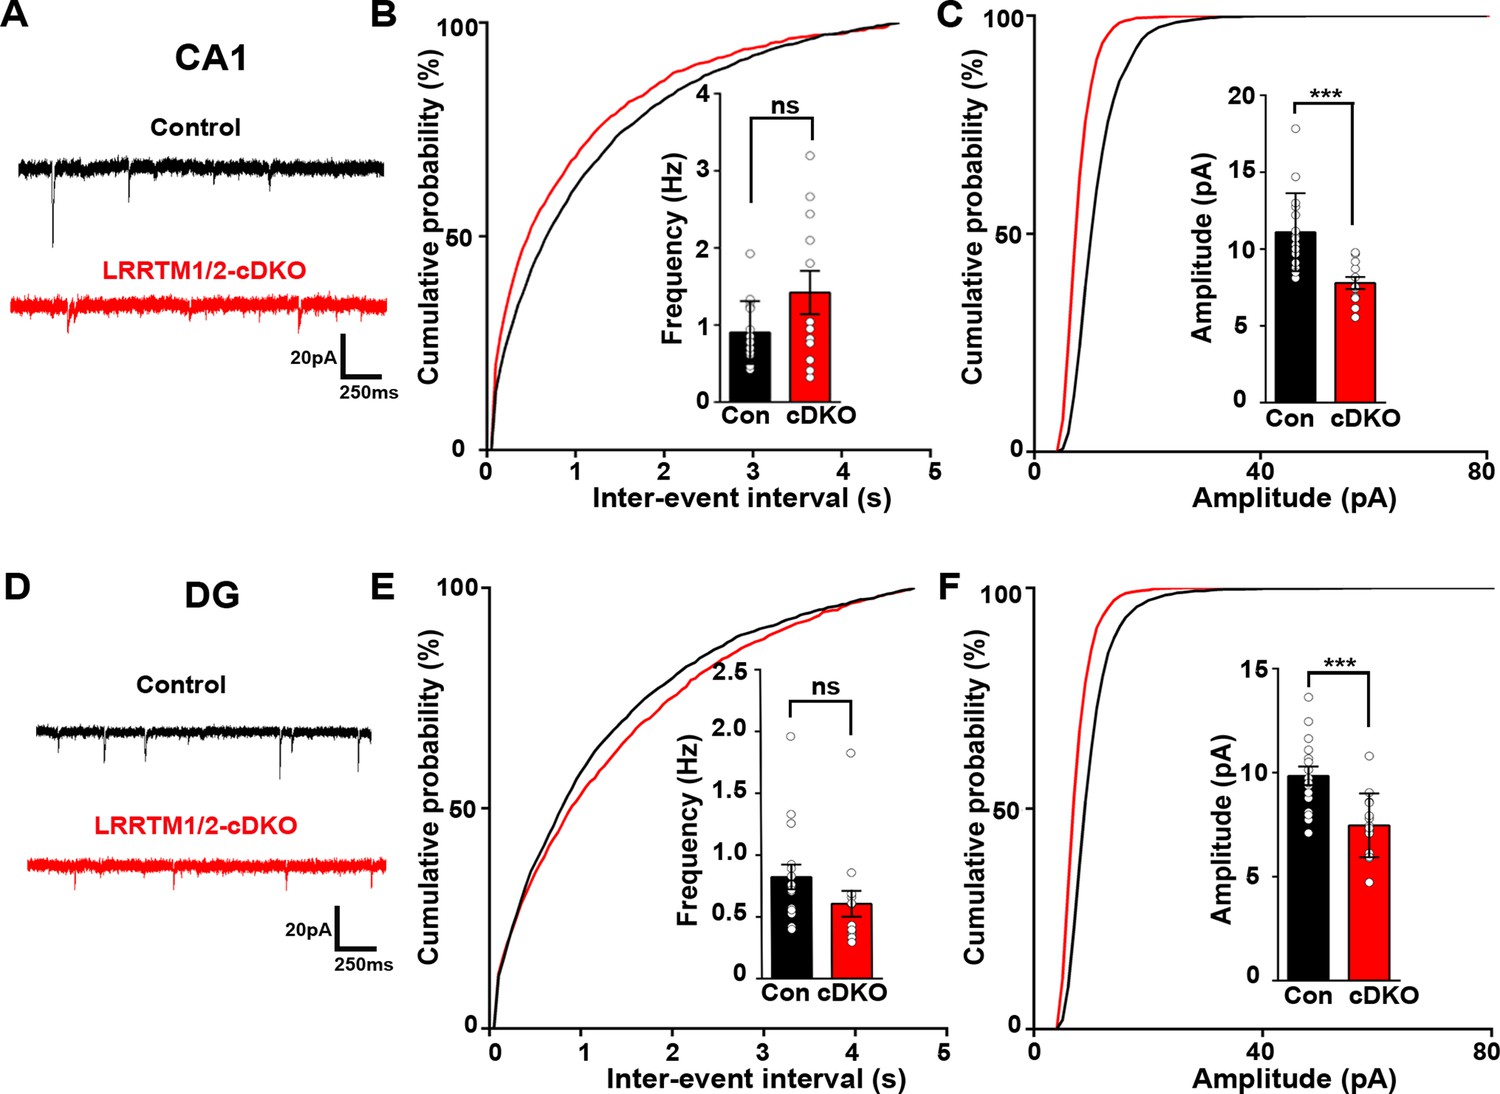
Excitatory synapse function is impaired in the CA1 and DG of LRRTM1/2-cDKO mice.
(A and D) Representative mEPSC recordings from control and LRRTM1/2-DKO hippocampus CA1 pyramidal neurons and DG granule cells. (B and C) Cumulative distributions of mEPSC inter-event intervals (B) and amplitudes (C) in control and LRRTM1/2-DKO CA1 pyramidal neurons. Insets display mean ± SEM for mEPSC frequency (B) and amplitude (C) in CA1 pyramidal cells, respectively. Acute conditional deletion of Lrrtm1 and Lrrtm2 in CA1 decreased mEPSC amplitude (Student’s t-test, ***p=0.0004, without affecting mEPSC frequency, p=0.0651. n=16 neurons for three control mice and n=12 neurons for three LRRTM1/2-cDKO mice). (E and F) Cumulative distributions of mEPSC inter-event intervals (E) and amplitudes (F) in control and LRRTM1/2-cDKO neurons. Insets display mean ± SEM for mEPSC frequency (E) and amplitude (F) in DG granule cells, respectively. Acute conditional deletion of Lrrtm1 and Lrrtm2 in DG decreased mEPSC amplitude (Student’s t-test, ***p=0.0006, without affecting mEPSC frequency, p=0.1444, n=16 neurons for three control mice and n=14 neurons for three LRRTM1/2-cDKO mice).
-
Figure 7—source data 1
Figure 7 source data.
- https://cdn.elifesciences.org/articles/64742/elife-64742-fig7-data1-v1.xlsx
Figure 8 with 1 supplement
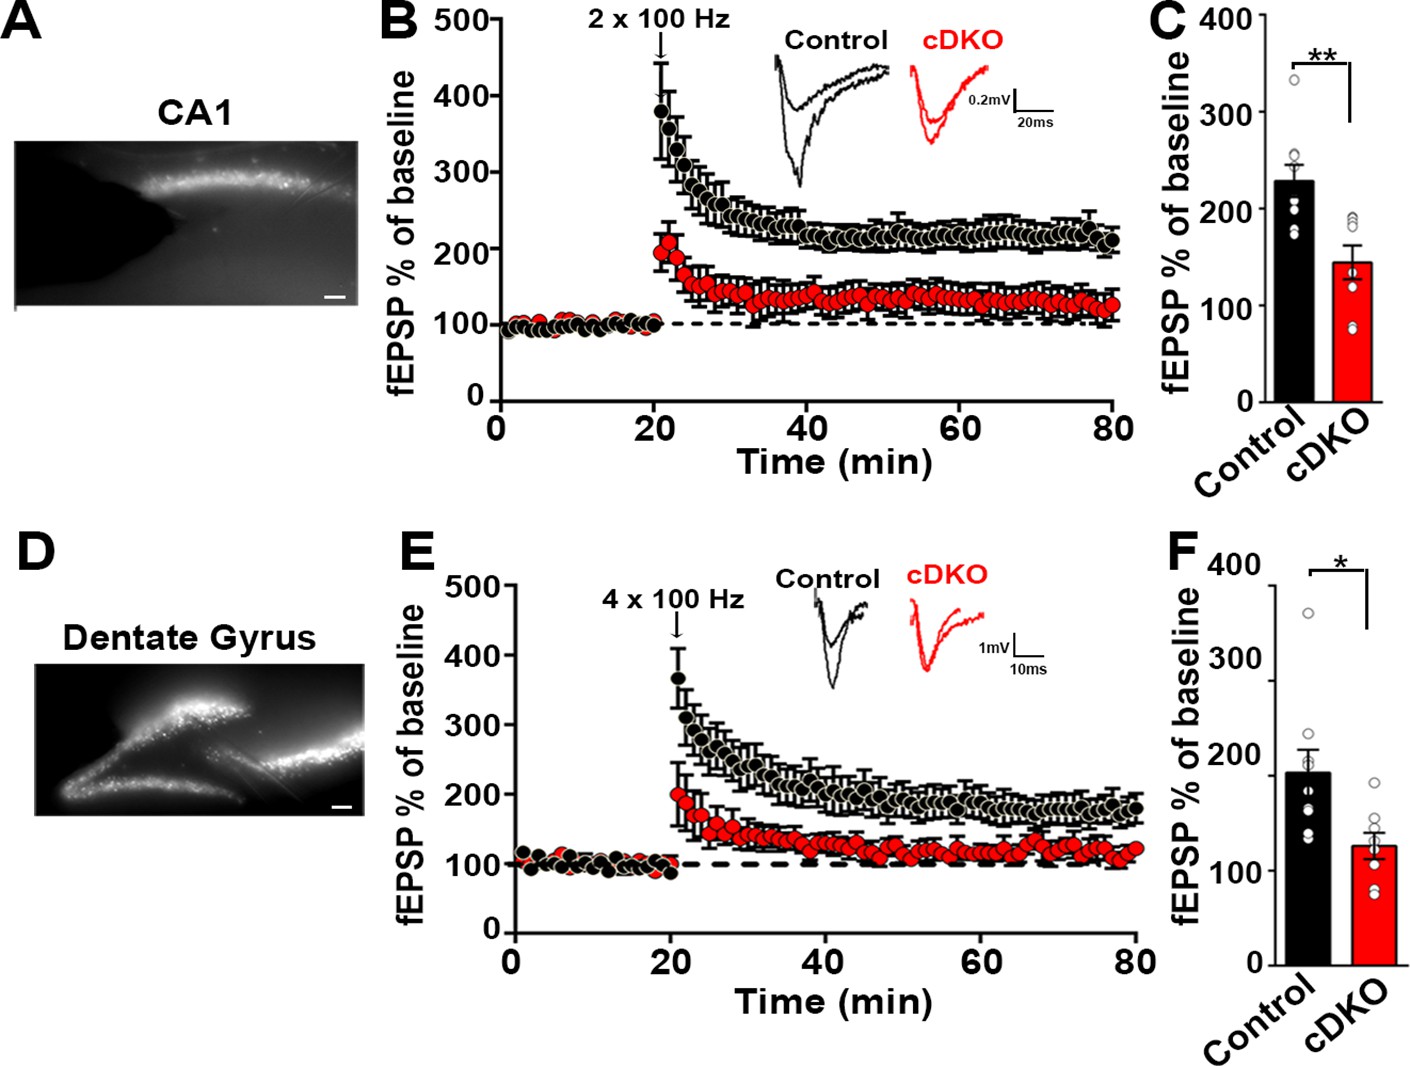
Impaired plasticity in dorsal hippocampal CA1 and dentate gyrus regions in LRRTM1/2-cDKO mice.
(A) Epifluoroscent image of dorsal CA1 with stimulating and recording electrodes. Scale bar 50 µm. (B) fEPSP recordings from control and LRRTM1/2-cDKO stratum radiatum CA3-CA1 synapses in acute hippocampal slices taken 20 min into baseline and 60 min after high-frequency stimulation (2 × 1 s at 100 Hz). Insets: Representative traces. (C) Comparisons of %fEPSP values taken from significant reductions in the fEPSPs in CA1 region of LRRTM1/2-cDKO mice, (Student’s t-test **p=0.0033, n=9 slices from three control mice and n=8 slices from three LRRTM1/2-cDKO mice). (D) Epifluoroscent image of dorsal dentate gyrus with stimulating and recording electrodes. Scale bar 50 µm. (E) fEPSP recordings from control and LRRTM1/2-cDKO inner molecular layer of dentate gyrus synapses in acute hippocampal slices taken 20 min into baseline and 60 min after high-frequency stimulation (4 × 1 s at 100 Hz). Insets: Representative traces. (F) Comparisons of average %fEPSP values revealed significant reductions in fEPSPs in dentate gyrus of LRRTM1/2-cKO mice, (Student’s t test *p=0.0176, n=9 slices for three control mice and n=8 slices for three LRRTM1/2-cDKO mice). Data presented as mean ± SEM.
-
Figure 8—source data 1
Figure 8 source data.
- https://cdn.elifesciences.org/articles/64742/elife-64742-fig8-data1-v1.xlsx
Figure 8—figure supplement 1
Presynaptic function is unaltered in CA1 of LRRTM1/2-cDKO mice.
(A) Representative traces of five pairs of pulses, which were delivered, to CA3-CA1 synapses at different time intervals of LRRTM1/2-cDKO and control mice. (C) Paired-pulse ratios were unaltered in LRRTM1/2-cDKO mice CA1 when compared to control mice (Multiple t-test, n=7–8 slices per group, 3–4 mice each group).
-
Figure 8—figure supplement 1—source data 1
Figure 8—figure supplement 1 source data.
- https://cdn.elifesciences.org/articles/64742/elife-64742-fig8-figsupp1-data1-v1.xlsx
Figure 9 with 1 supplement
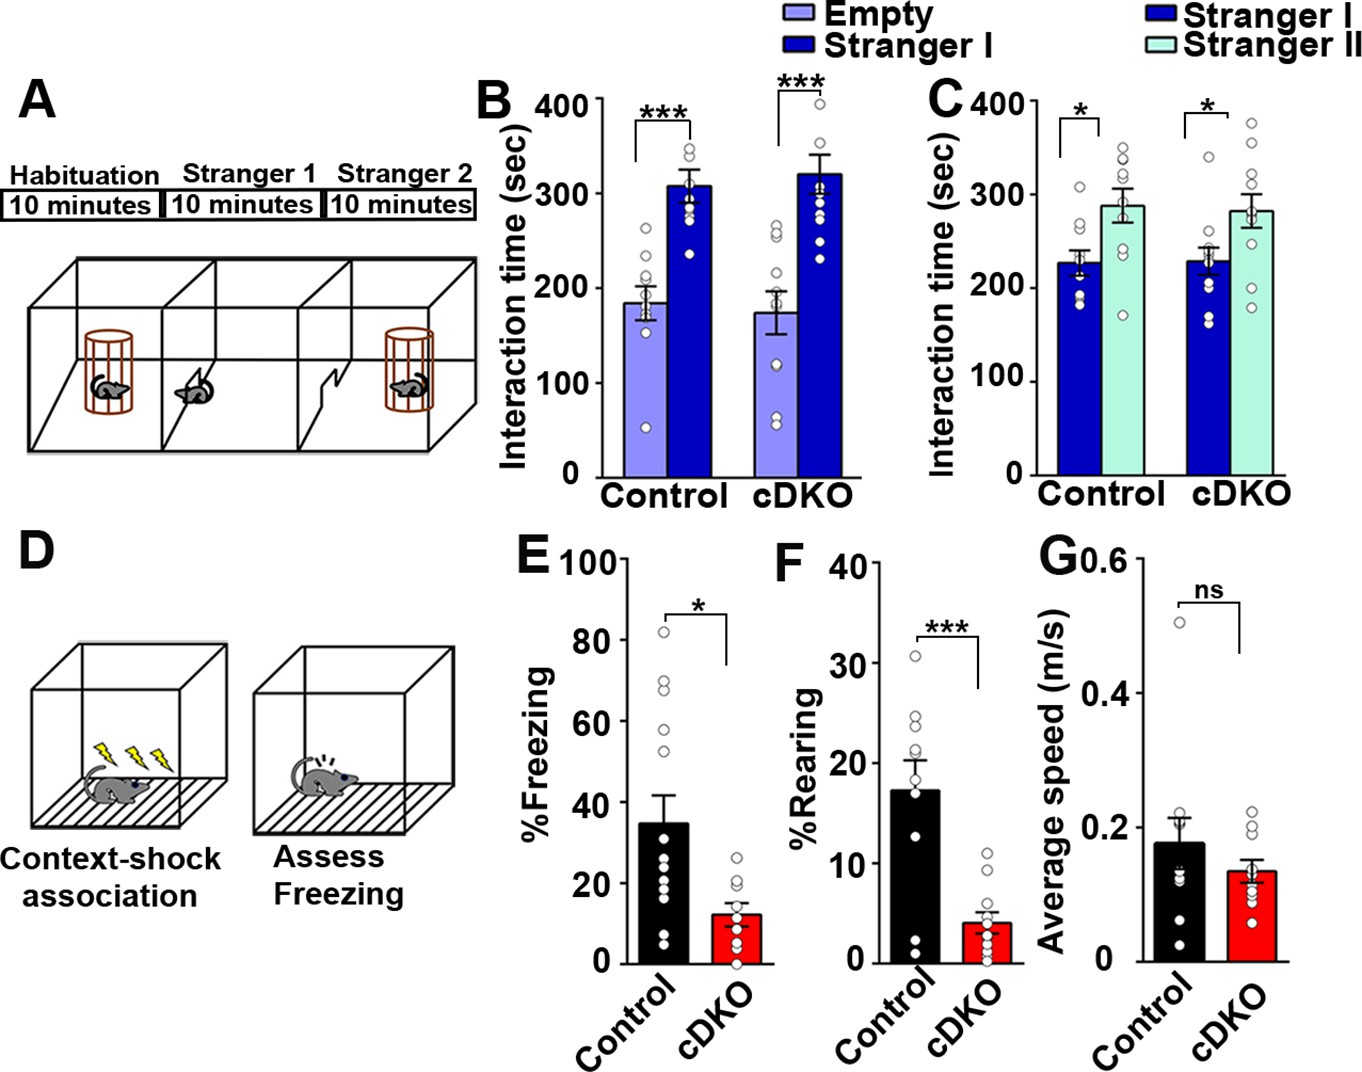
Contextual memory is impaired in LRRTM1/2-cDKO mice.
(A) Experimental scheme of three-chambered social approach. (B and C) Three chambered social approach test was used to test social memory between controls and LRRTM1/2-cDKO mice. (B) Social novelty (time spent with introduced stranger mice versus empty chamber) was not altered between controls and LRRTM1/2-cDKOs, (Student’s t-test for control, ***p<0.0001 and LRRTM1/2-cDKO, ***p<0.0001, n=11 mice for each group). (C) Interaction time spent with familiar mice and novel mice was comparable between control and LRRTM1/2-cDKO as they spent more time interacting with novel mice (Student’s t-test for control, *p=0.0144 and LRRTM1/2-cDKO, *p=0.0307, n=11 mice for each group). (D) Experimental scheme of contextual fear memory test. Mice were pre-exposed to context on day 1 followed by aversive shocks on day 2. Freezing and rearing behavior was assessed on day 3. (E–G) Percentage of time spent freezing and rearing following contextual fear conditioning (CFC) training was compared between control and LRRTM1/2-cDKO mice 24 hr after receiving three trains of 1.0 mA shocks. LRRTM1/2-cDKO showed significantly reduced levels of freezing and rearing when exposed to the CFC chamber 24 hr after initial training (n=14 mice for control, n=11 mice for LRRTM1/2-cDKO), (Student’s t-test, *p=0.0212 and ***p=0.0004). (F) Average speed was comparable between the groups, (Student’s t-test, p=0.3500). Data presented as mean ± SEM.
-
Figure 9—source data 1
Figure 9 source data.
- https://cdn.elifesciences.org/articles/64742/elife-64742-fig9-data1-v1.xlsx
Figure 9—figure supplement 1
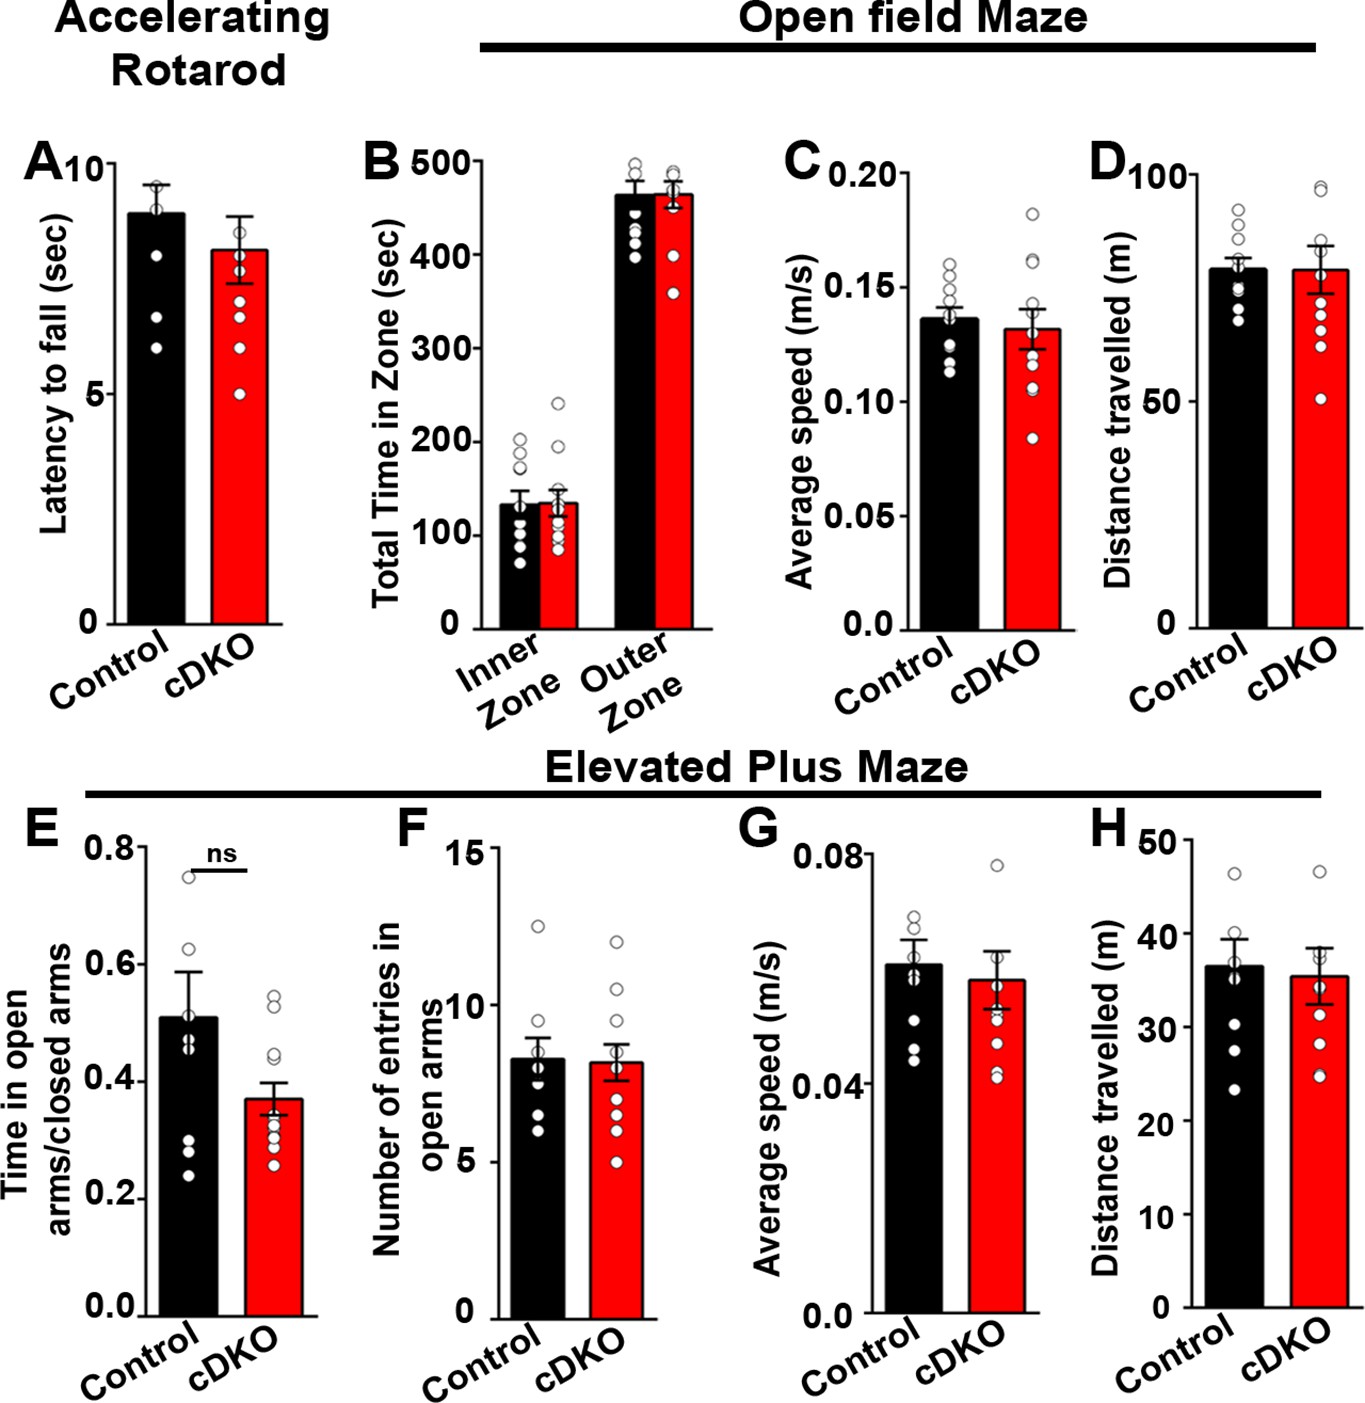
Behavioral tests performed on LRRTM1/2-cDKO mice showed no differences in motor skills and anxiety-like behavior.
(A) Latency to fall on rotatrod test was comparable between controls and LRRTM1/2-cDKO mice, (Student’s t test, p=0.4202, n=10 for control and n=11 for LRRTM1/2-cDKO). (B–D) Time spent in the inner zone versus outer zone of open-field maze (two-way ANOVA, p=0.943), average speed (Student’s t test p=0.6738) and distance travelled (Student’s t test, p=0.9861) was unaltered in LRRTM1/2-cDKO mice, (n=10 for control and n=11 for LRRTM1/2-cDKO). (E–H) Anxiety index (time spent in open arms/time spent in closed arms) (Student’s t-test, p=0.0761), number of entries in open arms of elevated plus maze (Student’s t-test, p=0.9018), average speed (Student’s t-test, p=0.6921) and distance travelled (Student’s t-test, p=0.8009) was comparable between controls and LRRTM1/2-cDKO mice (n=10 for control and n=11 for LRRTM1/2-cDKO).
-
Figure 9—figure supplement 1—source data 1
Figure 9—figure supplement 1 source data.
- https://cdn.elifesciences.org/articles/64742/elife-64742-fig9-figsupp1-data1-v1.xlsx
Additional files
Download links
A two-part list of links to download the article, or parts of the article, in various formats.
Downloads (link to download the article as PDF)
Open citations (links to open the citations from this article in various online reference manager services)
Cite this article (links to download the citations from this article in formats compatible with various reference manager tools)
Distinct but overlapping roles of LRRTM1 and LRRTM2 in developing and mature hippocampal circuits
eLife 11:e64742.
https://doi.org/10.7554/eLife.64742


