Widespread variation in heat tolerance and symbiont load are associated with growth tradeoffs in the coral Acropora hyacinthus in Palau
- Department of Biology, Hopkins Marine Station of Stanford University, United States
- Palau International Coral Reef Center, Palau
Figures
Figure 1 with 2 supplements
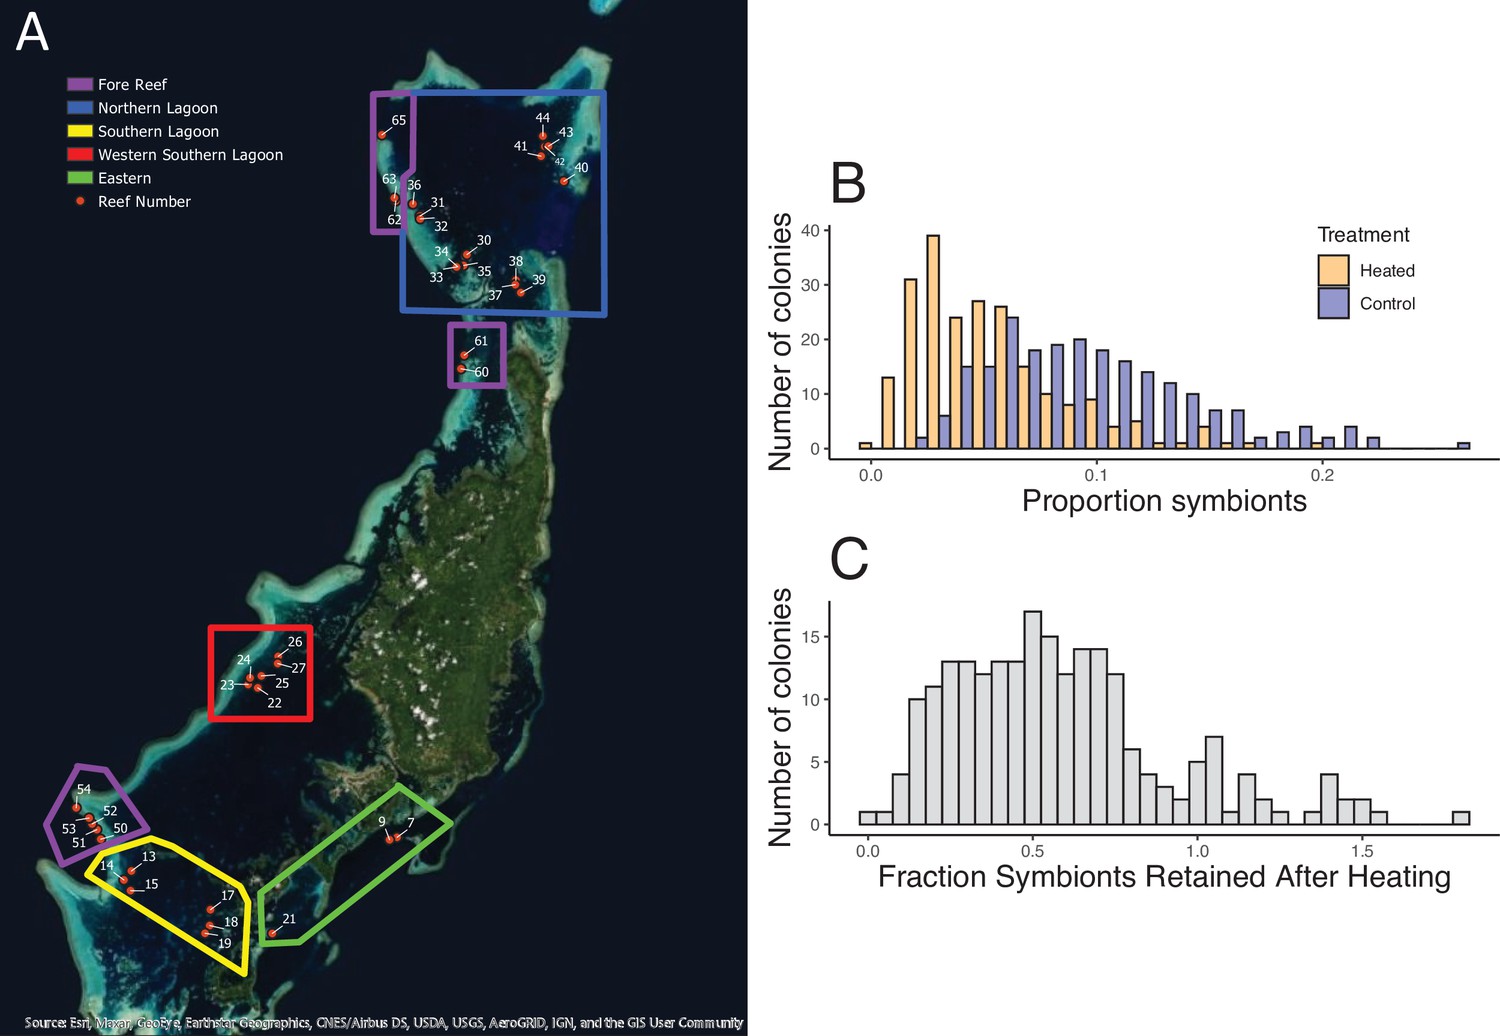
Geographic distribution of reefs and bleaching responses after experimental warming.
(A) Map of 39 reef locations surveyed, arranged in groups in the North (blue), West (red), East (green), and South (yellow). Ten reefs that are outlined in purple are at fore reef locations. (B) Mean proportion of symbionts in tissues from corals before and after heating. (C) The fraction of symbionts retained after heating across all 221 colonies. Accompanying source data are available as Figure 1—source data 1data.
-
Figure 1—source data 1
Colony by colony bleaching response to experimental warming.
- https://cdn.elifesciences.org/articles/64790/elife-64790-fig1-data1-v2.csv
Figure 1—figure supplement 1
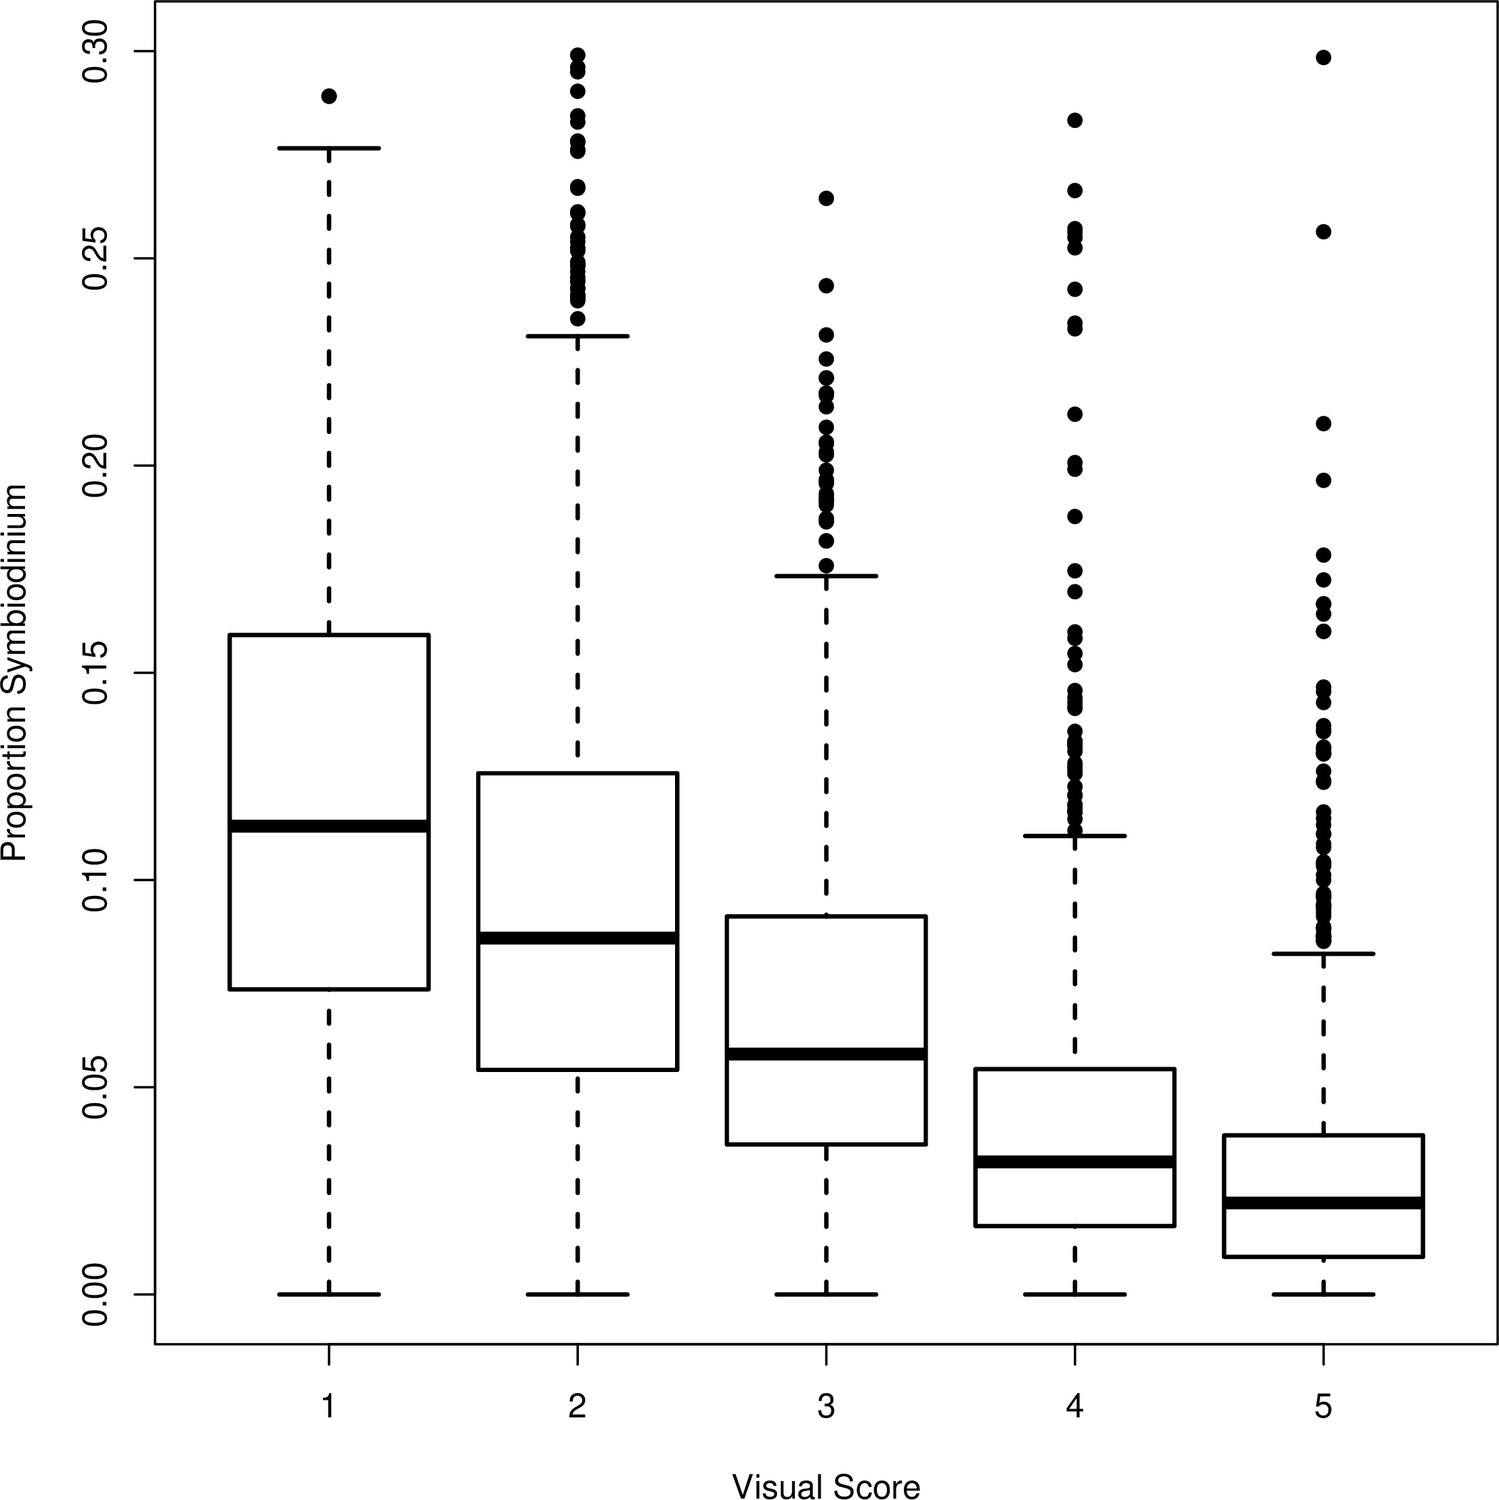
Range of symbiont cell concentration by visual bleaching score category.
Symbiont cell proportions are highly correlated with visual bleaching score, though there is high variance particularly among colonies with low bleaching scores. Note: Measurements are of all colonies from the experimental heat treatments as well as the control treatments. Accompanying source data are available as Figure 1—figure supplement 1—source data 1.data.
-
Figure 1—figure supplement 1—source data 1
Symbiont density as measured by flow cytometry and visual bleaching score.
- https://cdn.elifesciences.org/articles/64790/elife-64790-fig1-figsupp1-data1-v2.csv
Figure 1—figure supplement 2
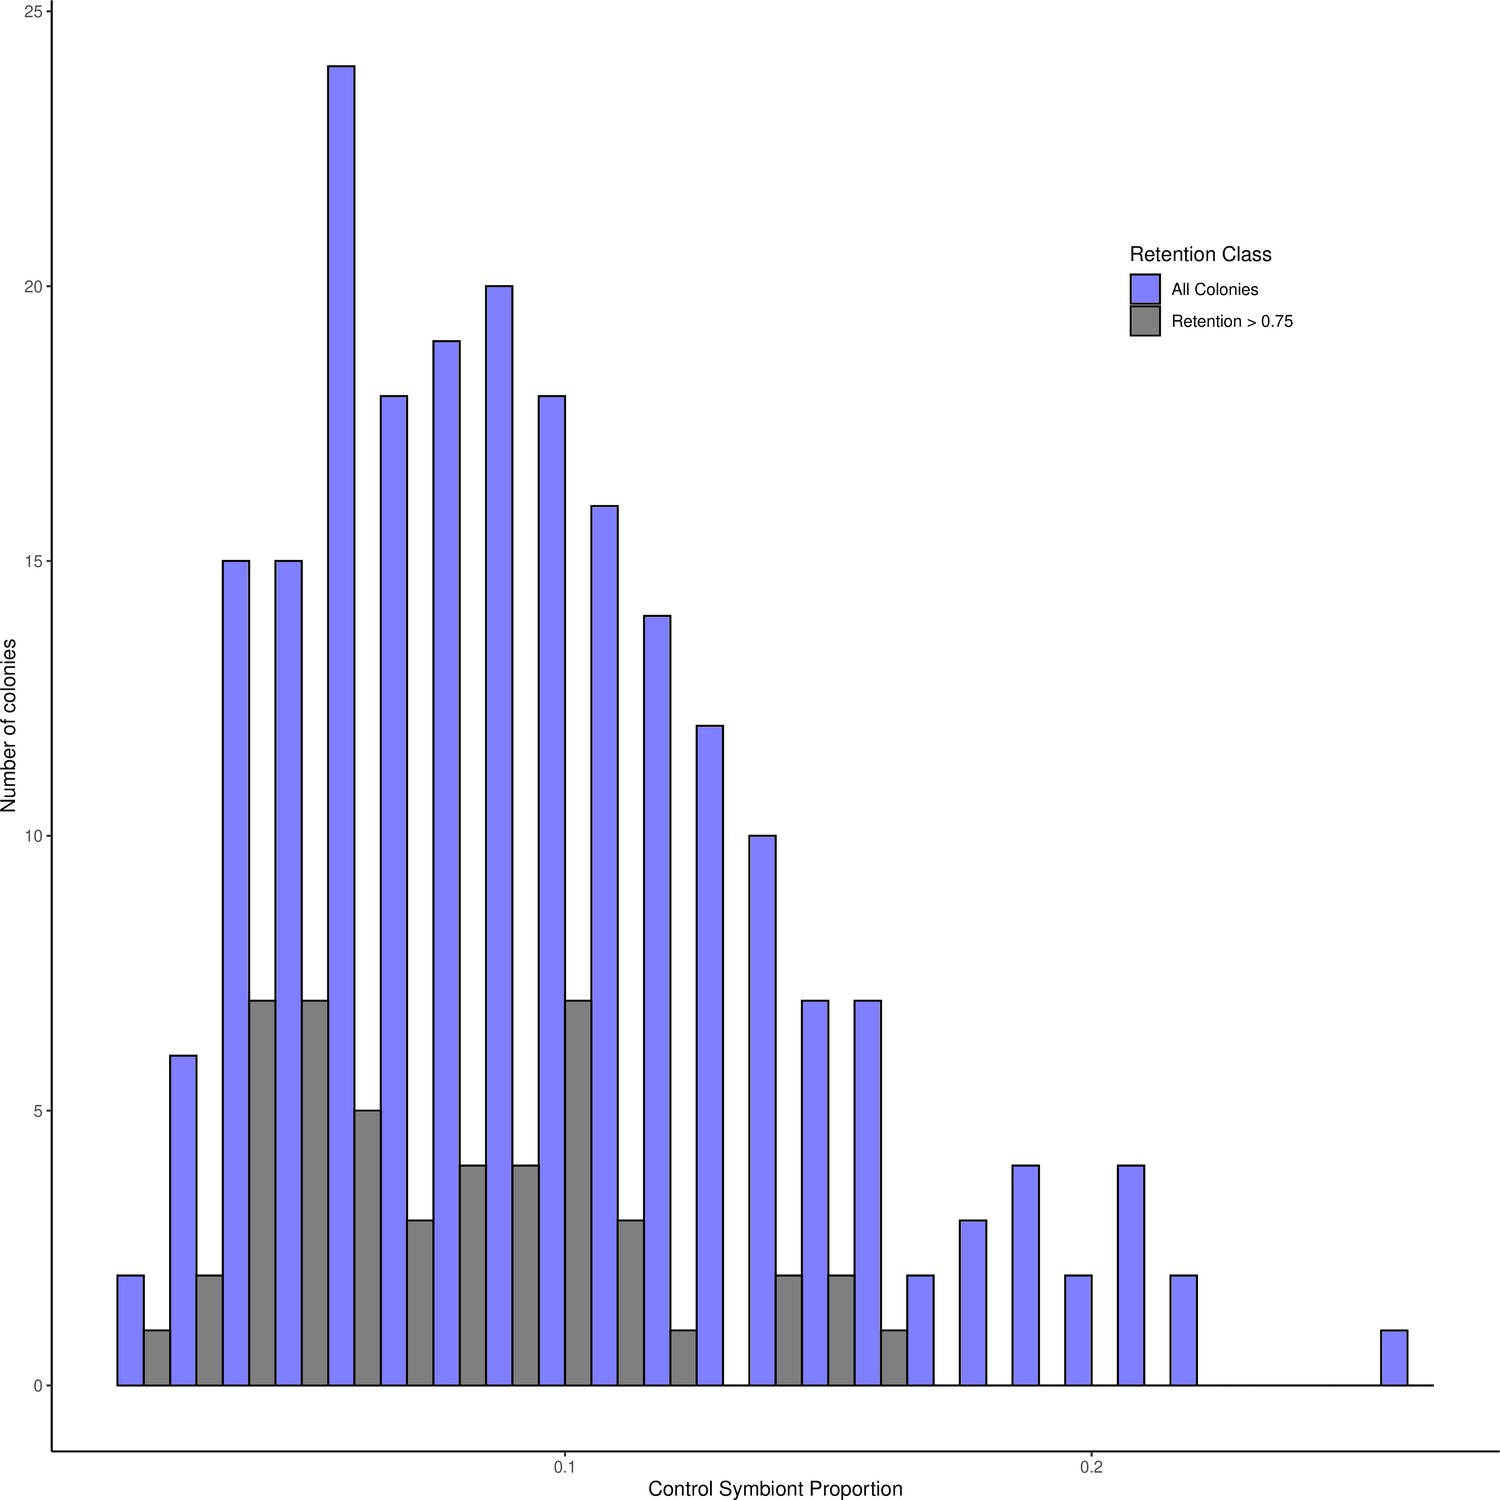
Colonies with high symbiont retention after heat stress tend to have lower levels of symbionts (gray bars), compared to symbiont load across all colonies (blue bars).
Accompanying source data are available as Figure 1—figure supplement 2—source data 1.data.
-
Figure 1—figure supplement 2—source data 1
Colony by colony symbiont load pre- and post-experimental bleaching.
- https://cdn.elifesciences.org/articles/64790/elife-64790-fig1-figsupp2-data1-v2.csv
Figure 2 with 4 supplements
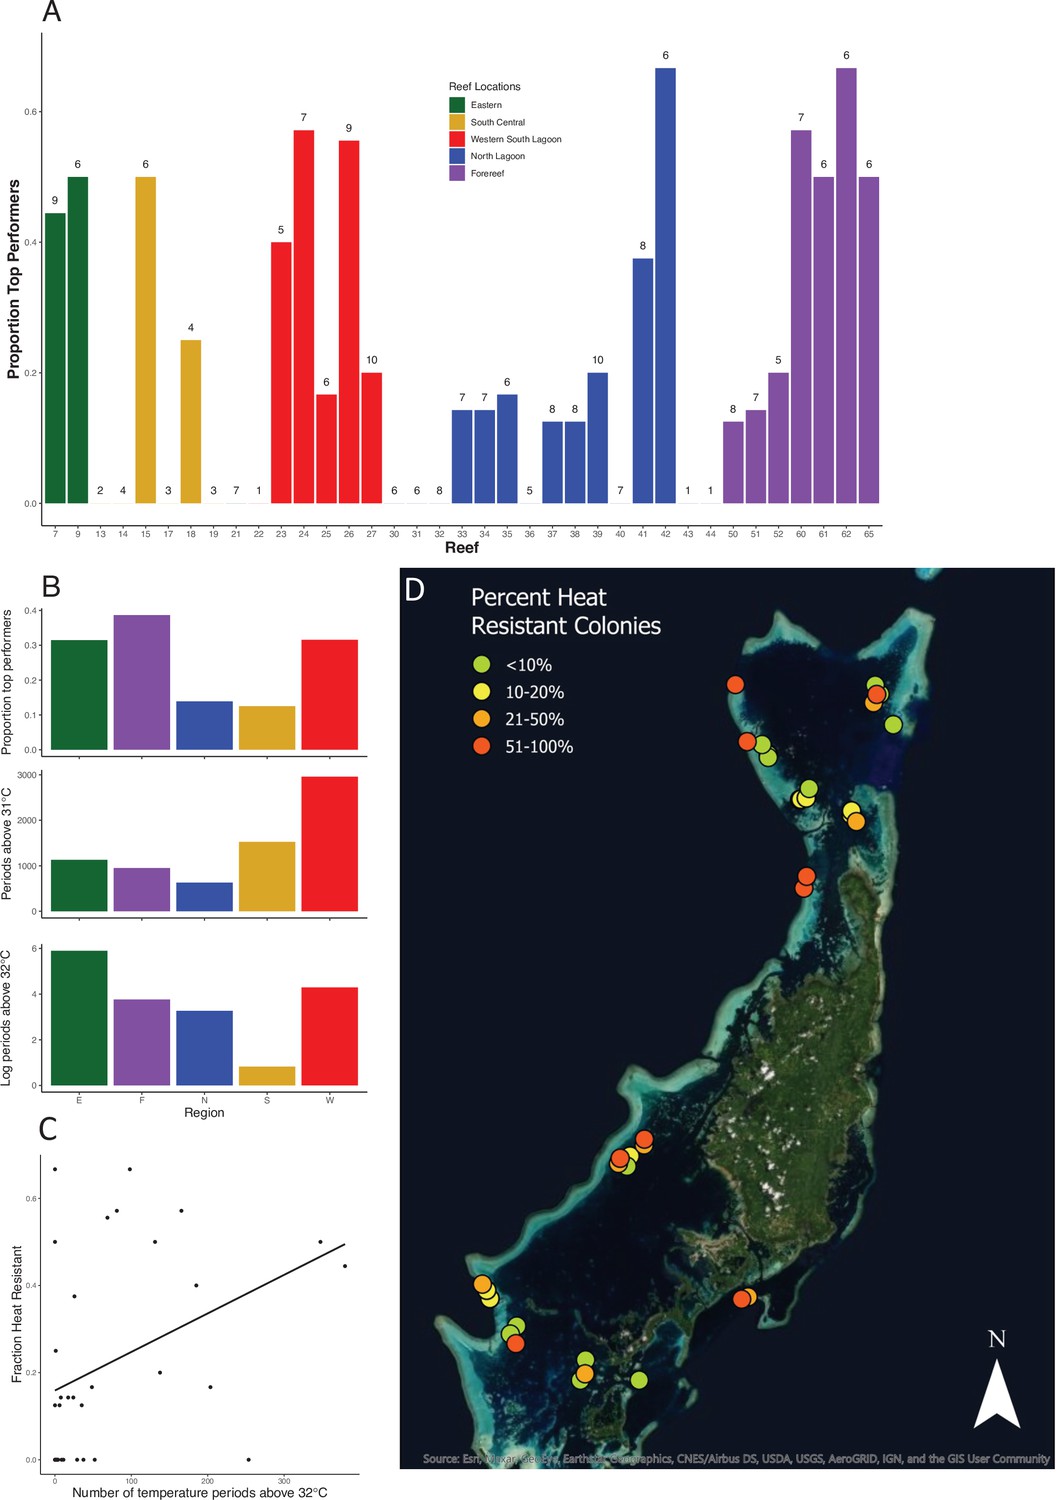
Location and prevalence of heat-resistant colonies by reef and region.
(A) Location of corals in the top 25% of values for symbiont retention. See Figure 1A for reef locations. Numbers above each reef label are the number of colonies sampled from that reef. (B) Location of corals that are in the top 25% in symbiont retention by region and associated mean temperatures (note log scale for 32°C). (C) Plot showing the relationship between the average number of 10 min intervals above 32°C on a reef and the fraction of colonies on that reef in the top 25% of values for symbiont retention. (D) The distribution and frequency of bleaching-resistant colonies across the Palauan archipelago. Colors correspond to the frequency of highly heat-resistant corals found in this survey on each reef. Accompanying source data are available as Figure 2—source data 1.data.
-
Figure 2—source data 1
Reef locations, number of extreme temperature events and proportion of bleaching resistant individuals.
- https://cdn.elifesciences.org/articles/64790/elife-64790-fig2-data1-v2.csv
Figure 2—figure supplement 1
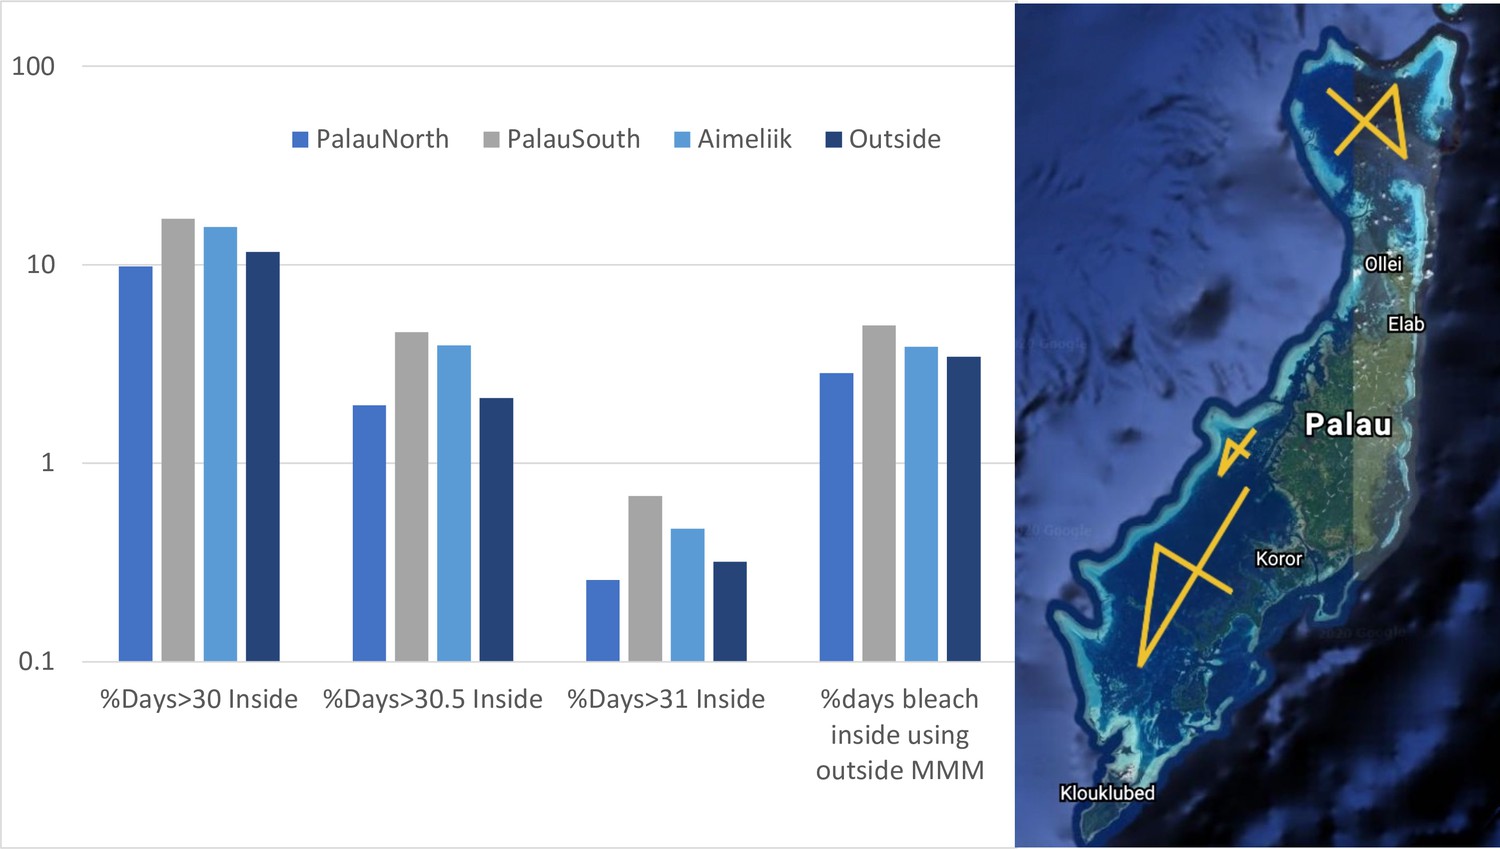
The percentage of days with temperatures above 30°C, 30.5°C, and 31°C for four regions encompassed by the vertices of the yellow lines.
The fourth location is 0.4° latitude east of the northern squares. The adjacent barplot depicts the percentage of days spent above mean monthly maximum for all four locations outlined on the map. Accompanying source data are available as Figure 2—figure supplement 1—source data 1.data.xlsx.
-
Figure 2—figure supplement 1—source data 1
Regional temperature profiles using remote sensing data.
- https://cdn.elifesciences.org/articles/64790/elife-64790-fig2-figsupp1-data1-v2.xlsx
Figure 2—figure supplement 2
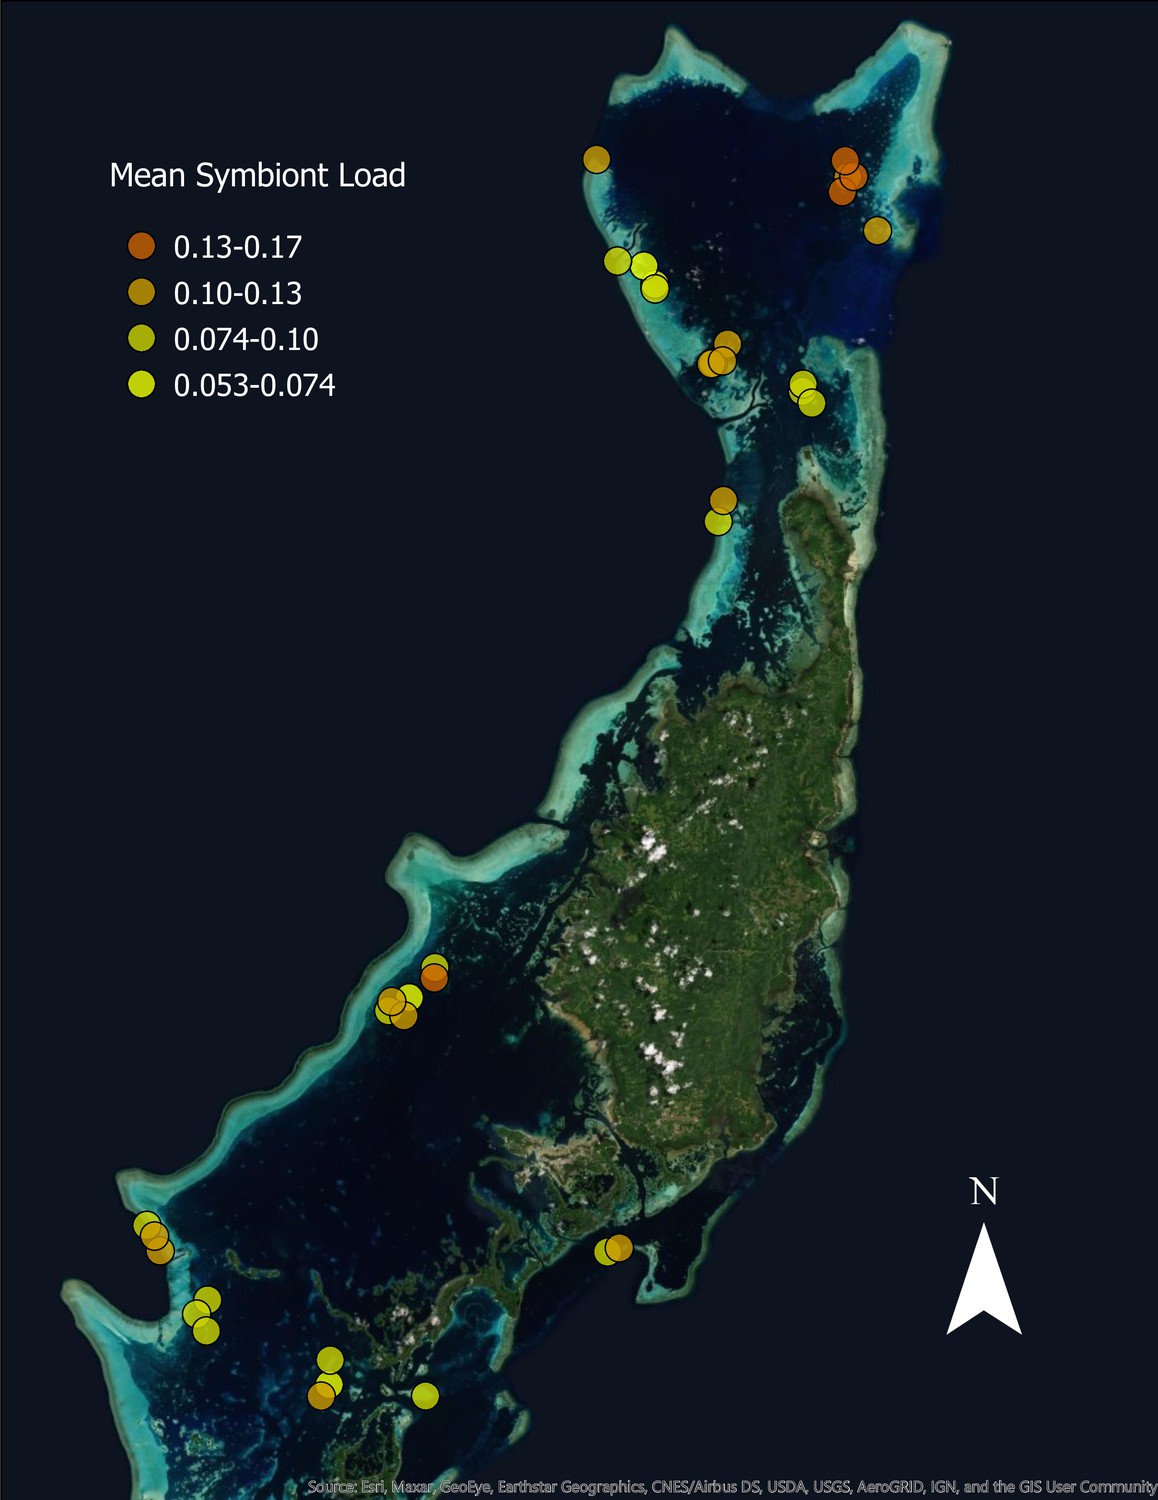
Mean symbiont load of Acropora hyacinthus colonies across Palau.
Average proportion of symbionts in control treatment nubbins at the end of the experiment across the 38 reefs in this study. Accompanying source data are available in Supplementary file 1.
Figure 2—figure supplement 3
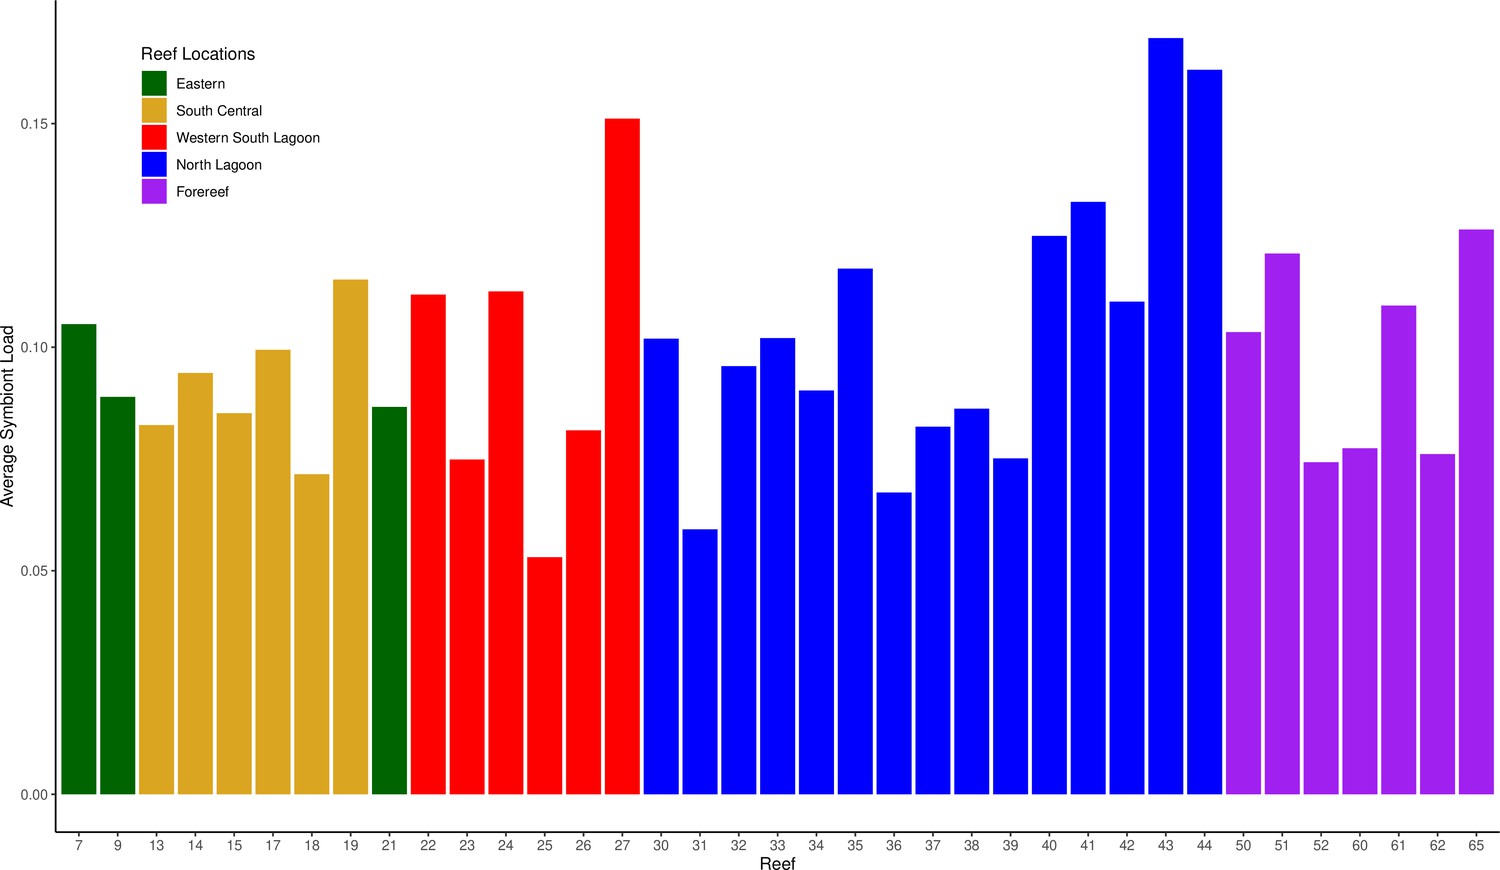
Average colony symbiont load (number of symbiont cells per coral cell) averaged across colonies from different reefs.
Colors represent the same areas as in Figure 2. Accompanying source data are available as Figure 2—figure supplement 1, Figure 2—figure supplement 3—source data 1data.
-
Figure 2—figure supplement 3—source data 1
Mean symbiont load for colonies inhabiting each reef.
- https://cdn.elifesciences.org/articles/64790/elife-64790-fig2-figsupp3-data1-v2.csv
Figure 2—figure supplement 4
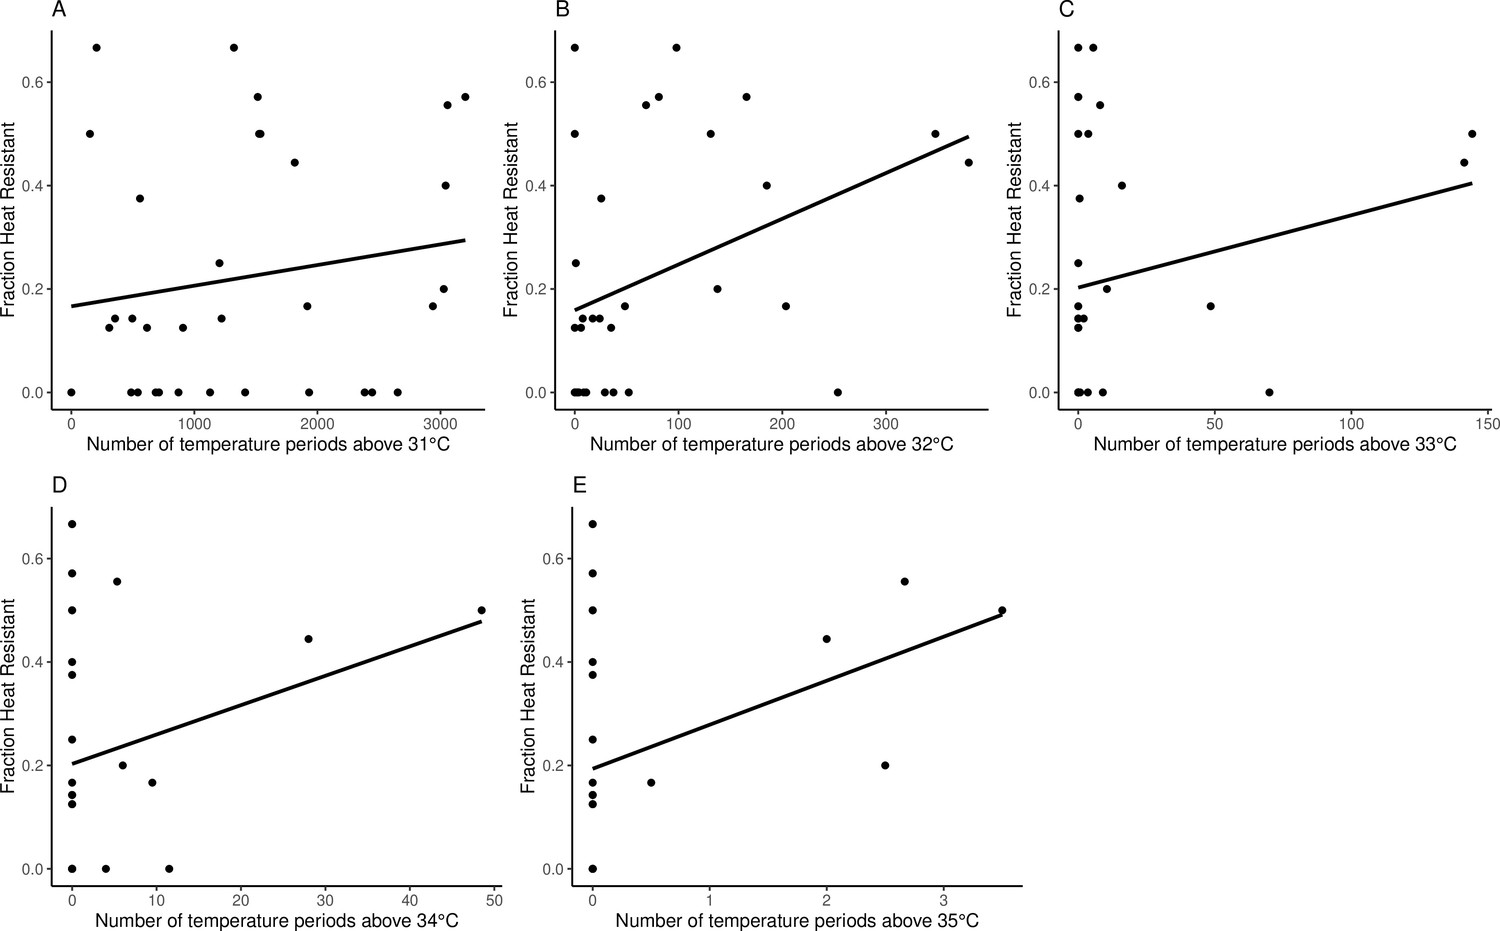
Proportion of heat-resistant colonies on each reef as a function of the number of extreme temperature events, depicting the relationship when the threshold is 31°C, 32°C, 33°C, 34°C, and 35°C (A–E, respectively).
Accompanying source data are available as Figure 2—figure supplement 4—source data 1data.
-
Figure 2—figure supplement 4—source data 1
Mean number of extreme temperature events recorded at each reef (thressholds 31-35°C).
- https://cdn.elifesciences.org/articles/64790/elife-64790-fig2-figsupp4-data1-v2.csv
Figure 3
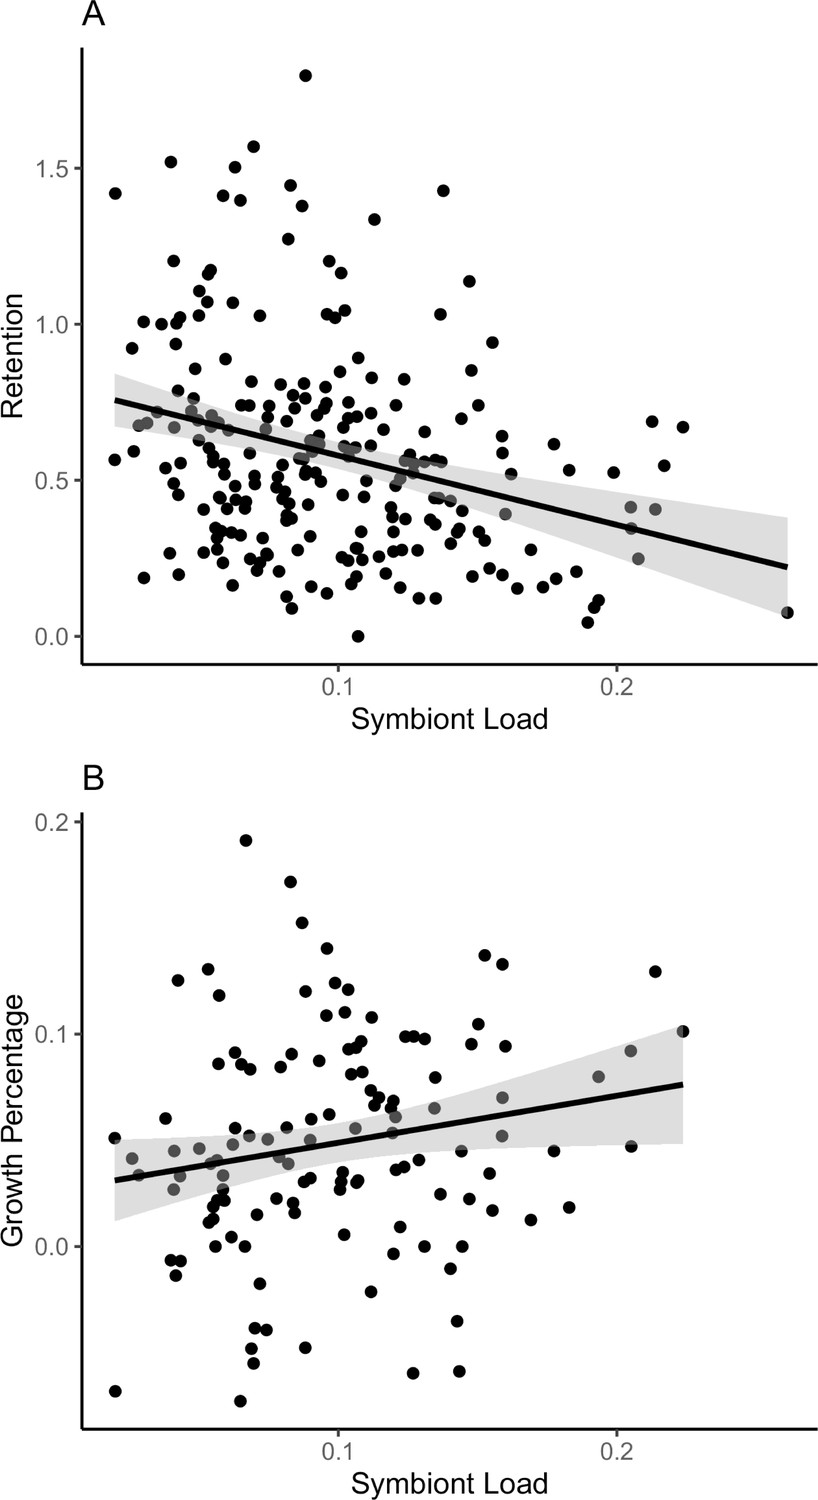
Relationships between symbiont retention and colony growth to initial symbiont load.
(A) Mean starting symbiont density of A. hyacinthus colonies across Palau is negatively correlated with the fraction of symbionts retained after heat stress. Colonies with lower symbiont population densities (fraction of symbiont cells per coral cells) tend to show higher retention after 2 days of standardized heat stress (r2 = 0.080, p = 9.063 × 10⁻⁴). (B) Annual growth (2018–2019) is higher for colonies with higher symbiont loads (r2 = 0.026, p = 0.0398). Accompanying source data are available as Figure 3—source data 1.data.
-
Figure 3—source data 1
Colony by colony measurements of symbiont load, retention and growth.
- https://cdn.elifesciences.org/articles/64790/elife-64790-fig3-data1-v2.csv
Videos
Video 1
Distribution of heat-resistant colonies in Palau.
Animation depicting the approximate locations of bleaching-resistant colonies sampled for this study across the Palauan archipelago.
Tables
Table 1
Comparison of bleaching-resistant and beaching-prone individuals.
| Control | Heated | Heated | Temperature | |||
|---|---|---|---|---|---|---|
| Rank | Symbiont proportion | Symbiont proportion | Retention | Avg depth | No. intervals above 31°C | No. intervals above 32°C |
| Top 25% | 0.080 | 0.082 | 1.041 | 0.954 | 1703 | 114 |
| Bottom 25% | 0.113 | 0.023 | 0.22 | 1.062 | 1714 | 79 |
-
Table 1—source data 1
Symbiont load and retention for all colonies.
- https://cdn.elifesciences.org/articles/64790/elife-64790-table1-data1-v2.csv
Additional files
-
Supplementary file 1
Physical properties of reefs and average heat retention statistics.
- https://cdn.elifesciences.org/articles/64790/elife-64790-supp1-v2.xlsx
-
Supplementary file 2
Temperature extremes by geographic region.
Average percent time spent per reef above 31–35°C (out of 35,764 observations) in the five geographic regions in this study. Values per individual reef can be found in Supplementary file 1.
- https://cdn.elifesciences.org/articles/64790/elife-64790-supp2-v2.xlsx
-
Transparent reporting form
- https://cdn.elifesciences.org/articles/64790/elife-64790-transrepform1-v2.docx
-
Source data 1
Complete_Colony_By_Colony.data.csv.
- https://cdn.elifesciences.org/articles/64790/elife-64790-supp3-v2.csv
Download links
A two-part list of links to download the article, or parts of the article, in various formats.
Downloads (link to download the article as PDF)
Open citations (links to open the citations from this article in various online reference manager services)
Cite this article (links to download the citations from this article in formats compatible with various reference manager tools)
Widespread variation in heat tolerance and symbiont load are associated with growth tradeoffs in the coral Acropora hyacinthus in Palau
eLife 10:e64790.
https://doi.org/10.7554/eLife.64790


