Working memory gates visual input to primate prefrontal neurons
- Department of Ophthalmology and Visual Sciences, University of Utah, United States
- Department of Neurobiology, and Howard Hughes Medical Institute, Stanford University, United States
Figures
Figure 1 with 1 supplement
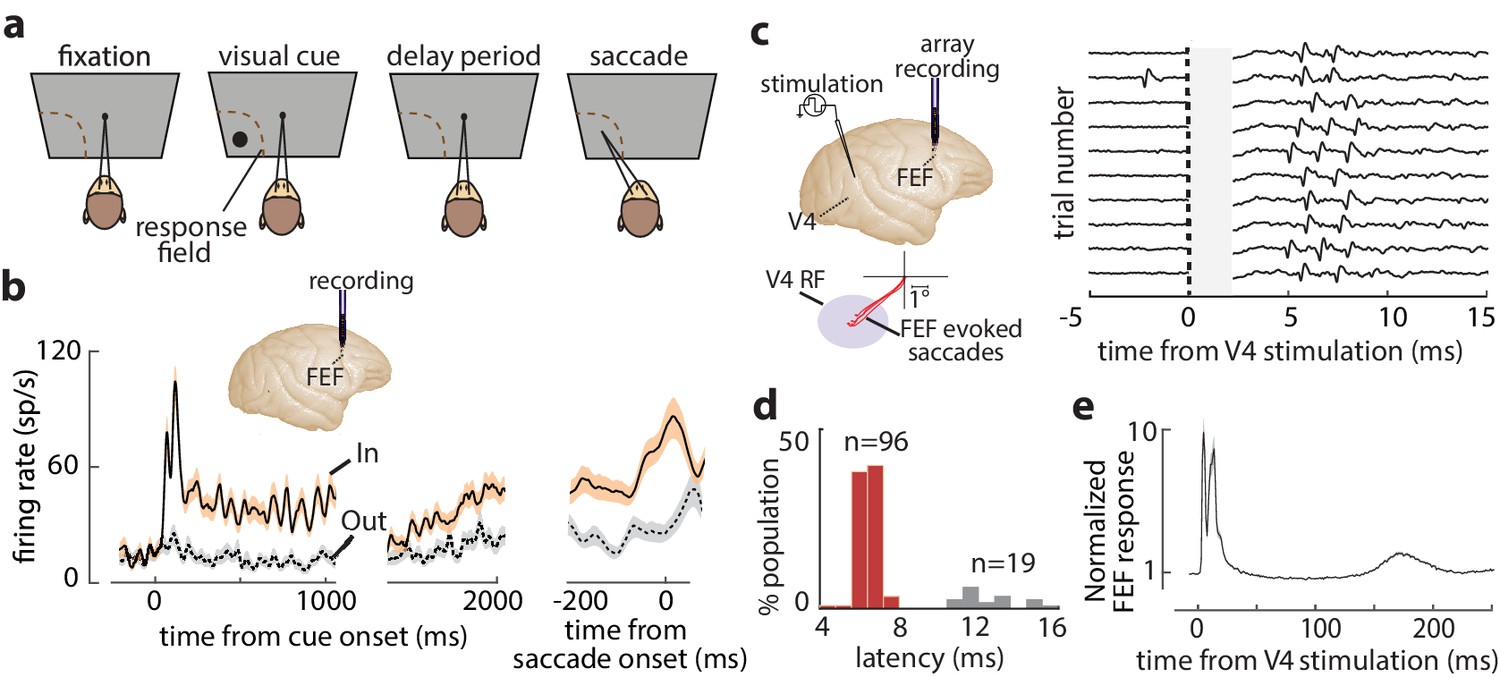
FEF responses during the memory-guided saccade (MGS) task and orthodromic activation of FEF neurons from visual cortex.
(a) Schematic of the MGS task. Monkey fixates and a visual cue is presented (inside or outside the neuronal response field [RF]). The monkey maintains fixation throughout a delay period, and upon removal of the fixation point, saccades to the remembered location to receive a reward. (b) Response of an example FEF neuron during the MGS task; this neuron shows visual, memory, and motor activity. Responses are shown for cues inside (In, peach) or outside (Out, gray) the RF, aligned to cue onset (left, middle panels) or the saccade (right panel). Traces show mean ± SEM. (c) FEF neurons were orthodromically activated by electrical stimulation of retinotopically corresponding V4 sites (left). Right plot shows evoked spikes from an FEF neuron across 10 trials (stimulation artifact period is shown in gray). (d) Distribution of stimulation-evoked spike latencies for 115 orthodromically activated FEF neurons. (e) Average normalized stimulation-evoked activity of the 96 visual-recipient FEF neurons over time. Figure 1—figure supplement 1 shows details of stimulation timing and subsequent FEF activity.
Figure 1—figure supplement 1
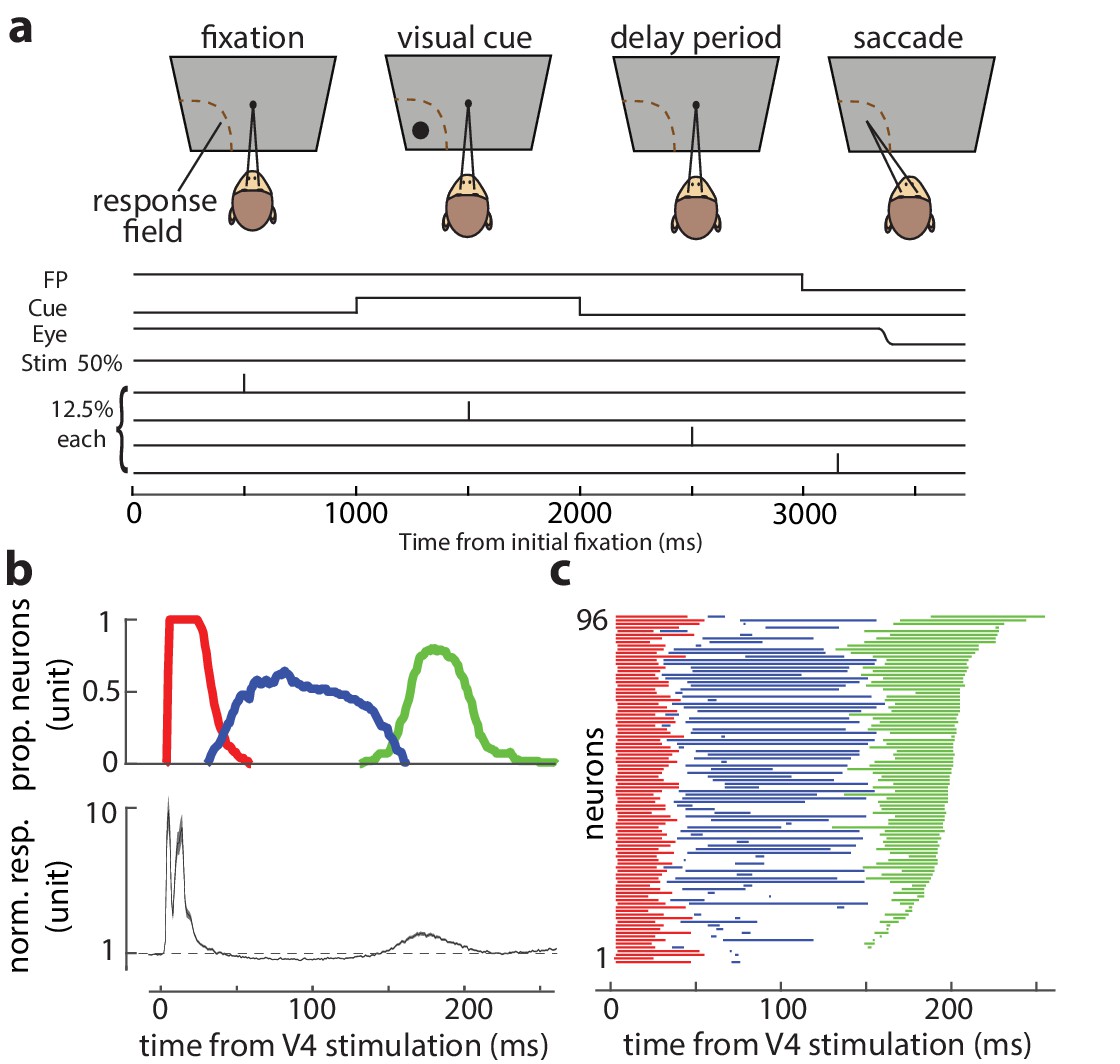
Stimulation timing, enhancement, and suppression of visual-recipient FEF neurons’ activity following electrical stimulation of V4.
(a) Top schematic illustrates task epochs; lines beneath indicate the timing of fixation point, visual cue, example eye position, and electrical stimulation relative to these epochs. (b) Top: proportion of the visual-recipient FEF population showing significantly elevated firing rates (red and green) or significantly suppressed firing rates (blue), over time, relative to V4 stimulation. Firing rates were compared to a time-matched window on non-stimulation trials. Bottom: normalized response of the visual-recipient population following stimulation (mean ± SE). The tri-phasic pattern of enhancement–suppression–enhancement was consistent across the population of visual-recipient neurons with an initial burst of spikes (3.71 ± 1.60 to 29.99 ± 6.73 ms), followed by a period of suppression (57.06 ± 19.84 to 102.10 ± 37.40 ms), and then a later period of enhancement (162.52 ± 11.24 to 193.37 ± 14.15 ms), relative to baseline activity. Note that the average increase in firing rate within ~30 ms of stimulation was much larger than the subsequent increase in firing rate ~150–200 ms following stimulation, as one would expect for direct stimulation of monosynaptic inputs. (c) Significance of change in firing rate for each of the 96 visual-recipient FEF neurons. Significance of stimulation-induced change in each neuron’s response is plotted in a row, over time, relative to V4 stimulation. Red and green indicate a significant increase in firing rate. Blue indicates a significant decrease in firing rate. White: no significant change. (Neurons are ordered based on the total number of time bins reaching significance.)
Figure 2 with 2 supplements
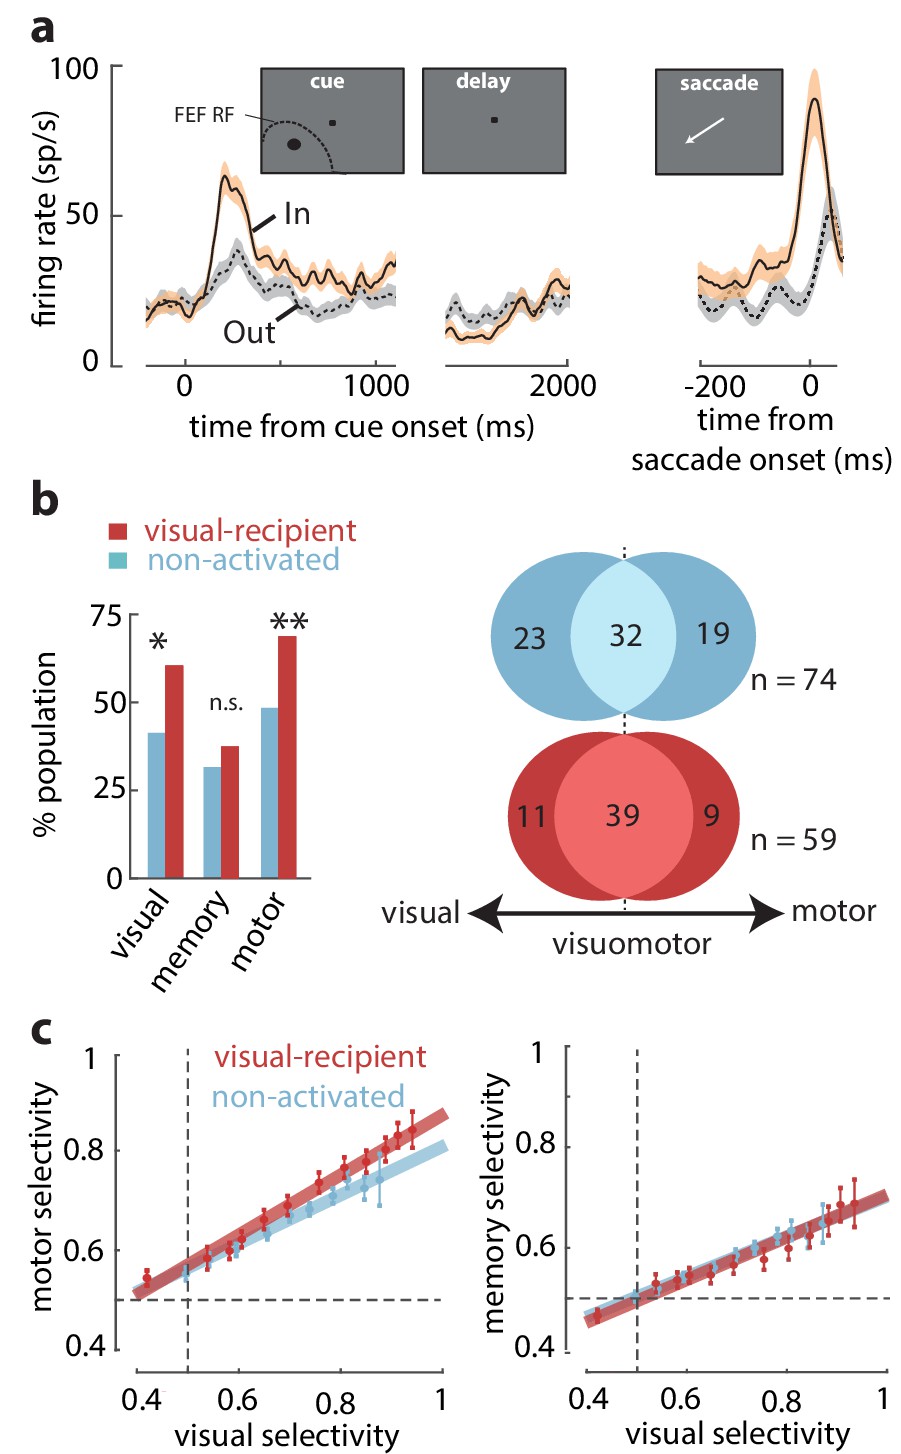
Overrepresentation of visuomotor activity in visual-recipient FEF neurons.
(a) Activity of an example visual-recipient FEF neuron when the cue appeared In (peach) or Out (gray) of the RF. Plots show firing rates aligned to the onset of the visual cue (left), offset of the visual cue (middle), and to saccade onset (right). (b) Left: percent of the population exhibiting visual, memory, and motor activity for visual-recipient (cardinal) and non-activated (turquoise) FEF neurons. *p<0.05, **p<0.001; ns denotes p>0.05. Right: Venn diagrams showing the numbers of neurons with significant selectivity in the visual, motor, or both epochs for non-activated (n = 74) and visual-recipient (n = 59) neurons. Figure 2—figure supplement 1 compares the distributions of visual, memory, and motor selectivity between visual-recipient, non-activated, and slow-input FEF populations; Figure 2—figure supplement 2 provides statistical comparisons of selectivity in each period between these populations. (c) Motor selectivity (left) and memory selectivity (right) as a function of visual selectivity for visual-recipient and non-activated FEF neurons.
Figure 2—figure supplement 1
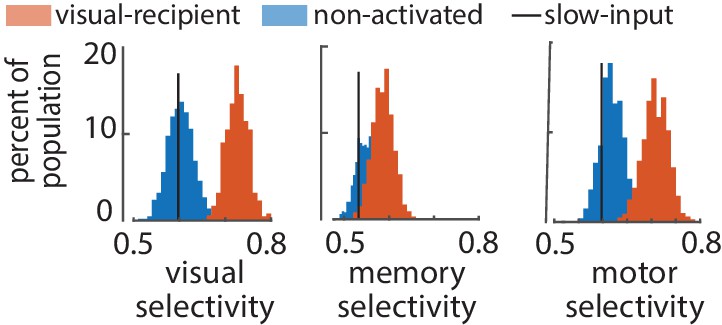
Distribution of visual, memory, and motor selectivity for random subsamples of non-input (blue) and visual-recipient (red) FEF neurons.
Black line indicates median selectivity of slow-input FEF neurons (n = 19). To better compare the visual-recipient and non-activated populations to the much smaller slow-input population, histograms were constructed showing distributions of average selectivity of 1000 19-neuron ensembles, each selected randomly from the visual-recipient or non-activated populations (n = 96 and 196, respectively). Visual-recipient neurons displayed much greater visual and motor selectivity than both the slow-input and non-activated populations (p<10−3).
Figure 2—figure supplement 2
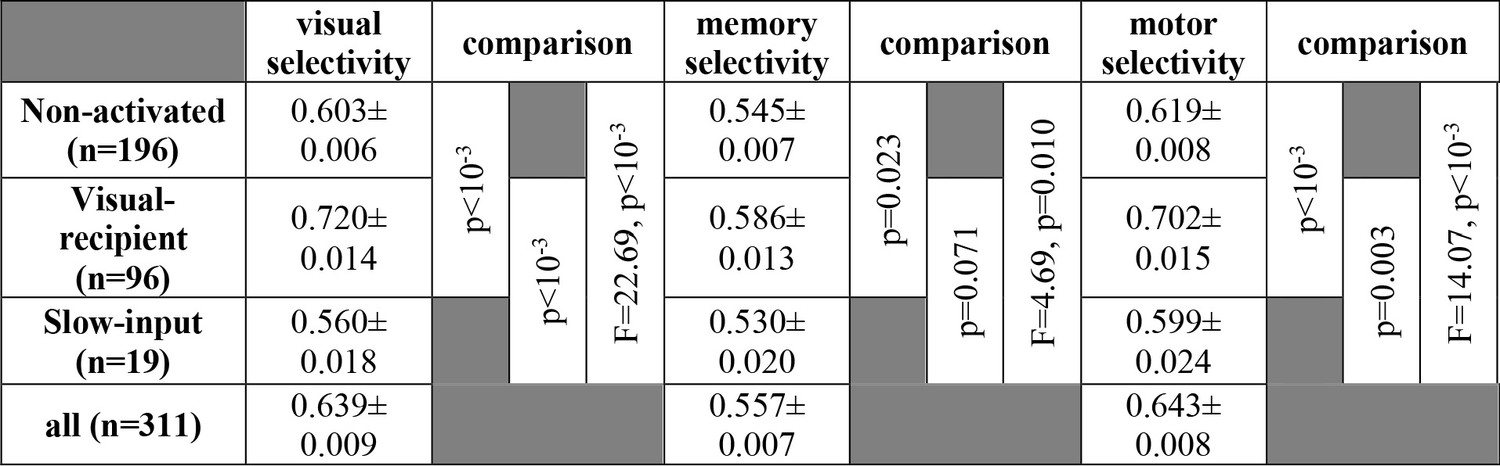
Statistical comparisons of the visual, memory, and motor selectivity for non-activated, slow-input, and visual-recipient FEF neurons.
Selectivity was calculated based on the area under the receiver-operating characteristic (ROC) curve for In vs Out conditions; standard error was calculated across neurons. P-values for comparisons between two groups of neurons were calculated using the Wilcoxon signed-rank test; comparisons across all three groups were calculated using ANOVAs.
Figure 3 with 2 supplements
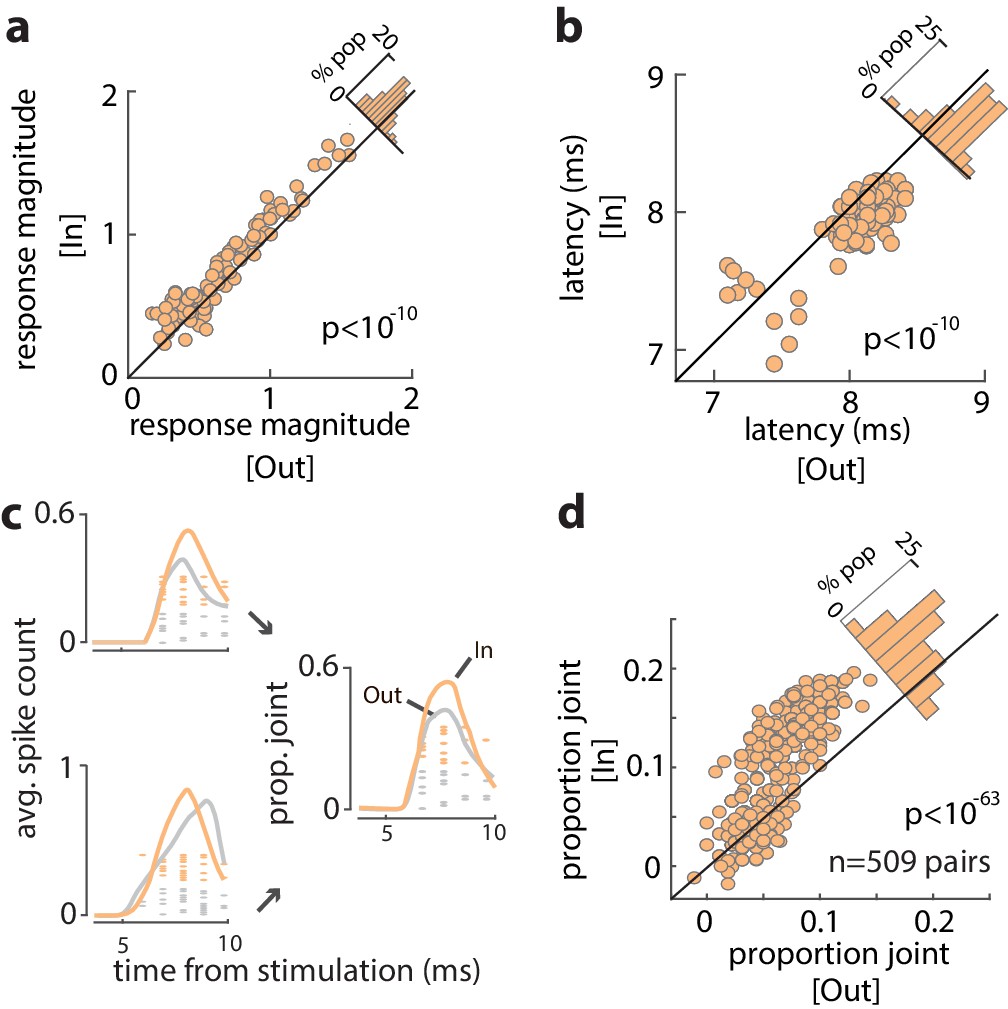
Increased efficacy of visual input to the FEF during WM.
(a) Magnitude of orthodromically evoked FEF responses and (b) latency of orthodromically evoked spikes during the delay period of the WM task, for memory of locations inside vs outside of the RF, for all visual-recipient FEF neurons. Figure 3—figure supplement 1 shows the average spike counts for In vs Out, and Figure 3—figure supplement 2 shows the relationship between change in efficacy and delay selectivity. (c) Left: mean spike counts and raster plots following V4 stimulation for two example neurons during memory of locations inside (peach) and outside (gray) of the RF. Right: proportion of joint spikes in the two example neurons during the two memory conditions. (d) Mean proportion of joint spikes for all pairs of visual-recipient FEF neurons during the two memory conditions, adjusted for firing rate. All data are from stimulation during the delay period of the MGS task.
Figure 3—figure supplement 1
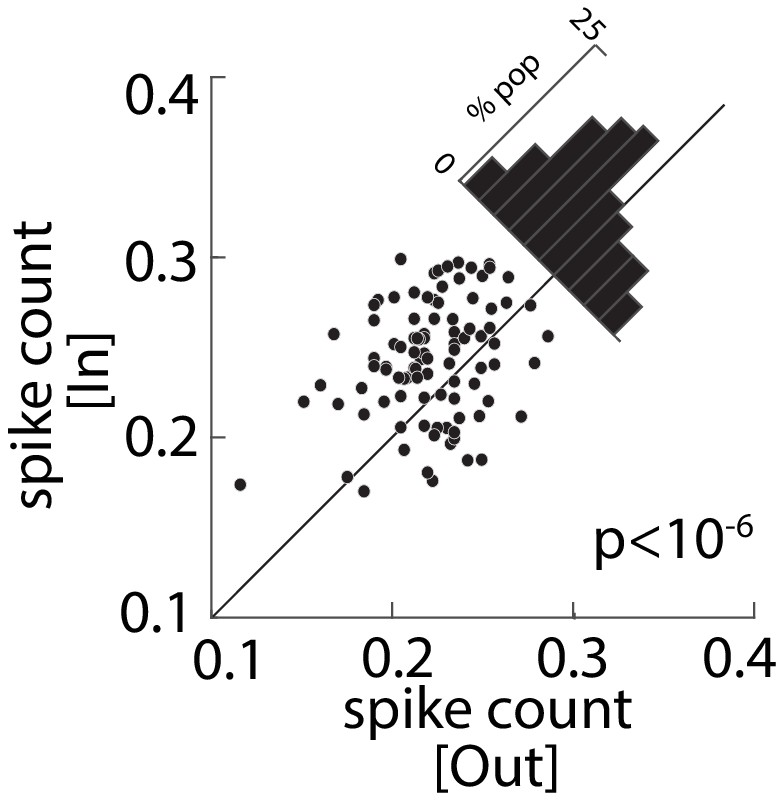
Average spike count as a measure of stimulation efficacy across the population of visual-recipient FEF neurons, for memory Out (x-axis) vs In (y-axis); diagonal histogram shows differences.
Remembering the RF location increased the average spike count within 5–9 ms after stimulation by 19% for the population of 96 visual-recipient FEF neurons (In = 0.22 ± 0.005, Out = 0.18 ± 0.004; p<10−6).
Figure 3—figure supplement 2
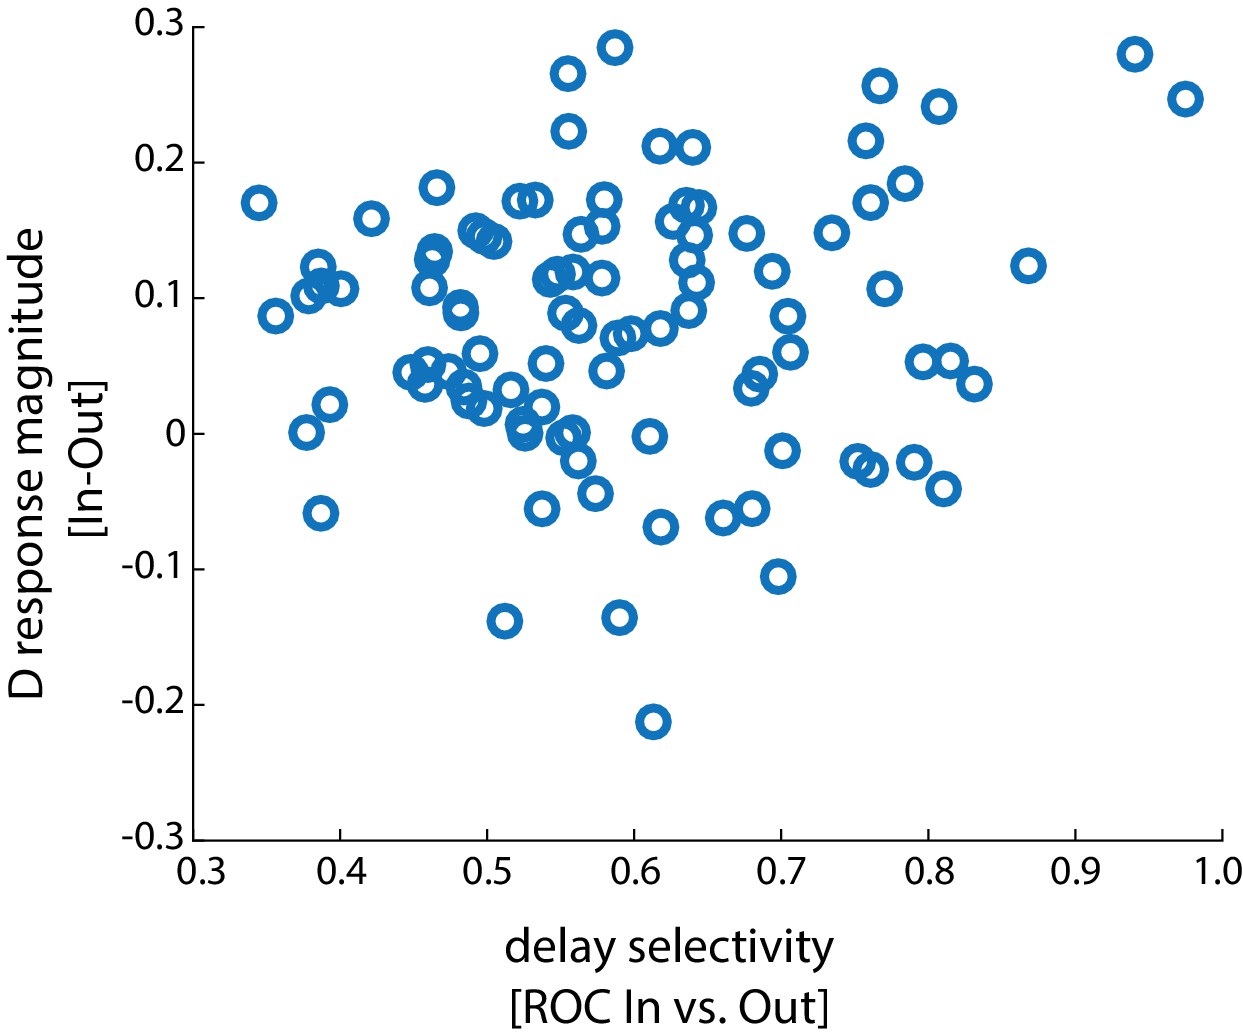
Working memory-induced change in stimulation efficacy as a function of the FEF neuron’s delay period selectivity.
Plot showing the difference in stimulation efficacy (response magnitude In – Out), as a function of the delay selectivity (receiver-operating characteristic [ROC] In vs Out) for each neuron. There was no significant correlation between delay selectivity and change in stimulation efficacy (r = 0.122, p = 0.235, Pearson correlation). The enhanced efficacy of orthodromic activation was also significant in the population of neurons showing delay selectivity <0.5 (Δ response magnitude = 0.083 ± 0.012, p<10−4, n = 26).
Additional files
Download links
A two-part list of links to download the article, or parts of the article, in various formats.
Downloads (link to download the article as PDF)
Open citations (links to open the citations from this article in various online reference manager services)
Cite this article (links to download the citations from this article in formats compatible with various reference manager tools)
Working memory gates visual input to primate prefrontal neurons
eLife 10:e64814.
https://doi.org/10.7554/eLife.64814


