The distinct roles of calcium in rapid control of neuronal glycolysis and the tricarboxylic acid cycle
- Department of Neurobiology, Harvard Medical School, United States
Figures
Figure 1 with 2 supplements
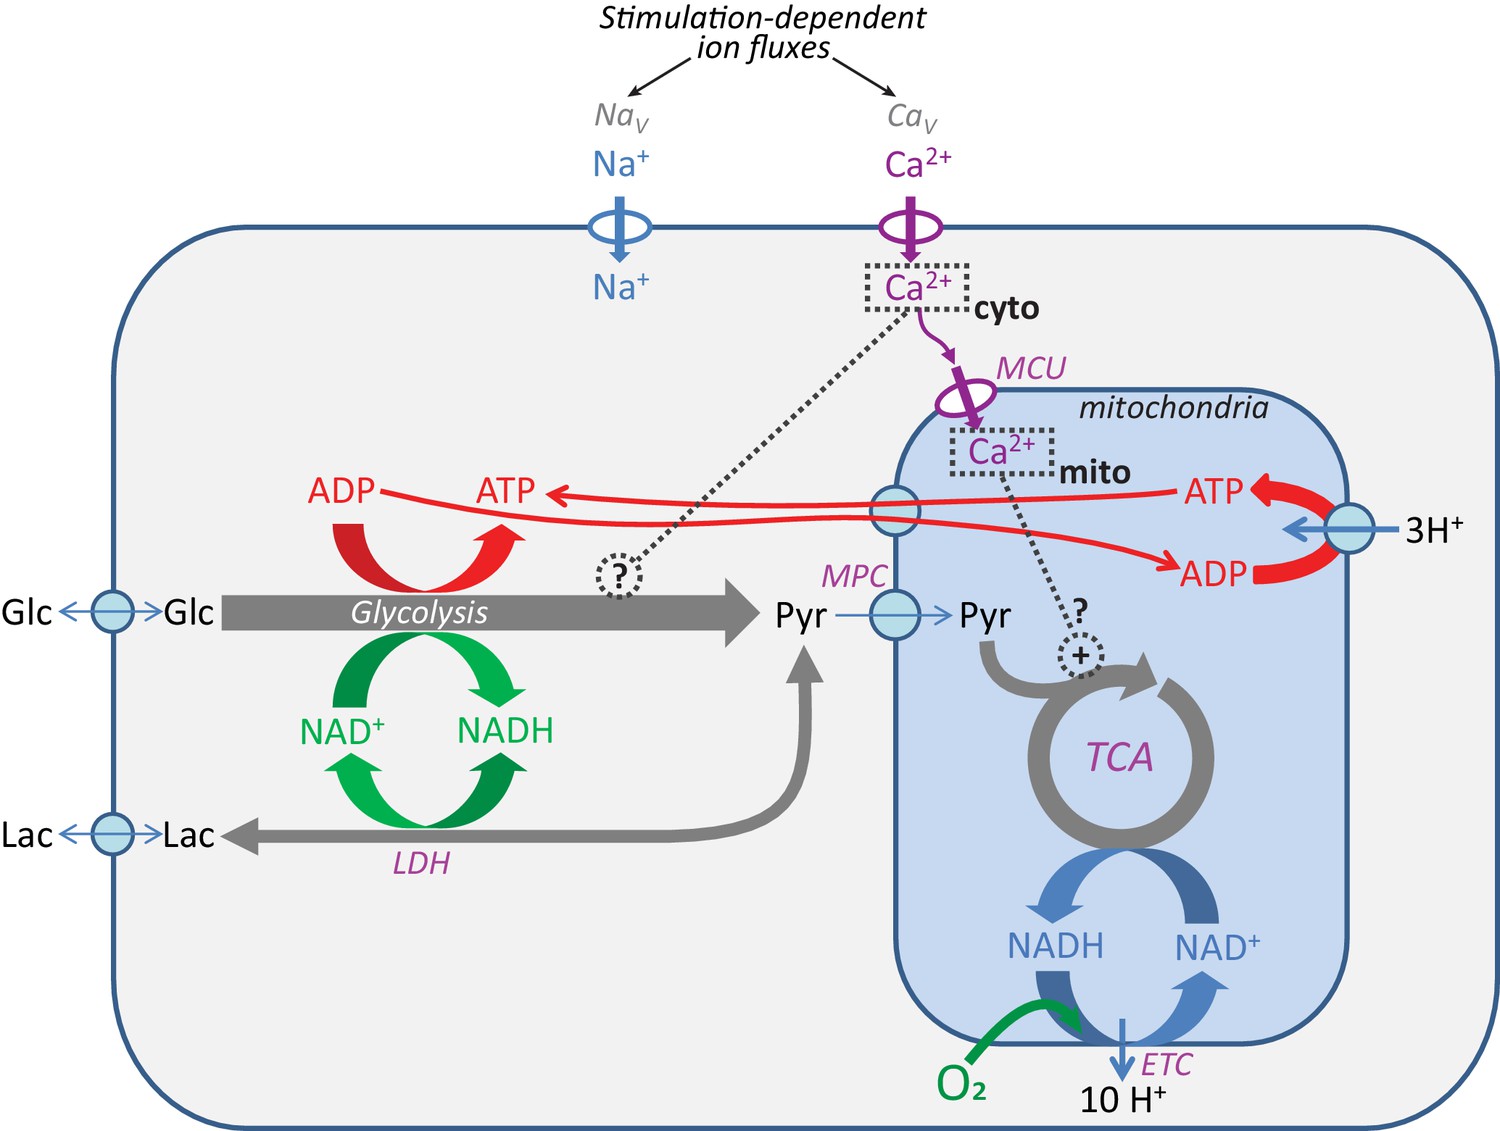
Pathways for core energy metabolism and the possible influences of calcium.
Glucose (Glc) and lactate (Lac) are possible fuel molecules, and both the ATP/ADP and NADH/NAD+ pairs are compartmentalized between cytosol and mitochondria, as is [Ca2+]. For mitochondria, the mitochondrial calcium uniporter (MCU) and mitochondrial pyruvate carrier (MPC) are shown, as well as the tricarboxylic acid (Krebs) cycle (TCA) coupled to oxidative phosphorylation (OXPHOS), performed by the electron transport chain (ETC), the proton gradient, and the ATP synthase. Voltage-gated Na+ channels (NaV) and voltage-gated Ca2+ channels (CaV) are the main pathways for ion entry to the neuronal somata during neuronal excitation. LDH = lactate dehydrogenase.
Figure 1—figure supplement 1
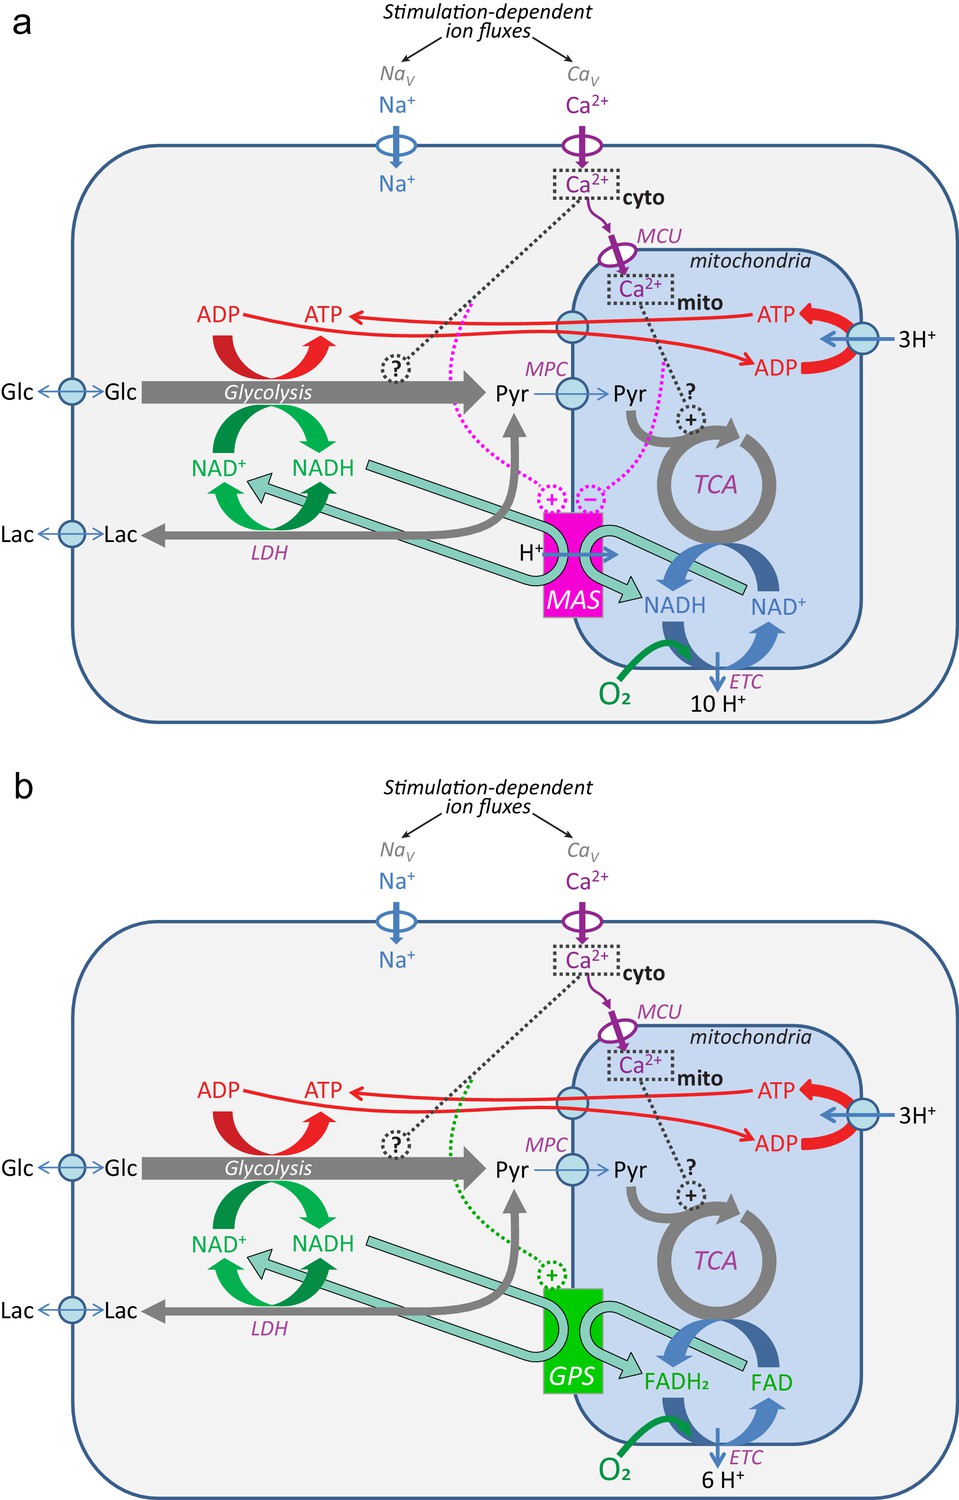
Ca2+ regulation of the mitochondrial NADH shuttles.
(a) Malate-aspartate shuttle (MAS); (b) the glycerol phosphate shuttle (GPS). References in the main text.
Figure 1—figure supplement 2

How ion influx influences cytosolic energy state.
Na+ entry through the voltage-activated Na+ channels (NaV) activates the Na+ pump (Na+,K+-ATPase) in the plasma membrane, converting ATP to ADP. Ca2+ entry through the voltage-activated Ca2+ channels (CaV) can lead to ATP hydrolysis by two different pathways: it can activate the plasma membrane Ca2+ pump/ATPase (PMCA), or the Na+,Ca2+ exchange transporter (NCX) can pump the Ca2+ out in exchange for Na+, leading to increased Na+ pumping through the Na+,K+-ATPase. ADP produced from any of these ATP hydrolysis reactions can affect glycolysis either by altering the mass action ratio for the phosphoglycerate kinase reaction or by allosteric effects (for instance, on phosphofructokinase; references in the main text). ADP can also lead to increased [AMP] via the adenylate kinase reaction (2ADP ↔ ATP + AMP).
Figure 2 with 6 supplements
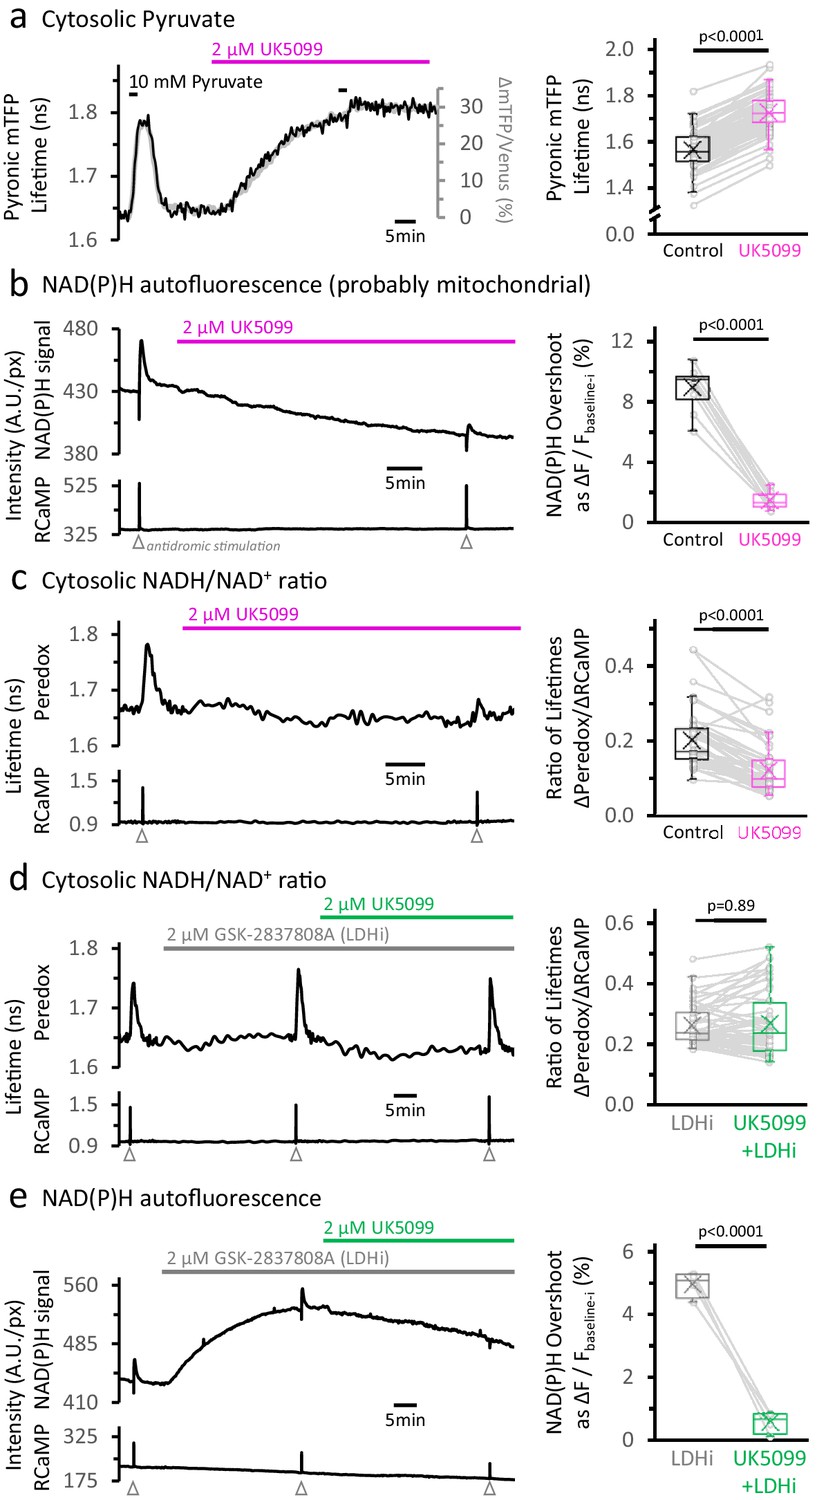
Inhibition of the mitochondrial pyruvate carrier reveals the independence of NADH transients in the cytosol and mitochondria.
(a) Left: Representative traces of two different readouts of the Pyronic sensor, expressed in the cytosol of a dentate granule cell (DGC). The lifetime of the donor species mTFP (black line, left Y-axis) is overlapped to the change in the ratio of intensities between the donor and the acceptor species (Δ mTFP/Venus), expressed as the percent change over the initial mTFP/Venus value (gray line, right Y-axis). Both readouts transiently increase in response to a brief exposure to 10 mM pyruvate for 2 min in the bath solution. The application of 2 µM UK5099, an inhibitor of the mitochondrial pyruvate carrier, steadily increased the Pyronic signal to a plateau after 30–35 min. The bars indicate the times of application of both pyruvate and UK5099. Right: Quantification of Pyronic mTFP lifetimes before and after the treatment with UK5099. Data points obtained before and after the application of UK5099 are connected by lines. Box plots represent the 25–75% (Q2—Q3) interquartile range, and the whiskers expand to the lower (Q1) and upper (Q4) quartiles of the distribution (5–95%). The median of the distribution is represented by a horizontal line inside the box, and the mean is represented by a cross symbol (×). The data were compared using a paired Student’s t’s test (Nneurons = 82, Nslices = 7 and Nmice = 4). (b) Left: Representative trace of the NAD(P)H autofluorescence signal (top), recorded from a population of DGCs in an acute hippocampal slice. These cells expressed the Ca2+ sensor RCaMP1h, whose fluorescence was simultaneously monitored as a proxy for neuronal activity (bottom). A stimulating electrode was placed in the hilus of the dentate gyrus of the hippocampus, and a train of depolarizing pulses was delivered to the DGC axons (antidromic stimulation) before and after the treatment. Treating with UK5099 reduces the baseline and the responses induced by stimulation. Right: Quantification of the normalized amplitudes of the NAD(P)H signal overshoot, with or without UK5099. The baseline before each stimulation (Fbaseline-i) was subtracted from the raw trace, and the difference between the baseline and the peak (ΔF=Fpeak-Fbaseline-i) is presented as a percentage change over the baseline (ΔF/Fbaseline-i). The data were compared using a paired Student’s t’s test (Nslices = 10 and Nmice = 6). (c) Left: Representative trace of Peredox and RCaMP1h lifetimes simultaneously recorded in a DGC. The Peredox lifetime at baseline, and the metabolic transients in response to neuronal stimulation, were recorded before and after the application of UK5099. Right: The NADHCYT transient was decreased in the presence of UK5099. The Peredox lifetime change from the baseline to the peak of the transient was divided by the magnitude of the RCaMP1h transient (ΔPeredox/ΔRCaMP), as the metabolic responses are correlated with the Ca2+ spikes (Díaz-García et al., 2017). The data were compared using a Wilcoxon matched pairs test (Nneurons = 48, Nslices = 7 and Nmice = 6). (d) Representative trace of Peredox and RCaMP1h lifetimes simultaneously recorded in a DGC, with sequential application of the LDH inhibitor GSK-2837808A (LDHi) and UK5099. The data were compared using a Wilcoxon matched pairs test (Nneurons = 52, Nslices = 6 and Nmice = 5). (e) Representative trace of the NAD(P)H autofluorescence signal and RCaMP1h fluorescence, simultaneously recorded from a population of DGCs in an acute hippocampal slice. Treating with 2 µM GSK-2837808A (LDH inhibitor) increases the baseline while preserving the waveform of the NAD(P)H responses to stimulation. The subsequent application of 2 µM UK5099, as in panel (d), diminished both phases of the NAD(P)H responses, especially the overshoot. The data were compared using a paired t-test (Nslices = 4 and Nmice = 3).
Figure 2—figure supplement 1

The rise in [pyruvate]CYT due to MPC inhibition almost saturates the Pyronic sensor.
(a) Representative images of DGCs expressing the Pyronic sensor, pseudocolored according to the lifetime of the donor species (mTFP). Cells perfused in ACSF only (Control), or in the presence of the MPC inhibitor UK5099, are shown before and after the application of 10 mM pyruvate as in Figure 2a. Images in the bottom were taken at the peak value of the response to pyruvate. The color scale bar to the right shows the range of lifetime for Pyronic mTFP. (b) The change in the Pyronic mTFP lifetime (LT) in response to external pyruvate application was diminished in DGCs after incubating with UK5099. Data points obtained before and after the application of UK5099 are connected by lines. The data were compared using a paired Student’s t’s test (Nneurons = 82, Nslices = 7 and Nmice = 4).
Figure 2—figure supplement 2
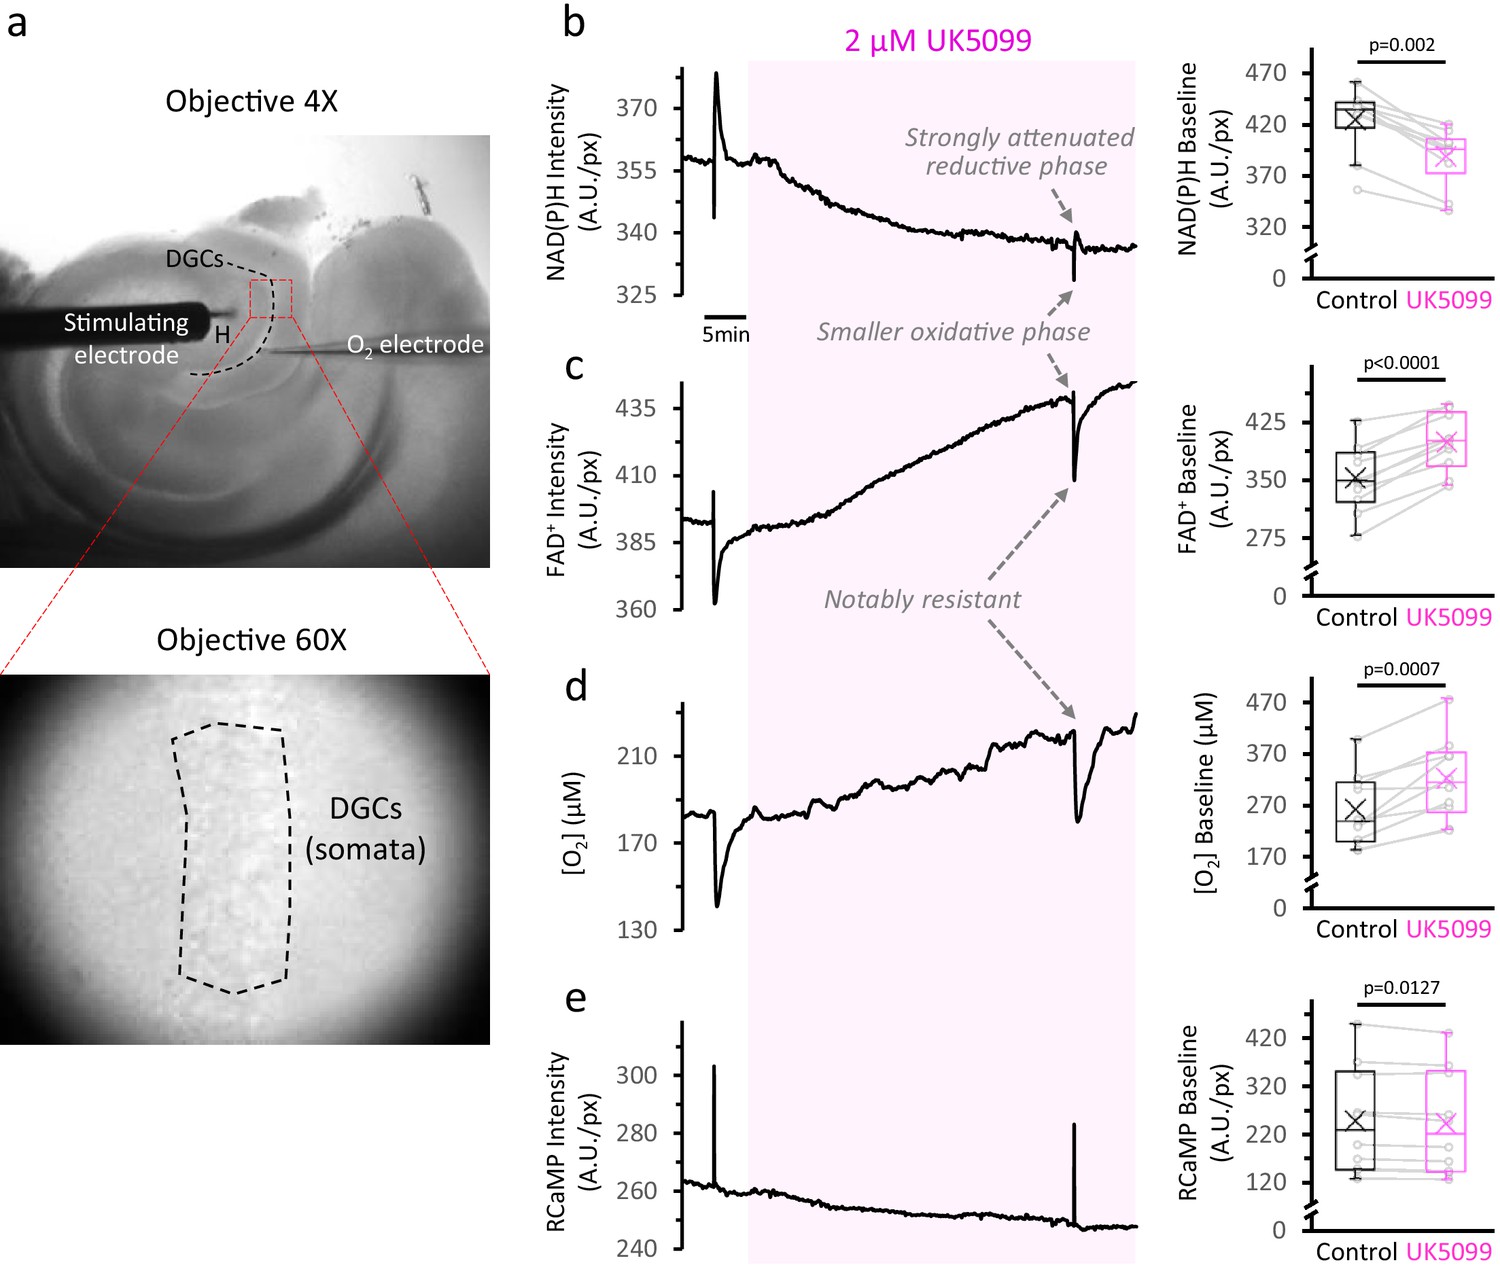
Inhibition of the mitochondrial pyruvate carrier slows down the TCA cycle and decreases O2 consumption at baseline.
(a) Top: Low-magnification image of an acute brain slice of the hippocampus, showing the placement of the stimulating electrode in the hilus (H) and the O2 electrode in the layer of dentate granule cells (DGCs). The red square represents the area used for imaging the NAD(P)H autofluorescence signals. Bottom: The identification of the area of interest (dashed-line polygon drawn in the DGC layer), was performed in infrared-illuminated/differential interference contrast images, obtained at high magnification (×60 objective) and a pixel binning of 8. (b) Left: Representative traces of NAD(P)H and FAD+ autofluorescence signals, extracellular oxygen concentration and RCaMP fluorescence, simultaneously recorded from a population of DGCs in a hippocampal slice. The shaded area corresponds to the application of 2 µM of the MPC inhibitor UK5099. Right: Effect of UK5099 treatment on the baseline level of each signal. Data points obtained before and after the application of UK5099 are connected by lines (Nslices = 10 and Nmice = 6 for NAD(P)H and FAD+ autofluorescence signals, along with RCaMP fluorescence). As shown in the representative trace, there were some experiments with oxygen and autofluorescence signals recorded simultaneously, but the full dataset for O2 measurements contained stand-alone O2 recordings as well (Nslices = 10 and Nmice = 5).
Figure 2—figure supplement 3

After MPC inhibition, O2 consumption and FADH2 production are less affected than mitochondrial NADH production in acutely stimulated DGCs.
(a) The traces represent the average normalized NAD(P)H signals (mean ± SD) before and after 2 µM UK5099 (as in Figure 2b), elicited by antidromic stimulation. The baseline before each stimulation (Fbaseline-i) was subtracted from the raw trace. The difference between the baseline and the dip (ΔF=Fdip-Fbaseline-i), presented as percent change over the baseline (ΔF/Fbaseline-i), was compared between the two conditions. Other panels show the comparisons for the time from the beginning of the stimulation to the minimum value of the initial dip and the recovery time from that minimum value to 50% of the amplitude of the dip. Additionally, we compared the overshoot/dip ratio, which reflects the relative contributions of the reductive and the oxidative phases to the NAD(P)H signal (re/ox), independently of changes in the baseline autofluorescence (Ivanov et al., 2014). This comparison also shows a decreased mitochondrial NADH production in stimulated neurons, following MPC inhibition. (b) Average normalized FAD+ traces, expressed as percent change from the baseline before each stimulation (Fbaseline-i). The difference between the baseline and the initial peak, or the undershoot (ΔF=Fpeak or undershoot-Fbaseline-i), were calculated as a percent change over the baseline (ΔF/Fbaseline-i). The time from the beginning of the stimulation to the peak, and the recovery time from the peak to 50% of its amplitude, were also compared. (c) Average normalized O2 recordings, expressed as percent change from the baseline before each stimulation. The graphs show the difference between the baseline and the dip in the O2 signal elicited by stimulation (Δ[O2]=[O2]dip-[O2]baseline-i), either as the absolute change (expressed in µM) or as percent change over the baseline (Δ[O2]/[O2]baseline-i). The time from the beginning of the stimulation to the minimum value of the [O2] upon stimulation, and the recovery time from this value to 50% of its amplitude, were also compared. (d) Average normalized RCaMP traces, expressed as percent change from the baseline before each stimulation (Fbaseline-i). The difference between the intensities at baseline and at the peak (ΔF=Fpeak-Fbaseline-i), expressed as A.U./px or as the percent change over the baseline (ΔF/Fbaseline-i), were compared between the recordings before and after MPC inhibition. The time from the beginning of the stimulation to the peak, and the recovery time from the peak to 50% of its amplitude, were also compared. Surprisingly, neither the dip of the NAD(P)H signal nor the transient increase in O2 consumption in the tissue were as attenuated as the NAD(P)H overshoot, although both were mildly decreased. A likely explanation for these changes is that MPC inhibition partially depolarizes mitochondria, slowing down events that require an energized mitochondria. These events include Ca2+ influx, the adenine nucleotide exchanger and Complex V (Metelkin et al., 2006; reviewed by Kann and Kovács, 2007; Zorova et al., 2018), all of which further dissipate the mitochondrial membrane potential and/or the proton gradient, contributing to NADH oxidation. Data points obtained before and after the application of UK5099 are connected by lines (Nslices = 10 and Nmice = 6 for NAD(P)H and FAD+ autofluorescence signals, along with RCaMP fluorescence). Oxygen recordings were performed simultaneously to the autofluorescence signals in most of the experiments, except one (Nslices = 10 and Nmice = 5). A paired Student’s t test was used for comparisons between normally distributed data, or a non-parametric paired Wilcoxon test was used otherwise.
Figure 2—figure supplement 4

MPC inhibition shortens the NADHCYT transient.
(a) Filmstrip of the metabolic response in the cytosol of stimulated DGCs, before and after the application of 2 µM UK5099 (as in Figure 2c). The images were pseudocolored according to the lifetime of Peredox and RCaMP. The time stamp at −10 s corresponds to the baselines, ten seconds prior to the stimulation. A train of depolarizing pulses was delivered at time zero, which is revealed by an increase in the RCaMP lifetime because of the intracellular Ca2+ spike. The bottom row of images corresponds to the peak NADH response in the cytosol (+40 s), in control conditions. The color scale bar to the right shows the range of lifetimes for both sensors. The UK5099-treated DGCs exhibit a lower Peredox lifetime at baseline and an attenuated NADHCYT response to stimulation. (b–c) Effects of UK5099 on the parameters derived from the Peredox and RCaMP transients, respectively. The full dataset of Figure 2c was used (Nneurons = 48, Nslices = 7 and Nmice = 6), except for comparisons of the time to peak and decay of the NADHCYT response, when only neurons that presented a ΔPeredox Lifetime ≥ 0.05 ns after UK5099 were analyzed (Nneurons = 13, Nslices = 3 and Nmice = 3). A paired Student’s t test was used for comparisons between normally distributed data, or a non-parametric paired Wilcoxon test was used otherwise.
Figure 2—figure supplement 5
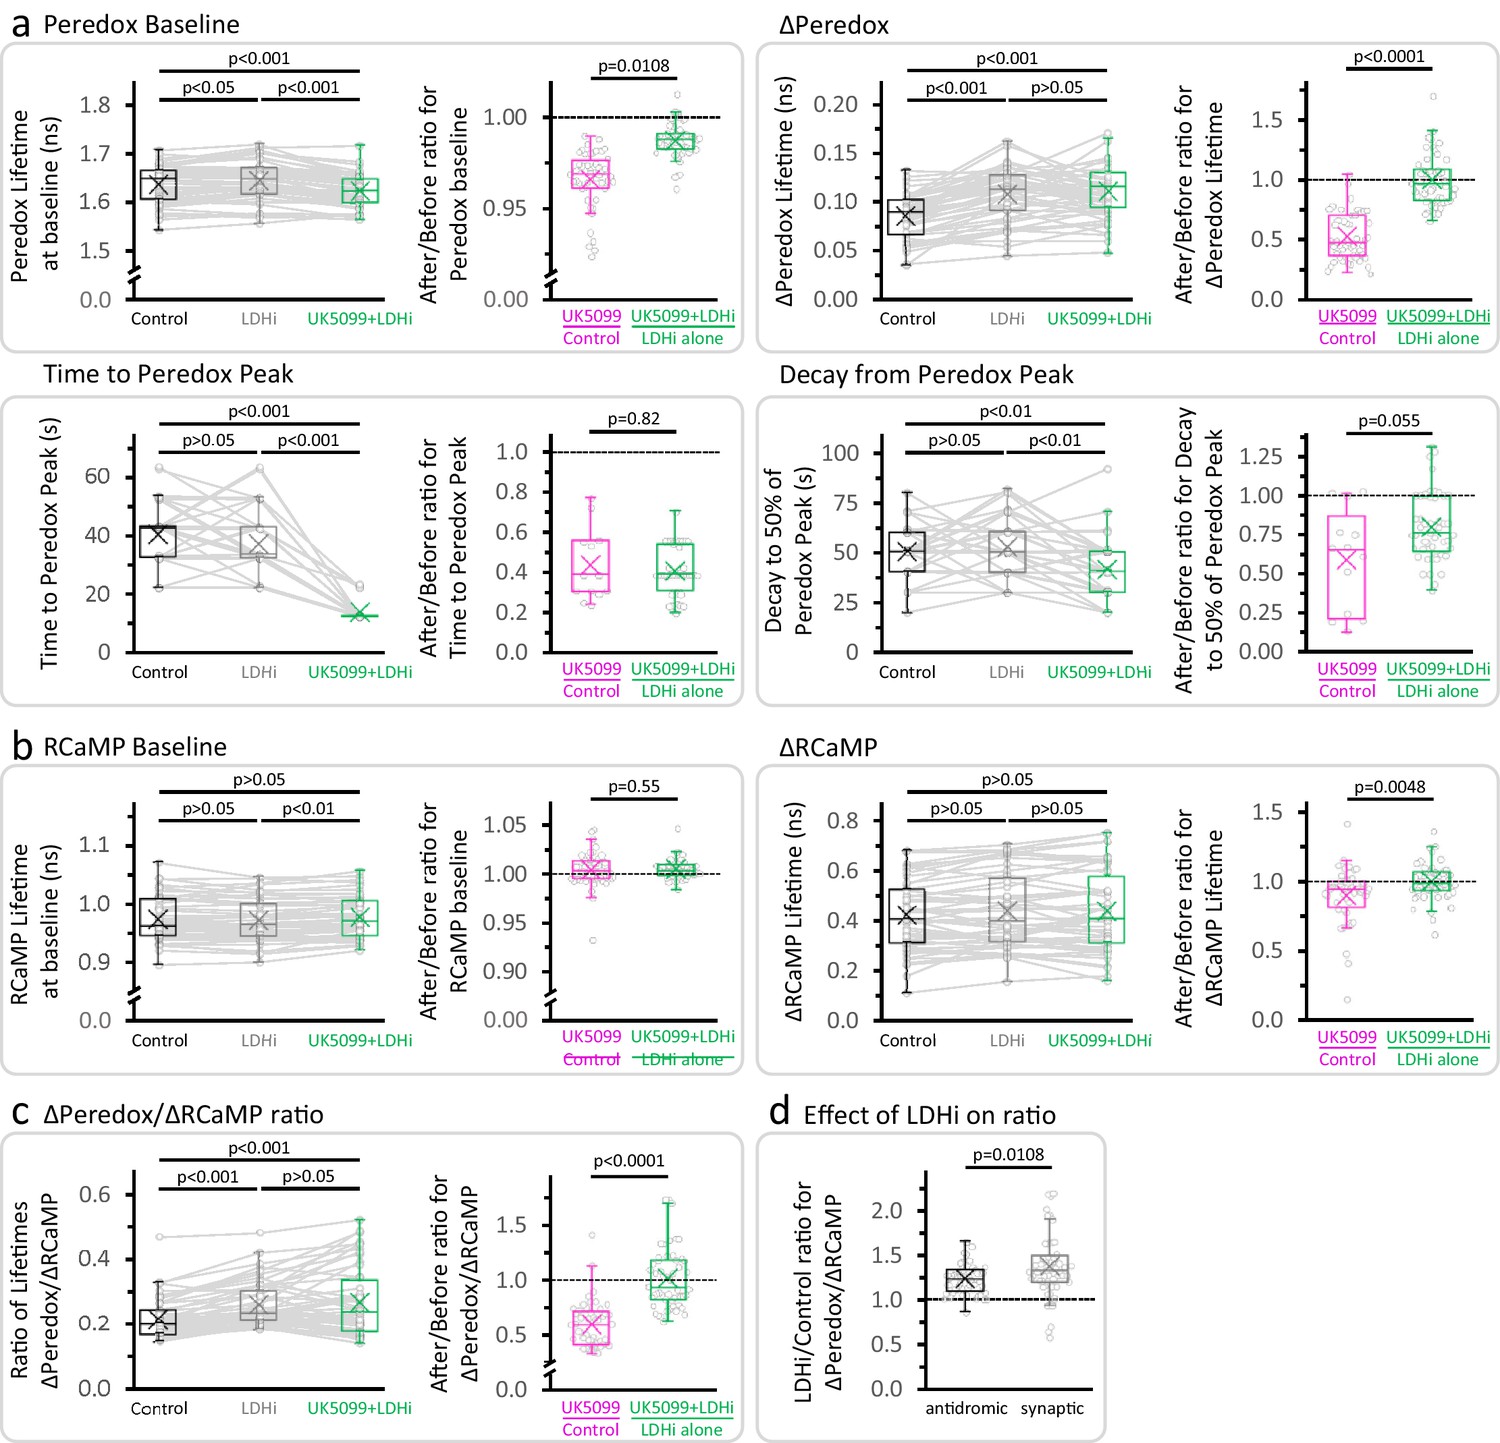
LDH inhibition prevents the effect of UK5099 on the amplitude of the NADHCYT transient, but not on its time course.
(a–b) Effects of the sequential application of 2 µM GSK-2837808A and 2 µM UK5099 (as in Figure 2d) on the parameters derived from the Peredox and RCaMP transients, respectively. The full dataset of Figure 2d was used (Nneurons = 52, Nslices = 6 and Nmice = 5), except for comparisons of the time to peak and decay of the NADHCYT response, when only neurons that presented a ΔPeredox Lifetime ≥ 0.05 ns during all the experiment were included (Nneurons = 49, Nslices = 6 and Nmice = 5). For multiple comparisons of normally distributed data, a repeated measures ANOVA was used, with a Student-Newman-Keuls post-test. The data were compared using a non-parametric repeated measures ANOVA (Friedman test) with a Dunn post-test otherwise. The ratio (after UK5099)/(before UK5099) was included for each parameter, to compare the conditions UK5099/Control and (UK5099+LDHi)/LDHi alone (as in Figure 2e). For UK5099/Control, the full dataset of Figure 2c was used (Nneurons = 48, Nslices = 7 and Nmice = 6), except for comparisons of the time to peak and decay of the NADHCYT response, when only neurons that presented a ΔPeredox Lifetime ≥ 0.05 ns after UK5099 were analyzed (Nneurons = 13, Nslices = 3 and Nmice = 3). A Student’s t test or a Welch’s t-test were used for comparisons between normally distributed data, or a non-parametric Mann-Whitney test was used otherwise. (c) Effects of the sequential application of GSK-2837808A and UK5099 (as in Figure 2d) on the ratio of lifetimes ΔPeredox/ΔRCaMP. (d) Comparison of the size effect of LDH inhibition on the NADHCYT transients elicited with antidromic stimulation (data from experiments in Figure 2d, Nneurons = 52, Nslices = 6 and Nmice = 5) or synaptic stimulation (data from Figure 4 3F in Díaz-García et al., 2017, Nneurons = 54, Nslices = 5 and Nmice = 5), using a Mann-Whitney test.
Figure 2—figure supplement 6
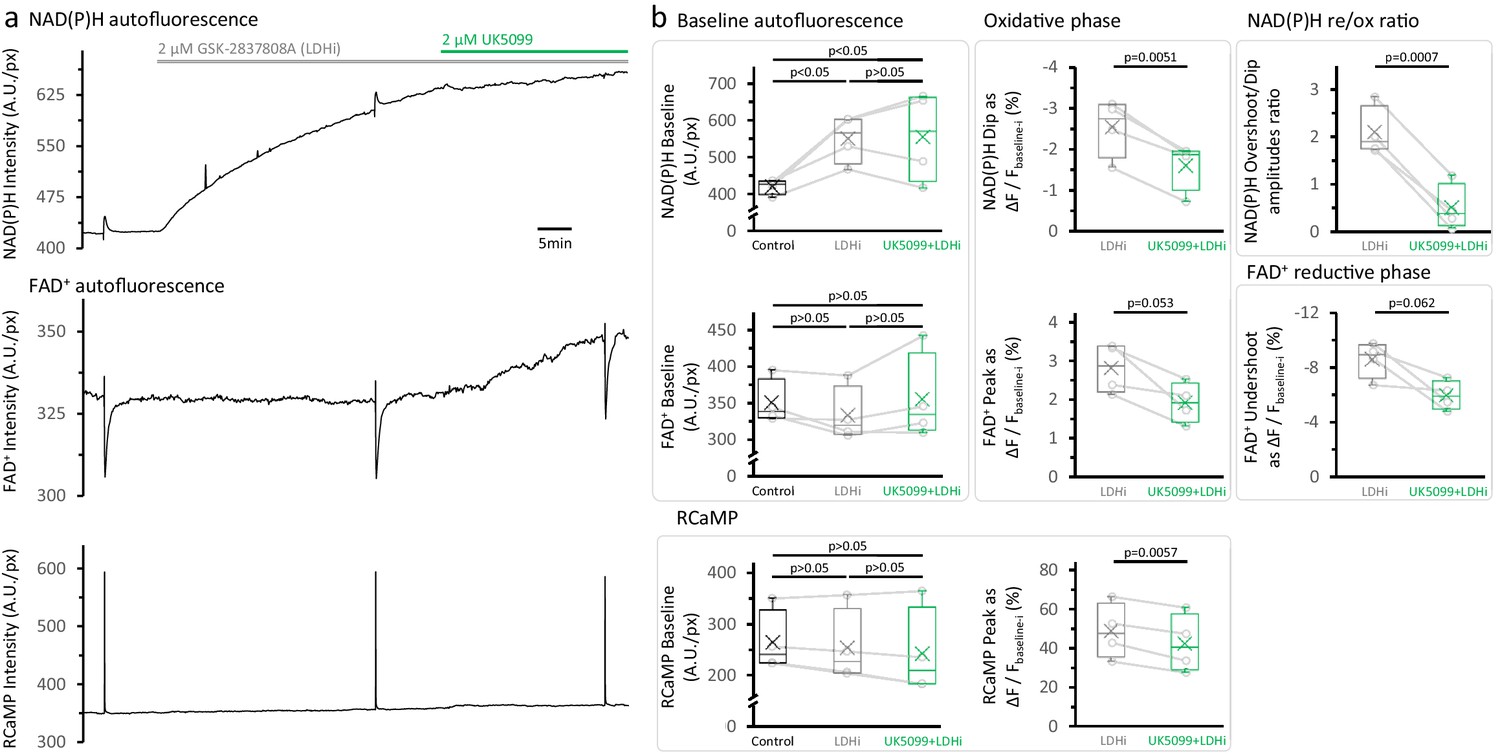
LDH inhibition elevates the NAD(P)H autofluorescence at baseline but does not restore the NAD(P)H overshoot after the treatment with UK5099.
(a) Representative traces of simultaneously recorded NAD(P)H and FAD+ autofluorescence signals, and RCaMP fluorescence, in a population of DGCs in an acute brain slice. (b) Effects of the sequential application of 2 µM GSK-2837808A and 2 µM UK5099 on the parameters derived from the NAD(P)H and RCaMP transients. The treatment with GSK-2837808A alone significantly elevated the baseline of the NAD(P)H autofluorescence by 31 ± 12%, likely because of the combination of two factors: an increased pyruvate availability and a higher NADH transfer from the cytosol to the mitochondria via the MAS. Since the responses to stimulation seems to occur independently from the changes in the NAD(P)H baseline. The FAD+ signal at baseline was unaltered by LDH inhibition and showed the expected trends after MPC inhibition with UK5099. Baselines were compared using a repeated measures ANOVA, with a Student-Newman-Keuls post-test (Nslices = 4 and Nmice = 3). Comparisons for other parameters were restricted to before and after the application of UK5099, in the continuous presence of an LDH inhibitor. These comparisons were performed using a paired t-test.
Figure 3 with 5 supplements
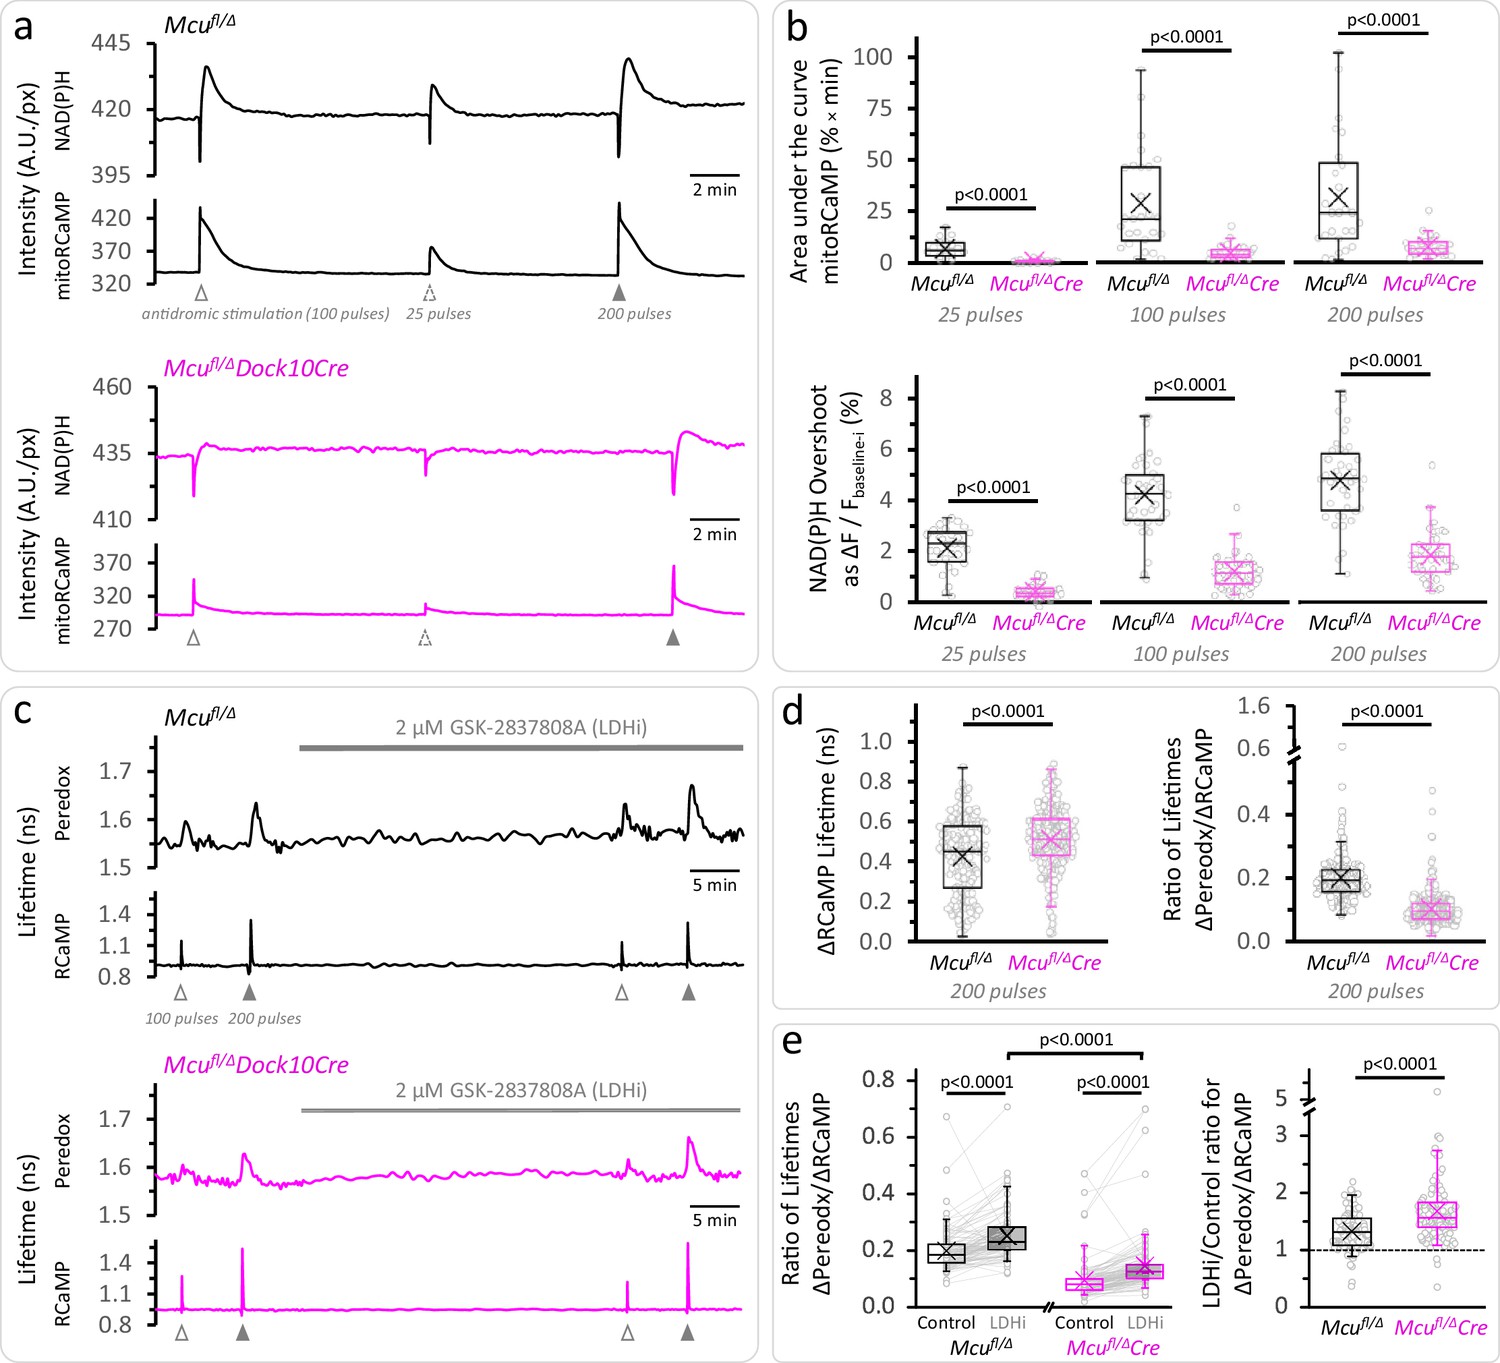
Calcium entrance via MCU is essential for the mitochondrial NAD(P)H overshoot.
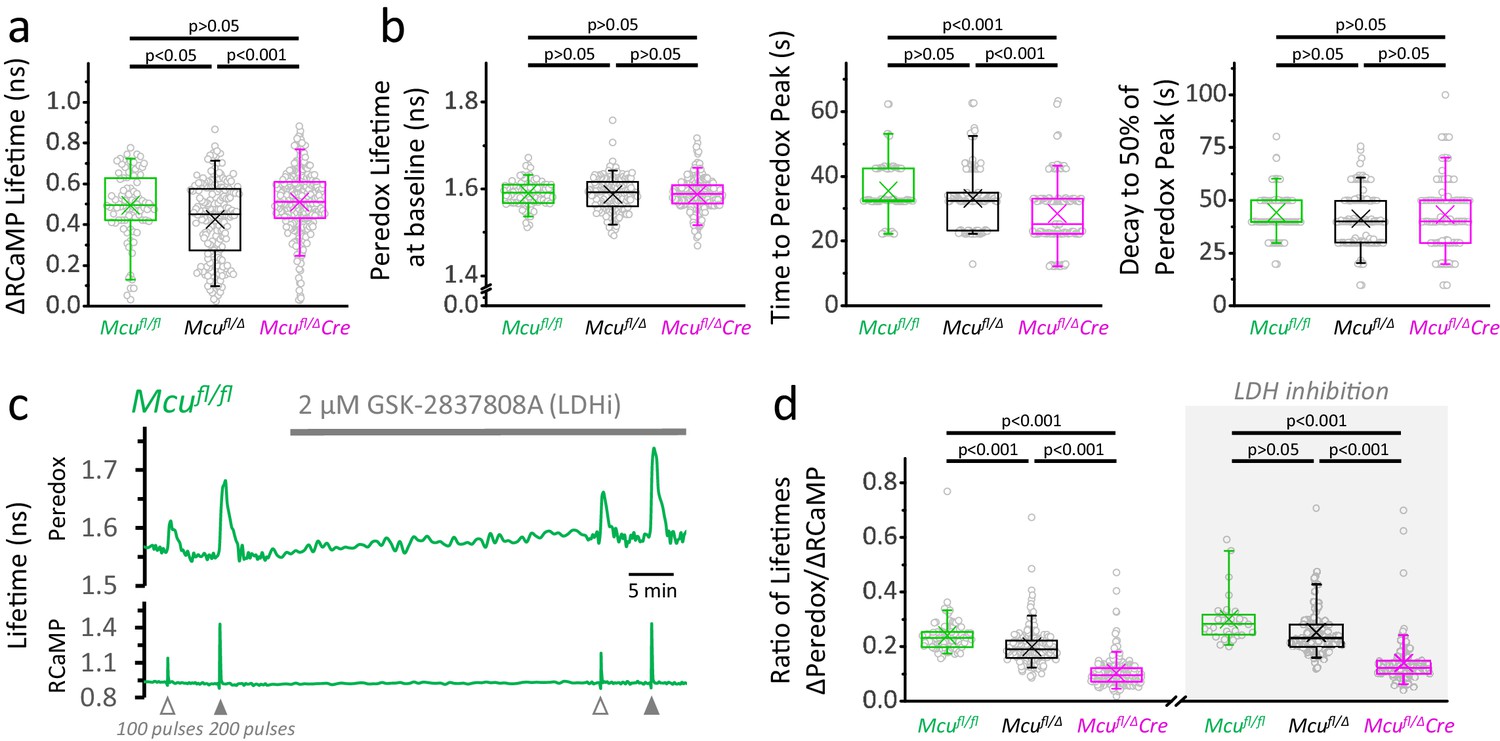
(a) Representative traces of the NAD(P)H autofluorescence signals and the mitoRCaMP1h transients in response to different trains of depolarizing pulses. The data correspond to simultaneously recorded signals from a population of DGCs in acute hippocampal slices. (b) Top: Overall Ca2+ entry into the mitochondria was estimated using the area under the curve of the mitoRCaMP signal, a measure that is resistant to the very brief transient that remains in the MCU-KD experiments. It was compared between Mcufl/Δ (25 pulses: Nslices = 17, Nmice = 10; 100 pulses: Nslices = 27, Nmice = 12; 200 pulses: Nslices = 26, Nmice = 12) and Mcufl/ΔDock10Cre mice (abbreviated Mcufl/ΔCre in the figure, 25 pulses: Nslices = 21, Nmice = 9; 100 pulses: Nslices = 31, Nmice = 13; 200 pulses: Nslices = 30, Nmice = 12). Data points represent individual slices. Only recordings with a peak amplitude ≥1% over the baseline were included for analysis. The area under the curve was calculated using the trapezoidal rule as the product of the signal amplitude (in %) and the acquisition interval (in min), for 2 min after the beginning of the stimulation. All comparisons were performed using a Mann-Whitney test. Bottom: The NAD(P)H overshoot was diminished in Cre-expressing DGCs of Mcufl/Δ mice. The datasets used for comparisons included slices that did not expressed mitoRCaMP in Mcufl/Δ (25 pulses: Nslices = 31, Nmice = 17; 100 pulses: Nslices = 41, Nmice = 19; and 200 pulses: Nslices = 40, Nmice = 19) and Mcufl/ΔDock10Cre (25 pulses: Nslices = 39, Nmice = 19; 100 pulses: Nslices = 49, Nmice = 23; and 200 pulses: Nslices = 48, Nmice = 22). All comparisons were performed using an unpaired t-test with a Welch’s correction. (c) Representative traces of Peredox and RCaMP1h lifetimes simultaneously recorded in DGCs of both genotypes. The typical stimulation protocol of 100 pulses elicited a smaller response (both in RCaMP and Peredox) in adult animals compared to juvenile mice. Increasing the number of pulses to 200 improved the detection of the NADHCYT transients. (d) Left: Comparison of the ΔRCaMP lifetime transient between Mcufl/Δ mice (Nneurons = 197, Nslices = 21 and Nmice = 9) and Mcufl/ΔDock10Cre mice (Nneurons = 275, Nslices = 27 and Nmice = 11). The range of the data is similar between genotypes, although the mean Ca2+ transient is higher in Mcufl/ΔDock10Cre mice. It is unlikely that this reflects an impaired clearance of cytosolic Ca2+ by mitochondria, since the transients in MCU-lacking DGCs were similar to neurons from Mcufl/fl mice (Figure 3—figure supplement 4). Right: The NADHCYT transient was decreased in DGCs lacking MCU, as revealed by the comparison of the ratio of the Peredox lifetime change, divided by the magnitude of the RCaMP1h transient (to normalize the metabolic responses to the elevation in [Ca2+]CYT). (e) Left: Pyruvate accumulation is partially responsible for the diminished NADHCYT transients in Mcufl/ΔDock10Cre mice, but there might be other mechanisms contributing to this difference. In a subset of slices that were treated with the LDH inhibitor, the ΔPeredox/ΔRCaMP ratio increased in both groups but it did not equalize the transients in the two genotypes; DGCs from Mcufl/ΔDock10Cre mice (Nneurons = 113, Nslices = 12 and Nmice = 6) remained about ~57% of hemizygote Mcufl/Δ mice (Nneurons = 103, Nslices = 12 and Nmice = 6). These comparisons were performed using a paired Wilcoxon test. Right: Consistent with cytosolic pyruvate accumulation in the MCU-KD, LDH inhibition produced a larger increase of the ΔPeredox/ΔRCaMP ratio in the MCU-KD. Mann-Whitney test was used for all comparisons except where stated otherwise.
Figure 3—figure supplement 1
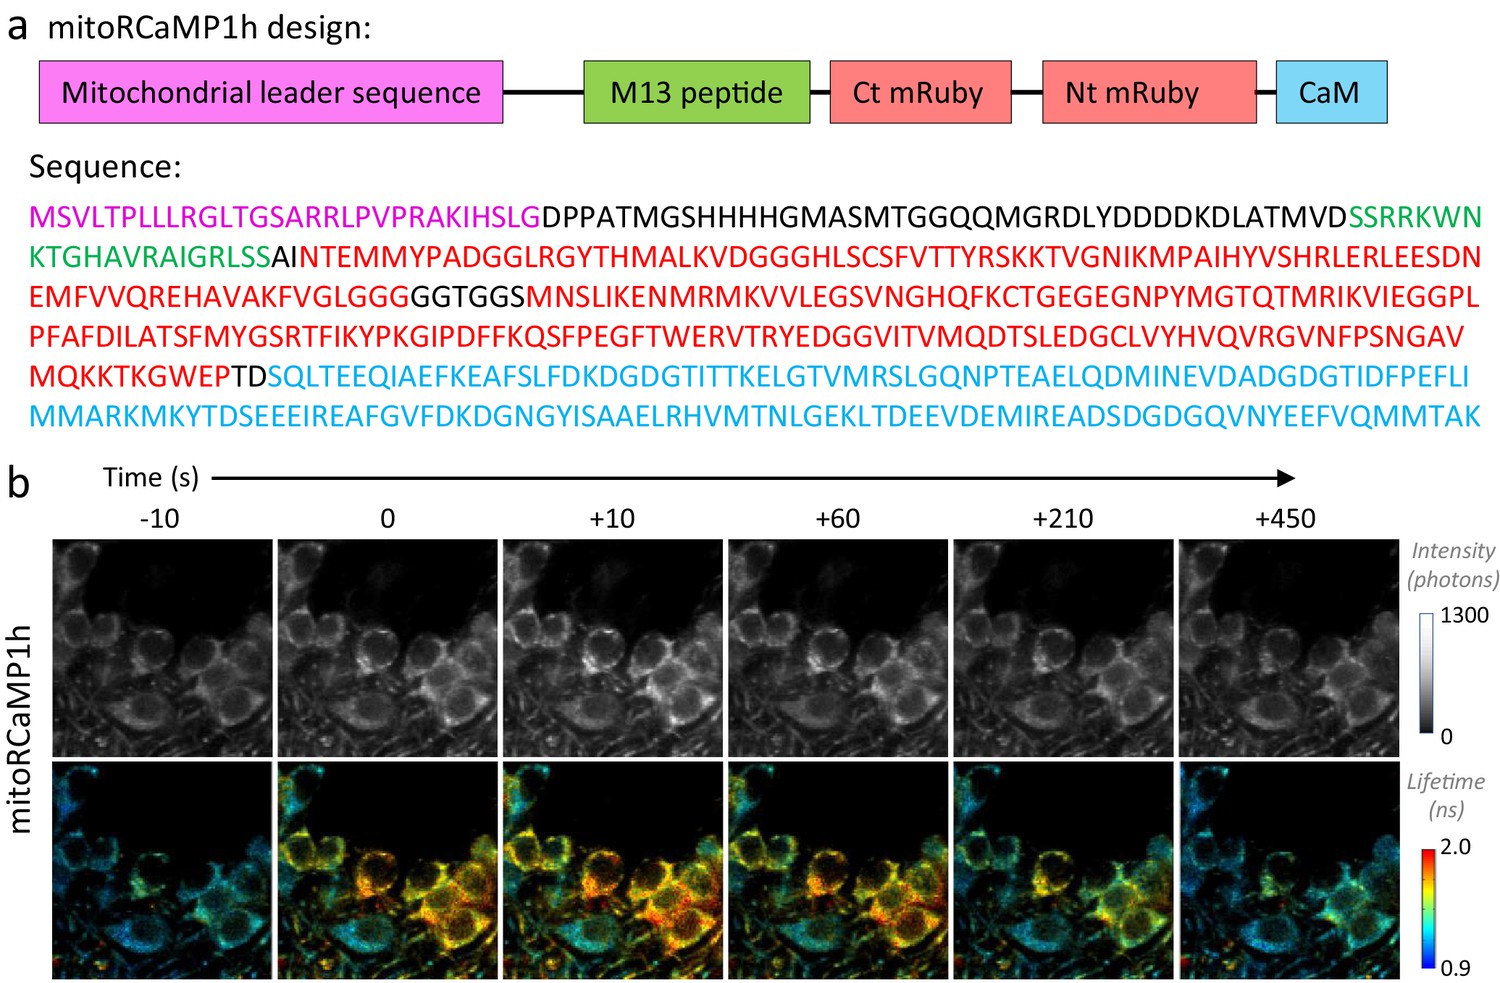
Design of the mitochondrially targeted RCaMP1h.
(a) Top: Schematic representation of mitoRCaMP1h. Abbreviations indicate the mitochondrial leader sequence from the Cox8 subunit (as used in Li et al., 2014), added to the RCaMP1h sensor that includes the calmodulin (CaM) and M13 peptide, and the circularly permuted mRuby (Akerboom et al., 2013). The abbreviations Nt and Ct correspond to the amino and carboxy-termini of mRuby, respectively. The size of the boxes does not reflect the length of the sequences. Bottom: Amino acid sequence of the mitoRCaMP1h sensor, with colors matching the schematic representation in the top panel. (b) Filmstrip of DGCs in an acute hippocampal slice from a juvenile mouse, expressing the RCaMP1h sensor in the mitochondria (mitoRCaMP) and imaged using 2p-FLIM. Upon stimulation at time zero, the mitoRCaMP fluorescence intensity (top) and lifetime (bottom) promptly increased and then decayed over the span of several minutes.
Figure 3—figure supplement 2
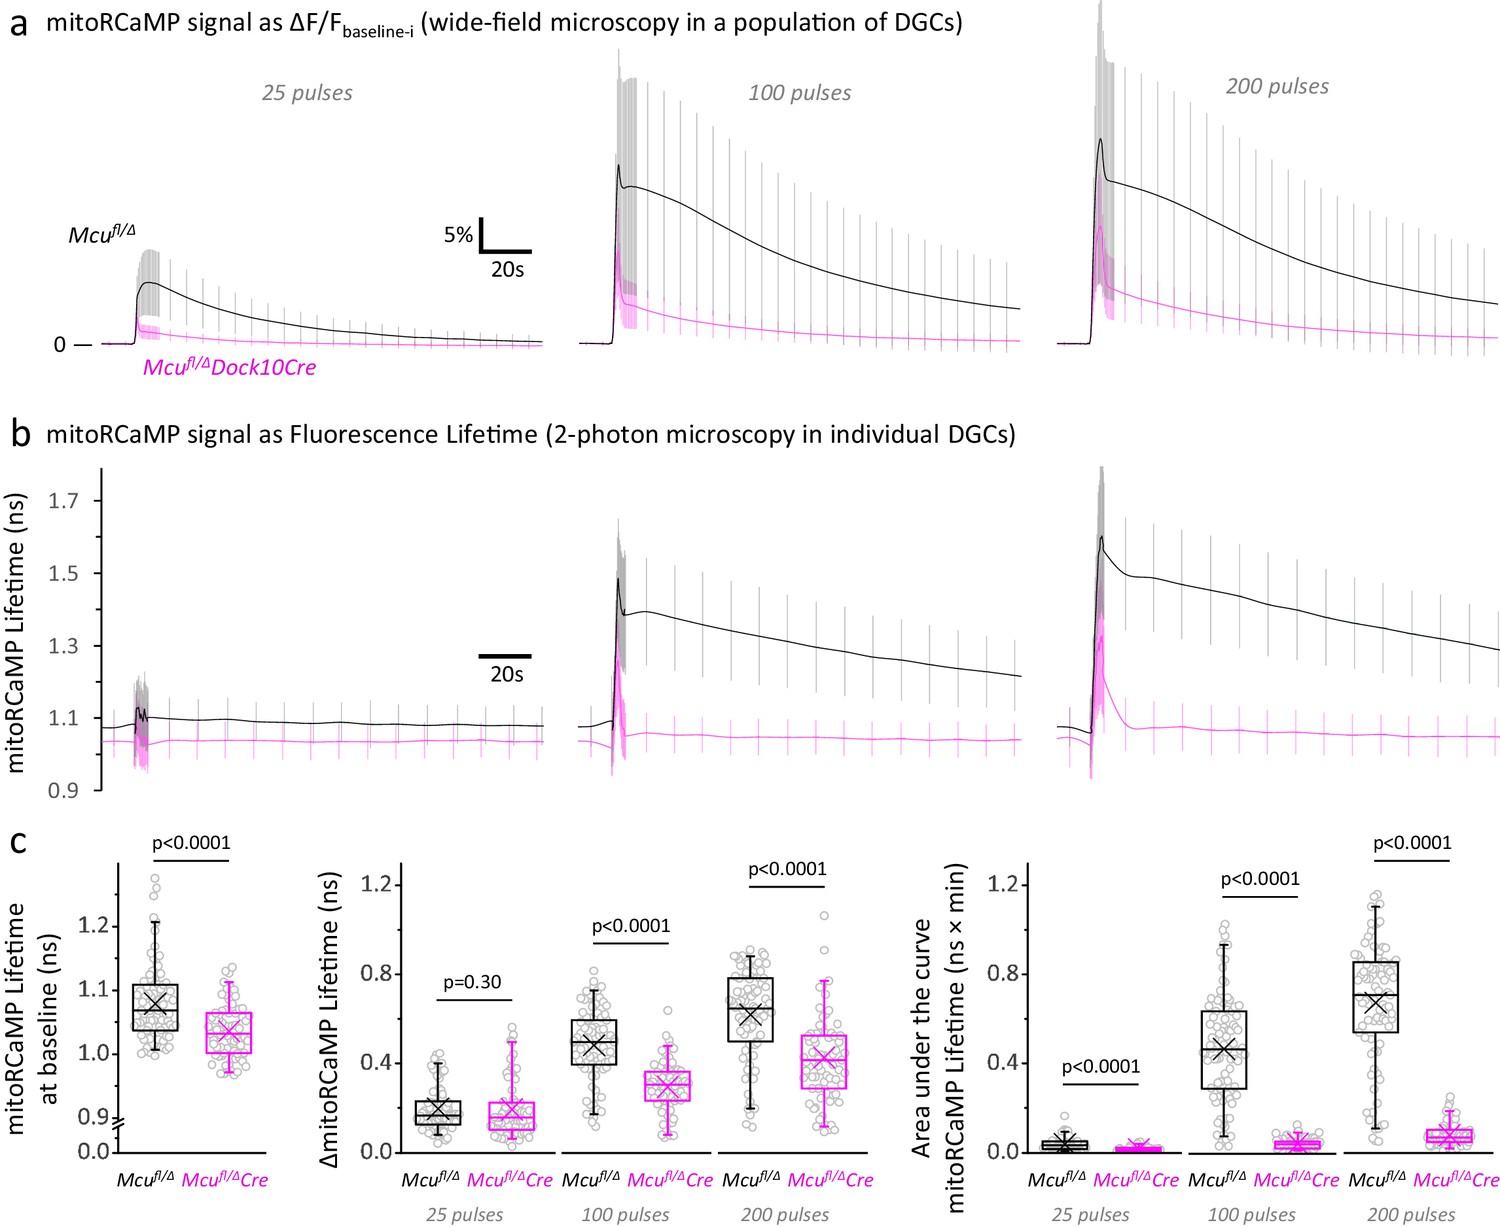
Mitochondrial Ca2+ levels at rest and during stimulation are lower in DGCs from Mcufl/Δ Dock10Cre mice, compared to Mcufl/Δ control mice.
(a) Fluorescence signals from a mitochondrial matrix-targeted Ca2+ sensor (mitoRCaMP) in a population of hemizygous control DGCs (Mcufl/Δ) and MCU-KD DGCs (Mcufl/Δ Dock10-Cre), imaged using wide-field microscopy. The baseline before each stimulation (Fbaseline-i) was subtracted from the raw trace and average traces of the mitoRCaMP signal were expressed as the ΔF/Fbaseline-i ratio (mean ± SD, sample sizes as in Figure 3b, Left panel). In the control DGCs, the Ca2+ signal is mainly slowly declining, whereas a fast initial peak is more prominent in the MCU-KD DGCs. (b) Representative traces of the mitoRCaMP lifetimes in individual DGCs, imaged using two-photon microscopy. Data represents the mean ± SD (calculated with the number of neurons) in Mcufl/Δ mice (Nneurons = 89, Nslices = 13 and Nmice = 5) and Mcufl/ΔDock10Cre mice (Nneurons = 73, Nslices = 12 and Nmice = 4). (c) The mitoRCaMP lifetimes at baseline in DGCs from Mcufl/ΔDock10Cre mice are smaller than Mcufl/Δ mice, which indicates a lower [Ca2+]MITO in resting MCU-KD neurons. The maximum magnitude of the mitoRCaMP transient (ΔmitoRCaMP Lifetime) was also decreased in MCU-KD neurons when stimulated with 100 or 200 pulses. Similar to the fluorescence intensity, the area under the curve of the mitoRCaMP lifetime traces was strongly diminished in MCU-KD neurons, indicting a reduced Ca2+entry into the mitochondria at all the stimulations tested. A Student’s t test or a Welch’s t-test was used for comparisons between normally distributed data; otherwise a non-parametric Mann-Whitney test was used.
Figure 3—figure supplement 3
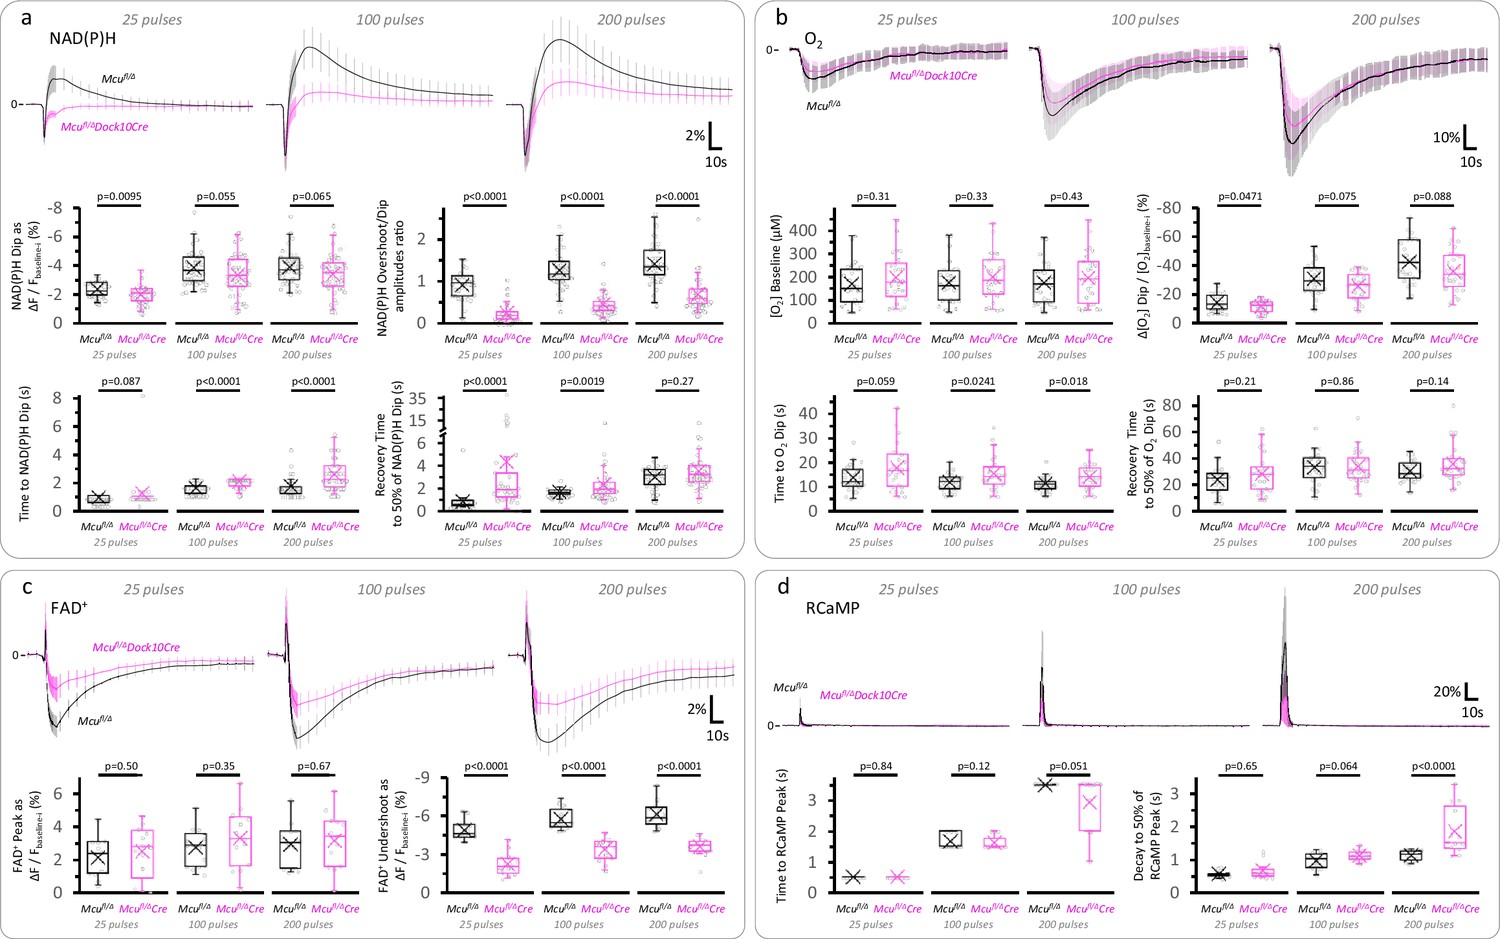
The initial dip of the NAD(P)H signal, the overall FAD+ signal, and the O2 dip in response to stimulation, are less affected than the slow NAD(P)H overshoot in DGCs from Mcufl/Δ Dock10Cre mice.
(a) Average traces of the NAD(P)H signal expressed as the ΔF/Fbaseline-i ratio (mean ± SD of number of slices, sample sizes as in Figure 3b, Right panel). The initial dip of the NAD(P)H signal was marginally affected in Mcufl/Δ Dock10Cre mice compared to Mcufl/Δ mice, despite a marked attenuation of the NAD(P)H overshoot. The lack of MCU also prolonged the time to the initial dip and delayed the recovery of the fluorescence after reaching a minimum upon stimulation, likely reflecting less overlap between the oxidative and reductive phases of the NAD(P)H signal due to the attenuation of the overshoot. (b) The dip in tissue [O2] following the stimulation of the layer of DGCs was marginally decreased in Mcufl/ΔDock10Cre mice (25 pulses: Nslices = 26, Nmice = 13; 100 pulses: Nslices = 27, Nmice = 14; 200 pulses: Nslices = 29, Nmice = 14), when compared to Mcufl/Δ mice (25 pulses: Nslices = 27, Nmice = 15; 100 pulses: Nslices = 28, Nmice = 15; and 200 pulses: Nslices = 27, Nmice = 15). (c) The late decrease in the FAD+ signal (the ‘Undershoot’) was less attenuated than the NAD(P)H overshoot in DGCs from Mcufl/ΔDock10Cre mice (Nslices = 13, Nmice = 8 for all stimulations), when compared to Mcufl/Δ mice (Nslices = 13, Nmice = 6 for all stimulations). (d) The time course of the cytosolic RCaMP1h signal in response to stimulation was very similar between both groups, except for a ~ 1.65-fold increase in the decay time to 50% of the peak of Mcufl/ΔDock10Cre mice (Nslices = 13, Nmice = 8) versus Mcufl/Δ mice (Nslices = 13, Nmice = 6), when stimulating with 200 pulses. For the reasons described in the legend of Figure 3—figure supplement 2 regarding the variability in sensor expression levels, here we focused on the kinetics of the signal and later assessed the magnitude of the [Ca2+]CYT spike in 2p-FLIM experiments. A Student’s t test or a Welch’s t-test were used for comparisons between normally distributed data, or a non-parametric Mann-Whitney test was used otherwise.
Figure 3—figure supplement 4
Loss of one Mcu allele slightly reduces the NADHCYT transient.
(a) Comparison of the ΔRCaMP lifetime transient among genotypes (sample size for Mcufl/fl mice: Nneurons = 86, Nslices = 9 and Nmice = 4; sample sizes for Mcufl/Δ and Mcufl/ΔDock10Cre mice as in Figure 3d). Only the transients in response to a 200-pulses stimulation were analyzed. (b) Comparison among neurons of different genotypes for parameters derived from the Peredox signal. For the lifetime at baseline, the sample sizes are the same as in the previous section. For the time to peak and the decay to 50% of the peak, only neurons with a ΔPeredox lifetime in response to stimulation of ≥0.05 ns were considered (sample sizes for Mcufl/fl: Nneurons = 79; Mcufl/Δ: Nneurons = 151; Mcufl/ΔDock10Cre: Nneurons = 125). (c) Representative traces of Peredox and RCaMP1h lifetimes simultaneously recorded in a DGC from an adult mouse of Mcufl/fl genotype. In this recording, the LDH inhibitor GSK-2837808A (LDHi) was applied for ~30 min, and the NADHCYT transients were elicited using antidromic stimulation. (d) The lack of MCU causes a gradual decrease in the change of Peredox lifetime relative to the RCaMP spike, indicating smaller NADHCYT transients in response to stimulation (sample size for Mcufl/fl mice: Nneurons = 86, Nslices = 9 and Nmice = 4; sample sizes for Mcufl/Δ and Mcufl/ΔDock10Cre mice as in Figure 3d). Differences between groups could not be rescued by LDH inhibition. The datasets for LDH inhibition correspond to a subset of slices (sample size for Mcufl/fl mice+LDHi: Nneurons = 30, Nslices = 4 and Nmice = 2; sample sizes for Mcufl/Δ and Mcufl/ΔDock10Cre mice as in Figure 3e). The data were compared using a Kruskal-Wallis test with a Dunn post-test.
Figure 3—figure supplement 5
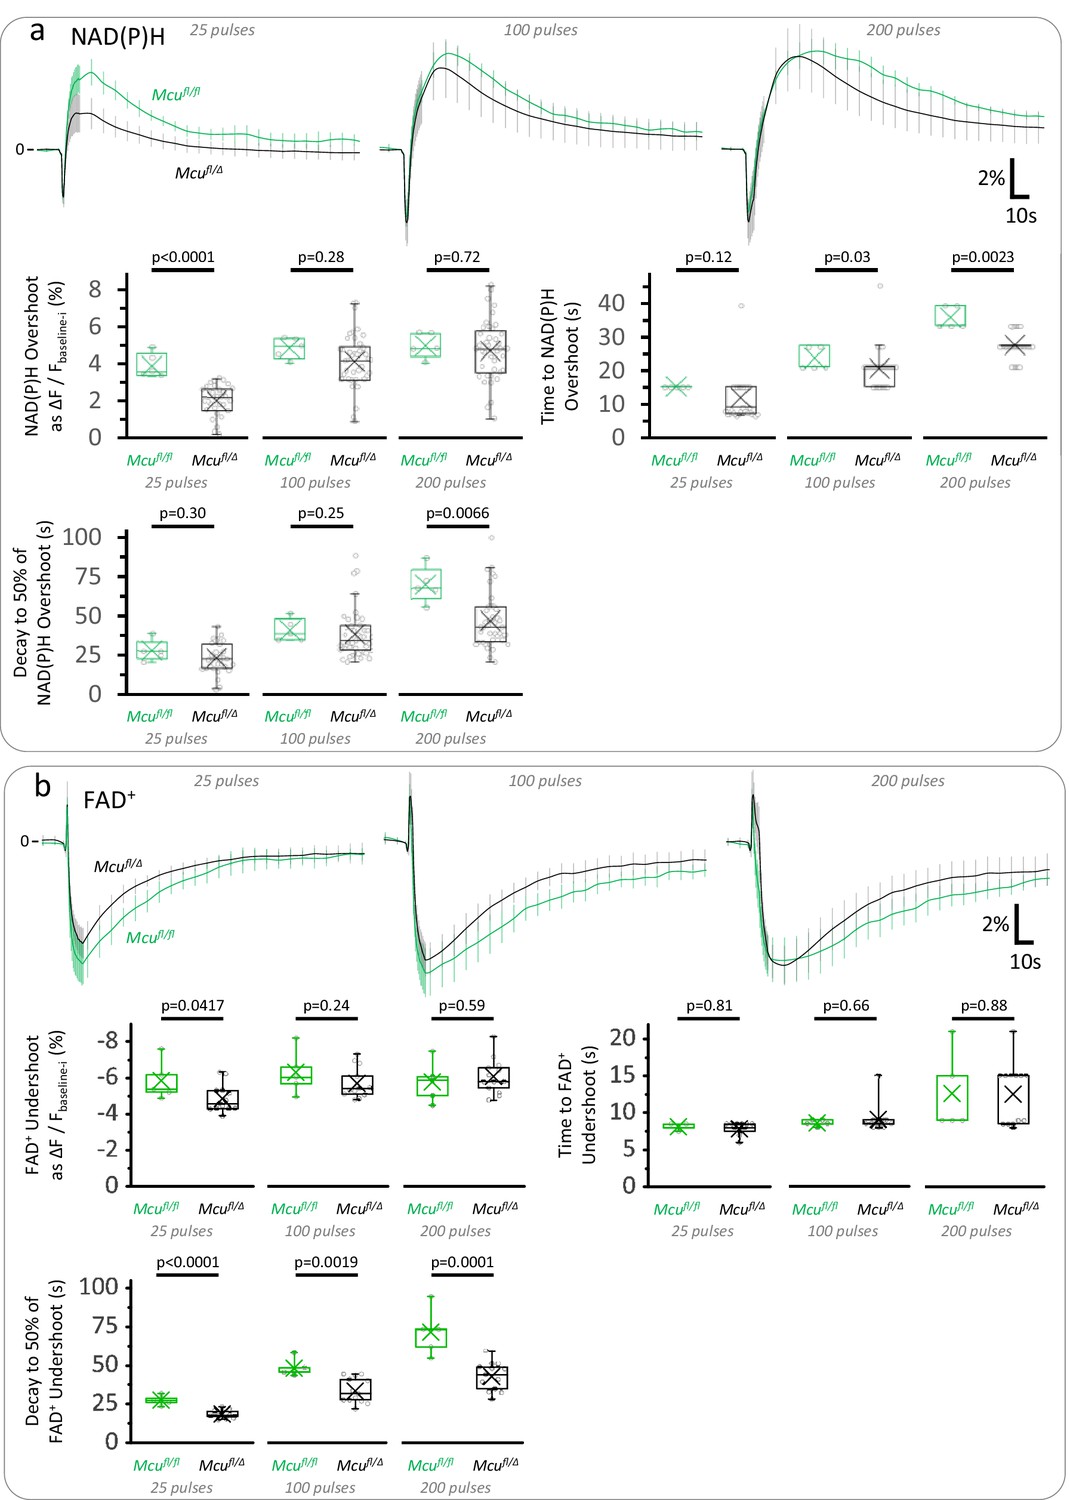
Hemizygous mice for MCU show mild impairments in the TCA cycle with respect to Mcufl/fl controls.
(a) Average traces of the NAD(P)H signal expressed as the ΔF/Fbaseline-i ratio (mean ± SD of number of slices, sample sizes for Mcufl/Δ mice as in Figure 3b, Right panel; sample size for Mcufl/fl: Nslices = 5, Nmice = 3). Depending on the stimulation paradigm, the magnitude and/or duration of the late overshoot were diminished in Mcufl/Δ mice when compared to Mcufl/fl controls. (b) Average traces of the FAD+ signal expressed as the ΔF/Fbaseline-i ratio (mean ± SD of number of slices, sample sizes for Mcufl/Δ mice as in Figure 3—figure supplement 3). The late FAD+ undershoot was less affected by the deletion of one Mcu allele, although its duration was still shortened in Mcufl/Δ mice when compared to Mcufl/fl controls. A Student’s t test or a Welch’s t-test were used for comparisons between normally distributed data, or a non-parametric Mann-Whitney test was used otherwise.
Figure 4 with 3 supplements
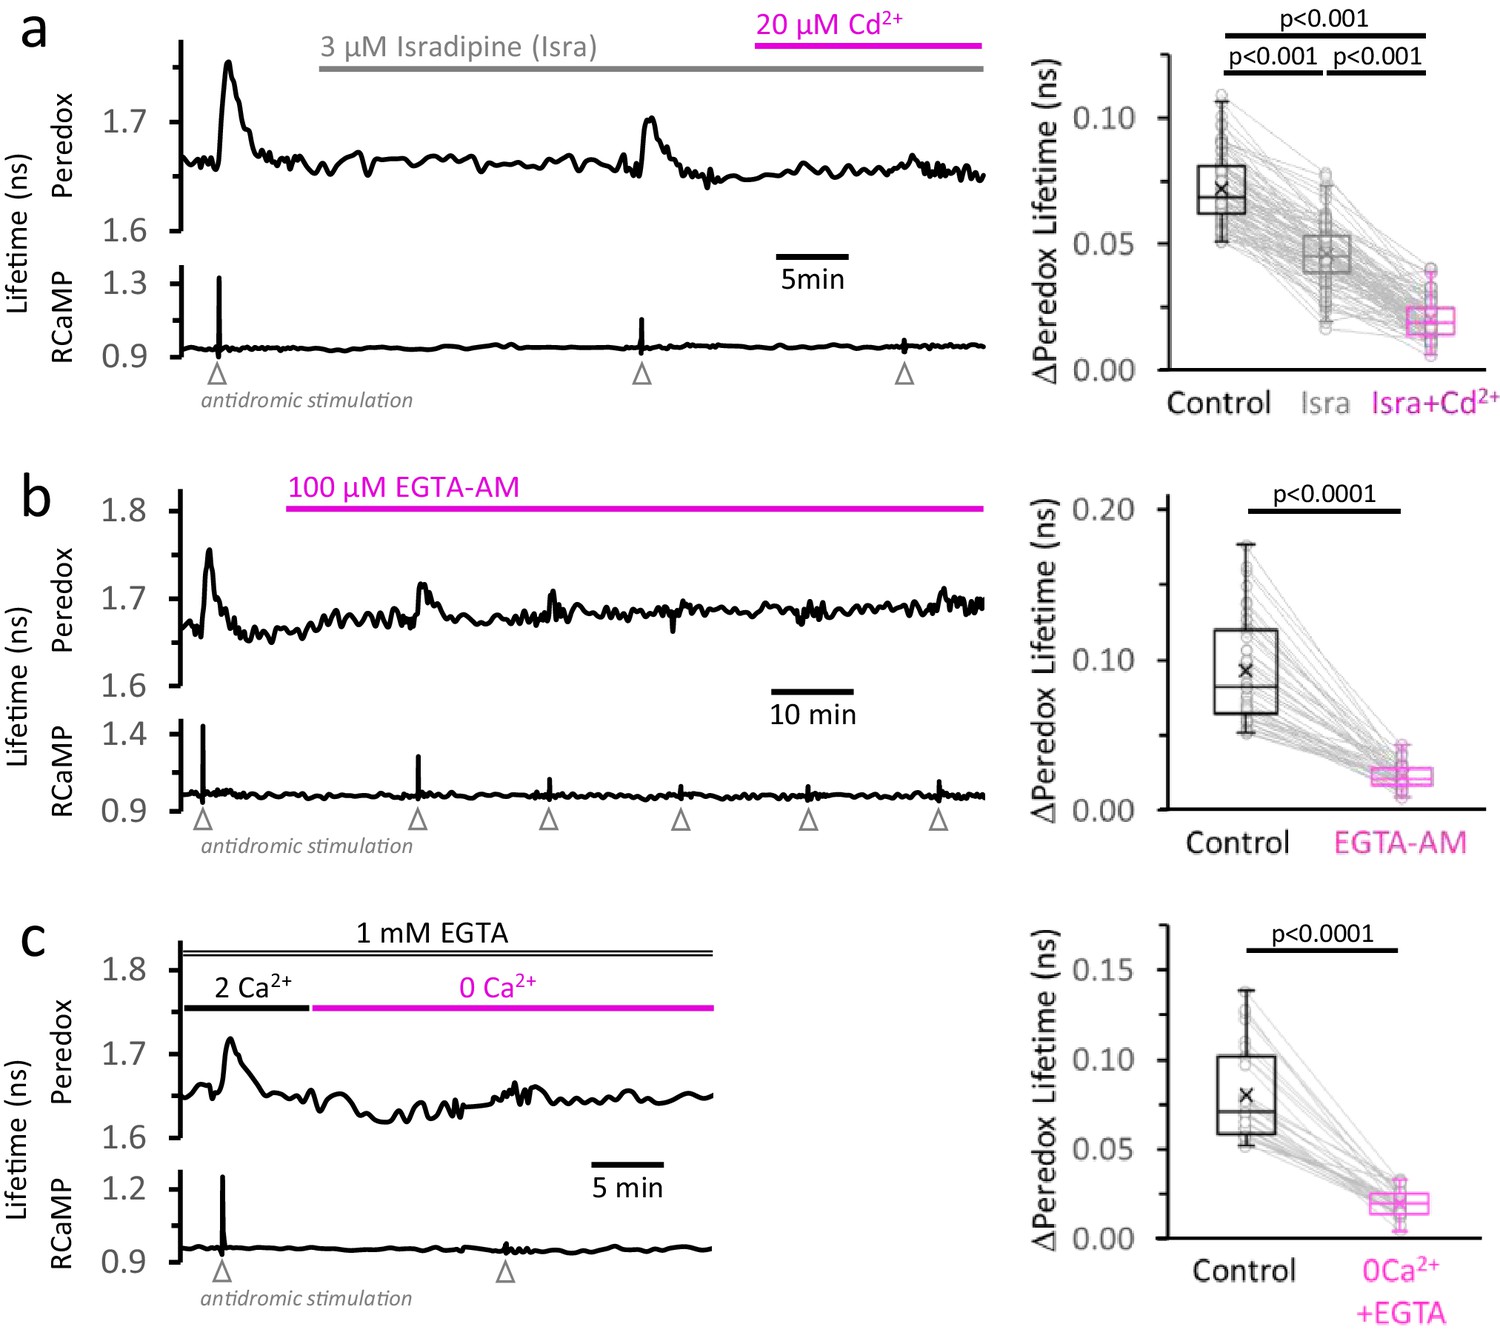
The rise in [Ca2+]CYT, mainly caused by the activity of high-voltage-activated Ca2+ channels, makes a major contribution to the NADHCYT transients in response to stimulation.
(a) Left: Representative trace from a DGC expressing Peredox and RCaMP1h. The slice was superfused for ~20 min with the L-type Ca2+ channel inhibitor isradipine (Isra, 3 µM), and then stimulated. In the continuous presence of isradipine, 20 µM of CdCl2 (Cd2+, a non-selective blocker of voltage-activated Ca2+ channels) was added to the ACSF. Inhibition of Ca2+ influx was evident from the progressive reduction of the stimulus associated RCaMP1h spike. Right: The amplitude of the metabolic responses to stimulation (Peredox lifetime change) mirrored the decrease in the RCaMP spikes (Figure 4—figure supplement 1a). The data were compared using a non-parametric repeated measures ANOVA (Friedman test) with a Dunn post-test (Nneurons = 86, Nslices = 11 and Nmice = 6). For all panels, only neurons showing an initial ΔPeredox lifetime response ≥0.05 ns were included for analysis. (b) Left: Representative trace of a DGC superfused with EGTA-AM (100 µM), a cell-permeable Ca2+ chelator. As expected, the stimulus-induced RCaMP transients gradually diminished over time, typically stabilizing after ~1 hr of treatment. Right: NADHCYT transients are strongly attenuated after effective Ca2+ buffering by EGTA-AM (Figure 4—figure supplement 1b). The data were compared using a Wilcoxon matched pairs test (Nneurons = 45, Nslices = 5 and Nmice = 5). (c) Left: Representative trace for the effect of Ca2+ removal from the bath solution on the metabolic transients in the cytosol. The cell-impermeant Ca2+ chelator EGTA (1 mM) was added to the ACSF to reinforce Ca2+ removal after switching to a nominal 0Ca2+ solution. A modified control ACSF also contained 1 mM EGTA and an adjusted total [Ca2+] resulting in a free concentration of 2 mM, as in any other control experiment. Effective Ca2+ removal was confirmed by the absence of a RCaMP1h spike upon stimulation. Right: The NADHCYT transients were diminished in a Ca2+-deprived ACSF. The data were compared using a Wilcoxon matched pairs test (Nneurons = 31, Nslices = 7 and Nmice = 6).
Figure 4—figure supplement 1
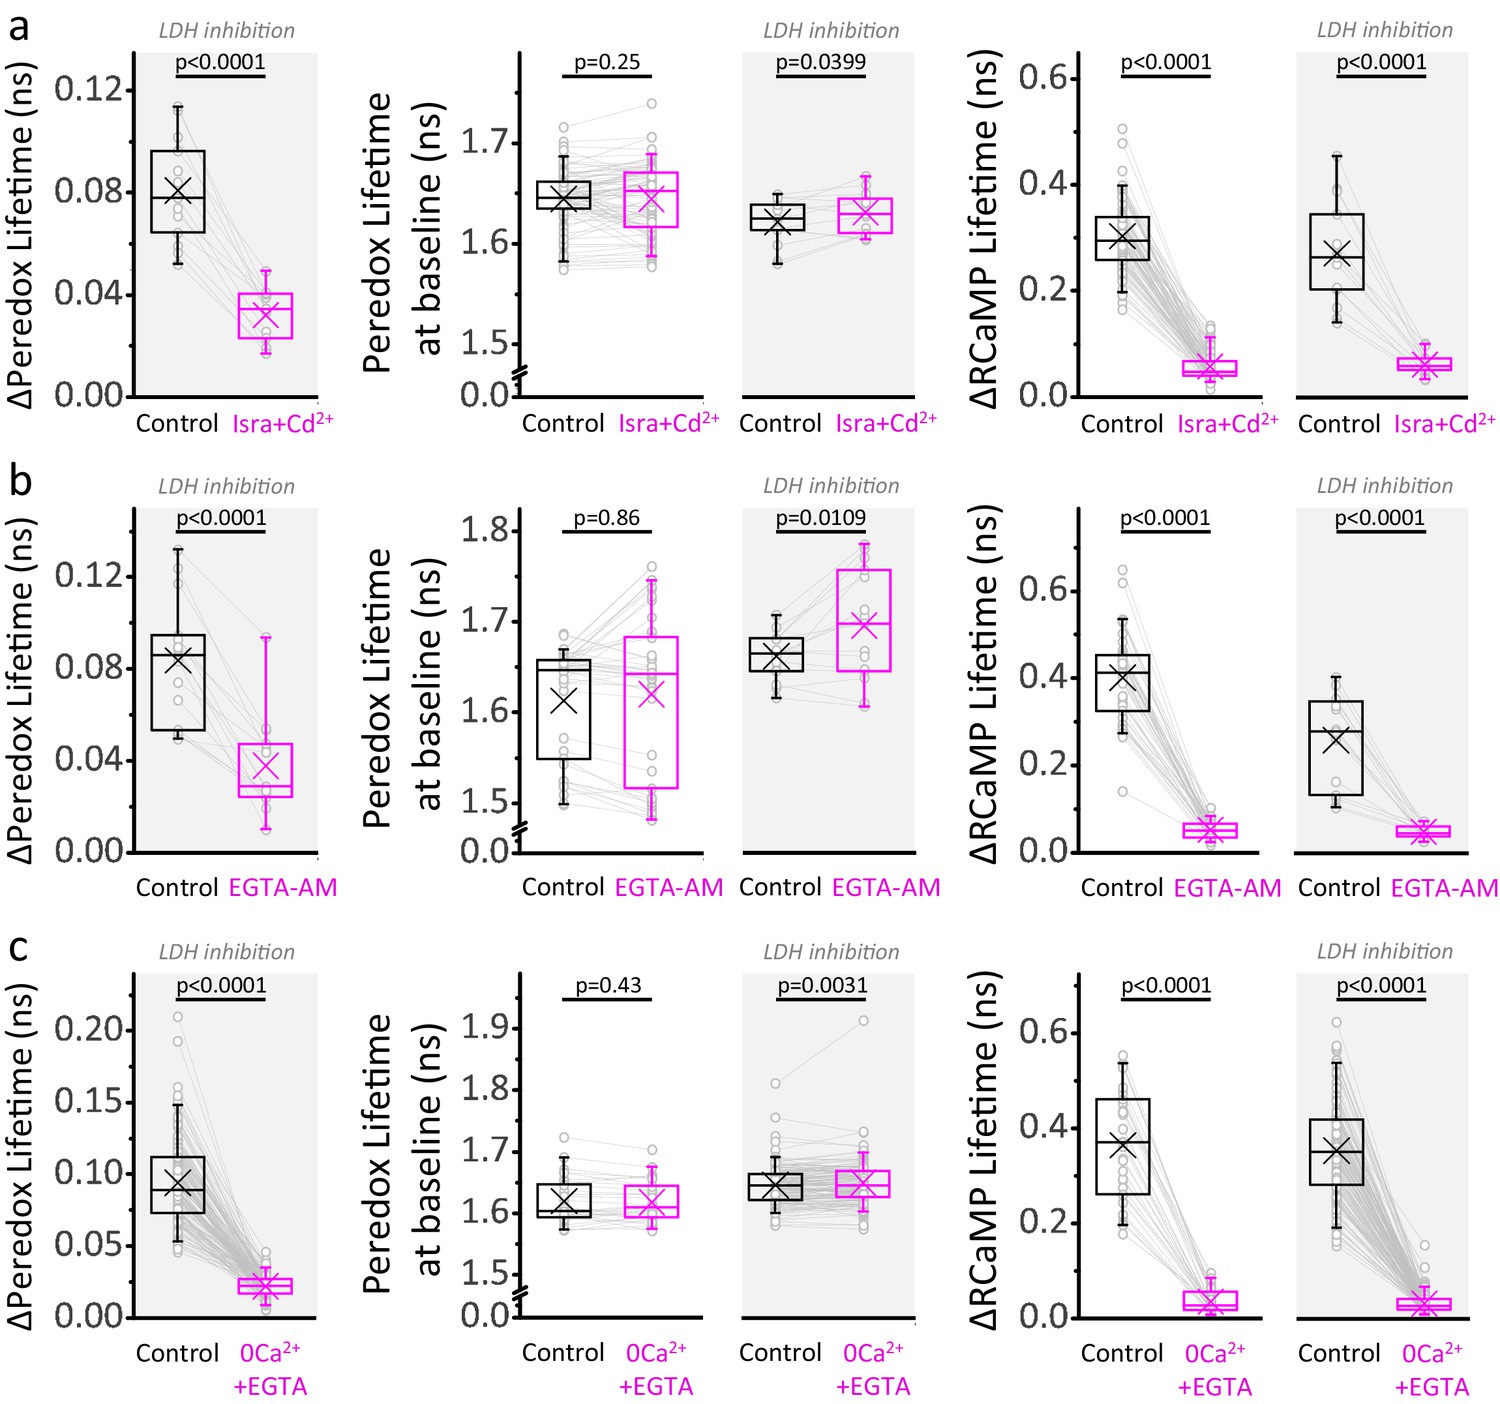
A major Ca2+-dependent component of the NADHCYT also occurs under LDH inhibition.
(a) Comparison of the ΔPeredox/ΔRCaMP values obtained in the continuous presence of the LDH inhibitor GSK-2837808A, before and after the blockade of voltage gated Ca2+ channels with a combination of isradipine and cadmium (Isra+Cd2+; Nneurons = 13, Nslices = 3 and Nmice = 3). The slices were exposed to GSK-2837808A for at least 30 min prior to the experiment. LDH inhibition should improve the ability to detect the cytosol-only component of Ca2+ actions on the NADHCYT transients by increasing the control responses to stimulation, as well as by preventing the potential impact of pyruvate accumulation on these transients due to lower Ca2+ influx into the mitochondria. The effects of the manipulation on the Peredox baseline and the RCaMP spike are also included for the experiments with or without the LDH inhibitor (the sample size is reported in Figure 4 for the latter). (b–c) Comparisons for the application of the cell-permeable Ca2+ chelator EGTA-AM (Nneurons = 15, Nslices = 3 and Nmice = 3 for experiments with LDHi, sample sizes for the other group as in Figure 4), or the removal of Ca2+ from the ACSF (Nneurons = 136, Nslices = 22 and Nmice = 13 for experiments with LDHi, sample sizes for the other group as in Figure 4). For all panels, only neurons showing an initial ΔPeredox lifetime response ≥0.05 ns were included for analysis. A paired Student’s t test was used for comparisons between normally distributed data, or a non-parametric paired Wilcoxon test was used otherwise. LDH inhibition partially rescued the Peredox responses in Isra+Cd2+ and EGTA-AM, but not in 0Ca2++EGTA, even though some pyruvate accumulation is also expected in the last condition due to less Ca2+-dependent pyruvate utilization in the mitochondria during stimulation. We do not have a definitive answer for this difference. It is possible that the Ca2+ channel blockade or Ca2+ chelation may not be complete, especially in dendrites, triggering a component of the metabolic responses that propagates to the soma, and is better revealed during LDH inhibition.
Figure 4—figure supplement 2
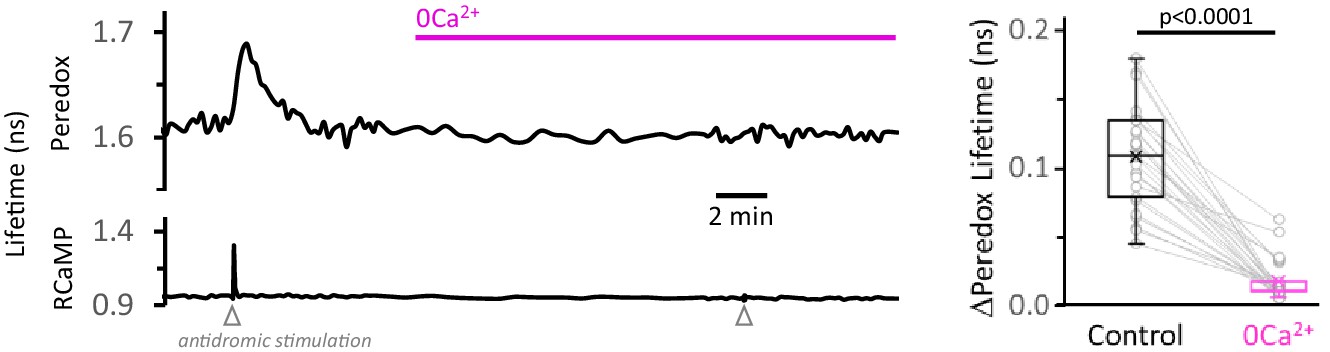
Calcium removal from the ACSF, without addition of EGTA, is also effective in decreasing the NADHCYT transients.
Left: Representative trace for the effect of Ca2+ removal from the ACSF on the NADHCYT transients. As in Figure 3—figure supplement 5, no EGTA was added to the solution. Right: Simple substitution of Ca2+ by Mg2+ in the ACSF was effective in decreasing the NADHCYT transients. The data were compared using a Wilcoxon matched pairs test (Nneurons = 27, Nslices = 5 and Nmice = 3).
Figure 4—figure supplement 3
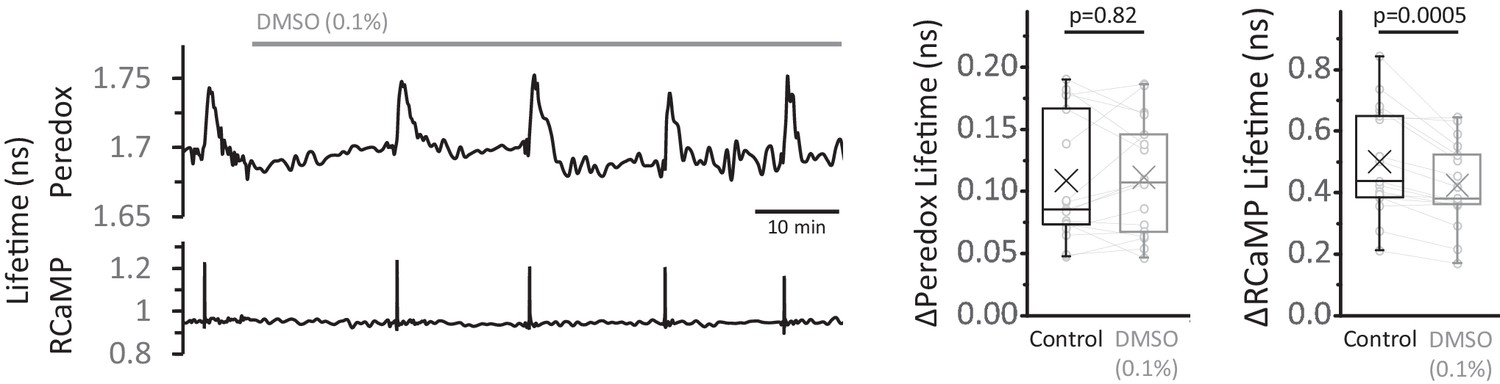
DMSO control for the EGTA-AM experiments.
Left: Representative trace of the effect of DMSO (0.1%) on the Peredox and RCaMP signals. Right: The change in Peredox lifetime elicited by stimulation was unaffected by the application of 0.1% DMSO for 30–60 min, contrary to the gradual decrease observed with EGTA-AM. The RCaMP spike decreased over time but it was not as attenuated as in EGTA-AM. The Peredox and RCaMP transients were compared using a Wilcoxon matched pairs test and a paired t-test, respectively (Nneurons = 17, Nslices = 4 and Nmice = 3). Only neurons showing an initial ΔPeredox lifetime response ~0.05 ns or higher were included for analysis.
Figure 5 with 1 supplement
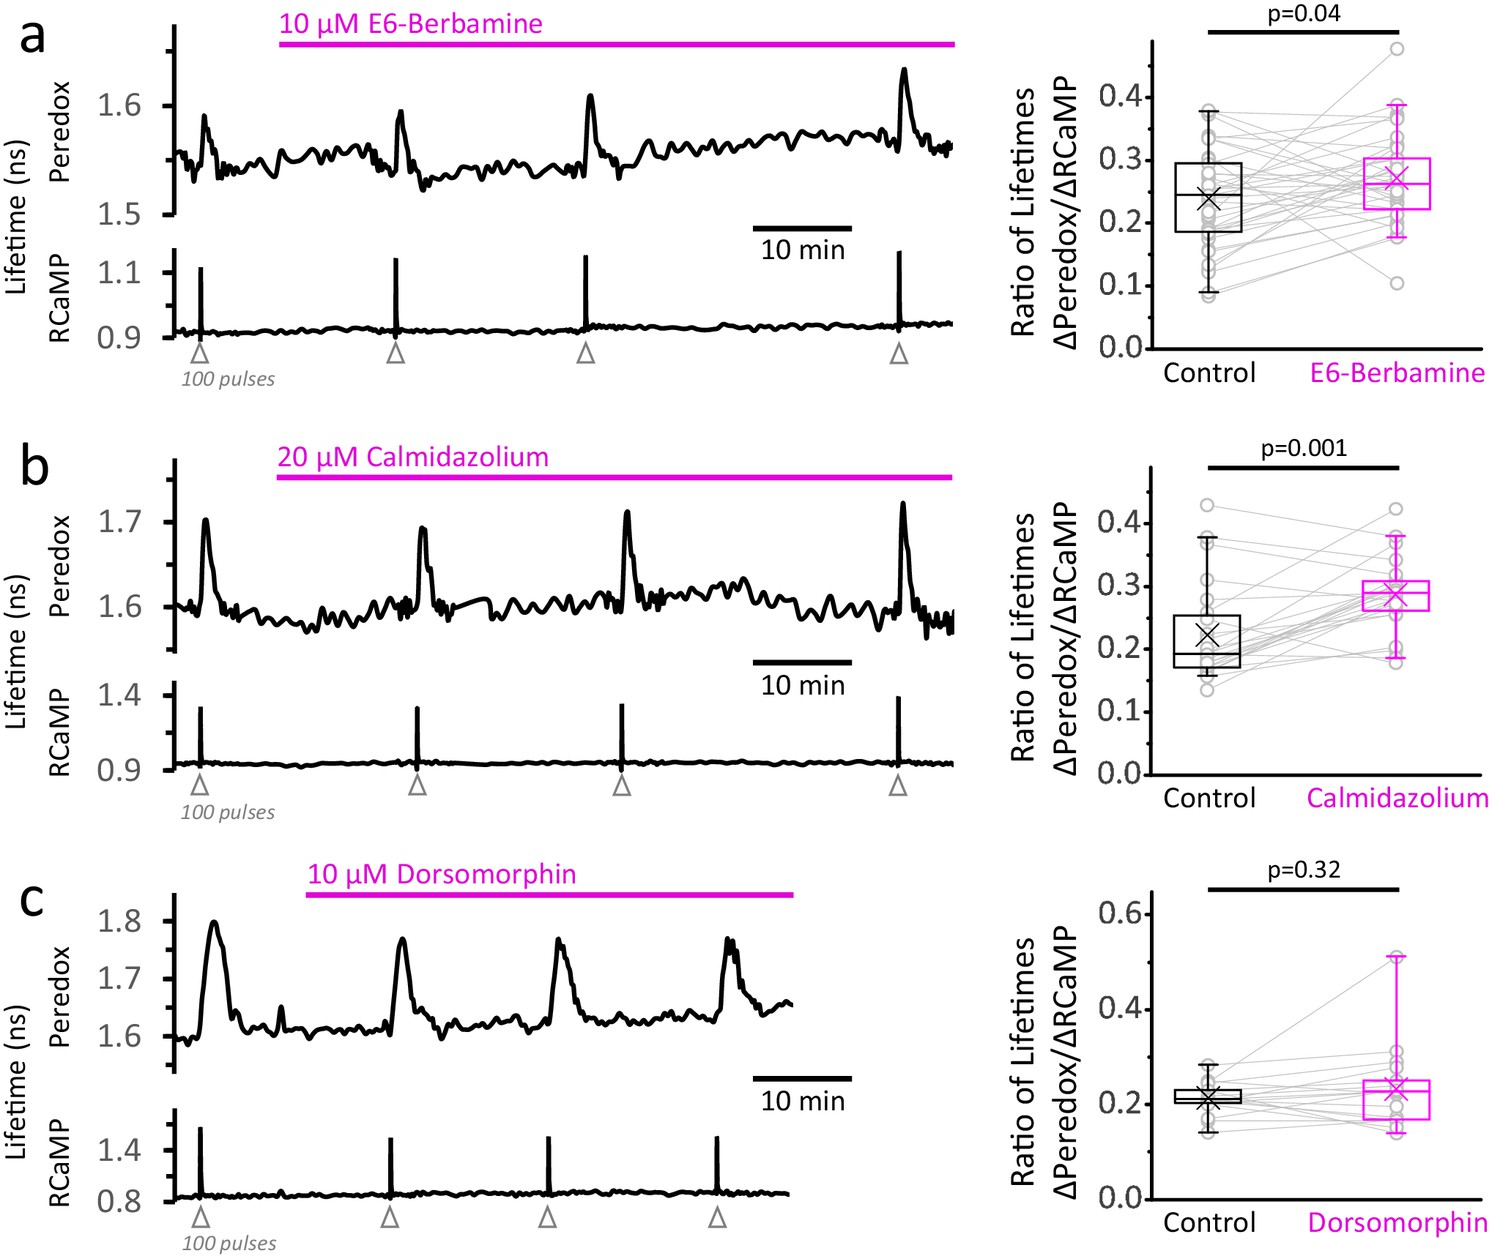
Inhibition of the Ca2+-calmodulin complex or of AMPK does not abolish the NADHCYT transients in response to stimulation.
(a) Left: Representative trace of a DGC treated with E6-berbamine (10 µM), an inhibitor of the Ca2+-calmodulin signaling pathway. Right: The magnitude of the metabolic response was expressed as the change in Peredox lifetime change divided by the change in RCaMP1h lifetime in response to stimulation (ΔPeredox/ΔRCaMP). E6-berbamine marginally elevated the NADHCYT transients. The data were compared using a paired t-test (Nneurons = 37, Nslices = 4 and Nmice = 4). For all panels, the effect of the drugs on the metabolic transients were monitored for at least 30 min. (b) Left: Representative trace of a DGC treated with calmidazolium (20 µM), another inhibitor of the Ca2+-calmodulin signaling pathway. Right: The effect of calmidazolium on the ΔPeredox/ΔRCaMP ratio was similar to the previous Ca2+-calmodulin complex inhibitor. The data were compared using a Wilcoxon matched pairs test (Nneurons = 24, Nslices = 3 and Nmice = 3). (c) Left: Representative trace of a DGC before and after the inhibition of the AMPK pathway using dorsomorphin (10 µM). Since the drug decreases the Ca2+ transients (Figure 5—figure supplement 1c), the intensity of the stimulus was adjusted to elicit strong responses, and the number of depolarizing pulses was sometimes increased to 150 (before and after treatment) to ensure effective stimulation of the soma throughout the experiment. Right: In the presence of dorsomorphin, the ΔPeredox/ΔRCaMP ratio remained unaltered. The data were compared using a paired t-test (Nneurons = 17, Nslices = 4 and Nmice = 3).
Figure 5—figure supplement 1
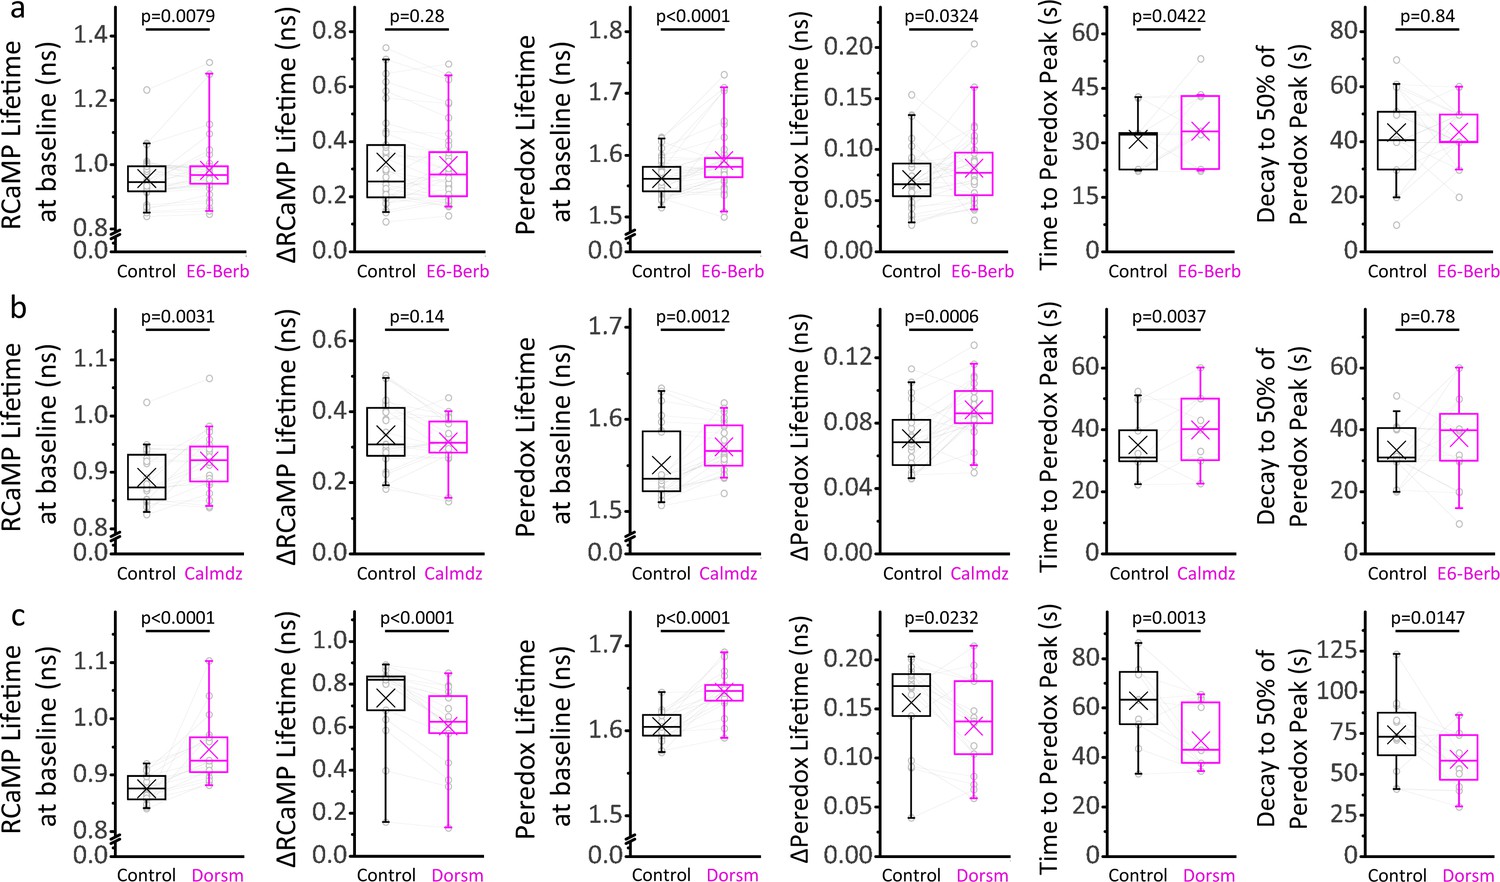
Ca2+/CaM and AMPK signaling modulates the cytosolic [Ca2+] and NADH/NAD+ ratio at baseline, and the time course of the NADHCYT transient in response to stimulation.
(a) Inhibition of the Ca2+/CaM axis with 10 µM E6-berbamine (E6-Berb) increases the RCaMP lifetime at baseline while keeping the stimulus-associated RCaMP spike intact. The Peredox lifetime at baseline, the amplitude, and the time to peak of the NADHCYT transient are also increased with this treatment. The sample size corresponds to Figure 5a, except for the time course parameters (time to peak and decay), where only DGCs with ΔPeredox ≥ 0.05 ns were analyzed (Nneurons = 27). (b) Inhibition of the Ca2+/CaM axis with 20 µM calmidazolium (Calmdz) caused similar effects to E6-berbamine. Sample size as in Figure 5b; with Nneurons = 20 for the time course analysis, corresponding to neurons with ΔPeredox ≥ 0.05 ns. (c) Inhibition of AMPK with 10 µM dorsomorphin (Dorsm) increased the RCaMP and Peredox baselines but decreased the RCaMP transients in response to stimulation. Sometimes the slices were stimulated with 150 pulses instead of 100 (before and after treatment) to ensure effective stimulation of the somata throughout the experiment. Sample size as in Figure 5c; with Nneurons = 16 for the time course analysis, corresponding to neurons with ΔPeredox ≥0.05 ns. A paired Student’s t test was used for comparisons between normally distributed data, or a non-parametric paired Wilcoxon test was used otherwise.
Figure 6 with 3 supplements
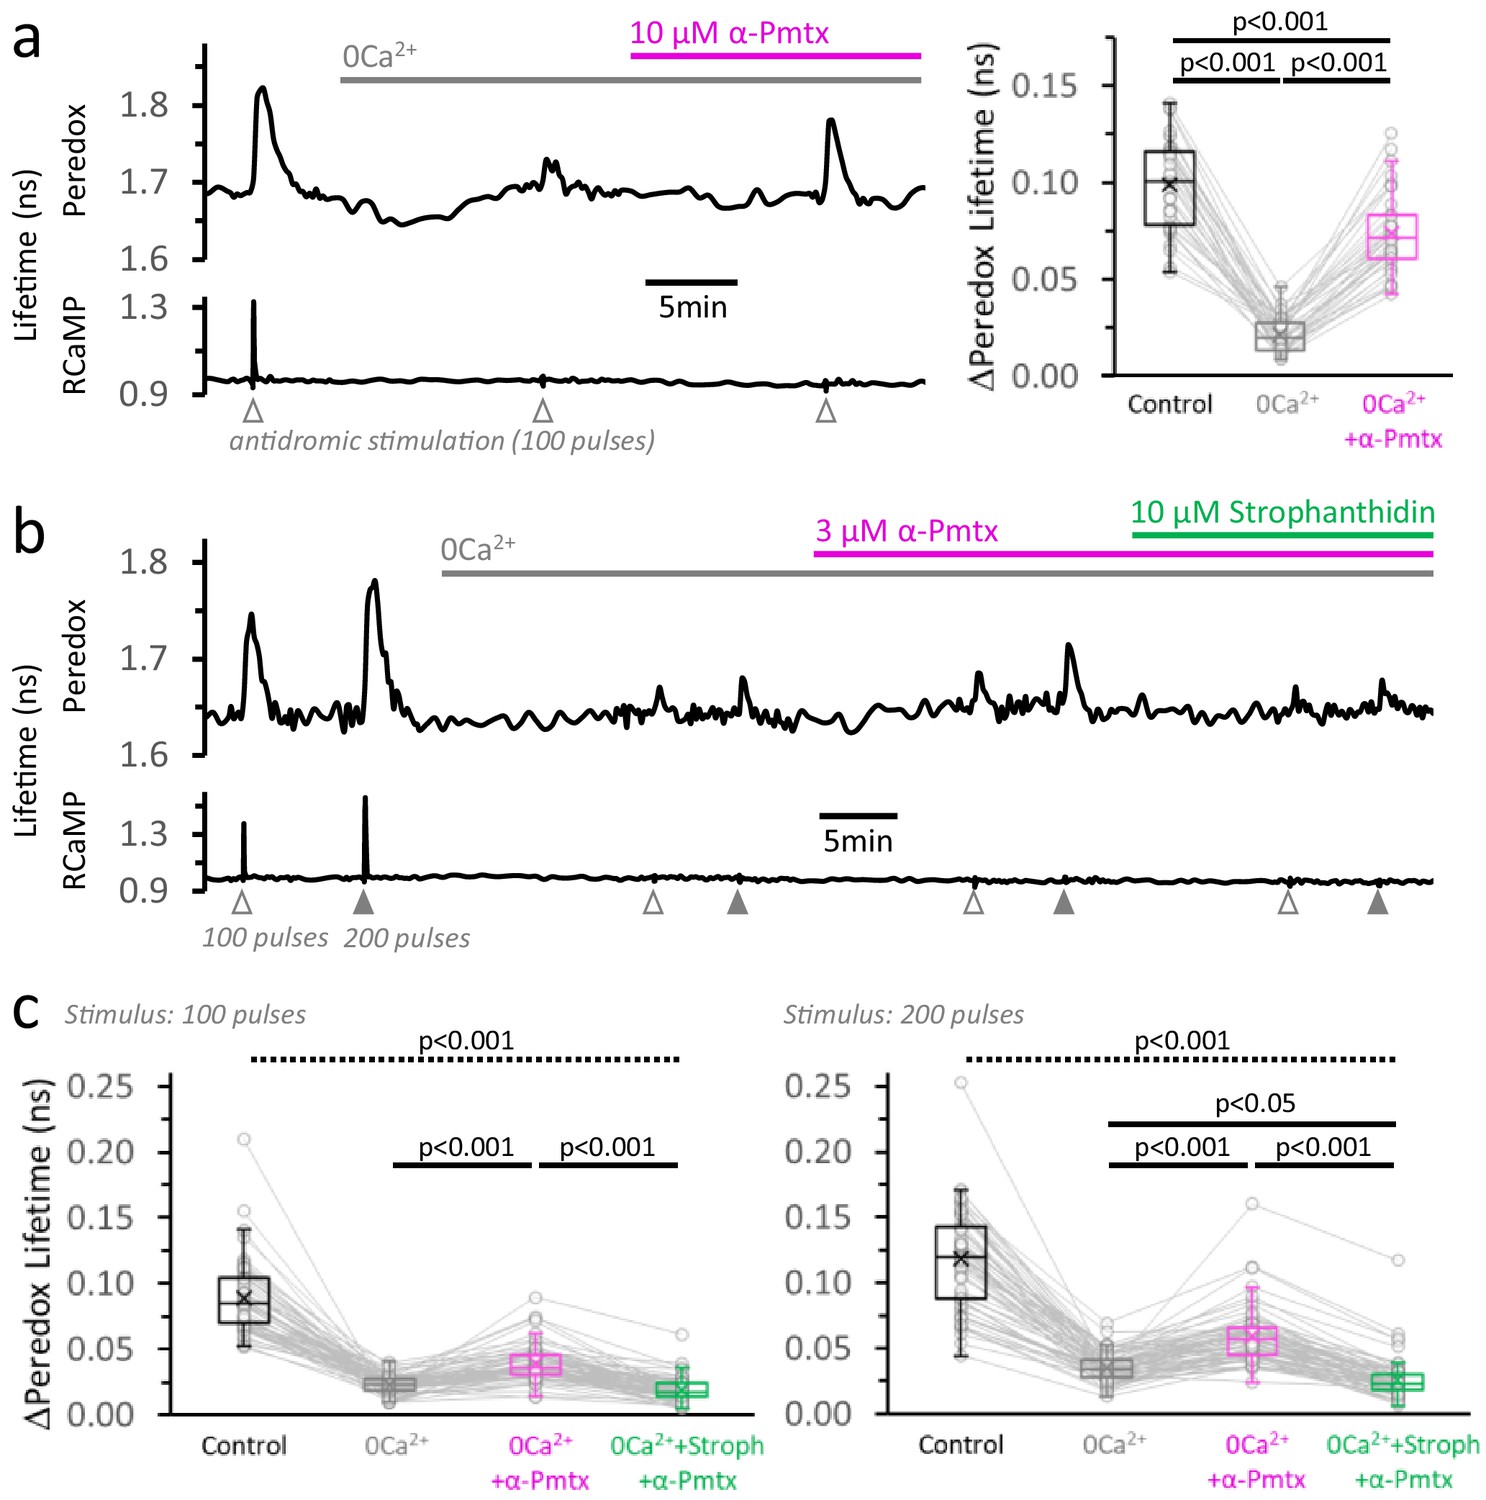
Neuronal stimulation triggers glycolysis in response to energy demand from ion pumping.
(a) Left: Representative trace of Peredox and RCaMP1h lifetimes simultaneously recorded in a DGC from an acute hippocampal slice. The slice was superfused with 2 µM GSK-2837808A for at least 30 min before the experiment, and the LDH inhibitor was kept in the ACSF during the experiment. The ACSF also contained 1 mM EGTA to reinforce Ca2+ removal in the nominal 0Ca2+ condition (but [Ca2+] in the control ACSF was accordingly adjusted to a free concentration of 2 mM, as in any other experiment). Effective Ca2+ removal was confirmed by the absence of a RCaMP1h spike upon stimulation. The Peredox lifetime at baseline, and the metabolic transients in response to neuronal stimulation, were recorded after substituting the bath solution with a 0Ca2+ ACSF (to obtain Na+-only NADHCYT responses), and the further application of 10 µM α-pompilidotoxin (α-Pmtx, a toxin that prevents voltage-gated Na+ channel inactivation). Right: The Na+-only NADHCYT transient was increased in the presence of α-pompilidotoxin. The Peredox lifetime change in response to stimulation was diminished in the absence of Ca2+ but bounced back to higher amplitudes by increasing Na+ influx. The data were compared using a repeated measures ANOVA with a Student-Newman-Keuls post-test (Nneurons = 35, Nslices = 5 and Nmice = 3). For all panels, only neurons showing an initial ΔPeredox lifetime response ≥0.05 ns were included for analysis. (b) Representative trace of Peredox and RCaMP1h lifetimes in a DGC stimulated with trains of 100 and 200 electrical pulses. The two-stimulation protocol was also performed in 0Ca2+ ACSF before and after the application of 3 µM α-pompilidotoxin. The latter condition was followed by the application of the Na+/K+ ATPase inhibitor strophanthidin. As in (a), the slices were exposed to the LDH inhibitor GSK-2837808A from 30 min prior, until the end of the experiment. Likewise, all the solutions contained 1 mM EGTA. (c) Comparison of the Peredox lifetime changes in response to both stimulation paradigms (100 or 200 pulses) among the conditions in (b). The NADHCYT transients in control condition was different from the other conditions (the discontinuous line for the associated p-value applies to all comparisons). The Na+-only NADHCYT responses recorded in 0Ca2+ ACSF were increased slightly but significantly increased by the application of 3 µM α-pompilidotoxin, an effect that was reversed by strophanthidin. The data were compared using a non-parametric repeated measures ANOVA (Friedman test) with a Dunn post-test (Nneurons = 66, Nslices = 10 and Nmice = 5).
Figure 6—figure supplement 1
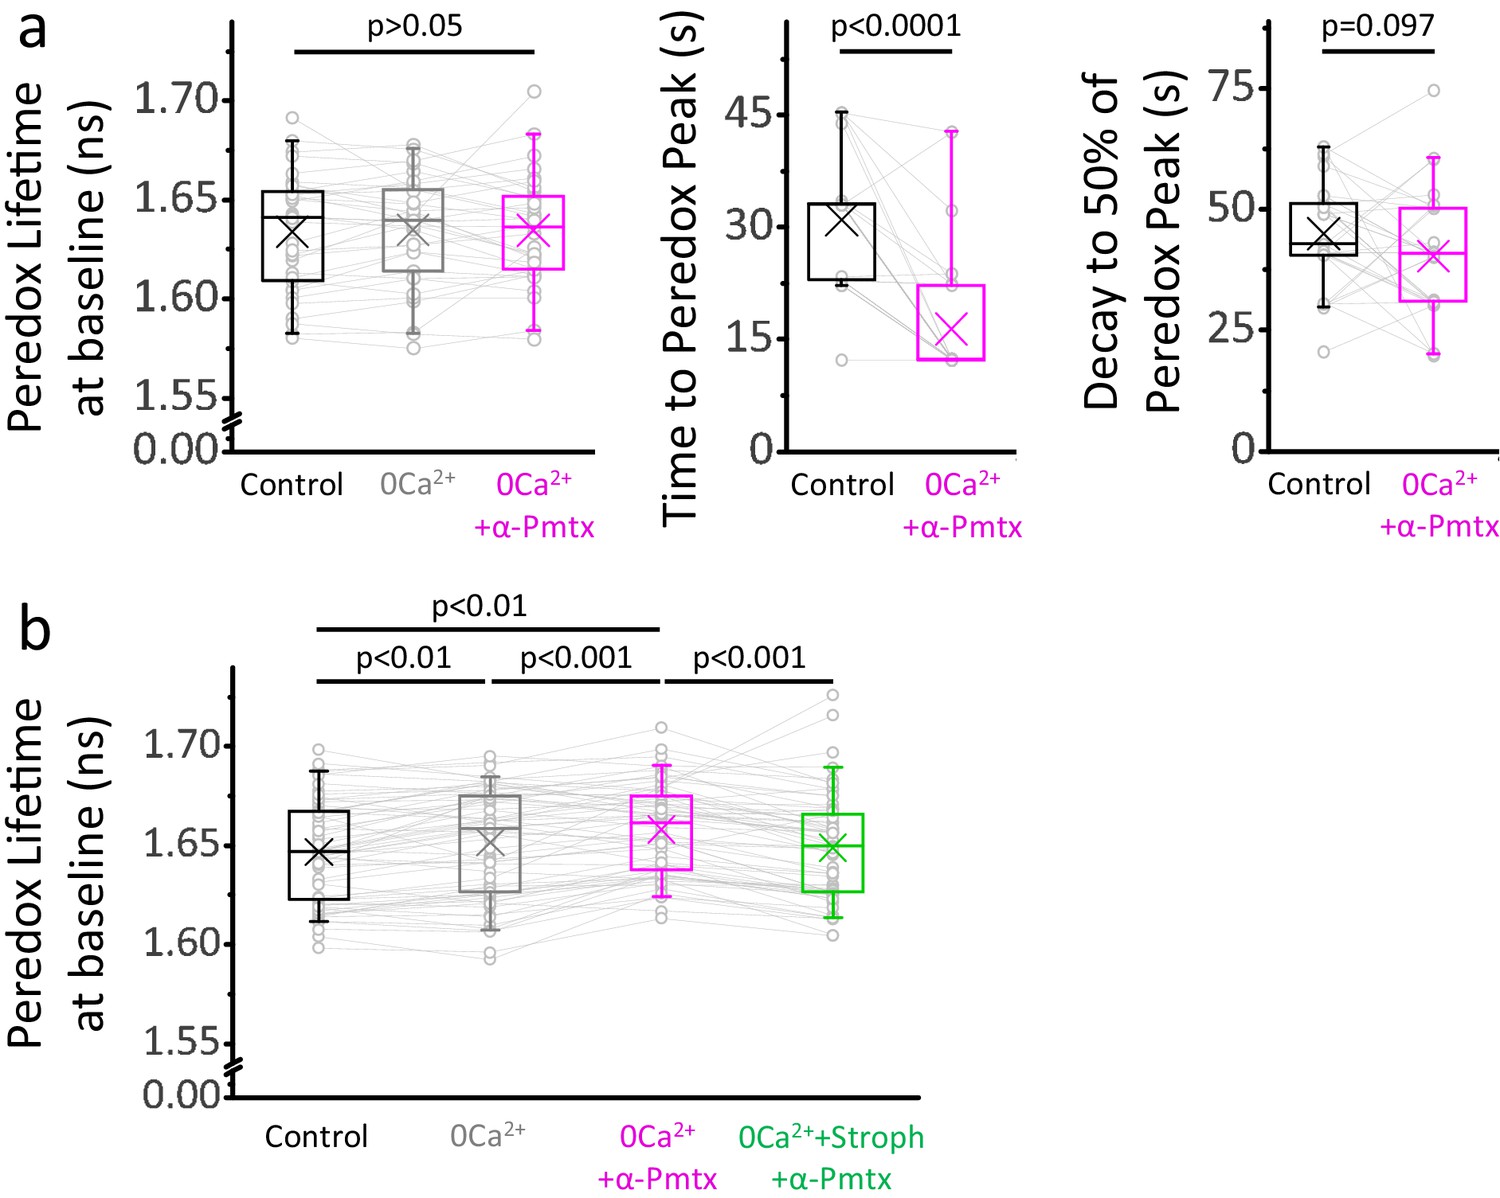
NADHCYT transients in 0Ca2+-ACSF with boosted Na+ influx are briefer than those in control ACSF.
(a) The Peredox baseline remained unaltered during the recordings from Figure 6a, where stimulations were delivered ~10 min after changing solutions. The data were compared using a repeated measures ANOVA (sample sizes as in Figure 6a). The peak Peredox lifetime in 0Ca2+-ACSF, boosted with 10 µM pompilidotoxin, occurred earlier than the peak in the control ACSF. On the other hand, the decay to 50% of the peak was similar between both groups. Comparisons were performed using a Wilcoxon matched pairs test. (b) The prolonged exposure to each condition in Figure 6c (same sample sizes) caused marginal but statistically significant effects on the Peredox baseline. Values were taken before the stimulation with 200 pulses.
Figure 6—figure supplement 2
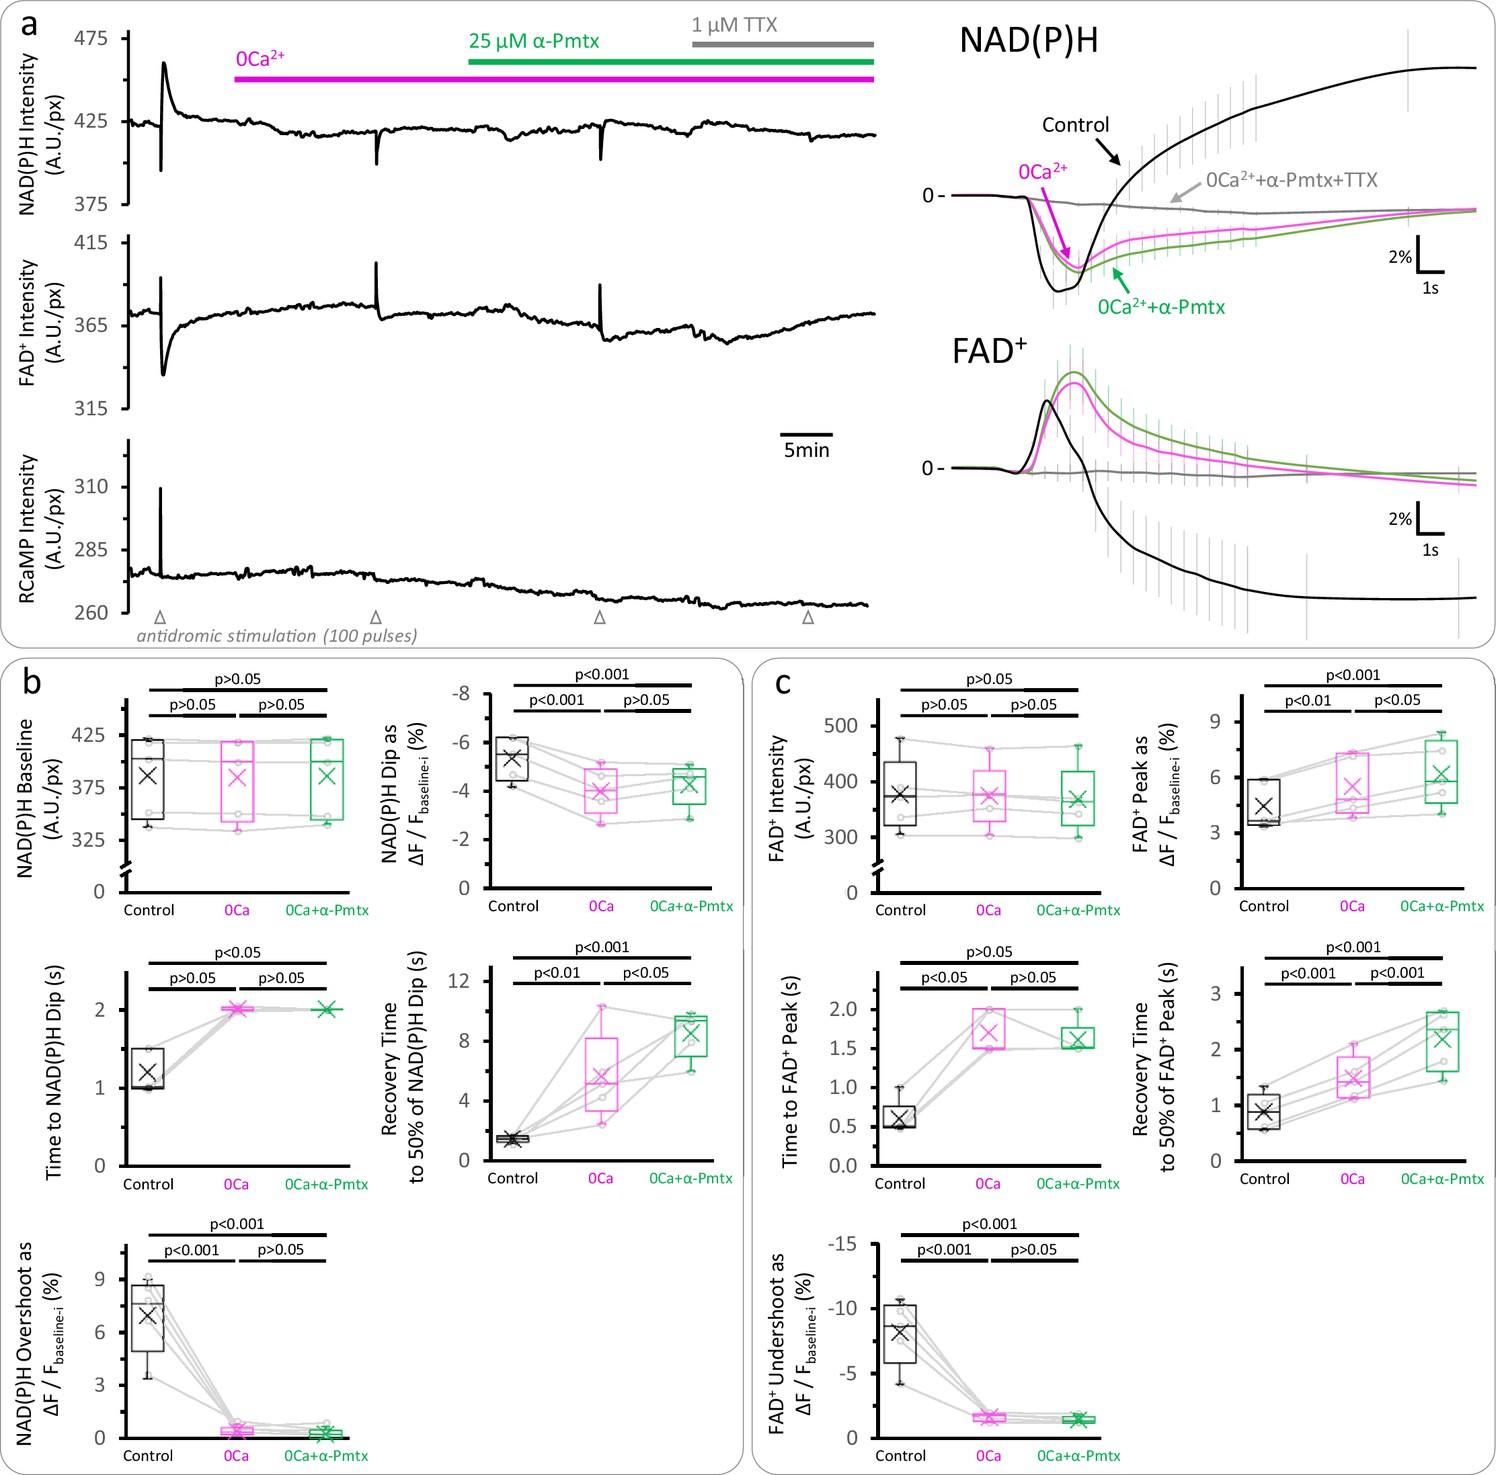
The late overshoot in the NAD(P)H signal disappears in a Ca2+-free solution and is not recovered by α-pompilidotoxin application.
(a) Left: Representative trace of the autofluorescence and RCaMP signals in the DGC layer of an acute hippocampal slice. These experiments were performed with samples from juvenile wild-type mice. When Ca2+ was removed from the ACSF (as in Figure 4—figure supplement 2), the late increase (‘overshoot’) in the NAD(P)H autofluorescence and the late decrease (‘undershoot’) in the FAD+ signal were almost abolished. Reducing voltage-gate Na+ channel inactivation with 25 µM α-pompilidotoxin (α-Pmtx), which increases Na+ influx during action potentials and results in higher energy demand due to ion pumping, did not rescue any of these signals. As expected, the application of 1 µM Tetrodotoxin (TTX), a blocker of voltage-gate Na+ channels that prevents the firing of action potentials, inhibited all the signals elicited upon stimulation. Right: Average traces of the NAD(P)H and FAD+ signals, expressed as the ΔF/Fbaseline-i ratio (mean ± SD of number of slices, Nslices = 5, Nmice = 3). The initial segment of the signals was zoomed in to better visualize the effects of the manipulations on the initial transient phases of both the NAD(P)H and the FAD+ signals. (b–c) Comparisons of the parameters derived from the NAD(P)H and the FAD+ signals, respectively. While Ca2+ removal recapitulated the effects on the NAD(P)H signal, the decrease in the FAD+ undershoot was more prominent than the observed in DGCs lacking MCU. The data were compared using a repeated measures ANOVA with a Student-Newman-Keuls post-test when all the groups presented Gaussian distributions, otherwise, a non-parametric Friedman test with a Dunn post-test was performed.
Figure 6—figure supplement 3
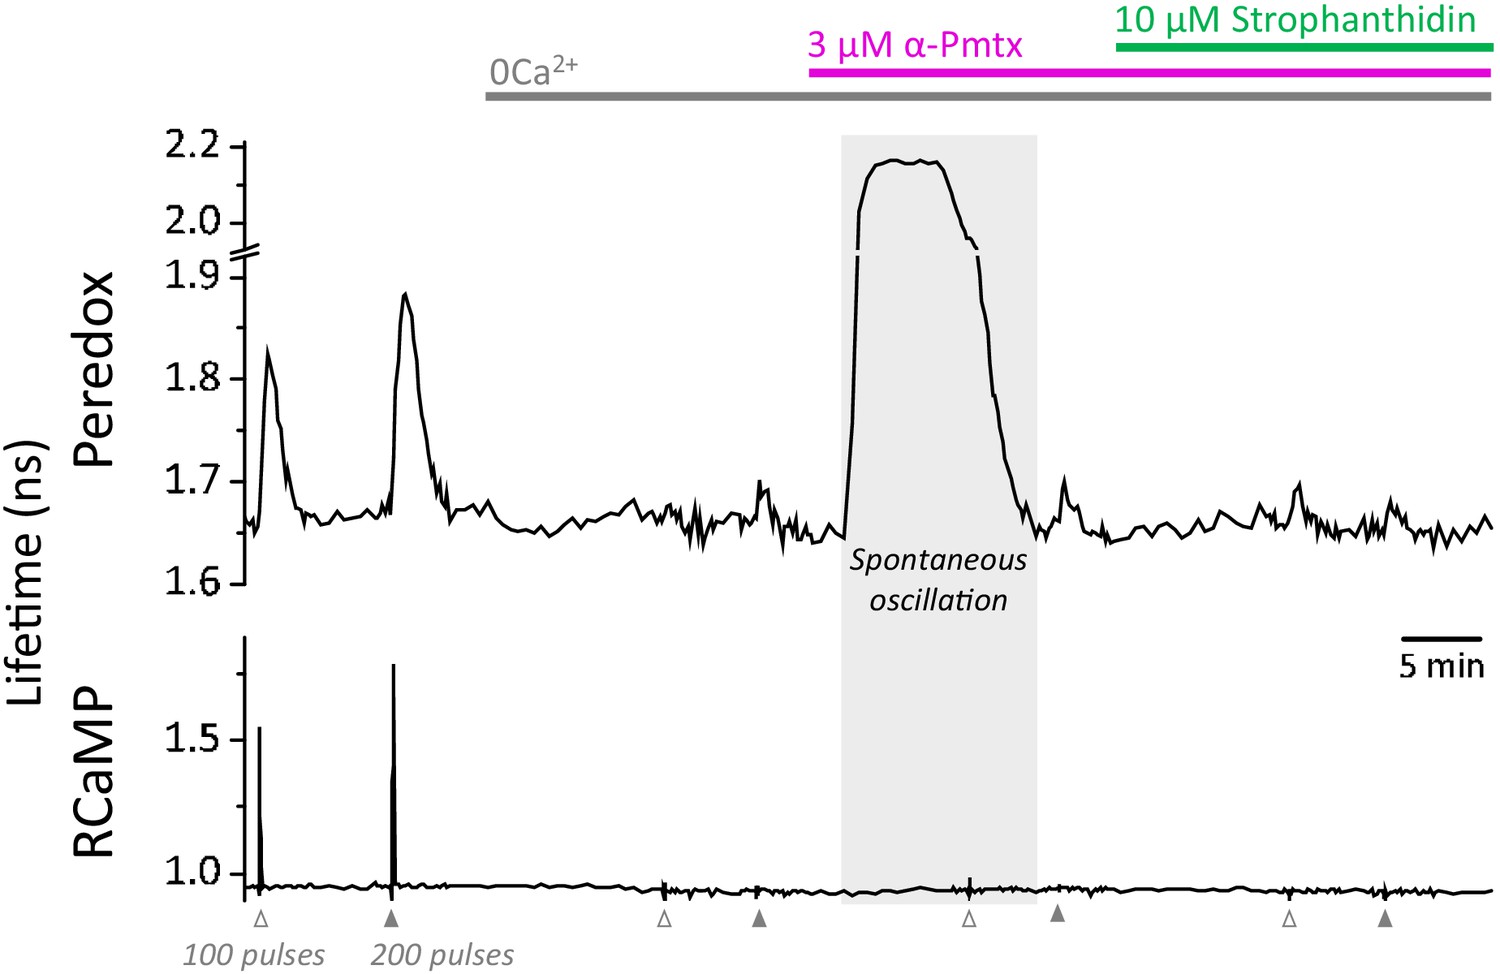
Spontaneous oscillations in the Peredox signal may occur during the prolonged application of zero Ca2+-ACSF, in the presence of EGTA and LDH inhibition.
Prolonged exposure to a nominal Ca2+-free solution, plus LDH inhibition, caused spontaneous elevations of the Peredox lifetime in 25 ± 13% of the cells in each slice (slices = 10, mice = 5), contrasting with only ~3% of cells exposed to a brief exposure as in Figure 4c. The spontaneous elevations in Peredox lifetime occurred at any time after removing Ca2+ from the ACSF. Although these neurons were not included in the analysis, once the spontaneous transients cleared, the experiment resumed as usual. The continuous presence of 1 mM EGTA and 2 µM GSK-2837808 (LDH inhibitor) is not indicated in the figure for simplicity. In the control ACSF, the [Ca2+] was adjusted accordingly to yield a free concentration of 2 mM.
Tables
Key resources table
| Reagent type (species) or resource | Designation | Source or reference | Identifiers | Additional information |
|---|---|---|---|---|
| Chemical compound, drug | NBQX (6-Nitro-7-sulfamoylbenzo[f]quinoxaline-2,3-dione, Disodium Salt) | Toronto Research Chemicals | Cat#N550005; CAS:479347-86-9 | |
| Chemical compound, drug | D-AP5 (D-(-)−2-Amino-5-phosphonopentanoic acid) | Abcam | Cat#ab120003; CAS:79055-68-8 | |
| Chemical compound, drug | Isradipine | Abcam | Cat#ab120142; CAS:75695-93-1 | |
| Chemical compound, drug | α-pompilidotoxin | Alomone Labs | Cat#P-170 | |
| Chemical compound, drug | EGTA-AM | Anaspec Inc | Cat#AS-84100; CAS:99590-86-0 | |
| Chemical compound, drug | Calmidazolium | Cayman Chemical | Cat#14442; CAS:57265-65-3 | |
| Chemical compound, drug | Dorsomorphin dihydrochloride | Tocris Bioscience | Cat#3093; CAS:1219168-18-9 | |
| Chemical compound, drug | E6-berbamine | Santa Cruz | Cat#sc-221573; CAS:73885-53-7 | |
| Chemical compound, drug | UK5099 | Santa Cruz | Cat#sc-361394; CAS:56396-35-1 | |
| Chemical compound, drug | UK5099 | Tocris Bioscience | Cat#5185 | |
| Chemical compound, drug | GSK-2837808A | Tocris Bioscience | Cat#5189; CAS:1445879-21-9 | |
| Chemical compound, drug | MgCl2 (1M solution) | Teknova | Cat#M0304 | |
| Chemical compound, drug | Picrotoxin | Sigma-Aldrich | Cat#P1675; CAS:124-87-8 | |
| Chemical compound, drug | Sodium pyruvate | Sigma-Aldrich | Cat#P8574; CAS:113-24-6 | |
| Chemical compound, drug | CdCl2 | Sigma-Aldrich | Cat#202908; CAS:10108-64-2 | |
| Chemical compound, drug | Strophanthidin | Sigma-Aldrich | Cat#S6626; CAS:66-28-4 | |
| Strain, strain background Mus musculus | C57BL/6NCrl mice | Charles River | RRID:IMSR_CRL:27 | |
| Strain, strain background Mus musculus | Edil3Tg(Sox2-cre)1Amc/J mice (Sox2-Cre) | The Jackson Laboratory | RRID:IMSR_JAX:004783 | |
| Strain, strain background Mus musculus | Mcufl/fl mice | Kwong et al., 2015 | RRID:IMSR_JAX:029817 | |
| Strain, strain background Mus musculus | Dock10Cre mice | Kohara et al., 2014 | Tonegawa lab | |
| Strain, strain background Mus musculus | Mcufl/Δ mice | This paper | Obtained by germline deletion of the floxed allele, followed by backcrossing; Yellen lab | |
| Other | AAV9.Syn.RCaMP1h.WPRE.SV40 | Penn Vector Core | Discontinued | Viral vector |
| Recombinant DNA reagent | AAV.CAG.Peredox.WPRE.SV40 | Mongeon et al., 2016 | RRID:Addgene_73807 | |
| Recombinant DNA reagent | AAV.Syn.RCaMP1h.WPRE.SV40 | Akerboom et al., 2013 | ||
| Recombinant DNA reagent | pZac2.1-CaMKII-mito-GCaMP6s | Li et al., 2014 | ||
| Recombinant DNA reagent | AAV.CAG.Pyronic.WPRE.SV40 | San Martín et al., 2014 | Derived from RRID:Addgene_51308 | |
| Recombinant DNA reagent | AAV.Syn.mito-RCaMP1h.WPRE.SV40 | This paper | Produced by addition of a mitochondrial targeting signal; Yellen lab | |
| Software, algorithm | MATLAB R2014b | Mathworks | RRID:SCR_001622 | |
| Software, algorithm | Origin 9.1 | OriginLab | RRID:SCR_002815 | |
| Software, algorithm | GraphPad Instat version 3.06 | GraphPad Software | RRID:SCR_000306 | |
| Software, algorithm | Microsoft Excel version 2009 | Microsoft | RRID:SCR_016137 |
Additional files
Download links
A two-part list of links to download the article, or parts of the article, in various formats.
Downloads (link to download the article as PDF)
Open citations (links to open the citations from this article in various online reference manager services)
Cite this article (links to download the citations from this article in formats compatible with various reference manager tools)
The distinct roles of calcium in rapid control of neuronal glycolysis and the tricarboxylic acid cycle
eLife 10:e64821.
https://doi.org/10.7554/eLife.64821


