The antidepressant sertraline provides a novel host directed therapy module for augmenting TB therapy
- CSIR- Institute of genomics and Integrative Biology, India
- Academy of Scientific and Innovative Research, India
Figures
Figure 1
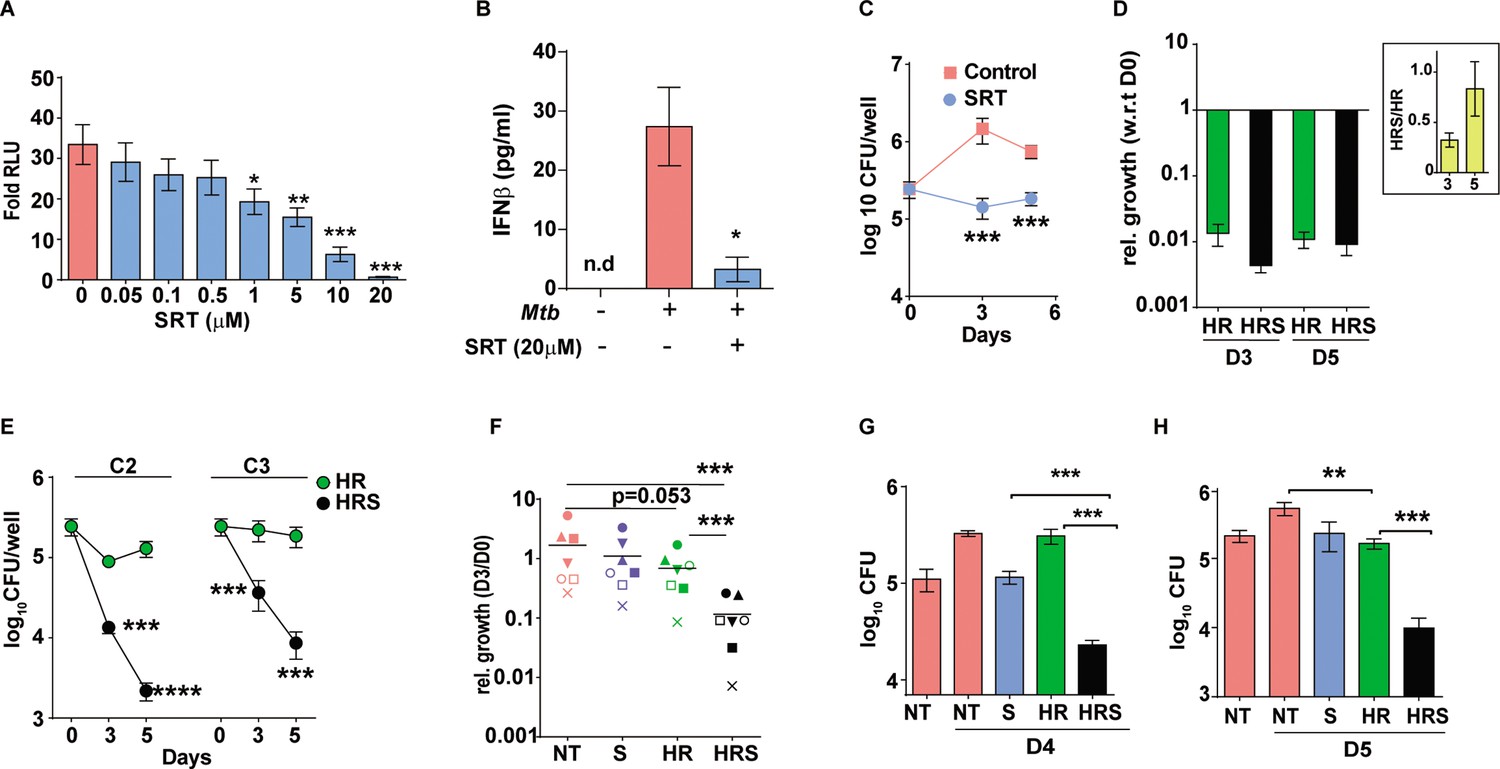
Sertraline inhibits Mtb-induced Type I IFN response and restricts intra-macrophage Mtb growth.
(A) IRF-dependent luciferase activity in THP1 Dual macrophages following infection with Mtb at a MOI of 5. Cells were left untreated or treated with increasing concentrations of SRT for 24 hr in culture and the luminescence in culture supernatants was measured and is represented as mean ± SEM from three independent experiments with triplicate wells each. (B) Levels of IFNβ in cell supernatants of Mtb infected or naïve THP1 macrophages after 24 hr of infection. Cells were left untreated or treated with SRT for 24 hr and cytokine levels were measured by ELISA and is represented as mean ± SEM from three independent experiments with triplicate wells each. (C–H) Intracellular bacterial numbers in THP1 Dual macrophages following infection with Mtb at MOI5 for 6 hr and then either left untreated (NT) or treated with, Sertraline (SRT/ S), HR or a combination of all three (HRS), data represents mean± SEM from N=3 replicate experiments. (C) counts (CFU) at day 3 and day 5 post infection in untreated or SRT-treated macrophages, (D) Growth in cells treated with HR at 200ng/ml INH and 1000ng/ml Rif (C1). The relative bacterial counts at day 3 and day 5 post infection with respect to day 0 (6hp.i.) is represented. (E) Growth of Mtb in cells treated with 20ng/ml INH and 100ng/ml Rif [C2] or with 8ng/ml INH and 40ng/ml Rif [C3] is represented as mean CFU± SEM of N=3 independent experiments. (F) Mtb growth in primary human M1- differentiated MDMs from PBMC of seven individuals is represented as CFU relative to day 0. Macrophages were infected at a MOI of 5 for 6 hr and treated with SRT, HR, HRS or left untreated. Each symbol represents one individual, the relative growth at day 3 with respect to day 0 is depicted. (G–H) Growth in THP1 macrophages treated with Vit. (C) for 24 hr post infection (G) or with 200 µM Oleic acid for 48 hr prior to infection (H) and treatment with HR at C2 concentration with and without SRT. Except for E, paired t-test comparing ratios, other datasets were compared with unpaired t-test; **p<0.01, ***p<0.001.
Figure 2 with 2 supplements
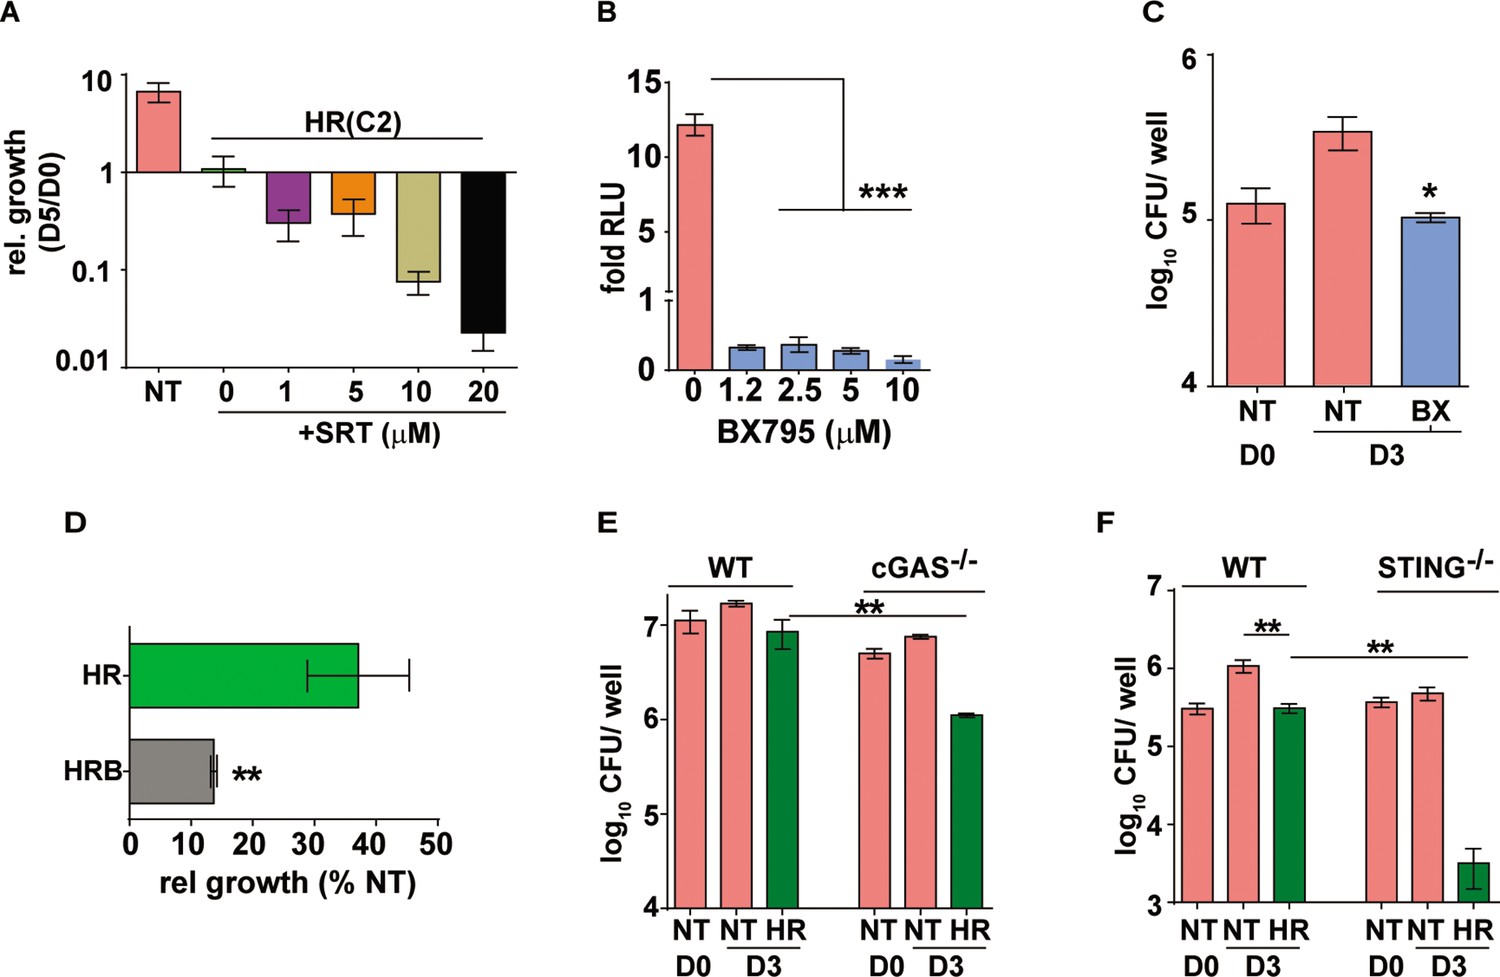
Augmentation property of SRT is due to its ability to inhibit IFN signaling.
(A) Bacterial growth in macrophages treated with HR at C2 and different concentrations of SRT as indicated. Values represented are mean relative CFU at day 5w.r.t day 0 ± SEM of triplicate assays from N=3 independent experiments (B) IRF-dependent luciferase activity in THP1 dual macrophages 24 hr after treatment with varying doses of BX795 along with infection with Mtb at MOI of 5. (C, D) Bacterial growth in macrophages left untreated or treated with 10μM BX795. Relative growth of Mtb in macrophages treated with HR and HR+BX795 (HRB) for 3 days (C), The percentage relative growth of intracellular bacterial numbers in HR or HRB groups with respect to untreated samples is depicted (D). (E, F) Bacterial growth in murine RAW 264.7 derived macrophages ISG (WT), cGAS-/-, STING-/- that were left untreated or treated with HR for 3 days is shown as mean CFU ± SEM for triplicate wells of N=2 (E) and mean ± SEM for (F) of N=2/3 experiments. Statistical significance by unpaired t-test- *p<0.05, ***p<0.001 is indicated.
Figure 2—figure supplement 1
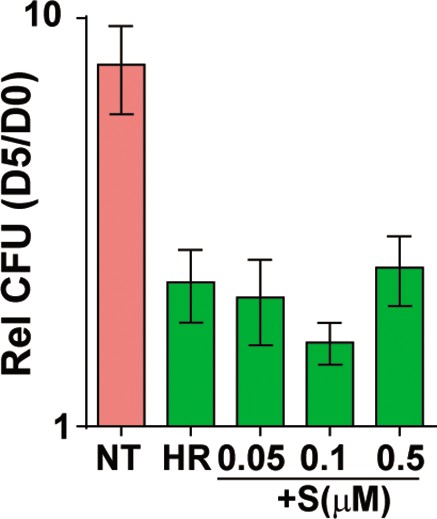
Bacterial growth in macrophages treated with HR alone or in combination with low doses of SRT as indicated.
The relative CFU w.r.t day 0 is depicted as mean ± SEM of triplicate assays and three independent experiments. (2) In vitro growth of Mtb in 7H9 media containing different concentrations of SRT. Mtb cultures were either left untreated or in the presence of different SRT and HR concentrations for 5 days at 37 °C. The growth was regularly monitored by measuring the optical density of culture and is represented as mean ± SD of triplicate assay wells of a representative experiment.
Figure 2—figure supplement 2
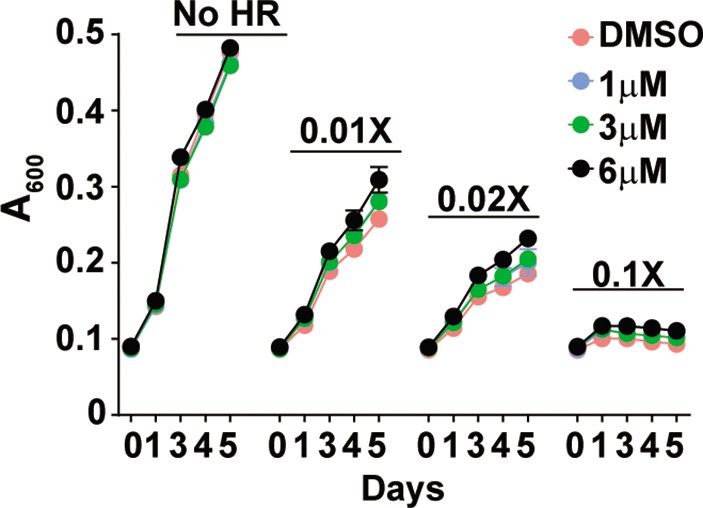
Effect of sertraline on in vitro Mtb cultures with and without HR.
Figure 3 with 1 supplement
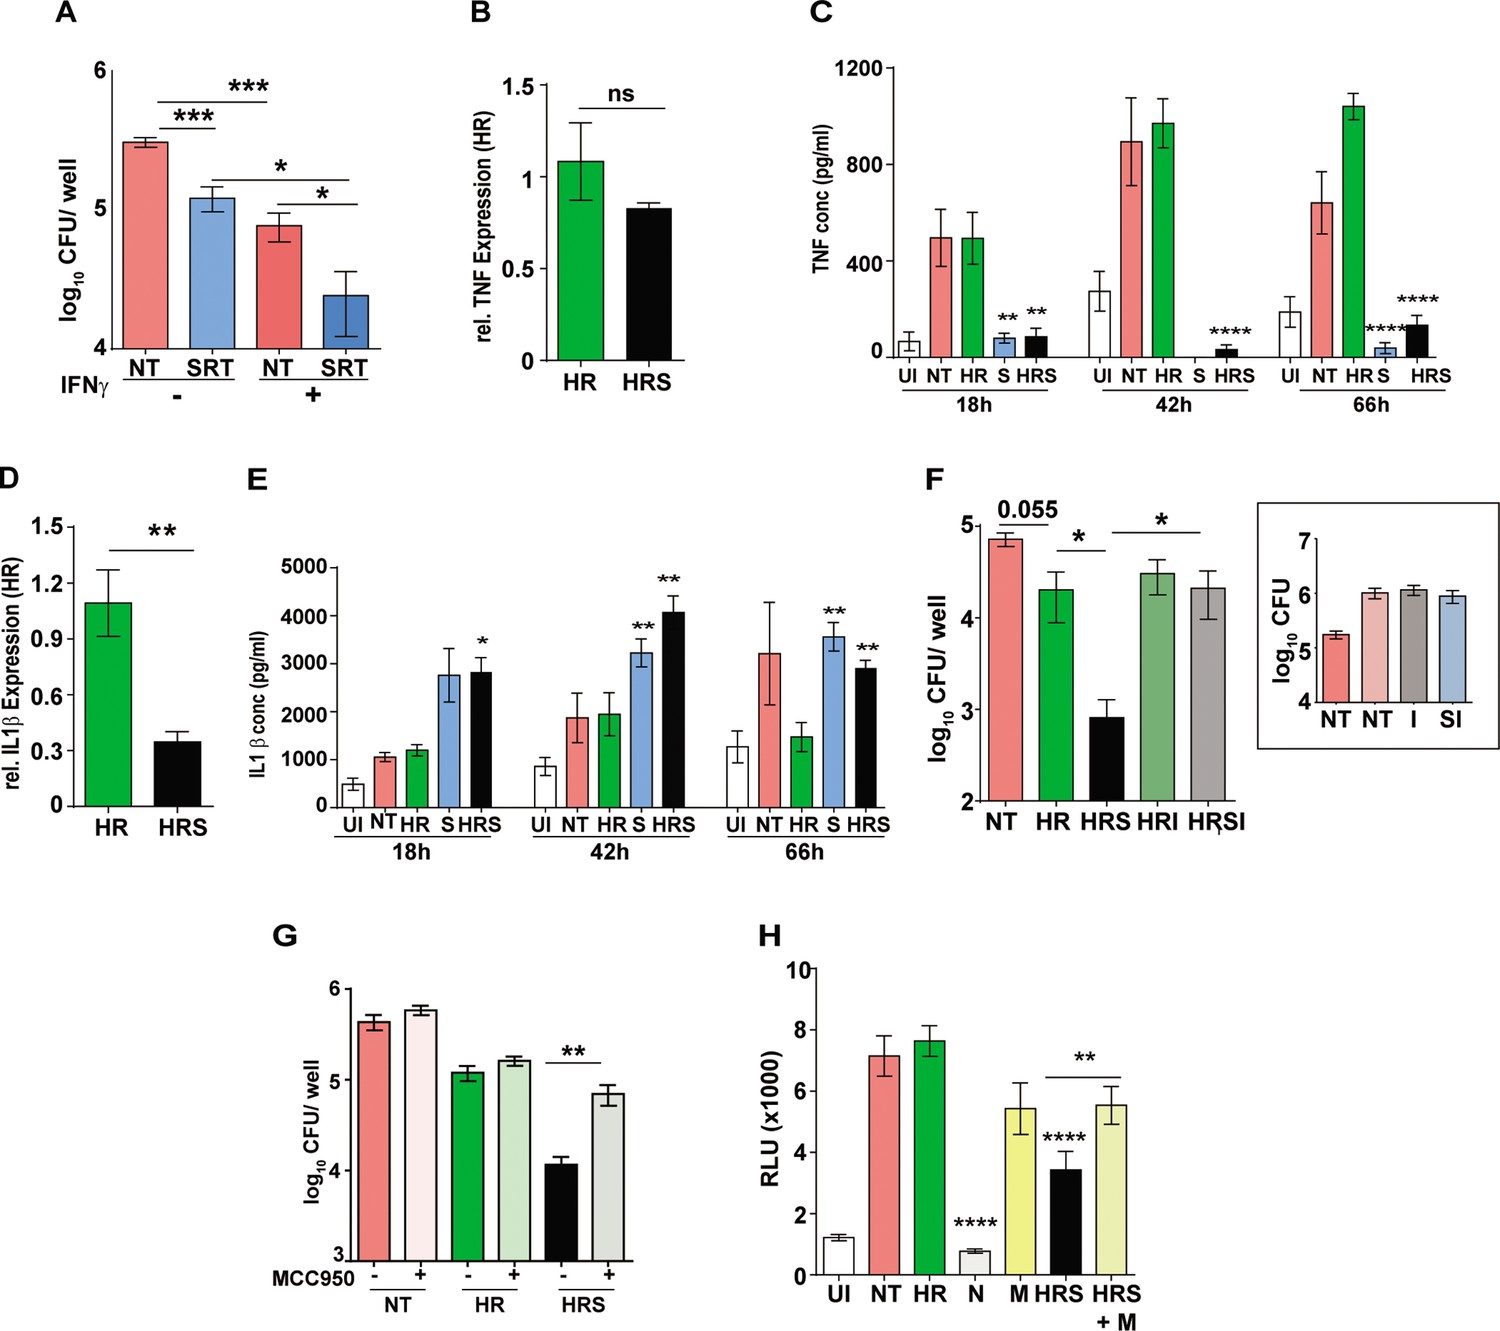
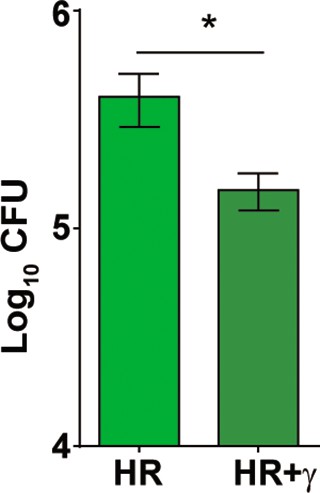
Important role for inflammasome activation in antibiotic potentiation by SRT.
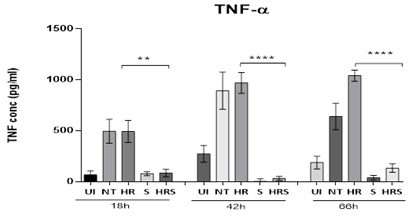
(A) Growth of Mtb in macrophages pre-treated with IFNγ for 16 hr, infected with Mtb for 6 hr and then left untreated or treated with SRT for 3 days. Mean CFU values for triplicate assay wells from two independent experiments (N=2) ± SEM is shown. The relative expression of inflammatory cytokines in macrophages treated with HR or HRS. Data in B and D depict fold expression (transcript abundance) relative to HR alone as mean ± SEM from two independent experiments with duplicate wells each at 18 hr post treatment. (C) and (E) depict secreted cytokines at indicated time points post treatment. (C) Average values ± SEM of TNF at 18, 42, and 66 hr post treatment of two independent experiments of triplicate wells (N=2). (E) IL1 β levels in cell supernatants at 18, 42, and 66 hr of triplicate wells (n=3). (F, G) Growth of Mtb in macrophages in the presence of inflammasome inhibitors. Macrophages were infected with Mtb for 6 hr and then left untreated (NT) or treated with HR and HRS with and without - isoliquiritigenin-I (F) or MCC950 (G) for 5 days. Bacterial growth in macrophages treated with I alone is shown in the inset. Mean CFU / well ± SEM of N=3 assays in triplicate wells are depicted. (H) IRF-dependent luciferase activity at 24 hr in Mtb infected THP1 dual macrophages (MOI –5) and treated with Nigericin (N) to activate or MCC950 (M) to inhibit inflammasomes. Mean RLU ± SEM of triplicate assays of three independent experiments is shown. Data is represented as mean ± SEM for two to three independent experiments containing triplicate wells per assay. Statistical significance by unpaired t-test- *p<0.05, ***p<0.001 is indicated.
Figure 3—figure supplement 1
Bacterial growth in naive macrophages or pre-treated with IFNγ.
along with HR. bacterial numbers are plotted as mean CFU ± SEM of triplicate assays and three independent experiments.
Figure 4 with 1 supplement
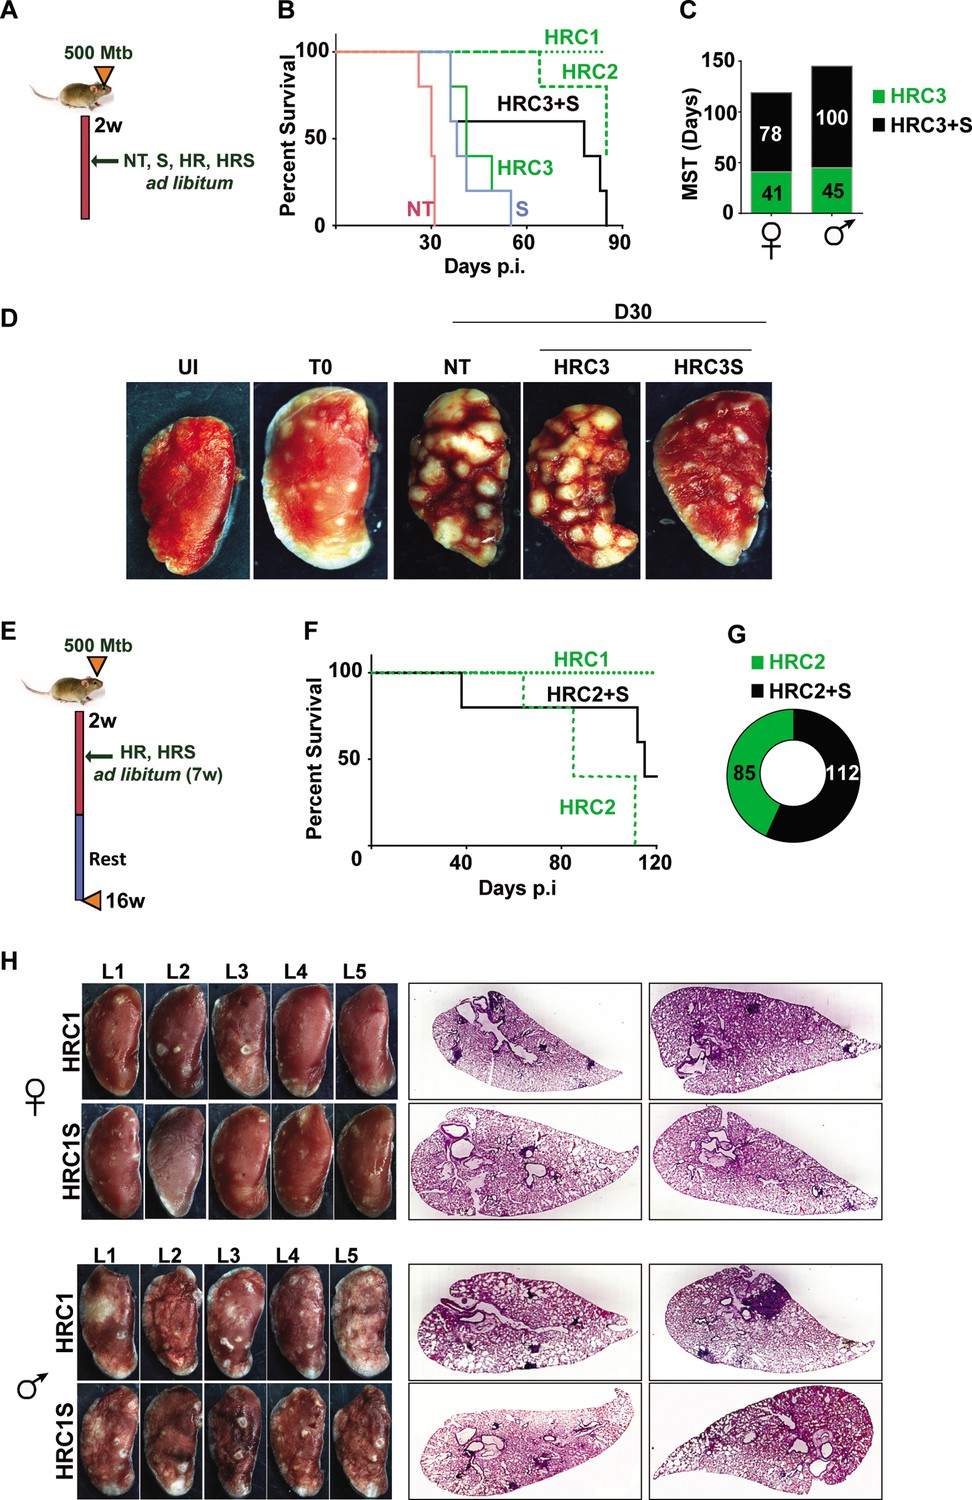
Adjunct SRT improves host survival in a susceptible mouse model of infection.
(A) Schematic of Mtb infection and drug treatment in C3HeB/FeJ mice. (B) Survival curves of Mtb infected C3HeB/FeJ mice (5) left untreated (red) or treated with SRT alone (blue) or with different concentrations of H and R (green lines or boxes- HRC1- 1x: H-100μg/ml, R-40μg/ml, HRC2-0.1x, HRC3-0.01x) alone or along with SRT (10μg/ml)- black lines / boxes. (C) Median survival time of different treatment groups of mice (5 each of males and females). (D) Gross tissue morphology of lungs of uninfected animals (UI) and indicated groups at 30 days post infection with Mtb. (E) Schematic of infection and antibiotic treatment in C3HeB/FeJ with HRC2 and HRC1. (F–G) Survival (F) and MST (G) of C3HeB/FeJ mice treated with HRC2 or HRC2S. (H) Gross lung morphology at the end of 16 weeks and histological sections of lungs with H&E staining of C3HeB/FeJ mice either treated with HRC1 or in combination with SRT.
Figure 4—figure supplement 1
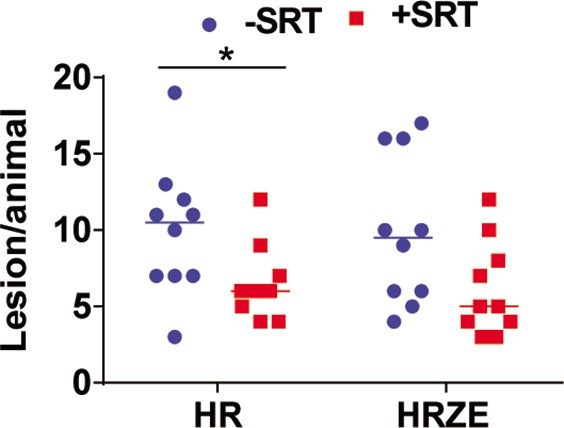
Quantitation of macroscopic lesions in left caudal lobe of lungs of animals infected with Mtb and treated with HR, HRZE or in combination with SRT.
Average number of lesions ± SEM from 10 animals is depicted.
Figure 5
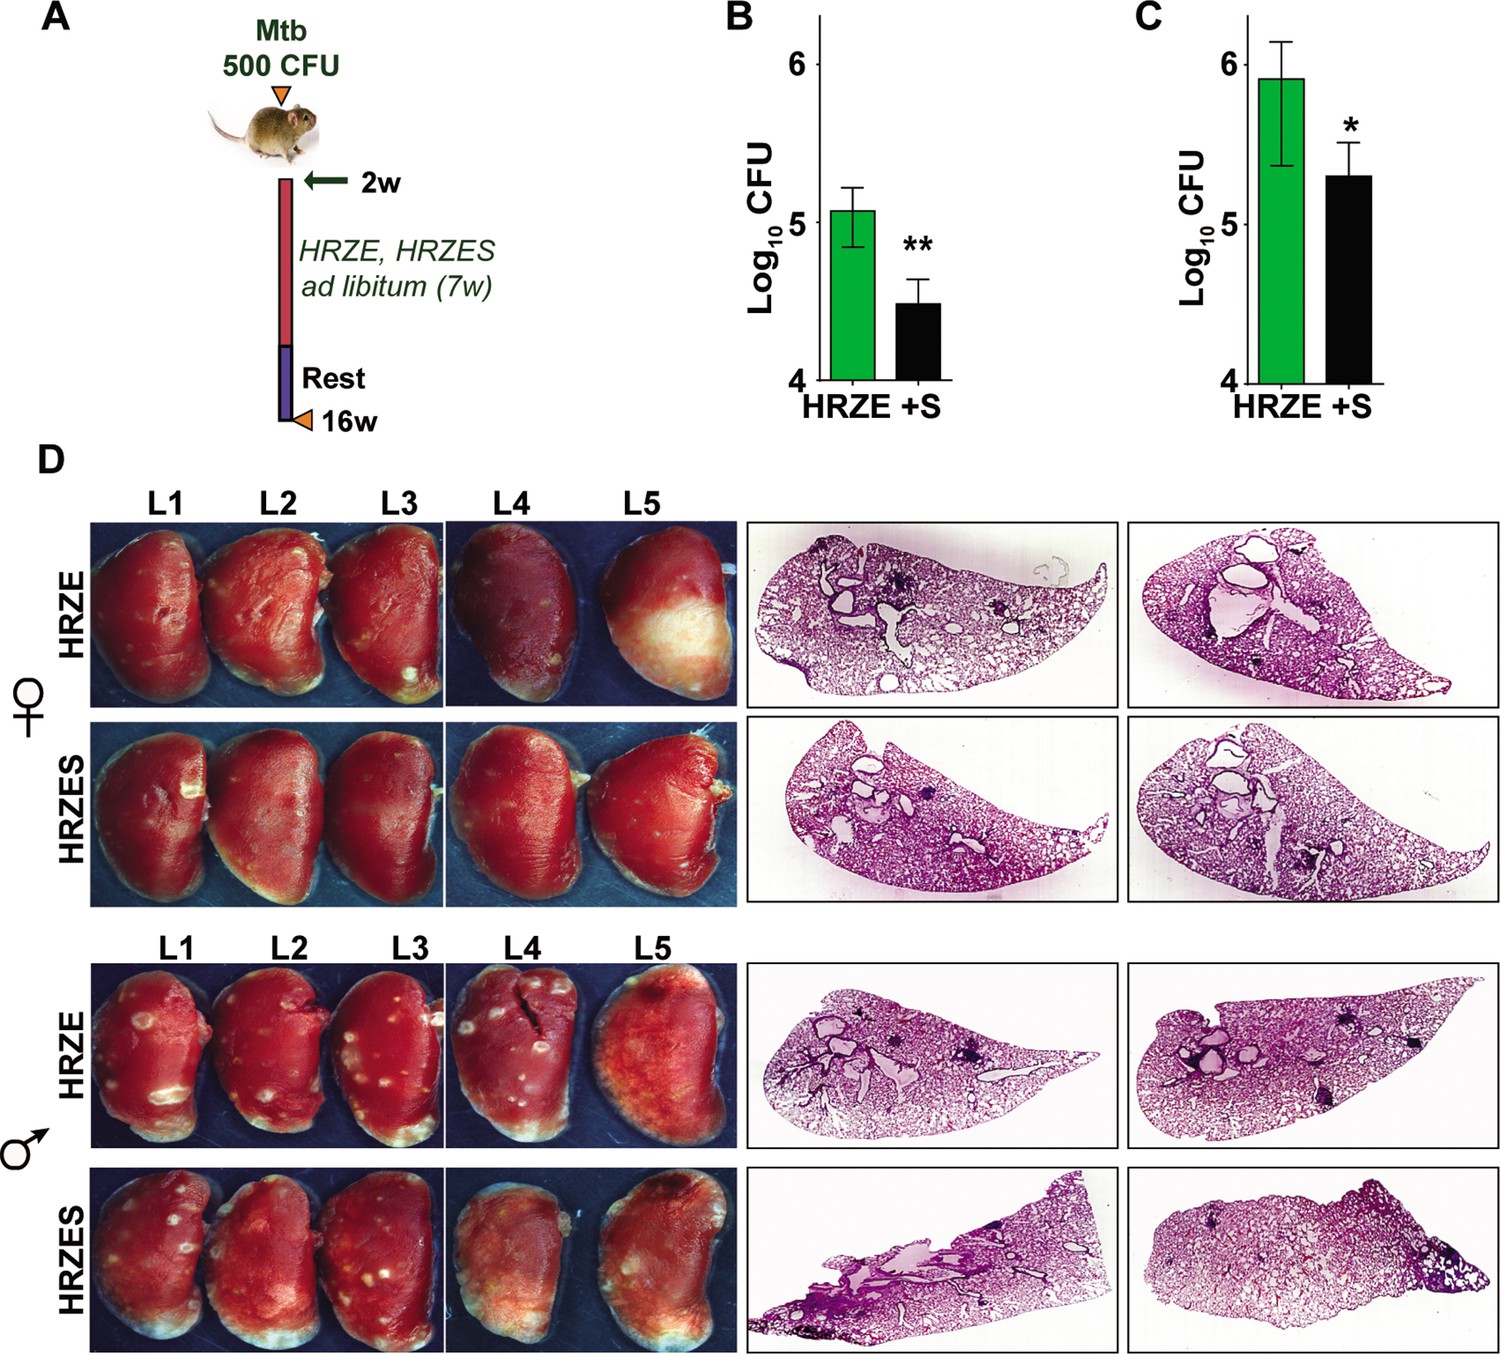
In vivo potentiation of SRT-mediated antimycobacterial activity.
(A) Schematic of infected C3HeB/FeJ mice (10) and treated with HRZE HRC1- 1x: H-100μg/ml, R-40μg/ml, Z-150μg/ml, E-100μg/ml or in combination with SRT (10μg/ml). Animals were euthanized at the end of 16 weeks and extent of infection was determined by estimating bacterial numbers (CFU) in lungs of female (B) and male (C) mice. (D) Gross lung morphology and histochemical sections of lungs with H&E staining of C3HeB/FeJ mice infected with Mtb and treated either with HRZE or in combination with SRT. Statistical significance by unpaired t-test-*p<0.05, ***p<0.001 is indicated.
Figure 6 with 1 supplement
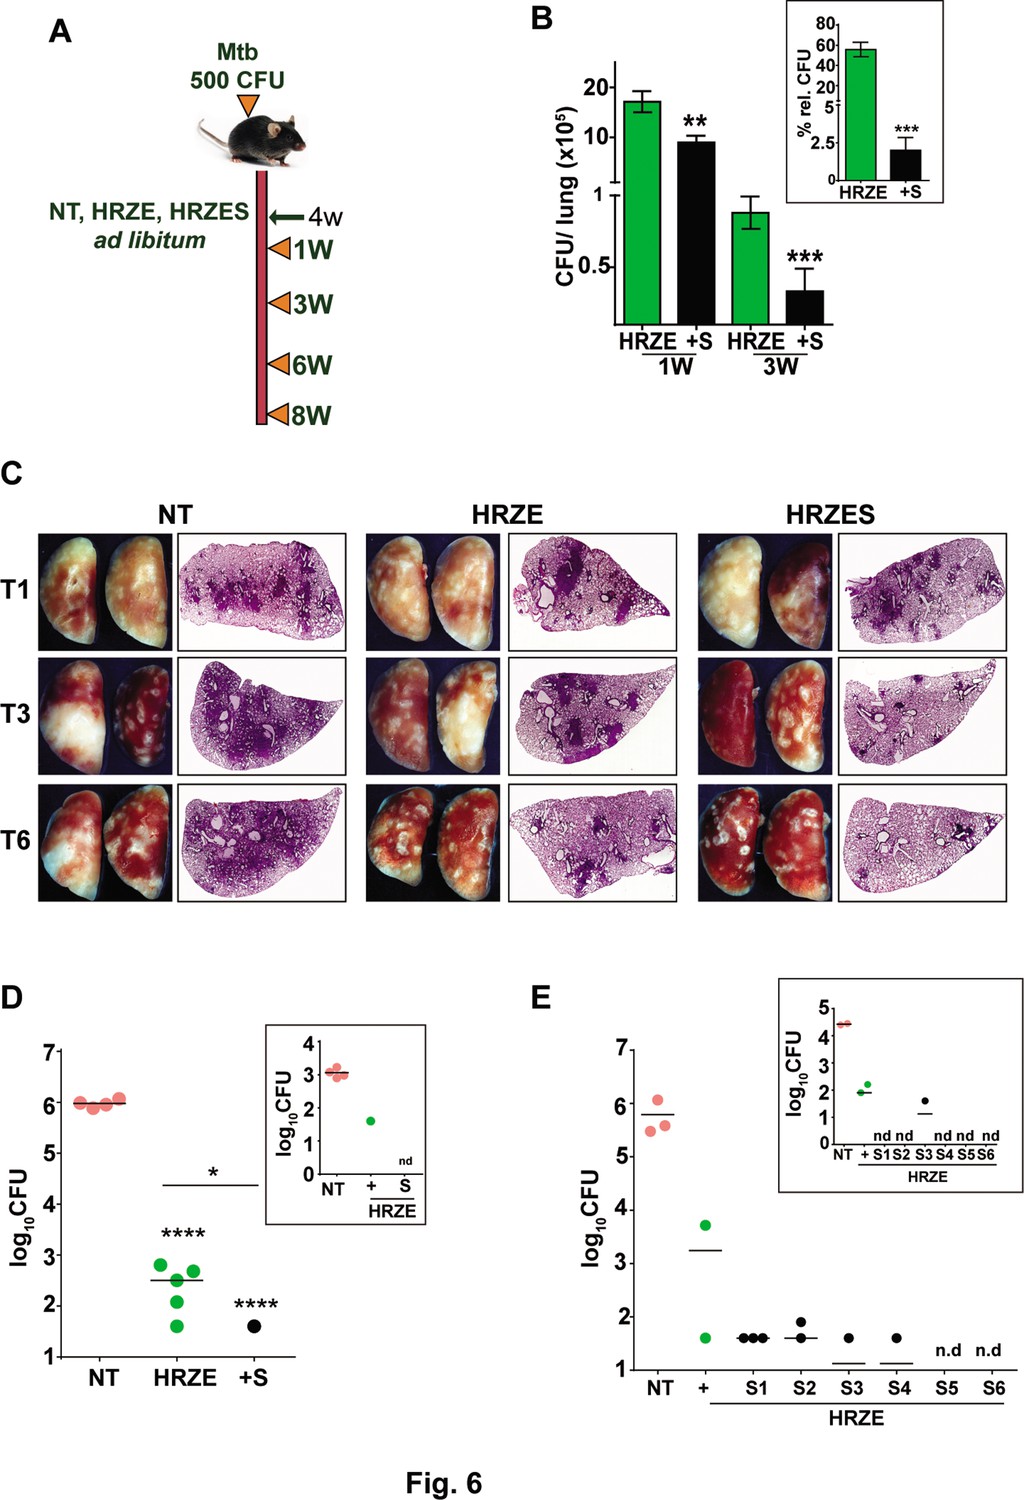
SRT initiates early bacterial clearance in mice.
(A) Schematic of Mtb infection and drug treatment in C57BL6 mice. Mice were infected with Mtb and treated with HRZE or HRZES (HRC1- 1X: H-100μg/ml, R-40μg/ml, Z-150μg/ml, E-100μg/ml, SRT 10μg/ml) treatment. Lung CFU post 1 and 3 weeks (B) and 3-week spleen CFU (inset) is represented as mean CFU ± SEM of N=3, (C) Gross lung morphology and H&E staining of tissue sections after treatment for the indicated number of weeks. (D) Lung and spleen CFU in Mtb infected C57BL6 mice (N=5), left untreated (NT) or treated with HRZE or HRZES for 8 weeks. (E) Lung and spleen CFU in Mtb infected C57BL6 mice (N=3) left untreated (NT) or treated with HRZE alone (+) or with HRZES (SRT at 6 concentrations (0.125mg/kg-S1, 0.25mg/kg-S2, 0.5mg/kg-S3, 1mg/kg-S4, 2mg/kg-S5 and 3mg/kg-S6)) for 9 weeks. Each individual dot represents an animal, nd- CFU not detected. Statistical significance by unpaired t-test-*p<0.05, ***p<0.001 is indicated.
Figure 6—figure supplement 1
Balb/c mice were infected with Mtb and the treated with HRZE or HRZES (HRC1- 1 X: H-100μg/ml, R-40μg/ml, Z-150μg/ml, E-100μg/ml, SRT 10 μg/ml).
Lung and spleen CFU at 3 weeks of treatment is depicted as mean CFU ± SEM of five animals.
Figure 7
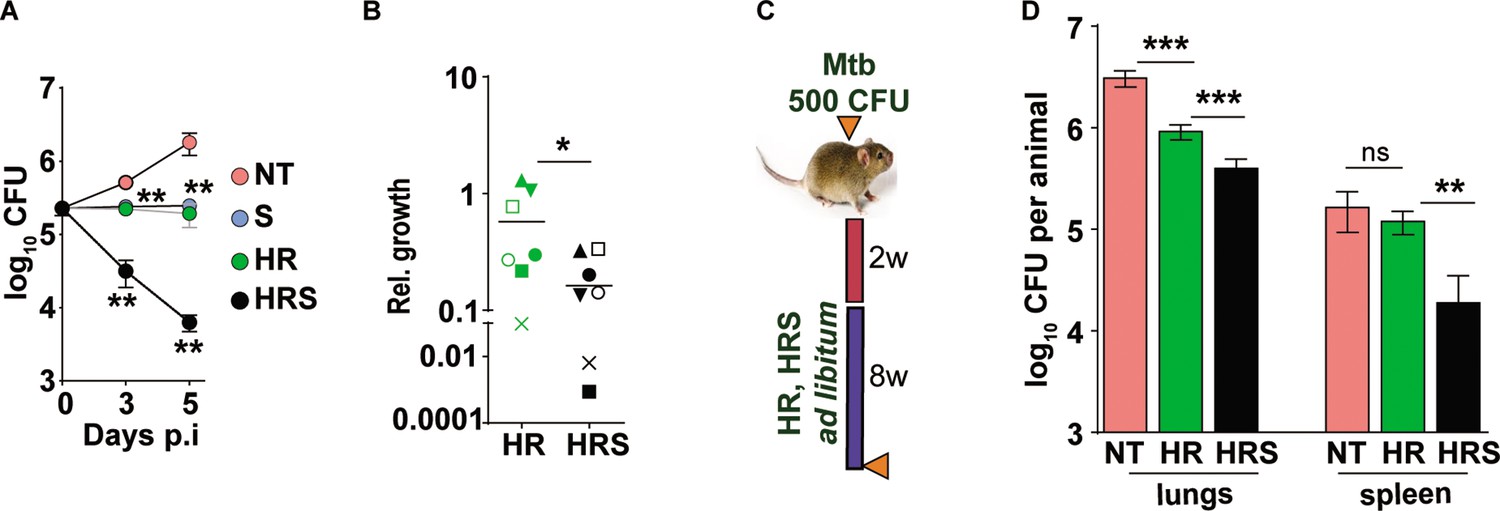
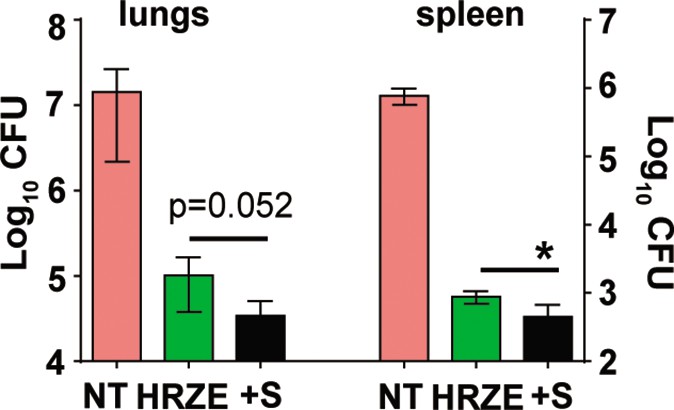
Addition of SRT helps better control of drug tolerant Mtb in vivo.
(A) Intracellular bacterial growth in THP1 macrophages infected with HR tolerant Mtb strain at a MOI of 5 for 6 hr. Following this, cells were left untreated (NT) or treated with SRT, HR, or HRS for 3 or 5 days. Bacterial numbers were enumerated and is represented as average log10 CFU ± SEM from two independent experiments with triplicate wells each. (B) Bacterial numbers at day 3 of primary monocyte derived macrophages (M1) from seven independent donors. After 6h of infection, the macrophages were treated with HR and HRS for 3 days. The ratio of intracellular bacterial numbers in HR or HRS groups with respect to untreated samples is represented as relative growth with median values indicated by the horizontal line. (C) Schematic of Mtb infection and drug treatment in C3HeB/FeJ mice infected with Mtb for 2 weeks followed by treatment with 0.1X HR alone or with SRT (HRS) or 8 weeks. (D) Bacterial numbers (CFU) in lungs and spleen at the end of the experiment. Statistical significance by unpaired t-test -*p<0.05, ***p<0.001 is indicated.
Author response image 1

Relative expression of inflammatory cytokines in hMDMs treated with HR or HRS.
Data depict fold expression (transcript abundance) relative to UI alone as mean + SEM from three independent experiments with triplicate wells each at 18h post treatment.
Author response image 2

Relative expression of inflammatory cytokines in mBMDMs treated with HR or HRS.
Data depict fold expression (transcript abundance) relative to UI alone as mean + SEM from two independent experiments with triplicate wells each at 18h post treatment.
Author response image 3

Cytokine levels were determined with a Luminex-based multiplex assay.
Average values + SEM at 18h and 42h post-treatment of three or two independent experiments of triplicate wells (N=2,3).
Author response image 4
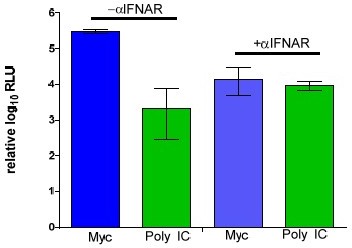
IRF dependent luciferase activity in THP1 Dual.
Cells were treated with IFNAR antibody for 2h following infection with mycobactreia and PIC treatment. Data depict luminescence relative to UI and UI + IFNAR Ab as mean + SD experiments with triplicate wells each at 3. 6, 24, 48 hr post treatment.
Author response image 5
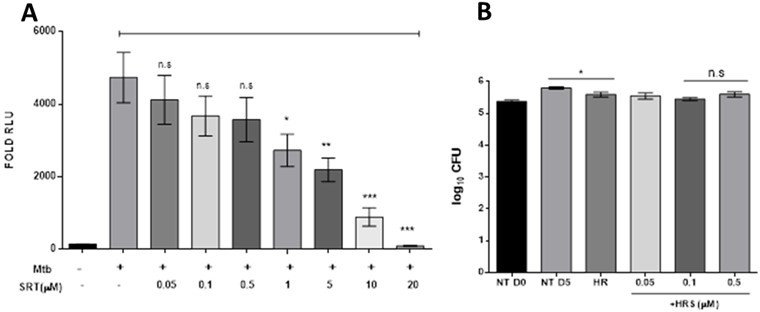
Testing the effect of SRT at lower concentrations: A-IRF dependent luciferase activity in THP1 Dual macrophages following infection with Mtb at a MOI of 5.
Cells were left untreated or treated with increasing concentrations of SRT for 24h in culture and the luminescence in culture supernatants was measured and is represented as mean + SEM from 2 independent experiments with triplicate wells each. (B) Growth of Mtb in macrophages infected with Mtb for 6h and then left untreated or treated with HRS at different concentration for 3 days. Data is represented as mean + SEM form 2 independent experiments containing triplicate wells per assay.
Author response image 6
Additional files
Download links
A two-part list of links to download the article, or parts of the article, in various formats.
Downloads (link to download the article as PDF)
Open citations (links to open the citations from this article in various online reference manager services)
Cite this article (links to download the citations from this article in formats compatible with various reference manager tools)
The antidepressant sertraline provides a novel host directed therapy module for augmenting TB therapy
eLife 12:e64834.
https://doi.org/10.7554/eLife.64834


