NF1 regulates mesenchymal glioblastoma plasticity and aggressiveness through the AP-1 transcription factor FOSL1
- Seve Ballesteros Foundation Brain Tumor Group, Spanish National Cancer Research Centre, Spain
- Department of Neurosurgery, Faculty of Medicine Freiburg, Germany
- Max-Delbrück-Center for Molecular Medicine in the Helmholtz Association (MDC), Germany
- Dept of Immunology, Genetics and Pathology and Science for Life Laboratory, Uppsala University, Rudbecklaboratoriet, Sweden
- Science for Life Laboratory, Uppsala University, Rudbecklaboratoriet, Sweden
- Genes, Development, and Disease Group, Spanish National Cancer Research Centre, Spain
- Laboratory Medicine Department, Medical University of Vienna, Austria
- Dermatology Department, Medical University of Vienna, Austria
Figures
Figure 1 with 2 supplements
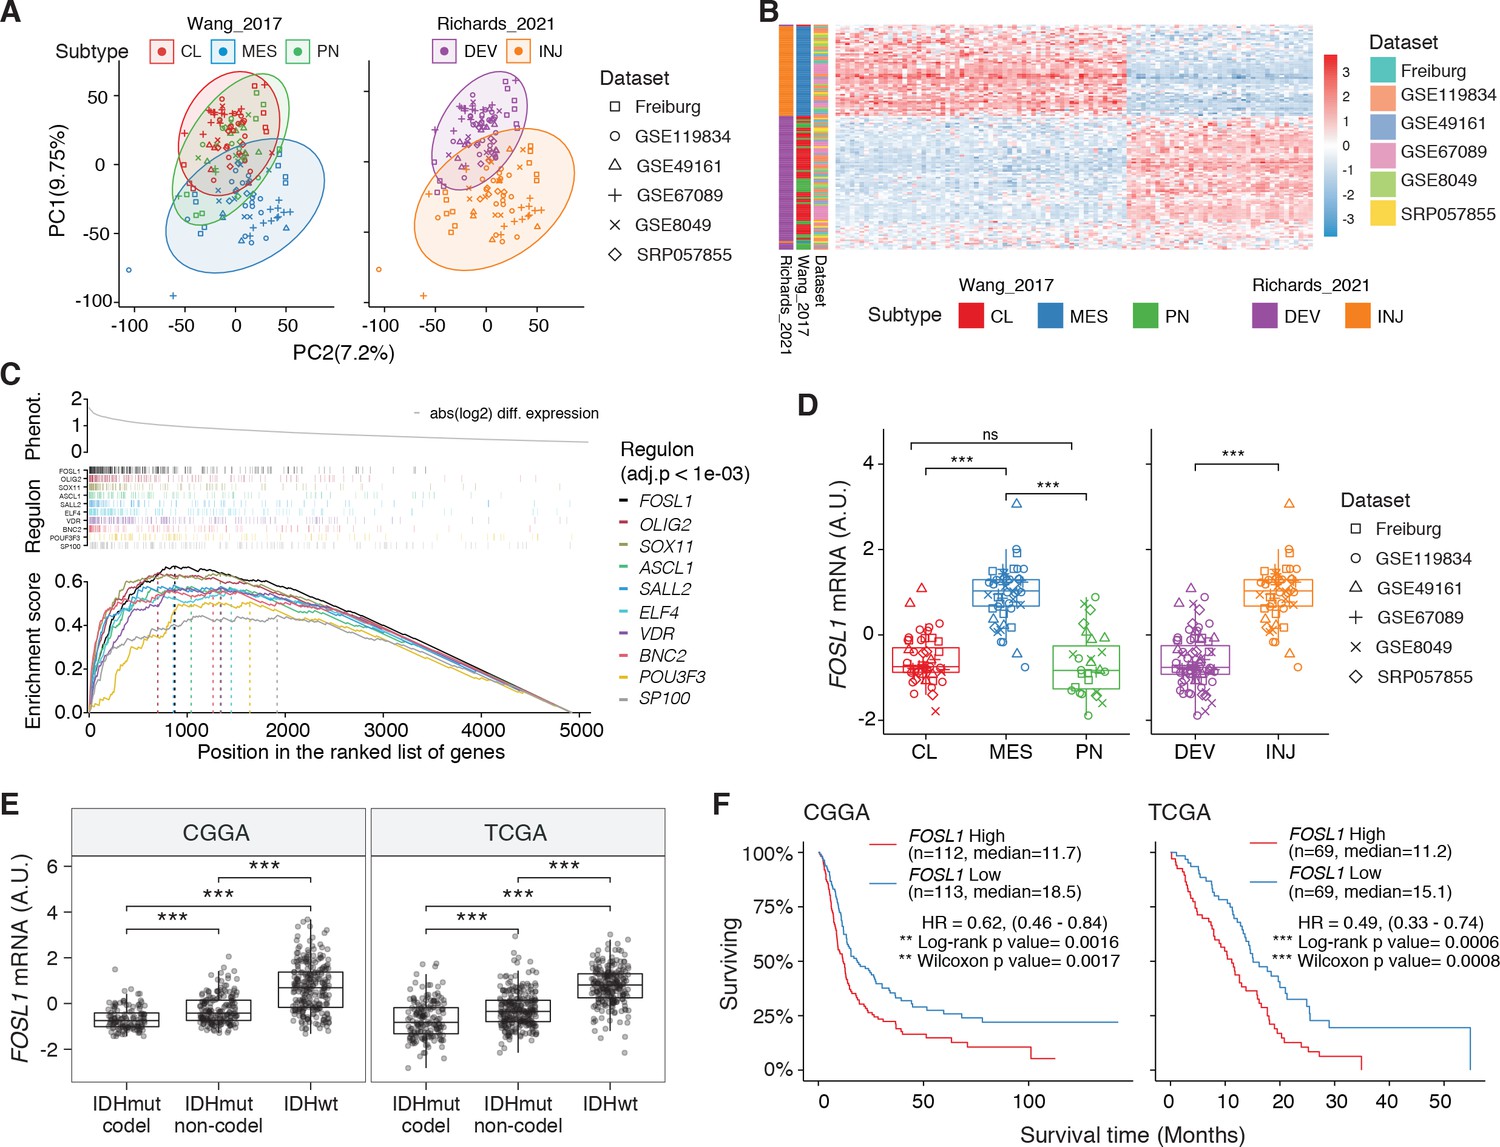
FOSL1 is a bona fide regulator of the glioma-intrinsic mesenchymal (MES) transcriptional signature.
(A) Principal component (PC) analysis of the brain tumor stem cells (BTSCs) expression dataset. (B) Heatmap of the top 100 differentially expressed genes between MES and non-MES BTSCs. (C) One-tail gene set enrichment analysis (GSEA) of the top 10 scoring transcription factors (TFs) in the master regulator analysis (MRA). (D) FOSL1 mRNA expression in the BTSCs dataset. One-way ANOVA with Tukey multiple pairwise comparison, ***p≤0.001, ns = not significant. (E) FOSL1 mRNA expression in the CGGA and TCGA datasets. Tumors were separated according to their molecular subtype classification. One-way ANOVA with Tukey multiple pairwise comparison, ***p≤0.001. (F) Kaplan–Meier survival curves of IDH-wt gliomas in the CGGA and TCGA datasets stratified based on FOSL1 expression (see Materials and methods for details).
-
Figure 1—source data 1
Source data of Figure 1A, B, D–F.
- https://cdn.elifesciences.org/articles/64846/elife-64846-fig1-data1-v1.xlsx
Figure 1—figure supplement 1
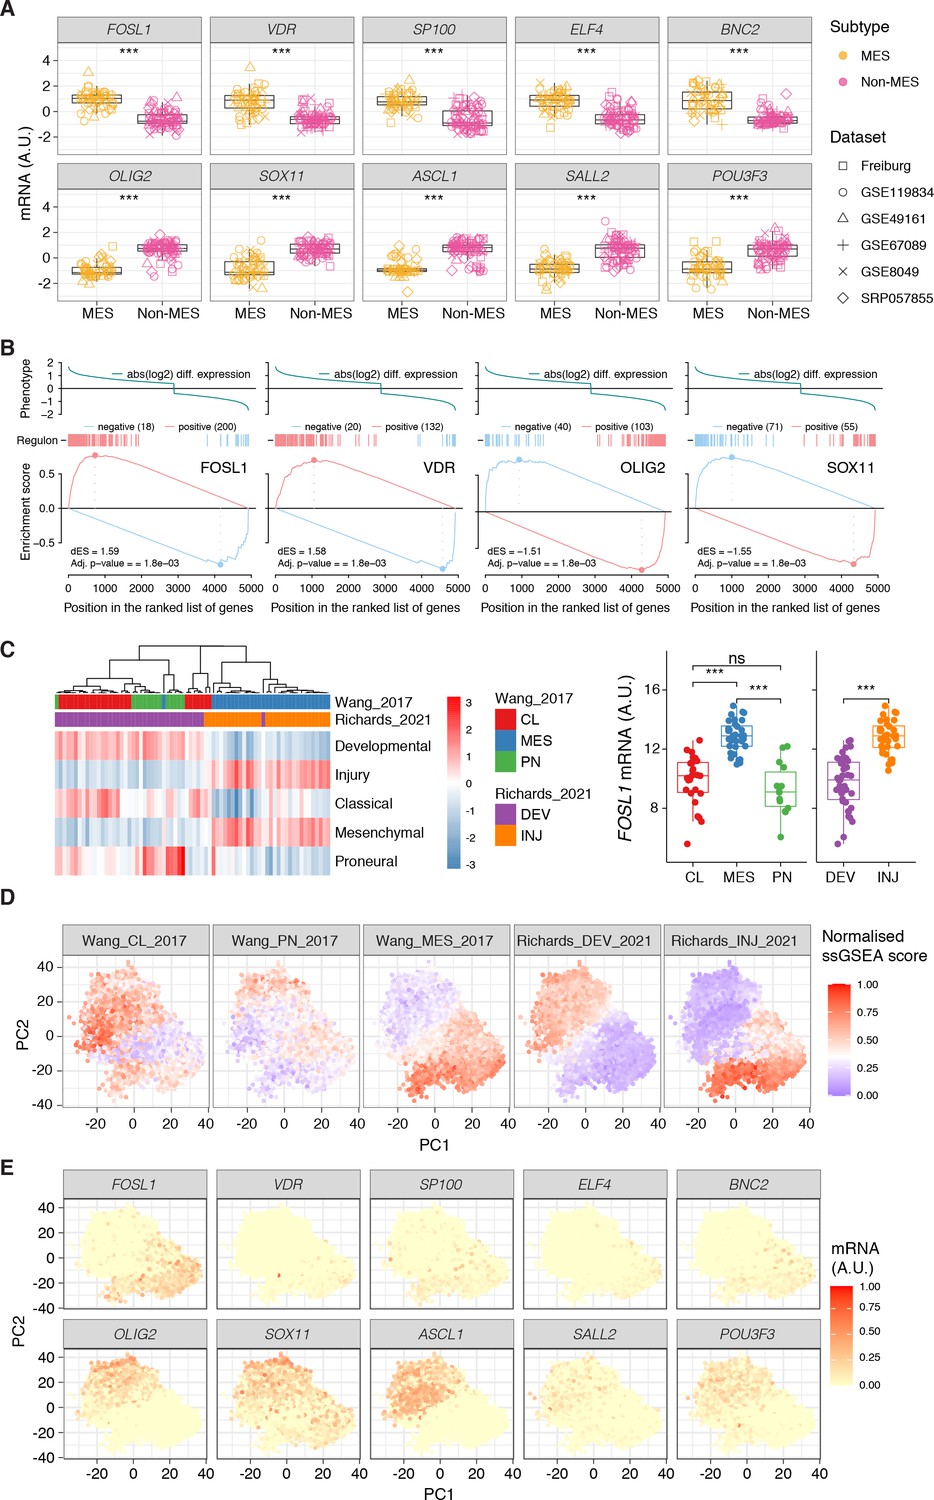
Expression, bulk and single-cell RNA-seq, of the top 10 transcription factors (TFs) identified in the master regulator analysis (MRA).
(A) mRNA expression of the top 10 scoring TFs in the MRA of the brain tumor stem cells (BTSCs) dataset, comparing mesenchymal (MES) versus non-MES. Student’s t test, ***p .001. (B) Two-tailed gene set enrichment analysis (GSEA) showing positive or negative targets for the top four representative TFs in the MRA. (C) FOSL1 mRNA expression in the Richards glioma stem cells (GSCs) bulk RNA-seq dataset (n = 72; right panel). ) Single-sample gene set enrichment analys (ssGSEA) was performed to identify the GSCs subtypes (left panel). Tumors were separated according to their expression subtype classification. One-way ANOVA with Tukey multiple pairwise comparison, ***p≤0.001, **p≤0.01, ns = not significant. (Dis ssGSEA scores of the Wang_2017 and Richards_2021 transcriptional subtypes performed on the scRNA-seq GSCs data (65,655 cells from 28 samples) from Richards et al., 2021. (E) mRNA expression of the top 10 scoring TFs on the scRNA-seq GSCs data from Richards et al., 2021.
-
Figure 1—figure supplement 1—source data 1
Source data of Figure 1—figure supplement 1A, C, D, and E.
- https://cdn.elifesciences.org/articles/64846/elife-64846-fig1-figsupp1-data1-v1.xlsx
Figure 1—figure supplement 2
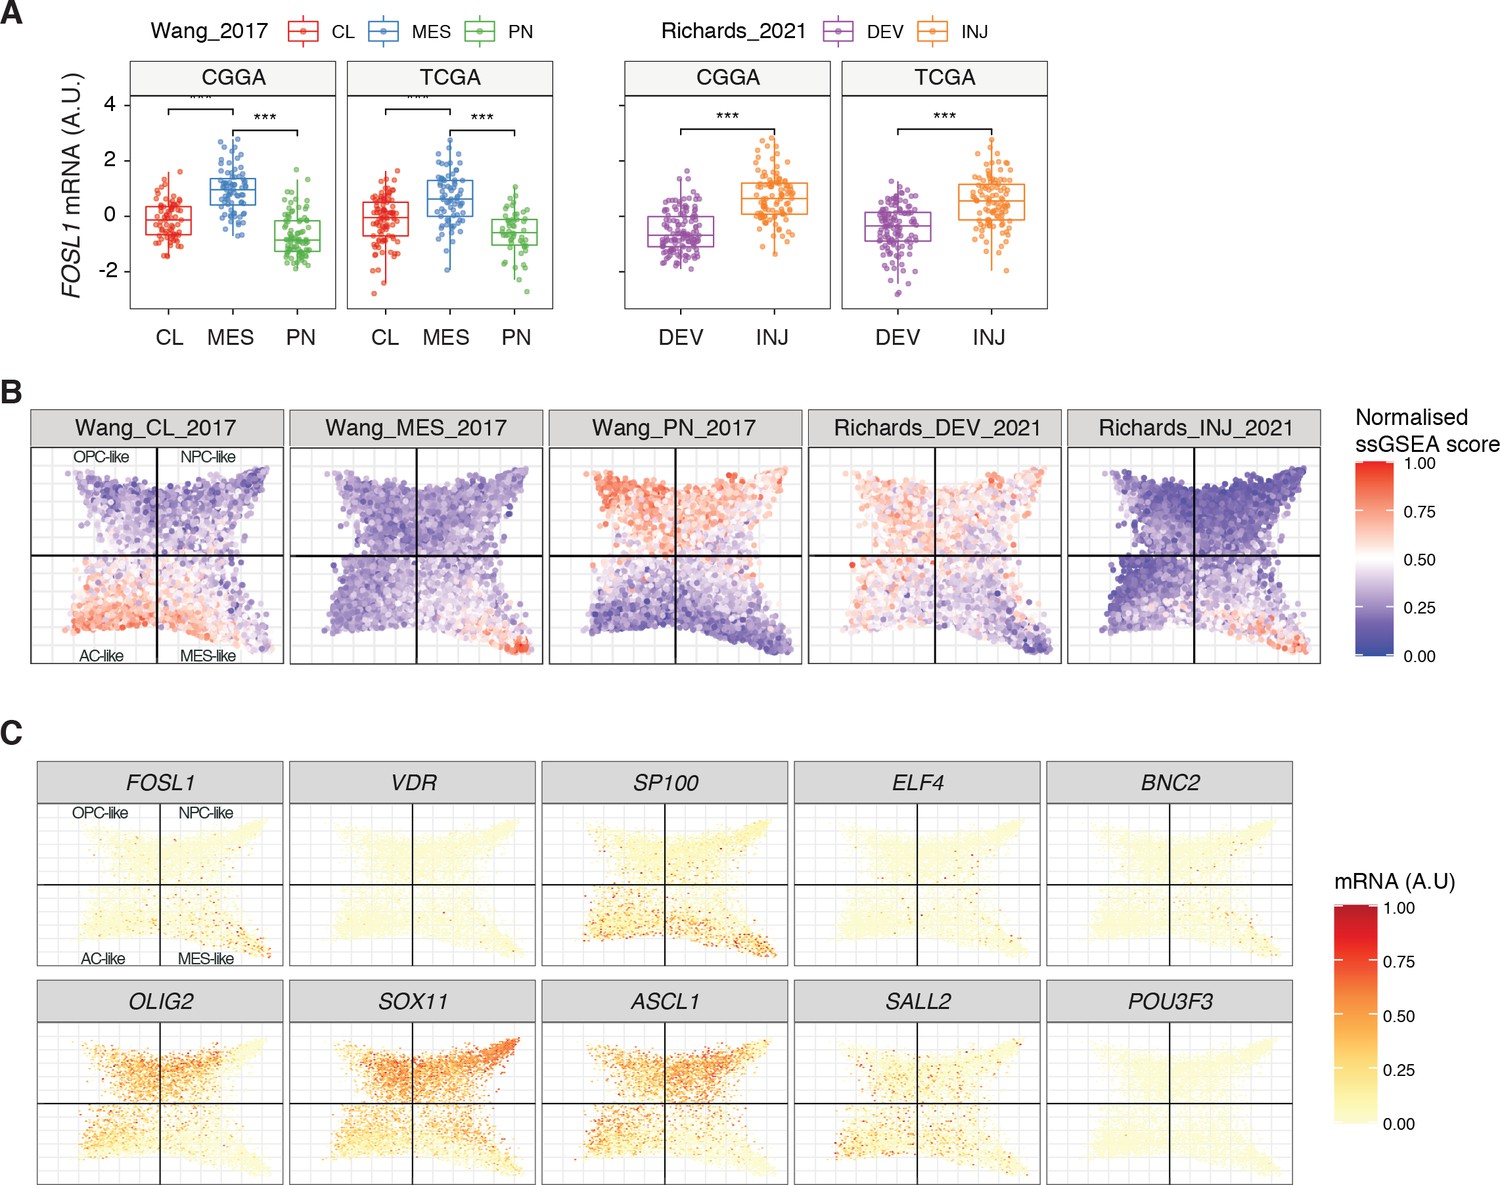
Expression in human glioblastomas (GBMs) of FOSL1 and the top 10 transcription factors (TFs) identified in the master regulator analysis (MRA).
(A) FOSL1 mRNA expression in IDH-wt tumors of the CGGA and TCGA datasets. Tumors were separated according to their expression subtype classification. One-way ANOVA with Tukey multiple pairwise comparison, ***p≤0.001, **p≤0.01, ns = not significant. (B) Single-sample gene set enrichment analysis (ssGSEA) scores of the Wang_2017 and Richards_2021 transcriptional subtypes performed on the scRNA-seq data (6863 cells) from Neftel et al., 2019. (C) Normalized mRNA expression of the top 10 scoring TFs on the scRNA-seq tumor data from Neftel et al., 2019.
-
Figure 1—figure supplement 2—source data 1
Source data of Figure 1—figure supplement 2A–C.
- https://cdn.elifesciences.org/articles/64846/elife-64846-fig1-figsupp2-data1-v1.xlsx
Figure 2 with 3 supplements
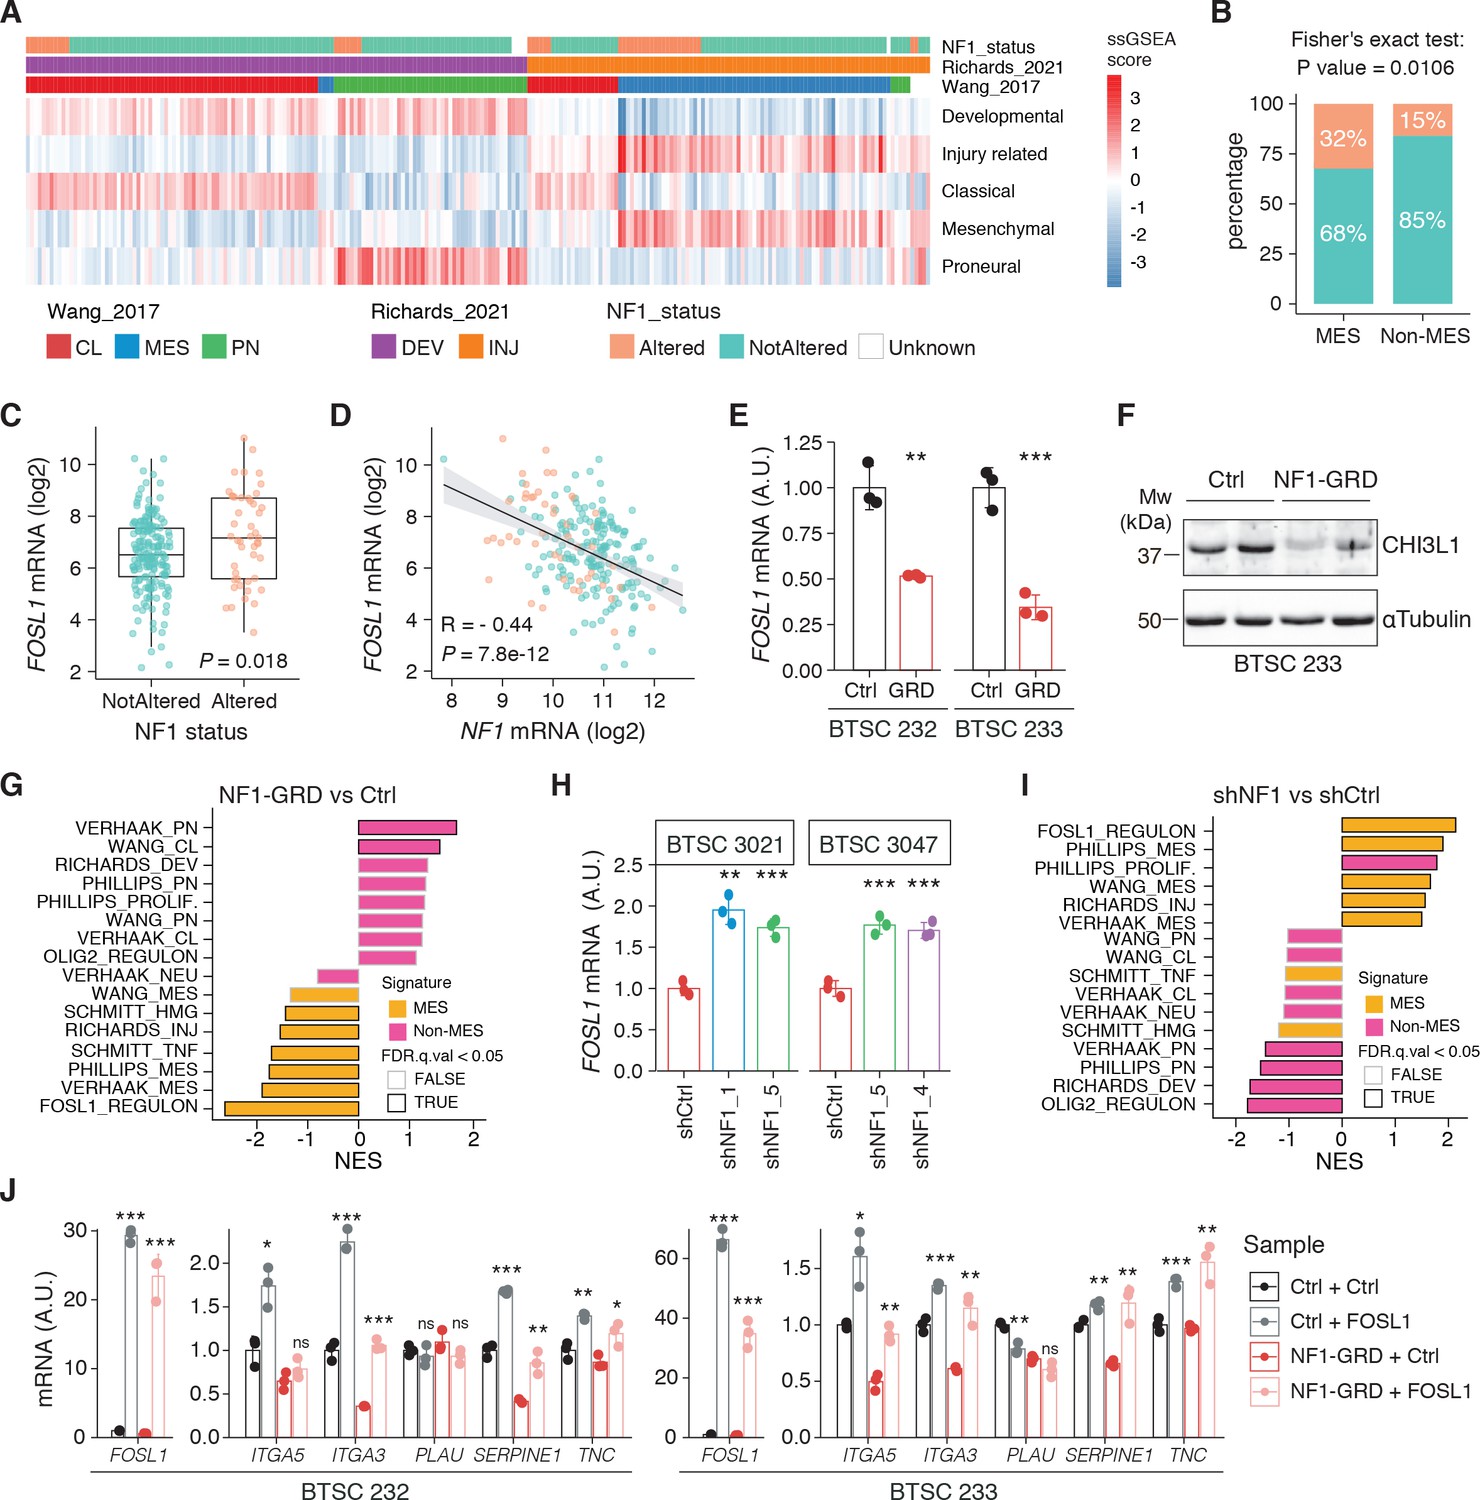
NF1 is a functional modulator of mesenchymal (MES) transcriptional signatures through FOSL1 expression regulation.
(A) Heatmap of the subtypes single-sample gene set enrichment analysis (ssGSEA) scores and NF1 genetic alterations of the IDH-wt gliomas in the TCGA dataset. (B) Frequency of NF1 alterations in MES and non-MES IDH-wt gliomas. Colors are as in panel (A). (C) FOSL1 mRNA expression in IDH-wt gliomas, stratified according to NF1 alterations. Colors are as in panel (A). Student’s t test, p=0.018. (D) Correlation of FOSL1 and NF1 mRNA expression in IDH-wt gliomas. Colors are as in panel (A). Pearson correlation, R = −0.044, p=7.8e-12. (E) qRT-PCR analysis of FOSL1 expression upon NF1-GRD overexpression in BTSC 232 and BTSC 233 cells. (F) Western blot analysis of whole-cell extract of BTSC 233 cells showing CHI3L1 mesenchymal marker expression upon NF1-GRD transduction; α-tubulin was used as loading control. Two biological replicates are shown. (G) Gene set enrichment analysis (GSEA) results of BTSC 233 cells transduced with NF1-GRD expressing lentivirus versus Ctrl. NES: normalized enrichment score. (H) qRT-PCR analysis of FOSL1 expression upon NF1 knockdown in BTSC 3021 and BTSC 3047 cells. (I) GSEA results of BTSC 3021 transduced with shNF1_5 versus Ctrl. (J) qRT-PCR analysis of MES genes expression upon NF1-GRD and FOSL1 co-expression in BTSC 232 and BTSC 233 cells. qRT-PCR data in (E), (H), and (J) are presented as mean ± SD (n = 3, technical replicates), normalized to 18S rRNA expression; Student’s t test, *p≤0.05, **p≤0.01, ***p≤0.001, ns = not significant.
-
Figure 2—source data 1
Source data of Figure 2F.
- https://cdn.elifesciences.org/articles/64846/elife-64846-fig2-data1-v1.ai
-
Figure 2—source data 2
Source data of Figure 2A, C–E, G–J.
- https://cdn.elifesciences.org/articles/64846/elife-64846-fig2-data2-v1.xlsx
Figure 2—figure supplement 1
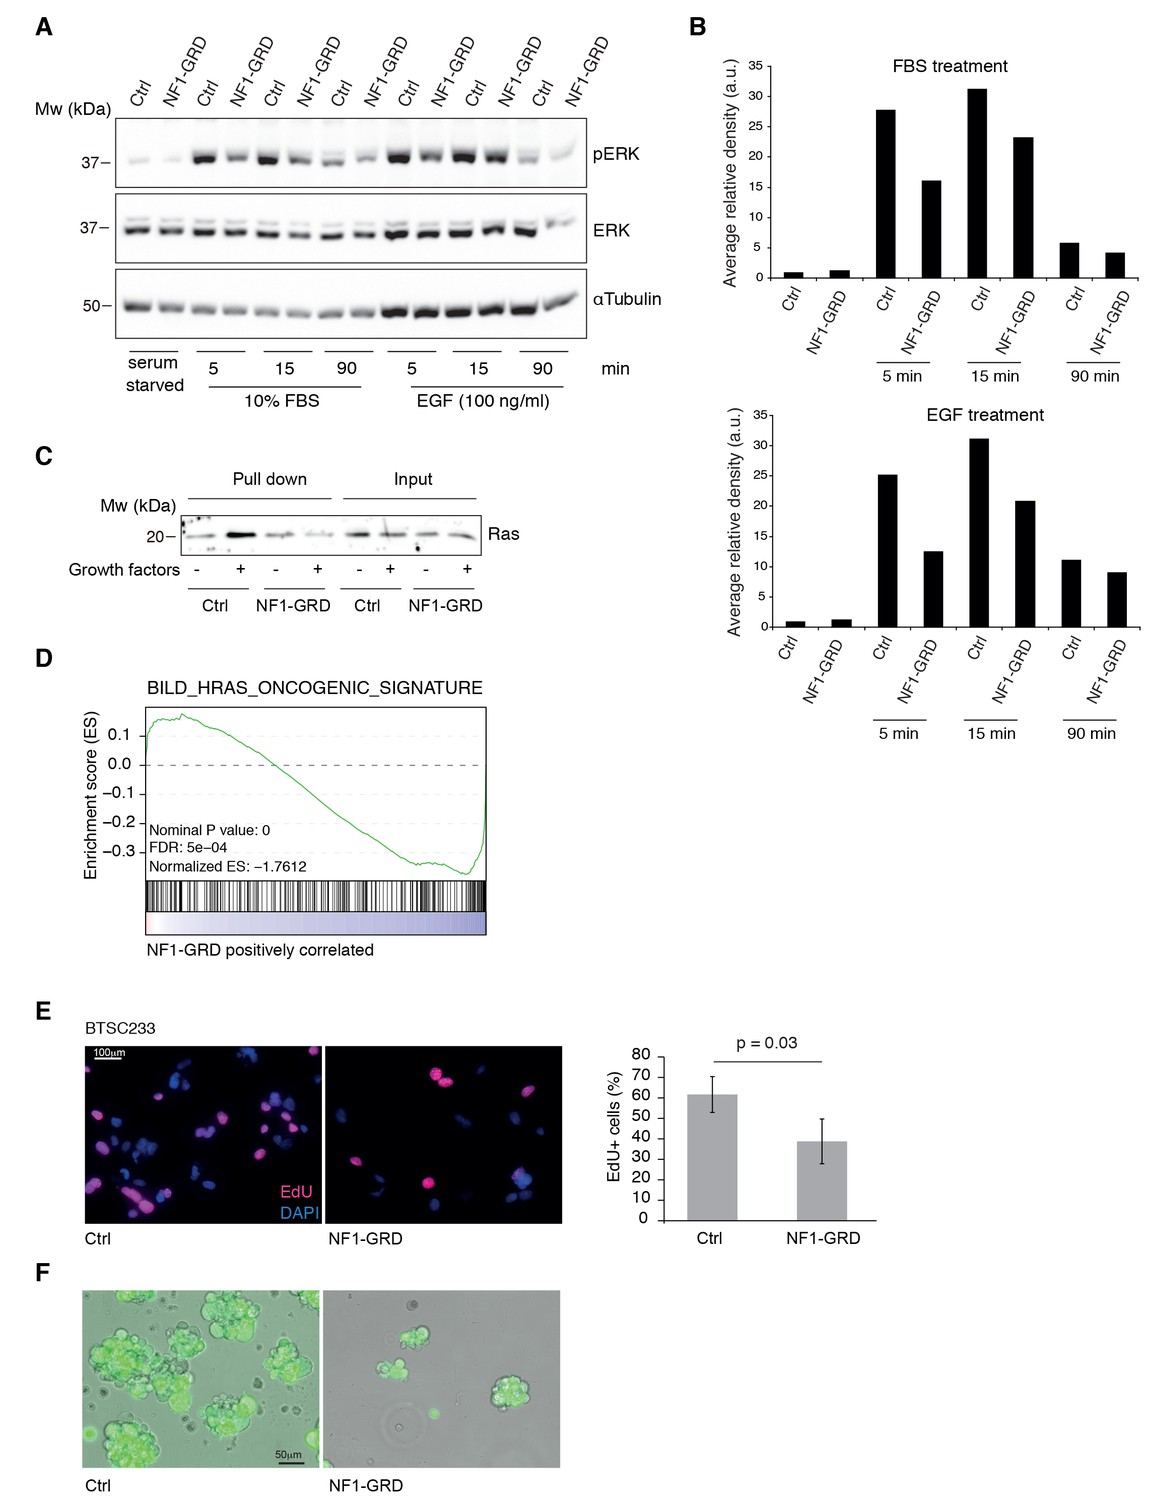
NF1-GRD expression leads to downregulation of RAS signaling.
(A) Western blot analysis of ERK and pERK expression in BTSC 233 cells transduced with NF1-GRD expressing lentivirus and stimulated with 10% FBS or 100 ng/ml EGF. α-Tubulin is included as loading control. (B) Densitometric analysis of western blot in (A). (C) Western blot analysis of active Ras pull-down assay in BTSC 233 expressing NF1-GRD or control in the presence or absence of growth factors. (D) Gene set enrichment analysis (GSEA) of Ras-induced oncogenic signature in BTSC 233 cells transduced with NF1-GRD expressing lentivirus versus Ctrl. (E) EdU staining of BTSC 233 cell line upon NF1-GRD overexpression, counterstained with DAPI. Quantification of the fluorescence intensity of EdU staining is shown in the right panel. Ctrl, n = 4; NF1-GRD, n = 4. (F) Micrographs showing representative BTSC 233 Ctrl and NF1-GRD grown for 2 weeks after cell transduction.
-
Figure 2—figure supplement 1—source data 1
Source data of Figure 2—figure supplement 1A.
- https://cdn.elifesciences.org/articles/64846/elife-64846-fig2-figsupp1-data1-v1.ai
-
Figure 2—figure supplement 1—source data 2
Source data of Figure 2—figure supplement 1C.
- https://cdn.elifesciences.org/articles/64846/elife-64846-fig2-figsupp1-data2-v1.ai
Figure 2—figure supplement 2
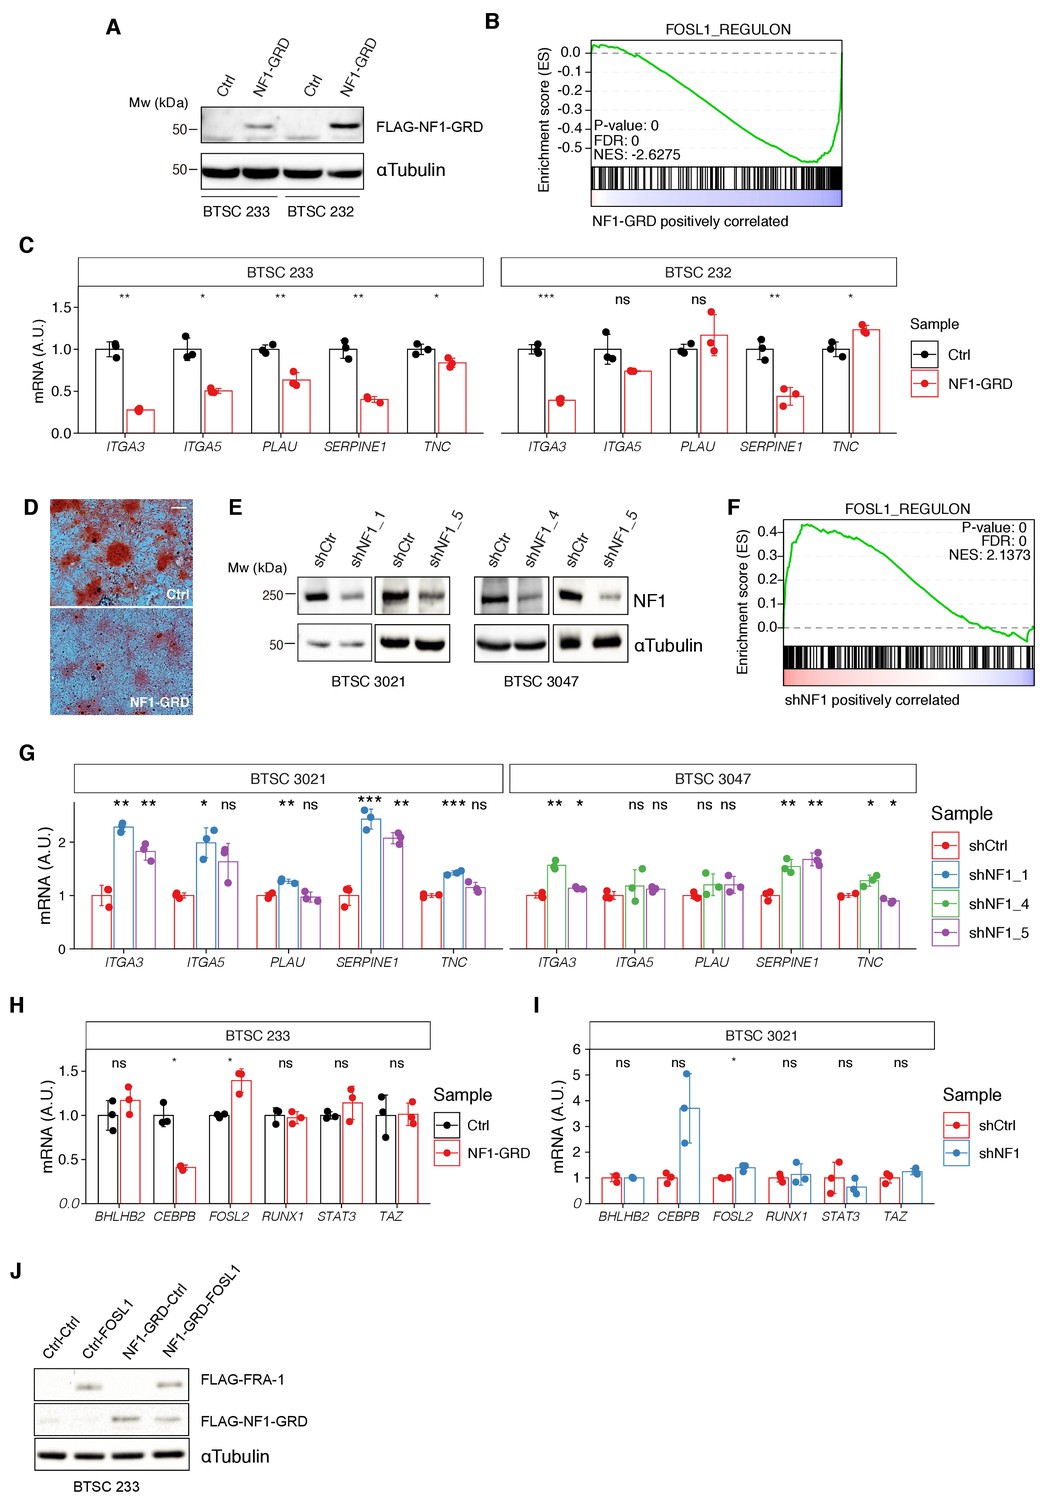
Modulation of NF1 expression regulates FOSL1 targets and mesenchymal genes.
(A) Western blot analysis of FLAG-NF1-GRD expression in mesenchymal (MES) cells (BTSC 233 and 232). (B) Gene set enrichment analysis (GSEA) of FOSL1 targets signature in BTSC 233 cells transduced with NF1-GRD or Ctrl vector. (C) qRT-PCR analysis of mesenchymal FOSL1 targets (ITGA3, ITGA5, PLAU, SERPINE1, and TNC) in BTSC 233 and 232 cells transduced with NF1-GRD expressing lentivirus. Data are normalized to 18S rRNA expression. (D) Osteogenesis differentiation assay of BTSC 233 transduced as indicated above. Alzarin Red staining indicates osteogenesis differentiation. Scale bar represents 200 µm. (E) Western blot analysis of NF1 expression upon NF1 knockdown in non-MES cells (BTSC 3021 and 3047). (F) GSEA of FOSL1 targets signature in BTSC 3021 cells transduced with shNF1 or shCtrl. (G) qRT-PCR analysis of mesenchymal FOSL1 targets BTSC 3021 and 3047 cells transduced with shNF1 expressing lentiviruses. Data are normalized to 18S rRNA expression. (H, I) qRT-PCR analysis of MES genes master regulators expression (BHLHB2, CEBPB, FOSL2, RUNX1, STAT3, and TAZ) upon NF1-GRD overexpression in BTSC 233 (H) or NF1 knockdown in BTSC 3021 cells (I). Data are normalized to GAPDH or 18S rRNA expression, respectively. (J) Western blot analysis of FLAG-NF1-GRD and FLAG-FRA-1 expression in BTSC 233 cells. qRT-PCR data in (C), (G), (H), and (I) are presented as mean ± SD (n = 3, technical replicates); Student’s t test, ns = not-significant, *p≤0.05, **p≤0.01, ***p≤0.001.
-
Figure 2—figure supplement 2—source data 1
Source data of Figure 2—figure supplement 2A.
- https://cdn.elifesciences.org/articles/64846/elife-64846-fig2-figsupp2-data1-v1.ai
-
Figure 2—figure supplement 2—source data 2
Source data of Figure 2—figure supplement 2E.
- https://cdn.elifesciences.org/articles/64846/elife-64846-fig2-figsupp2-data2-v1.ai
-
Figure 2—figure supplement 2—source data 3
Source data of Figure 2—figure supplement 2J.
- https://cdn.elifesciences.org/articles/64846/elife-64846-fig2-figsupp2-data3-v1.ai
-
Figure 2—figure supplement 2—source data 4
Source data of Figure 2—figure supplement 2C, G–I.
- https://cdn.elifesciences.org/articles/64846/elife-64846-fig2-figsupp2-data4-v1.xlsx
Figure 2—figure supplement 3
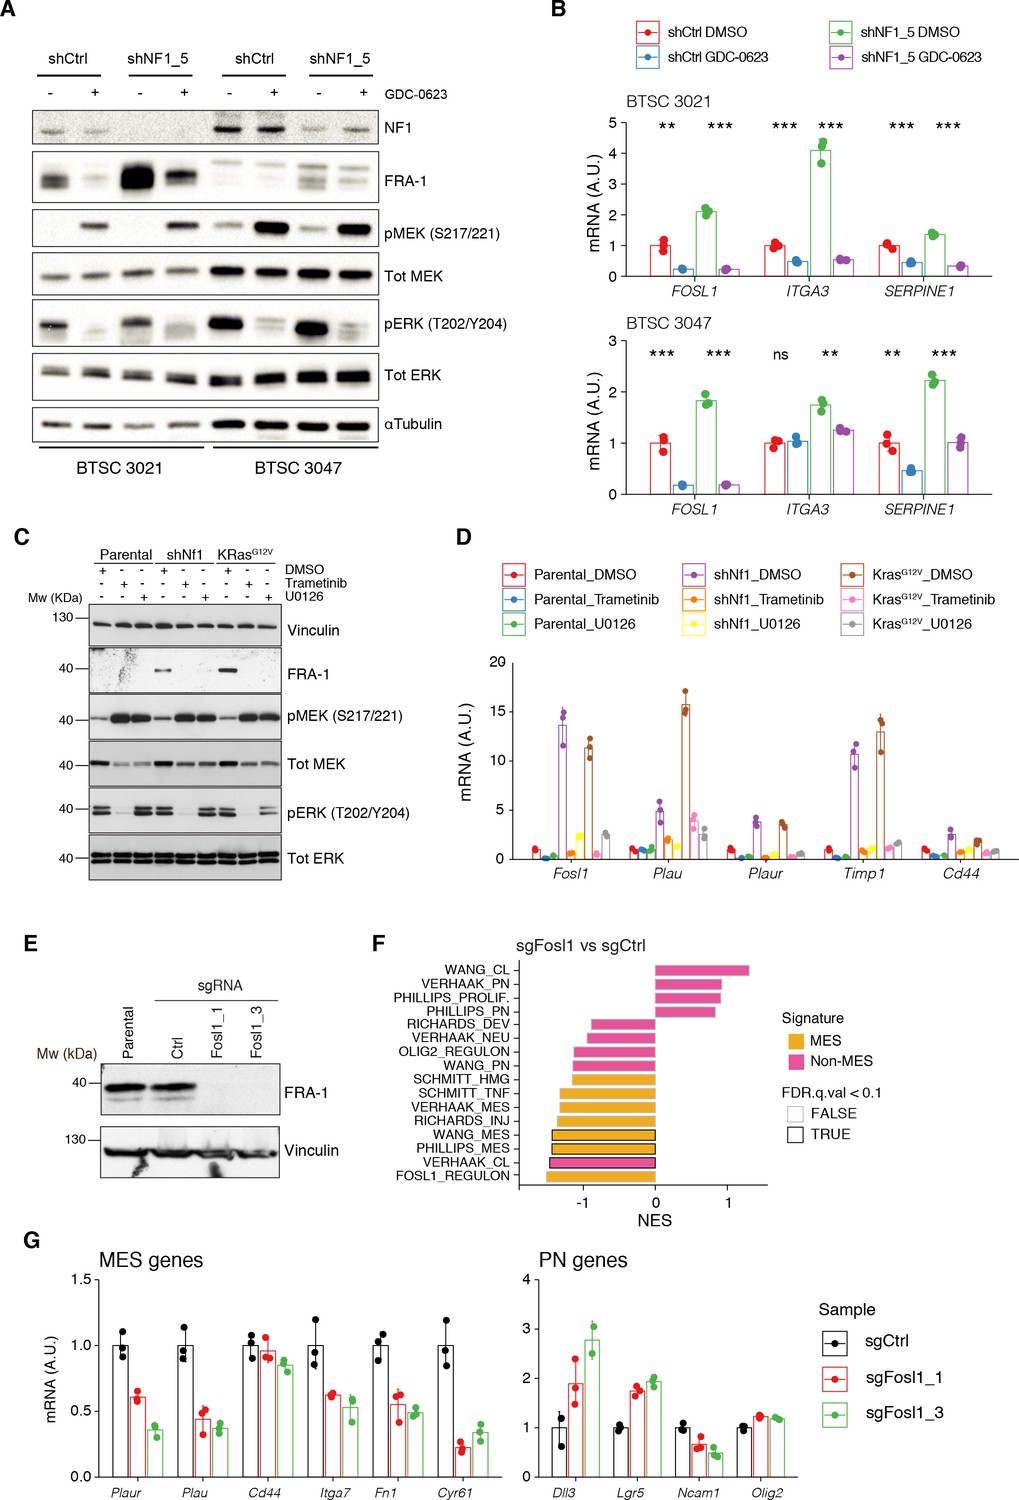
MAPK inhibition reverts the effects of NF1 silencing on FOSL1 and mesenchymal genes expression.
(A) Western blot analysis of non-mesenchymal (non-MES) cells (BTSC 3021 and 3047) transduced with shCtrl or shNF1_5 and treated with the MEK inhibitor GDC-0623 (1 μM for 16 hr); α-tubulin was used as loading control. (B) qRT-PCR analysis of FOSL1 and the MES genes ITGA3 and SERPINE1 in samples treated as in (A). Data are presented as mean ± SD (n = 3), normalized to 18S rRNA expression; Student’s t test of DMSO vs. GDC-0623 (either shCtrl or shNF1_5), **p≤0.01, ***p≤0.001, ns = not significant. (C) Western blot analysis using the specified antibodies of p53-null NSCs, parental and infected with shNf1 or KrasG12V and treated for 16 hr with the MAPK inhibitors trametinib (200 nM) or U0126 (10 μM); vinculin was used as loading control. (D) qRT-PCR analysis of Fosl1 and the MES genes (Plau, Plaur, Timp1, and Cd44), in samples treated as in (C). Data are presented as mean ± SD (n = 3, technical replicates), normalized to Actin expression. (E) FRA-1 expression detected by western blot in p53-null shNf1 NSCs upon transduction with sgRNAs targeting Fosl1; vinculin was used as loading control. (F) Gene set enrichment analysis (GSEA) results of p53-null shNf1 NSCs sgFosl1_1 and sgFosl1_3 versus sgCtrl neural stem cells (NSCs); n = 3 for each group. (G) mRNA expression of MES (left panel) and PN genes (right panel) in sgCtrl and sgFosl1 in p53-null shNf1 NSCs. Data from a representative of two experiments are presented as mean ± SD (n = 3, technical replicates), normalized to Gapdh expression.
-
Figure 2—figure supplement 3—source data 1
Source data of Figure 2—figure supplement 3A.
- https://cdn.elifesciences.org/articles/64846/elife-64846-fig2-figsupp3-data1-v1.ai
-
Figure 2—figure supplement 3—source data 2
Source data of Figure 2—figure supplement 3C.
- https://cdn.elifesciences.org/articles/64846/elife-64846-fig2-figsupp3-data2-v1.ai
-
Figure 2—figure supplement 3—source data 3
Source data of Figure 2—figure supplement 3E.
- https://cdn.elifesciences.org/articles/64846/elife-64846-fig2-figsupp3-data3-v1.ai
-
Figure 2—figure supplement 3—source data 4
Source data of Figure 2—figure supplement 3B, D, F, and G.
- https://cdn.elifesciences.org/articles/64846/elife-64846-fig2-figsupp3-data4-v1.xlsx
Figure 3
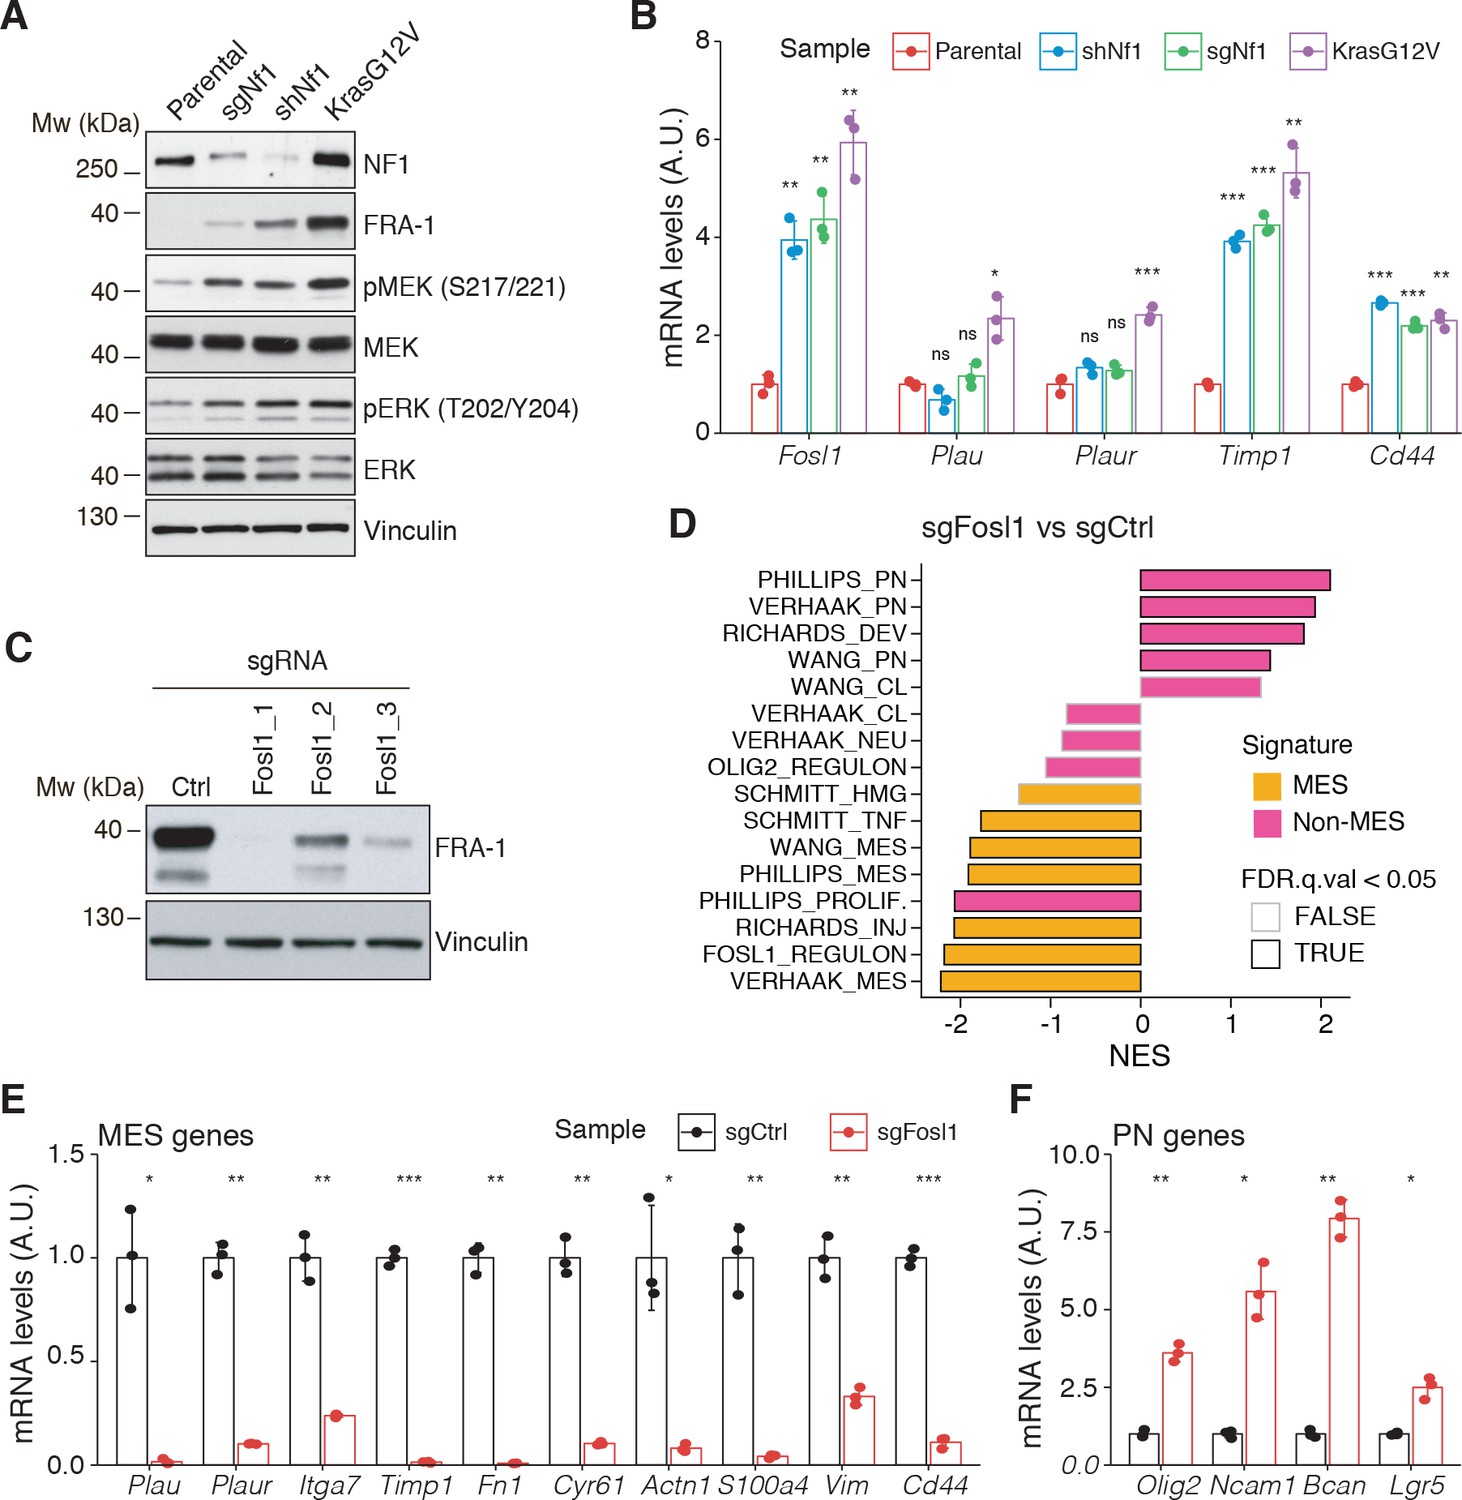
Fosl1 is induced by MAPK kinase activation and is required for mesenchymal (MES) gene expression.
(A) Western blot analysis using the specified antibodies of p53-null neural stem cells (NSCs), parental and infected with sgNf1, shNf1, and KrasG12V; vinculin was used as loading control. (B) mRNA expression of Fosl1 and MES genes (Plau, Plaur, Timp1, and Cd44) in infected p53-null NSCs compared to parental cells (not infected). Data from a representative of two experiments are presented as mean ± SD (n = 3), normalized to Gapdh expression. Student’s t test, relative to parental cells: ns = not significant, *p≤0.05, **p≤0.01, ***p≤0.001. (C) FRA-1 expression detected by western blot in p53-null KrasG12V NSCs upon transduction with sgRNAs targeting Fosl1, after selection with 1 µg/mL puromycin; vinculin was used as loading control. (D) Gene set enrichment analysis (GSEA) results of p53-null KrasG12V sgFosl1_1 versus sgCtrl NSCs. (E, F) mRNA expression of MES (E) and PN genes (F) in sgCtrl and sgFosl1_1 p53-null KrasG12V NSCs. Data from a representative of two experiments are presented as mean ± SD (n = 3, technical replicates), normalized to Gapdh expression. Student’s t test, relative to sgCtrl: *p≤0.05; **p≤0.01; ***p≤0.001.
-
Figure 3—source data 1
Source data of Figure 3A.
- https://cdn.elifesciences.org/articles/64846/elife-64846-fig3-data1-v1.ai
-
Figure 3—source data 2
Source data of Figure 3C.
- https://cdn.elifesciences.org/articles/64846/elife-64846-fig3-data2-v1.ai
-
Figure 3—source data 3
Source data of Figure 3B, D–F.
- https://cdn.elifesciences.org/articles/64846/elife-64846-fig3-data3-v1.xlsx
Figure 4

Fosl1 depletion affects the chromatin accessibility of mesenchymal (MES) transcription program and differentiation genes in mouse glioma-initiating cells.
(A) Correlation heatmap of the ATAC-seq samples. Clustering of the Fosl1-WT (sgCtrl, n = 4) and Fosl1-depleted (sgFosl1_1 and sgFosl1_3, n = 8) samples is based upon the bias corrected deviations in chromatin accessibility (see Materials and methods). (B) tSNE visualization of cellular similarity between Fosl1-depleted and control cells based on chromatin accessibility. Samples are color-coded according to the cell type (black, red, and green for sgCtrl, sgFosl1_1, and sgFosl1_3 cells, respectively), or by directional z-scores. (C) Volcano plot illustrating the mean difference in bias-corrected accessibility deviations between Fosl1-deficient and control cells against the FDR-corrected p-value for that difference. The top differential motifs are highlighted in violet and red, indicating decreased and increased accessibility, respectively. (D, E) Top enriched Gene Ontology (GO) biological processes pathways for the regions with decreased (D) and increased (E) chromatin accessibility upon Fosl1 loss. The nodes represent the functional categories from the respective databases, color-coded by the significance of enrichment (FDR < 0.05). The node size indicates the number of query genes represented among the ontology term, and the edges highlight the relative relationships among these categories. (F, G) Density plots showing the distributions of the log2 fold-changes in chromatin accessibility of the indicated probes, as measured with limma by comparing Fosl1-KO versus control cells. (H) Representative ATAC-seq tracks of two technical replicates for the MES Bnc2 and non-MES Sox11 markers loci. Tracks are color-coded as in panels (A) and (B).
-
Figure 4—source data 1
Source data of Figure 4A, C–G.
- https://cdn.elifesciences.org/articles/64846/elife-64846-fig4-data1-v1.xlsx
Figure 5 with 1 supplement

Fosl1 knock-out (KO) impairs cell growth and stemness in vitro and increases survival in a orthotopic glioma model.
(A) Cell viability of control and Fosl1 KO p53-null KrasG12V neural stem cells (NSCs) measured by MTT assay; absorbance values were normalized to day 1. Data from a representative of three independent experiments are presented as mean ± SD (n = 10, technical replicates). Two-way ANOVA, relative to sgCtrl for both sgFosl1_1 and sgFosl1_3: ***p≤0.001. (B) Quantification of cell cycle populations of control and Fosl1 KO p53-null KrasG12V NSCs by flow cytometry analysis of PI staining. Data from a representative of two independent experiments are presented as mean ± SD (n = 3, technical replicates). Student’s t test, relative to sgCtrl: *p≤0.05; **p≤0.01; ***p≤0.001. (C) Representative limiting dilution experiment on p53-null KrasG12V sgCtrl and sgFosl1_1 NSCs, calculated with extreme limiting dilution assay (ELDA) analysis; bar plot inlet shows the estimated stem cell frequency with the confidence interval; chi-square p<0.0001. (D) Heatmap of expression of stem cell (yellow) and lineage-specific (neuronal – purple, astrocytic – green, and oligodendrocytic – orange) genes, comparing sgCtrl and sgFosl1_1 p53-null KrasG12V NSCs. Two biological replicates are shown. (E) Quantification of pixel area (fold-change relative to sgCtrl) of CD44, GFAP, and OLIG2 relative to DAPI pixel area per field of view in control and Fosl1 KO p53-null KrasG12V NSCs. Data from a representative of two independent experiments; Student’s t test, relative to sgCtrl: ***p≤0.001. (F) Kaplan–Meier survival curves of nu/nu mice injected with p53-null KrasG12V sgCtrl (n = 9) and sgFosl1_1 (n = 6) NSCs. Log-rank p=0.0263. (G) Western blot analysis using the indicated antibodies of four sgCtrl and four sgFosl1_1 tumors (showing low or no detectable expression of FRA-1); vinculin was used as loading control. (H) Representative images of IHCs using the indicated antibodies. Scale bars represent 100 µm. (I) mRNA expression of MES genes in the samples sgCtrl–T4 (higher FRA-1 expression) and sgFosl1_1–T3 and –T4 (no detectable FRA-1 expression). (J) mRNA expression of PN genes in samples as in (H). Data from a representative of two experiments are presented as mean ± SD (n = 3, technical replicates), normalized to Gapdh expression. Student’s t test for sgFosl1_1 tumors, relative to sgCtrl–T4: ns = not significant, *p≤0.05, **p≤0.01, ***p≤0.001.
-
Figure 5—source data 1
Source data of Figure 5G.
- https://cdn.elifesciences.org/articles/64846/elife-64846-fig5-data1-v1.ai
-
Figure 5—source data 2
Source data of Figure 5A–C, E, F, I, J.
- https://cdn.elifesciences.org/articles/64846/elife-64846-fig5-data2-v1.xlsx
Figure 5—figure supplement 1

Fosl1 loss is associated with the reduction of proliferative genes and increase in differentiation genes.
(A) Heatmap showing a reduction in expression of cell cycle regulators in sgFosl1_1 as compared to sgCtrl p53-null KrasG12V neural stem cells (NSCs). (B) Representative images of immunofluorescence staining of the indicated markers in sgCtrl and sgFosl1_1 p53-null KrasG12V NSCs plated on laminin-coated coverslips. Scale bars represent 50 µm.
Figure 6 with 1 supplement
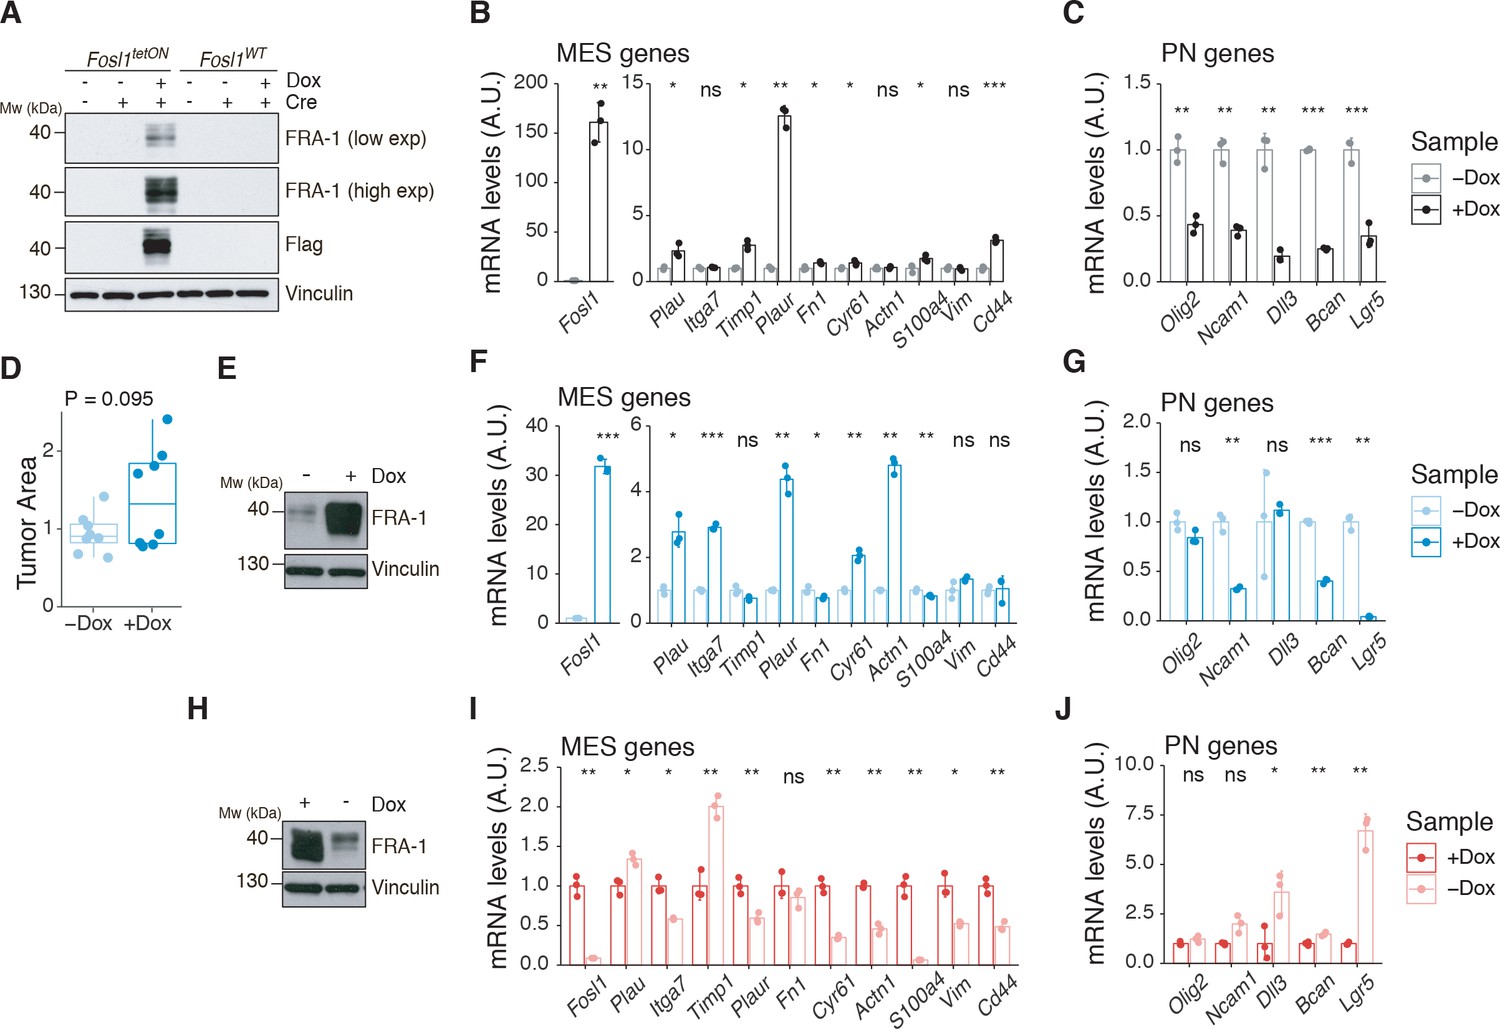
Fosl1 overexpression upregulates the MES gene signature (MGS) and induces larger tumors in vivo.
(A) Western blot analysis of FRA-1 and Flag expression on Fosl1tetON and Fosl1WT neural stem cells (NSCs) derived from KrasLSLG12V; Trp53lox; ROSA26LSLrtTA-IRES-EGFP; Col1a1TetO-Fosl1 mice upon in vitro infection with Cre and induction of Fosl1 overexpression with 1 µg/mL doxycycline (Dox) for 72 hr; vinculin was used as loading control. (B) mRNA expression of Fosl1 and mesenchymal (MES) genes in Fosl1tetON p53-null KrasG12V cells upon 72 hr induction with 1 µg/mL Dox. (C) mRNA expression of PN genes in Fosl1tetON p53-null KrasG12V cells upon 72 hr induction with 1 µg/mL Dox. (D) Quantification of tumor area (µm2) of –Dox and +Dox tumors (n = 8/8). For each mouse, the brain section on the hematoxylin and eosin (H&E) slide with a larger tumor was considered and quantified using the ZEN software (Zeiss). (E) Western blot detection of FRA-1 expression in tumorspheres derived from a control (−Dox) tumor. Tumorspheres were isolated and kept without Dox until first passage, when 1 µg/mL Dox was added and kept for 19 days (+Dox in vitro). (F) mRNA expression of Fosl1 and MES genes in tumorspheres in the absence or presence of Dox for 19 days. (G) mRNA expression of PN genes in tumorspheres in the absence or presence of Dox for 19 days. (H) Western blot detection of FRA-1 expression in tumorspheres derived from a Fosl1 overexpressing (+Dox) tumor. Tumorspheres were isolated and kept with 1 µg/mL Dox until first passage, when Dox was removed for 19 days (−Dox in vitro). (I) mRNA expression of Fosl1 and MES genes in tumorspheres in the presence or absence of Dox for 19 days. (J) mRNA expression of PN genes in tumorspheres in the presence or absence of Dox for 19 days. qRT-PCR data from a representative of two experiments are presented as mean ± SD (n = 3, technical replicates), normalized to Gapdh expression. Student’s t test, relative to the respective control (−Dox in B, C, F, and G; +Dox in I and J): ns = not significant, *p≤0.05, **p≤0.01, ***p≤0.001.
-
Figure 6—source data 1
Source data of Figure 6A.
- https://cdn.elifesciences.org/articles/64846/elife-64846-fig6-data1-v1.ai
-
Figure 6—source data 2
Source data of Figure 6E.
- https://cdn.elifesciences.org/articles/64846/elife-64846-fig6-data2-v1.ai
-
Figure 6—source data 3
Source data of Figure 6H.
- https://cdn.elifesciences.org/articles/64846/elife-64846-fig6-data3-v1.ai
-
Figure 6—source data 4
Source data of Figure 6B–D, F, G, I,J.
- https://cdn.elifesciences.org/articles/64846/elife-64846-fig6-data4-v1.xlsx
Figure 6—figure supplement 1
Characterization of Fosl1 overexpressing mouse tumors.
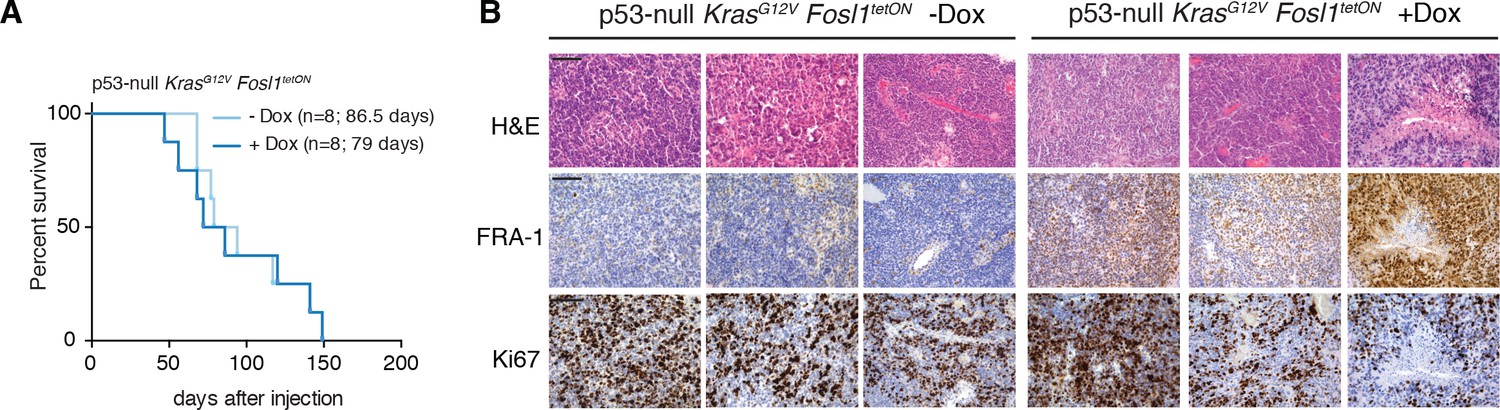
(A) Kaplan–Meier survival curves of C57BL/6J wildtype mice injected with p53-null KrasG12V Fosl1tetON neural stem cells (NSCs) subjected to doxycycline (Dox) diet (n = 8) or kept as controls (n = 8); log-rank p-value=0.814. (B) Hematoxylin and eosin (H&E) and immunohistochemical staining, using the indicated antibodies, of representative –Dox and +Dox tumors. Scale bars represent 100 µm.
-
Figure 6—figure supplement 1—source data 1
Source data of Figure 6—figure supplement 1A.
- https://cdn.elifesciences.org/articles/64846/elife-64846-fig6-figsupp1-data1-v1.xlsx
Figure 7 with 1 supplement
FOSL1 contributes to mesenchymal (MES) genes activation, cell growth, and stemness in MES brain tumor stem cells (BTSCs).
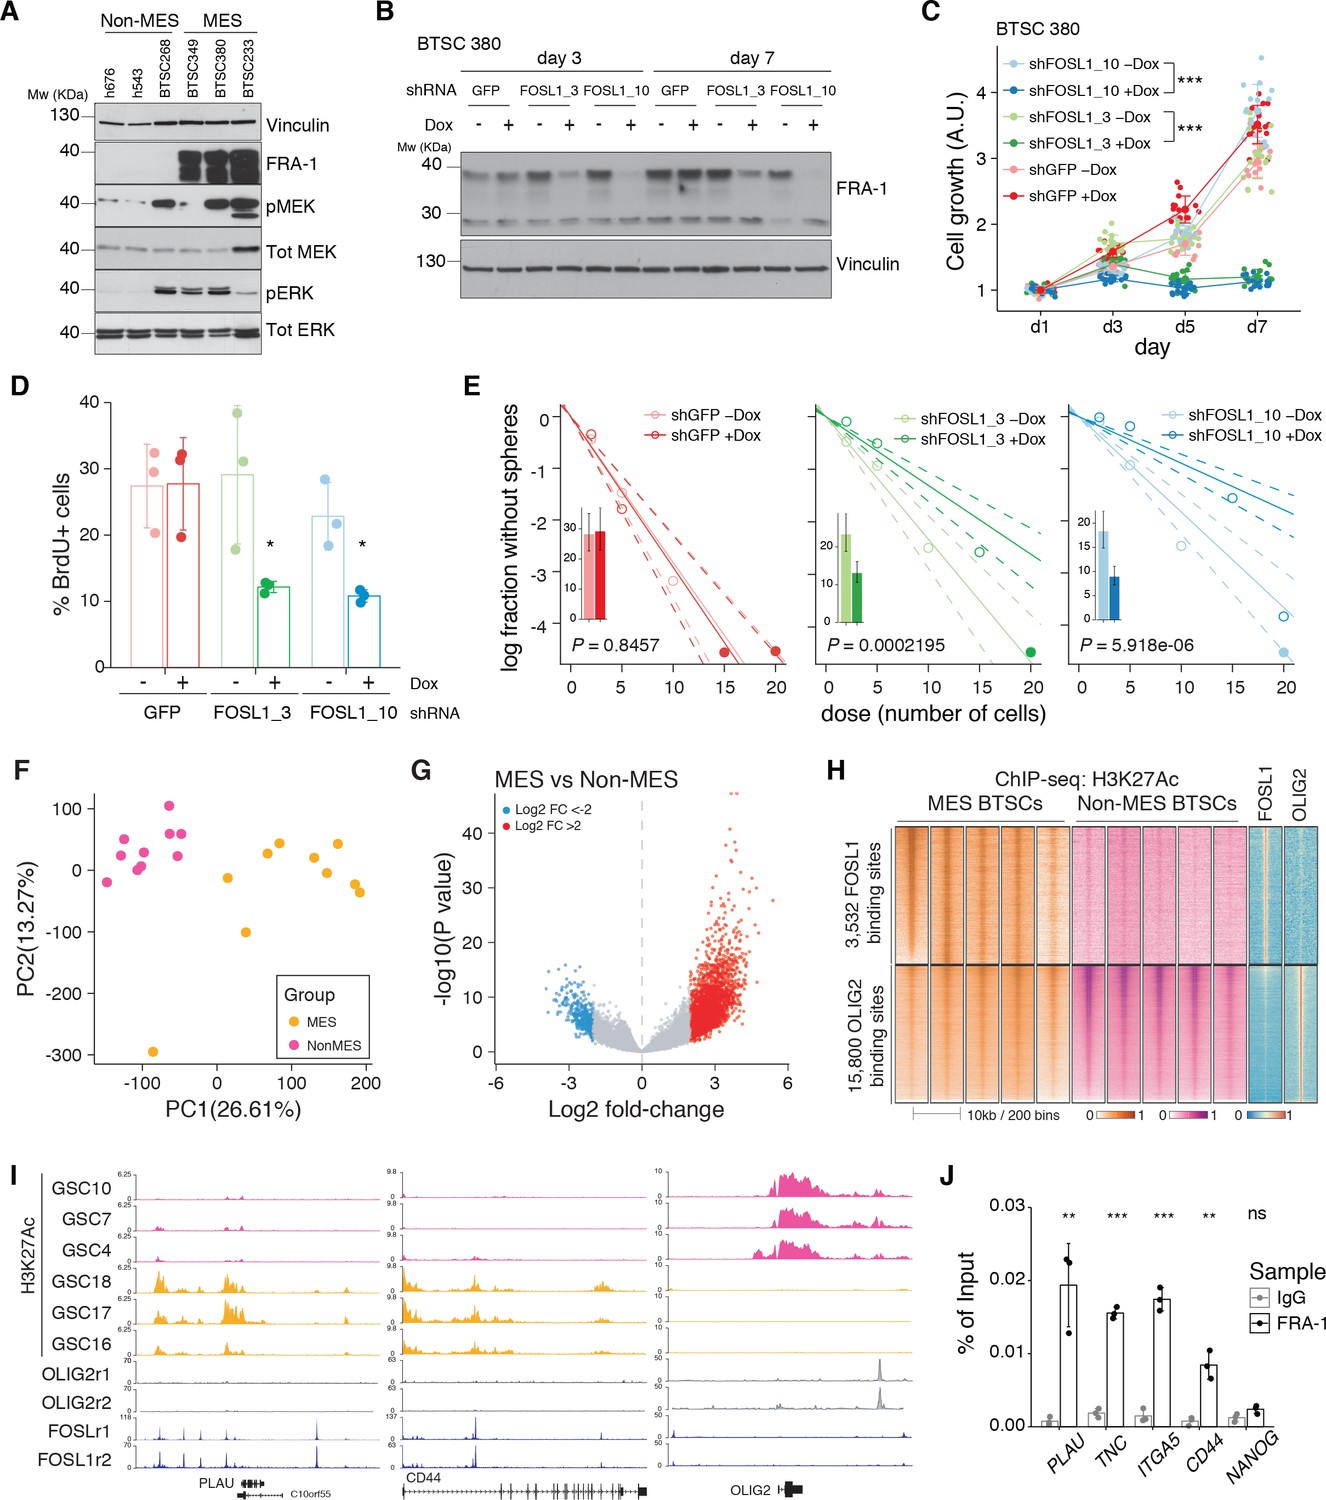
(A) Western blot analysis using the specified antibodies of human BTSC lines, characterized as non-MES (left) and MES (right). (B) Western blot detection of FRA-1 in MES BTSC 380 upon transduction with inducible shRNAs targeting GFP (control) and FOSL1, analyzed after 3 and 7 days of doxycycline (Dox) treatment; vinculin was used as loading control. (C) Cell growth of BTSC 380 shGFP and shFOSL1, in the absence or presence of Dox, measured by MTT assay; absorbance values were normalized to day 1. Data from a representative of three independent experiments are presented as mean ± SD (n = 15, technical replicates). Two-way ANOVA, –Dox vs. +Dox: ***p≤0.001. (D) BrdU of BTSC 380 shGFP and shFOSL1, in the absence or presence of Dox, analyzed by flow cytometry. Data from a representative of two independent experiments are presented as mean ± SD (n = 3, technical replicates). Student’s t test, relative to the respective control (–Dox): *p≤0.05. (E) Representative limiting dilution analysis on BTSC380 for shGFP and shFOSL1, in the presence or absence of Dox, calculated with extreme limiting dilution assay (ELDA) analysis; bar plot inlets show the estimated stem cell frequency with the confidence interval; chi-square p-values are indicated. (F) Principal component analysis of H3K27Ac signal over FOSL1/FRA-1 binding sites, calculated using MACS on ENCODE samples (see Materials and methods), in non-MES (n = 10) and MES BTSC (n = 10) (from Mack et al., 2019). (G) Volcano plot illustrating the log2 fold-change differences in H3K27Ac signal between non-MES and MES BTSCs against the p-value for that difference. Blue and red probes represent statistically significant differences (FDR < 0.005) in H3K27Ac signal between non-MES and MES BTSCs. (H) Heatmap of ChIP-seq enrichment of FOSL1/FRA-1 or OLIG2 binding sites for the indicated profiles. (I) View of the PLAU, CD44, and OLIG2 loci of selected profiles. (J) Representative ChIP experiment in BTSC 349 cells. The panel shows FRA-1 binding to the promoter of a subset of MES targets (n = 3, technical replicates) expressed as a percentage of the initial DNA amount in the immune-precipitated fraction. NANOG gene was used as a negative control. Student’s t test, relative to IgG: ns = not significant, **p≤0.01, ***p≤0.001.
-
Figure 7—source data 1
Source data of Figure 7A.
- https://cdn.elifesciences.org/articles/64846/elife-64846-fig7-data1-v1.ai
-
Figure 7—source data 2
Source data of Figure 7B.
- https://cdn.elifesciences.org/articles/64846/elife-64846-fig7-data2-v1.ai
-
Figure 7—source data 3
Source data of Figure 7C–G, J.
- https://cdn.elifesciences.org/articles/64846/elife-64846-fig7-data3-v1.xlsx
Figure 7—figure supplement 1
Further characterization of FOSL1 role in human brain tumor stem cells (BTSCs).
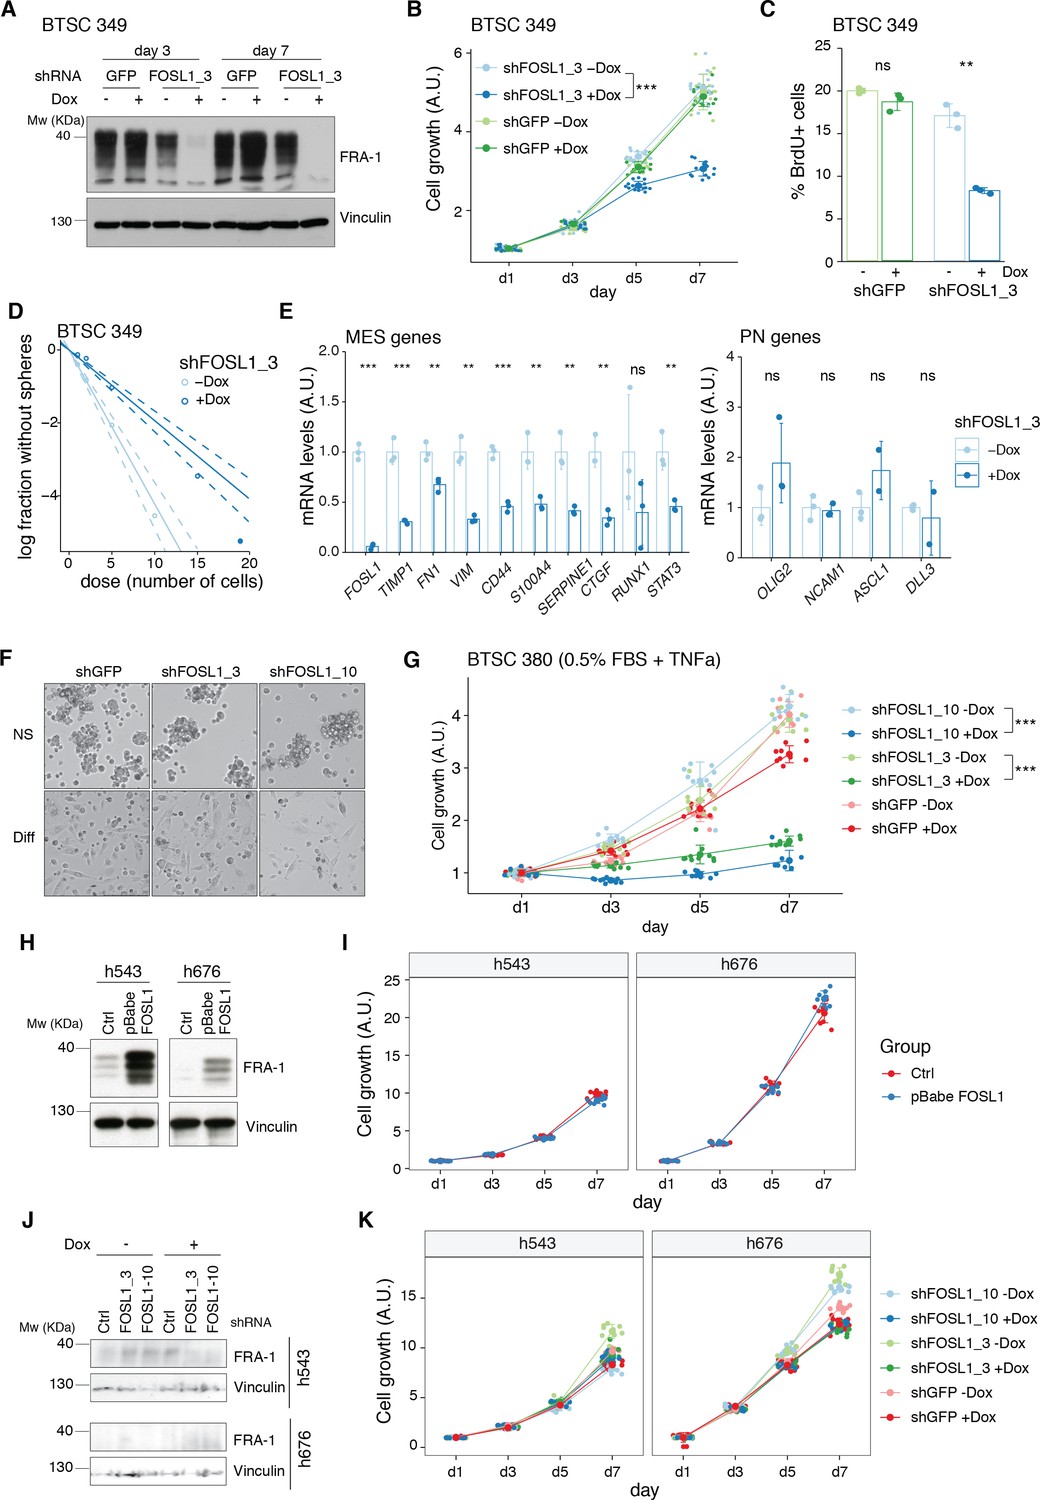
(A) Western blot detection of FRA-1 in BTSC 349 upon transduction with inducible shGFP (control) or shFOSL1_3, analyzed after 3 and 7 days of doxycycline (Dox) treatment; vinculin was used as loading control. (B) Cell growth of BTSC 349 shGFP and shFOSL1_3 cells, in the absence or presence of Dox, measured by MTT assay; absorbance values were normalized to day 1. Data from a representative of three independent experiments are presented as mean ± SD (n = 15, technical replicates). Student’s t test on day 7, relative to shFOSL1_3 –Dox: ***p≤0.001. (C) BrdU incorporation of BTSC 349 shGFP and shFOSL1_3, in the absence or presence of Dox, analyzed by flow cytometry. Data from a representative of two independent experiments are presented as mean ± SD (n = 3). Student’s t test, relative to the respective control (–Dox): ns = not significant, **p≤0.01. (D) Representative limiting dilution analysis on BTSC 349 shFOSL1_3 in the presence or absence of Dox, calculated with extreme limiting dilution assay (ELDA) analysis; p<0.0001. (E) mRNA expression of FOSL1, MES, and PN genes in BTSC 349 shFOSL1_3 cells in the absence or presence of Dox for 3 days. Data from a representative of three experiments are presented as mean ± SD (n = 3, technical replicates), normalized to GAPDH expression. Student’s t test, relative to –Dox: ns = not significant, *p≤0.05, **p≤0.01, ***p≤0.001. (F) Representative images of BTSC 380 grown in either neurosphere medium (NS) or in differentiation conditions (NS + 0.5% FBS + TNFalpha 5 ng/mL) for 5 days. Scale bar = 250 μm. (G) Cell growth of BTSC 380 grown in differentiation conditions, in the absence or presence of Dox, measured by MTT assay; absorbance values were normalized to day 1. Data from a representative of two independent experiments are presented as mean ± SD (n = 10, technical replicates). (H) Western blot detection of FRA-1 in h543 and h676 upon transduction with pBabe (control) or pBabe-FOSL1; vinculin was used as loading control. (I) Cell growth of cells as in (H), measured by MTT assay; absorbance values were normalized to day 1. Data from a representative of three independent experiments are presented as mean ± SD. (J) Western blot detection of FRA-1 in h543 and h676 upon transduction with the indicated shRNA. To note that FRA-1 is barely detectable in h676 cells (see also panel H and Figure 1A). (K) Cell growth of cells as in (J), measured by MTT assay; absorbance values were normalized to day 1. Data from a representative of two independent experiments are presented as mean ± SD (n = 10, technical replicates).
-
Figure 7—figure supplement 1—source data 1
Source data of Figure 7—figure supplement 1A.
- https://cdn.elifesciences.org/articles/64846/elife-64846-fig7-figsupp1-data1-v1.ai
-
Figure 7—figure supplement 1—source data 2
Source data of Figure 7—figure supplement 1H.
- https://cdn.elifesciences.org/articles/64846/elife-64846-fig7-figsupp1-data2-v1.ai
-
Figure 7—figure supplement 1—source data 3
Source data of Figure 7—figure supplement 1J.
- https://cdn.elifesciences.org/articles/64846/elife-64846-fig7-figsupp1-data3-v1.ai
-
Figure 7—figure supplement 1—source data 4
Source data of Figure 7—figure supplement 1B–E, G, I, K.
- https://cdn.elifesciences.org/articles/64846/elife-64846-fig7-figsupp1-data4-v1.xlsx
Figure 8 with 1 supplement
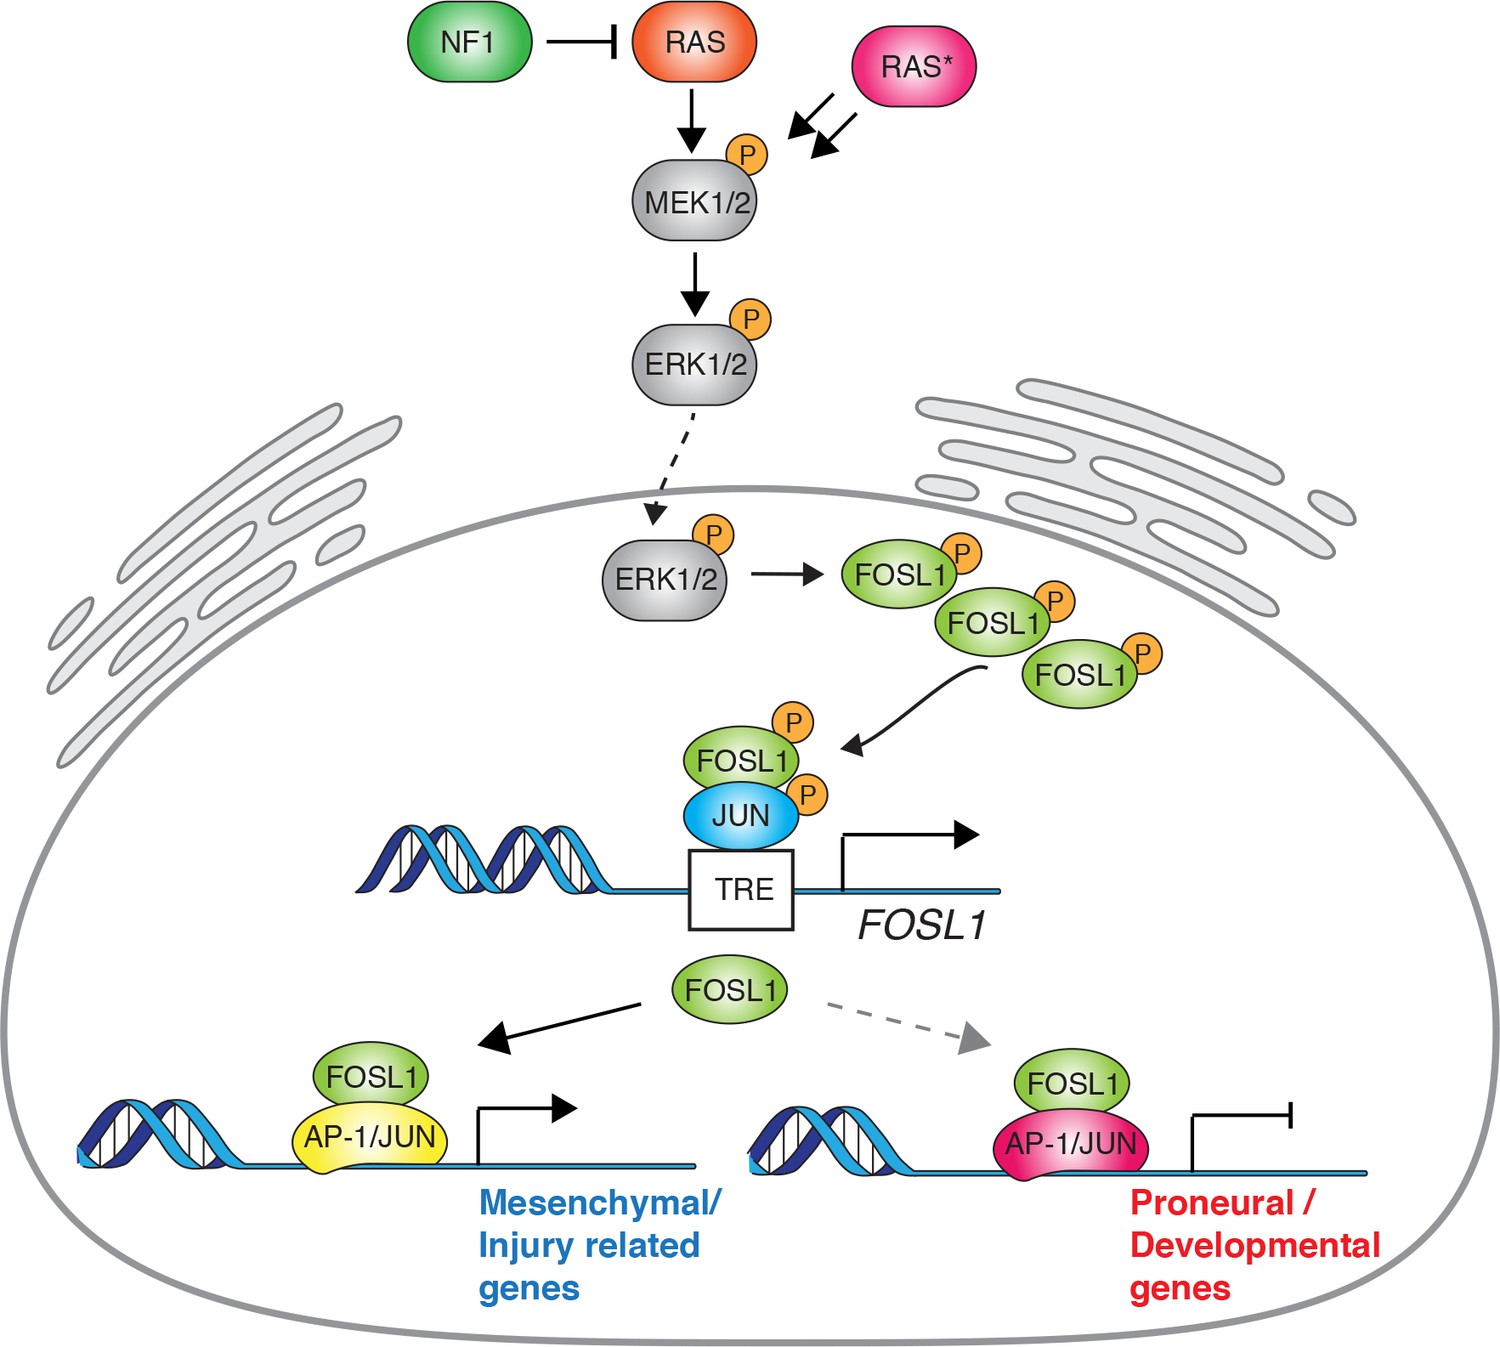
Schematic model of NF1-MAPK-FOSL1 axis in mesenchymal (MES) gliomas.
NF1 alterations or RAS mutations lead to the activation of the MAPK signaling that in turn increases FOSL1 expression both at the mRNA and protein levels. FOSL1 then activates the expression of the MES gene signature and possibly inhibits the non-MES gene signature. The scheme integrates data presented in this work as well as previously published literature on the regulation of FOSL1 expression by MAPK activation.
Figure 8—figure supplement 1
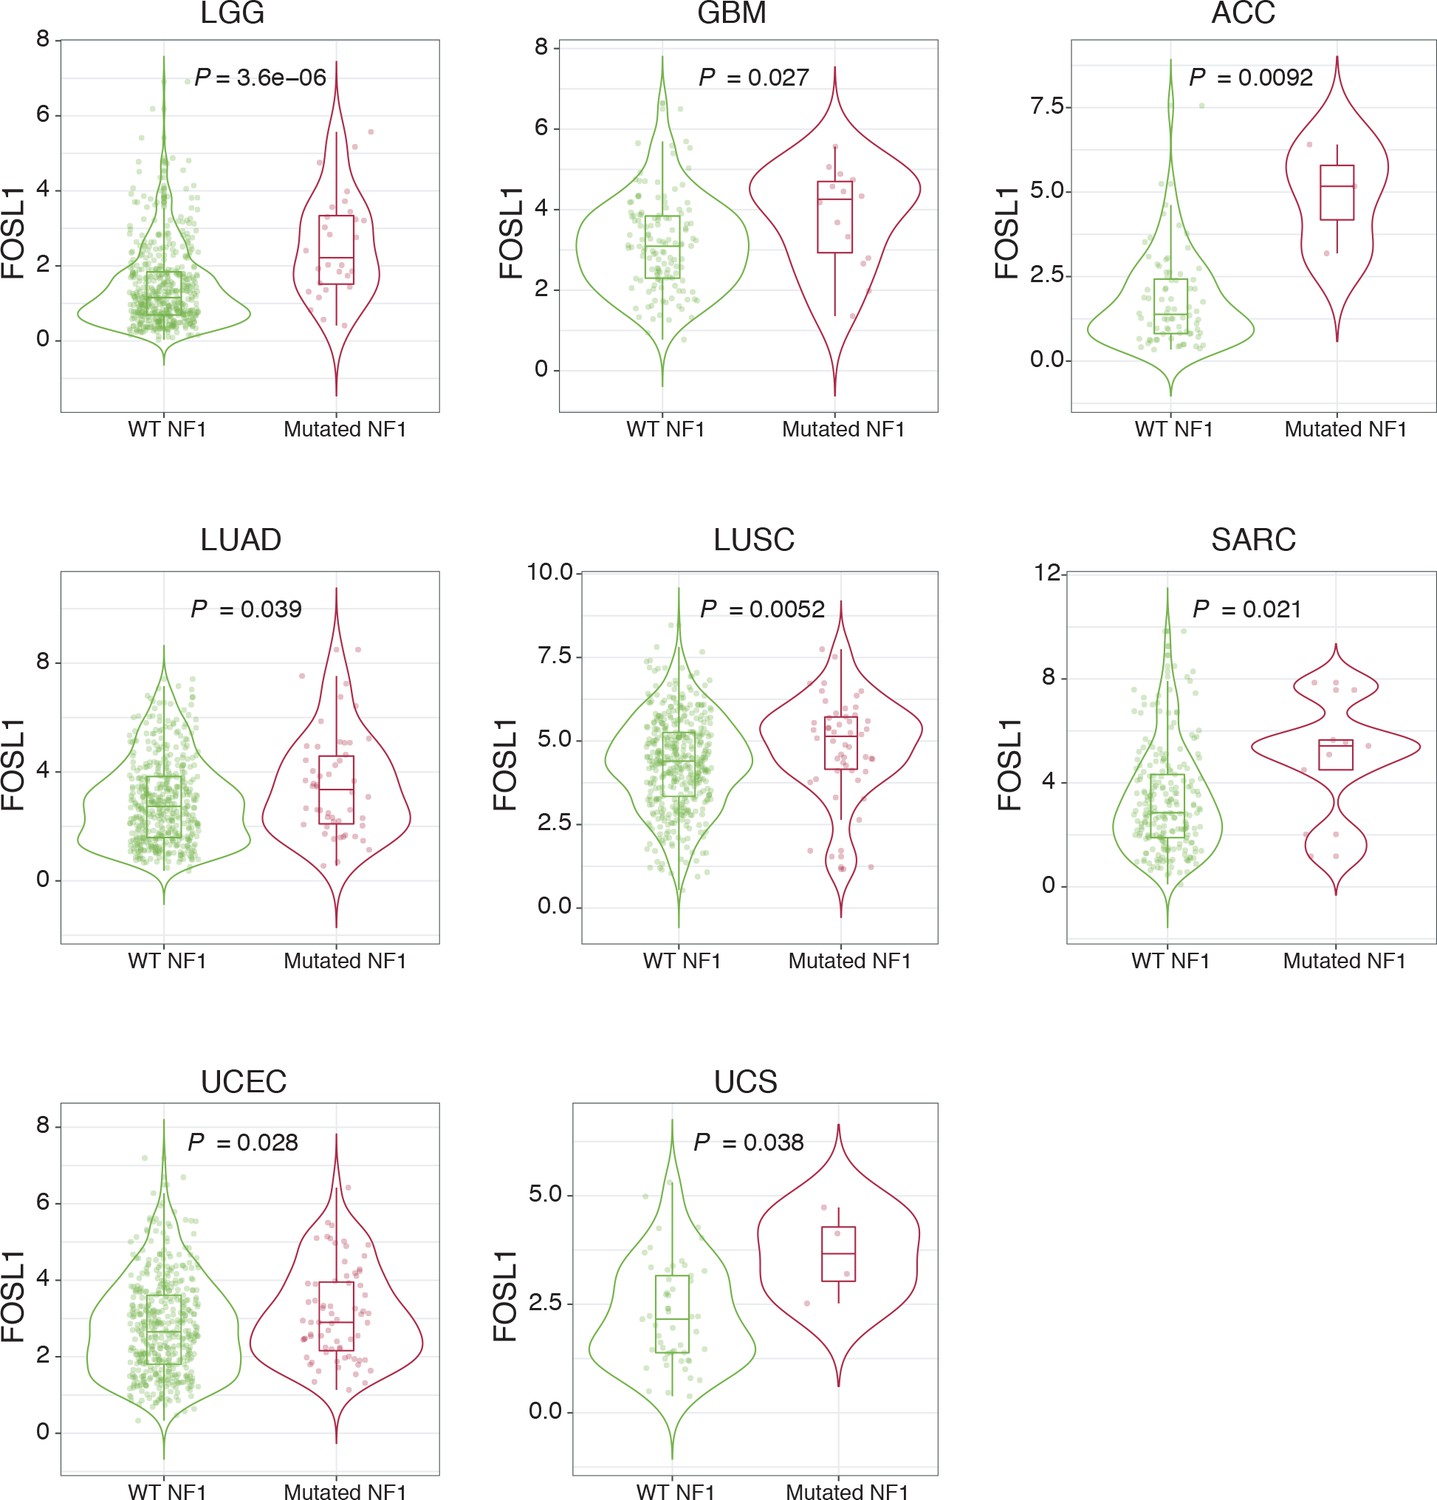
NF1 mutations are associated with higher FOSL1 expression in multiple cancer types.
FOSL1 mRNA expression in the indicated tumors of the TCGA, stratified according to NF1 mutational status. LGG: low-grade glioma; GBM: glioblastoma; ACC: adrenocortical carcinoma; LUAD: lung adenocarcinoma; LUSC: lung squamous cell carcinoma; SARC: sarcoma; UCEC: uterine corpus endometrial carcinoma; UCS: uterine carcinosarcoma. Wilcoxon p-values are indicated.
Author response image 1
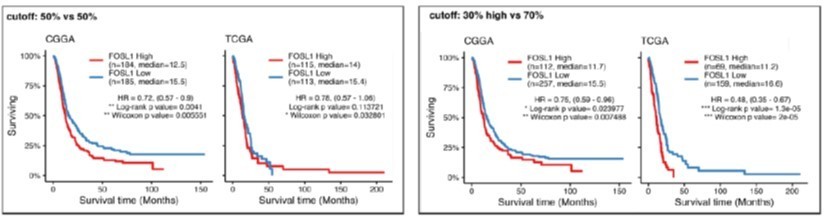
Comparison of different cutoff groups used for the survival analysis.
Author response image 2

Glioma generated with Ras mutants closely resemble those generated by Nf1 loss (image from Friedmann-Morvinski et al., 2012).
Author response image 3
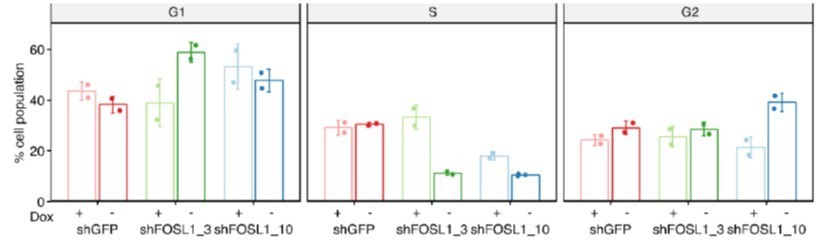
Cell cycle profiles of BTSC 380 upon FOSL1 silencing.
Tables
Key resources table
| Reagent type (species) or resource | Designation | Source or reference | Identifiers | Additional information |
|---|---|---|---|---|
| Antibody | Anti-FRA-1 (Rabbit polyclonal) | Santa Cruz Biotechnology | Cat#sc-183; RRID:AB_2106928 | WB(1:1000) |
| Antibody | Anti-FRA-1 (Rabbit polyclonal) | Santa Cruz Biotechnology | Cat#sc-605, RRID:AB_2106927 | WB(1:1000) |
| Antibody | anti-CD44 (Rat monoclonal) | BD Biosciences | Cat#550538; RRID:AB_393732 | IF(1:100) |
| Antibody | Anti-S100A4 (Rabbit polyclonal) | Abcam | Cat#ab27957, RRID:AB_2183775 | IHC(1:300) |
| Antibody | Anti-Ki67 (Rabbit monoclonal) | Master Diagnostica | Cat#000310QD | IHC(undiluted) |
| Antibody | Anti-FLAG (DYKDDDDK Tag) (Rabbit polyclonal) | Cell Signaling Technology | Cat#2368, RRID:AB_2217020 | WB(1:2000) |
| Antibody | Anti-GFAP (Mouse monoclonal) | Sigma-Aldrich | Cat#G3893, RRID:AB_477010 | WB(1:5000) |
| Antibody | Anti-GFAP (Mouse monoclonal) | Millipore | Cat#MAB360, RRID:AB_11212597 | IF(1:400) |
| Antibody | Anti-NF1 (Rabbit polyclonal) | Santa Cruz Biotechnology | Cat#sc-67, RRID:AB_2149681 | WB(1:500) |
| Antibody | Anti-NF1 (Rabbit polyclonal) | Bethyl | Cat#A300-140A, RRID:AB_2149790 | WB(1:1000) |
| Antibody | Anti-OLIG2 (Rabbit polyclonal) | Millipore | Cat#AB9610, RRID:AB_570666 | WB(1:2000) |
| Antibody | Anti-VIMENTIN (Rabbit monoclonal) | Cell Signaling Technology | Cat#5741, RRID:AB_10695459 | WB(1:3000) |
| Antibody | Anti-phospho-p44/42 MAPK (Erk1/2) (Thr202/Tyr204) (Rabbit polyclonal) | Cell Signaling Technology | Cat#9101, RRID:AB_331646 | WB(1:2000) |
| Antibody | Anti-p44/42 MAPK (Erk1/2) (Rabbit polyclonal) | Cell Signaling Technology | Cat#9102, RRID:AB_330744 | WB(1:1000) |
| Antibody | Anti-phospho-MEK1/2 (Ser217/221) (Rabbit polyclonal) | Cell Signaling Technology | Cat#9154, RRID:AB_2138017 | WB(1:500) |
| Antibody | Anti-MEK1/2 (Rabbit polyclonal) | Cell Signaling Technology | Cat#9122, RRID:AB_823567 | WB(1:1000) |
| Antibody | Anti-human YKL40 (Rabbit polyclonal) | Qidel | Cat#4815, RRID:AB_452475 | WB(1:1000) |
| Antibody | Anti-PI3 kinase, p85 (Rabbit polyclonal) | Millipore | Cat#06-195, RRID:AB_310069 | WB(1:10,000) |
| Antibody | Anti-vinculin (Mouse monoclonal) | Sigma-Aldrich | Cat#V9131, RRID:AB_477629 | WB(1:10,000) |
| Antibody | Anti-α-tubulin (Mouse monoclonal) | Abcam | Cat#ab7291, RRID:AB_2241126 | WB(1:10,000) |
| Antibody | Biotinylated anti-rabbit IgG (Goat polyclonal) | Vector Laboratories | Cat#BA-1000, RRID:AB_2313606 | IHC(1:200) |
| Antibody | Anti-rat IgG (H+L) (goat unknown) | Vector Laboratories | Cat#BA-9400, RRID:AB_2336202 | IHC(1:200) |
| Antibody | Peroxidase-AffiniPure anti-mouse IgG (Goat polyclonal) | Jackson ImmunoResearch Labs | Cat#115-035-003, RRID:AB_10015289 | WB(1:10,000) |
| Antibody | Peroxidase-AffiniPure anti-rabbit IgG (Goat polyclonal) | Jackson ImmunoResearch Labs | Cat#111-035-003, RRID:AB_2313567 | WB(1:10,000) |
| Antibody | Alexa Fluor 488 anti-rabbit IgG (H+L) (Donkey polyclonal) | Thermo Fisher Scientific | Cat#A21206; RRID:AB_2535792 | IF(1:400) |
| Antibody | Alexa Fluor 488 anti-mouse IgG (H+L) (Donkey polyclonal) | Thermo Fisher Scientific | Cat#A21202; RRID:AB_141607 | IF(1:400) |
| Antibody | Alexa Fluor 594 anti-rat IgG (H+L) (Donkey polyclonal) | Thermo Fisher Scientific | Cat#A21209; RRID:AB_2535795 | IF(1:400) |
| Chemical compound, drug | Ovomucoid | Worthington | Cat#LS003087 | |
| Chemical compound, drug | N-acetyl-L-cysteine | Sigma-Aldrich | Cat#A9165 | |
| Peptide, recombinant protein | Recombinant human EGF | Gibco | Cat#PHG0313 | |
| Peptide, recombinant protein | Basic-FGF | Millipore | Cat#GF003-AF | |
| Peptide, recombinant protein | Heparin | Stem Cell Technologies | Cat#07980 | |
| Chemical compound, drug | L-glutamine | Hyclone | Cat#SH3003401 | |
| Chemical compound, drug | Accumax | Thermo Fisher Scientific | Cat#00-4666-56 | |
| Chemical compound, drug | Polybrene | Sigma-Aldrich | Cat#H9268 | |
| Chemical compound, drug | Puromycin | Sigma-Aldrich | Cat#P8833 | |
| Chemical compound, drug | Doxycycline | PanReac AppliChem | Cat#A29510025 | |
| Chemical compound, drug | Hydrogen peroxide | Sigma-Aldrich | Cat#H1009 | |
| Peptide, recombinant protein | BSA | Sigma-Aldrich | Cat#A7906 | |
| Chemical compound, drug | BrdU | Sigma-Aldrich | Cat#B9285 | |
| Chemical compound, drug | Peroxidase substrate DAB | Vector Laboratories | Cat#SK-4100 | |
| Chemical compound, drug | TRIzol | Invitrogen | Cat#15596-026 | |
| Chemical compound, drug | MTT | Sigma-Aldrich | Cat#M5655 | |
| Chemical compound, drug | PI | Sigma-Aldrich | Cat#P4170 | |
| Other | Goat serum | Sigma-Aldrich | Cat#G9023 | |
| Other | RNase A | Roche | Cat#10109142001 | |
| Other | DAPI | Sigma-Aldrich | Cat#D8417 | |
| Other | ProLong Gold Antifade | Invitrogen | Cat#P10144 | |
| Other | Protein A/G plus-agarose beads | Santa Cruz Biotechnology | Cat#sc-2003 | |
| Other | Salmon sperm DNA | Thermo Fisher Scientific | Cat#AM9680 | |
| Other | Neurobasal medium | Gibco | Cat#10888022 | |
| Other | B27 supplement | Gibco | Cat#12587010 | |
| Other | N2 supplement | Gibco | Cat#17502048 | |
| Other | Earl’s Balanced Salt Solution | Gibco | Cat#14155-08 | |
| Other | Papain | Worthington | Cat#LS003119 | |
| Other | DNaseI | Roche | Cat#10104159001 | |
| Other | Mouse NeuroCult basal medium | Stem Cell Technologies | Cat#05700 | |
| Other | Mouse NeuroCult Proliferation supplement | Stem Cell Technologies | Cat#05701 | |
| Other | ACK lysing buffer | Gibco | Cat#A1049201 | |
| Other | DMEM | Sigma-Aldrich | Cat#D5796 | |
| Commercial assay or kit | High Capacity cDNA Reverse Transcription Kit | Applied Biosystems | Cat#4368814 | |
| Commercial assay or kit | SYBR Select Master Mix | Applied Biosystems | Cat#4472908 | |
| Commercial assay or kit | SuperscriptIII reverse transcriptase | Life Technologies | Cat#18080-085 | |
| Commercial assay or kit | QuantSeq 3′ mRNA-Seq Library Prep Kit (FWD) for Illumina | Lexogen | Cat#015 | |
| Commercial assay or kit | StemPro Osteogenesis Differentiation Kit | Life Technologies | Cat#A1007201 | |
| Commercial assay or kit | Active Ras pull down assay kit | Thermo Fisher Scientific | Cat#16117 | |
| Commercial assay or kit | QIAquick PCR purification kit | QIAGEN | Cat#28104 | |
| Commercial assay or kit | QIAGEN PCR cloning kit | QIAGEN | Cat#231124 | |
| Recombinant DNA reagent | pCHMWS- NF1-GRD | This paper | N/A | NF1-GRD overexpressing construct generated in the Carro’s lab |
| Recombinant DNA reagent | pLKO-shNF1 | Sigma-Aldrich | TRCN0000238778 | |
| Recombinant DNA reagent | pGIPZ-shNF1 | This paper | N/A | Human NF1 shRNA construct generated in the Carro’s lab |
| Recombinant DNA reagent | pGIPZ-shNF1 clone V2LHS_76027 (clone 4) | Open Biosystems | RHS4430-98894408 | |
| Recombinant DNA reagent | pGIPZ-shNF1 clone V2LHS_260806 (clone 5) | Open Biosystems | RHS4430-98912463 | |
| Recombinant DNA reagent | pKLV-U6gRNA-PGKpuro2ABFP | Kosuke Yusa (Wellcome Sanger Institute) | Addgene plasmid #50946 | |
| Recombinant DNA reagent | pLVX-Cre | Maria A. Blasco (CNIO) | N/A | |
| Recombinant DNA reagent | pLKO.1-TET-shFOSL1_3 and shFOSL1_10 | Silve Vicent (CIMA) | N/A | |
| Recombinant DNA reagent | pMD2.G | Carro’s lab | Addgene plasmid #12259 | |
| Recombinant DNA reagent | psPAX2 | Carro’s lab | Addgene plasmid #12260 | |
| Recombinant DNA reagent | pBabe-FOSL1 | Matsuo et al., 2000 | N/A | |
| Recombinant DNA reagent | pSIN-EF1-puro-FLAG-FOSL1 | Silve Vicent (CIMA) | N/A | |
| Recombinant DNA reagent | pSIN-EF1-puro-eGFP | Silve Vicent (CIMA) | N/A | |
| Recombinant DNA reagent | RCAS-sgNf1 | This paper | N/A | Mouse Nf1 sgRNA construct generated in the Squatrito’s lab |
| Recombinant DNA reagent | RCAS-shNf1 | Ozawa et al., 2014 | N/A | |
| Recombinant DNA reagent | RCAS-KrasG12V | This paper | N/A | KRASG12V construct generated in the Squatrito’s lab |
| Software, algorithm | FlowJo v10 | BD (Becton, Dickinson and Company) | N/A | |
| Software, algorithm | RStudio | https://rstudio.com/products/rstudio/ | N/A | |
| Software, algorithm | Nextpresso RNA-Seq pipeline | Graña et al., 2018 | https://hub.docker.com/r/osvaldogc/nextpresso | |
| Software, algorithm | deepTools2 | Ramírez et al., 2016 | https://deeptools.readthedocs.io/en/develop/ | |
| Software, algorithm | bowtie2 v2.3.5 | Langmead and Salzberg, 2012 | Bowtie 2, RRID:SCR_016368 | |
| Software, algorithm | SeqMonk | https://www.bioinformatics.babraham.ac.uk/projects/seqmonk/ | SeqMonk, RRID:SCR_001913 | |
| Software, algorithm | ChaSE | Younesy et al., 2016 | http://chase.cs.univie.ac.at/overview | |
| Software, algorithm | GSEA | Subramanian et al., 2005 | Gene Set Enrichment Analysis, RRID:SCR_003199 | |
| Software, algorithm | R programming language | R Core team 2013 | R Project for Statistical Computing, RRID:SCR_001905 | |
| Software, algorithm | trim-galore v0.6.2 | https://www.bioinformatics.babraham.ac.uk/projects/trim_galore/ | N/A | |
| Cell line (Gallus gallus) | DF1 | ATCC | Cat#CRL-12203 | |
| Cell line (Homo sapiens) | Gp2-293 | Clontech | Cat#631458 | |
| Cell line (Homo sapiens) | BTSC 232 | Fedele et al., 2017 | N/A | |
| Cell line (Homo sapiens) | BTSC 233, BTSC 3021, BTSC 3047, BTSC 349, BTSC 380 | This paper | N/A | Human patient-derived lines generated at Freiburg University; see Materials and methods for details |
| Cell line (Homo sapiens) | h543, h676 | Ozawa et al., 2014 | N/A |
Additional files
-
Source code 1
R programming code used for data analysis and plot generation.
- https://cdn.elifesciences.org/articles/64846/elife-64846-code1-v1.zip
-
Source data 1
Raw images for western blots.
- https://cdn.elifesciences.org/articles/64846/elife-64846-data1-v1.zip
-
Supplementary file 1
Transcriptional subtypes of the brain tumor stem cell (BTSC) lines.
- https://cdn.elifesciences.org/articles/64846/elife-64846-supp1-v1.xlsx
-
Supplementary file 2
Genes differentially expressed in brain tumor stem cells (BTSCs) (mesenchymal [MES] versus non-MES) at FDR < 0.05.
- https://cdn.elifesciences.org/articles/64846/elife-64846-supp2-v1.xlsx
-
Supplementary file 3
Master regulator analysis (MRA) results.
- https://cdn.elifesciences.org/articles/64846/elife-64846-supp3-v1.xlsx
-
Supplementary file 4
TCGA and CGGA data.
- https://cdn.elifesciences.org/articles/64846/elife-64846-supp4-v1.xlsx
-
Supplementary file 5
Gene signatures used for the gene set enrichment analysis (GSEA).
- https://cdn.elifesciences.org/articles/64846/elife-64846-supp5-v1.xlsx
-
Supplementary file 6
Primers used in this study.
- https://cdn.elifesciences.org/articles/64846/elife-64846-supp6-v1.xlsx
-
Transparent reporting form
- https://cdn.elifesciences.org/articles/64846/elife-64846-transrepform-v1.docx
Download links
A two-part list of links to download the article, or parts of the article, in various formats.
Downloads (link to download the article as PDF)
Open citations (links to open the citations from this article in various online reference manager services)
Cite this article (links to download the citations from this article in formats compatible with various reference manager tools)
NF1 regulates mesenchymal glioblastoma plasticity and aggressiveness through the AP-1 transcription factor FOSL1
eLife 10:e64846.
https://doi.org/10.7554/eLife.64846


