In vitro reconstitution reveals major differences between human and bacterial cytochrome c synthases
- Department of Biology, Washington University in St. Louis, United States
- Department of Biological Sciences, University of Delaware, United States
Figures
Figure 1 with 7 supplements
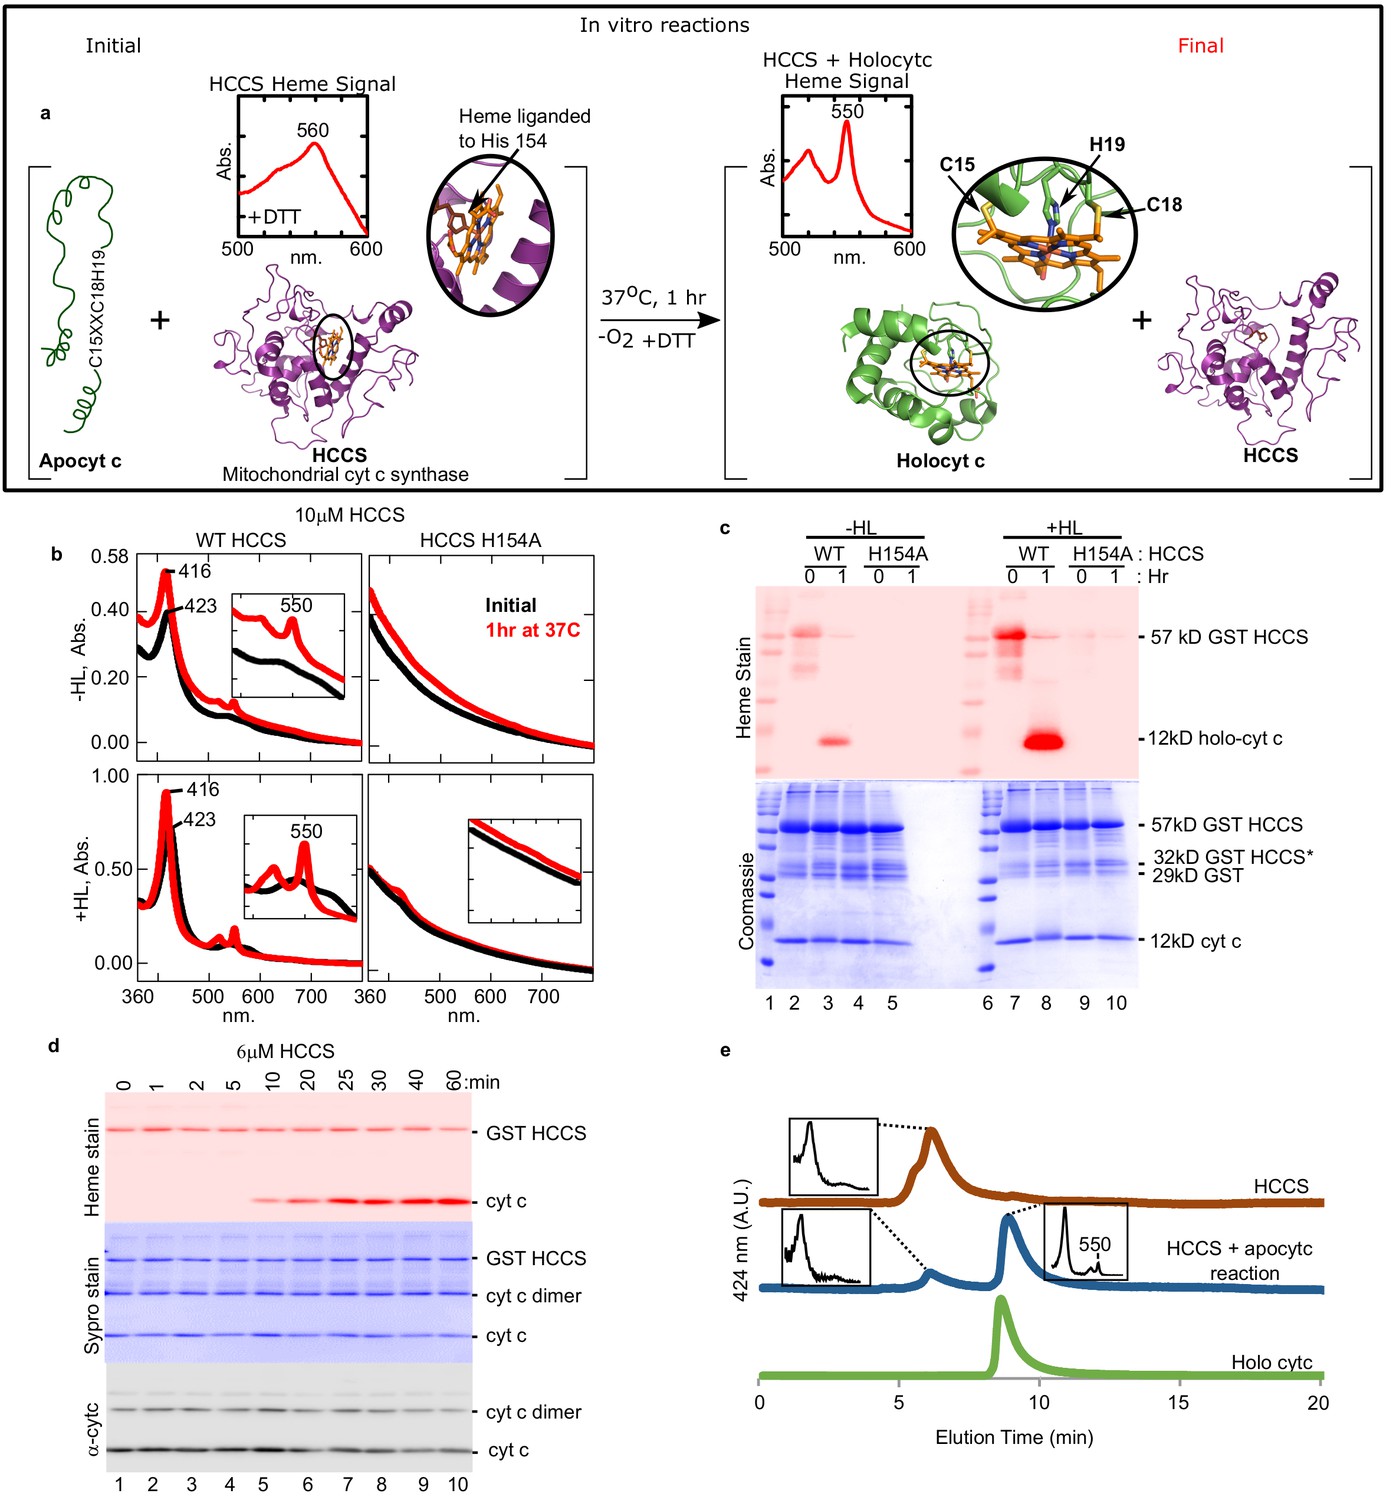
Cyt c is biosynthesized in vitro by mitochondrial HCCS.
(a) Schematic of the in vitro heme attachment reaction of HCCS with apocytochrome c (apocyt c). Mitochondrial cyt c synthase, HCCS, positions heme (orange) and attaches it to apocyt c. Cyt c is released and folds into its native structure. Insets show the UV–vis spectra of heme. (b) UV–vis spectra of heme signal from the anaerobic reaction of WT and H154A HCCS (±heme loading [HL]) with apocyt c as outlined in a black line – initial, red line – 1 hr post-addition of DTT. Inset shows magnification of the region. (c) In vitro biosynthesis of cyt c was monitored by heme stain. WT HCCS biosynthesized 12 kDa cyt c product (lanes 3 and 8). HCCS H154A, a mutant defective for heme binding, did not (lanes 5 and 10). Total protein for in vitro reaction shown by Coomassie. For (b) and (c), representative data is shown from three biological replications (independent purifications of HCCS). (d) Time course of HCCS in vitro activity. A single trial showed heme-stained cyt c product is first observed after 10 min (red, lane 5). Sypro stain shows total protein levels, -cyt c shows total cyt c in reaction. The apocyt c dimer observed upon SDS–PAGE is due to aggregation and does not impact the results or conclusions. (e) HPLC profiles of the indicated reaction products representative of two trials.
Figure 1—figure supplement 1
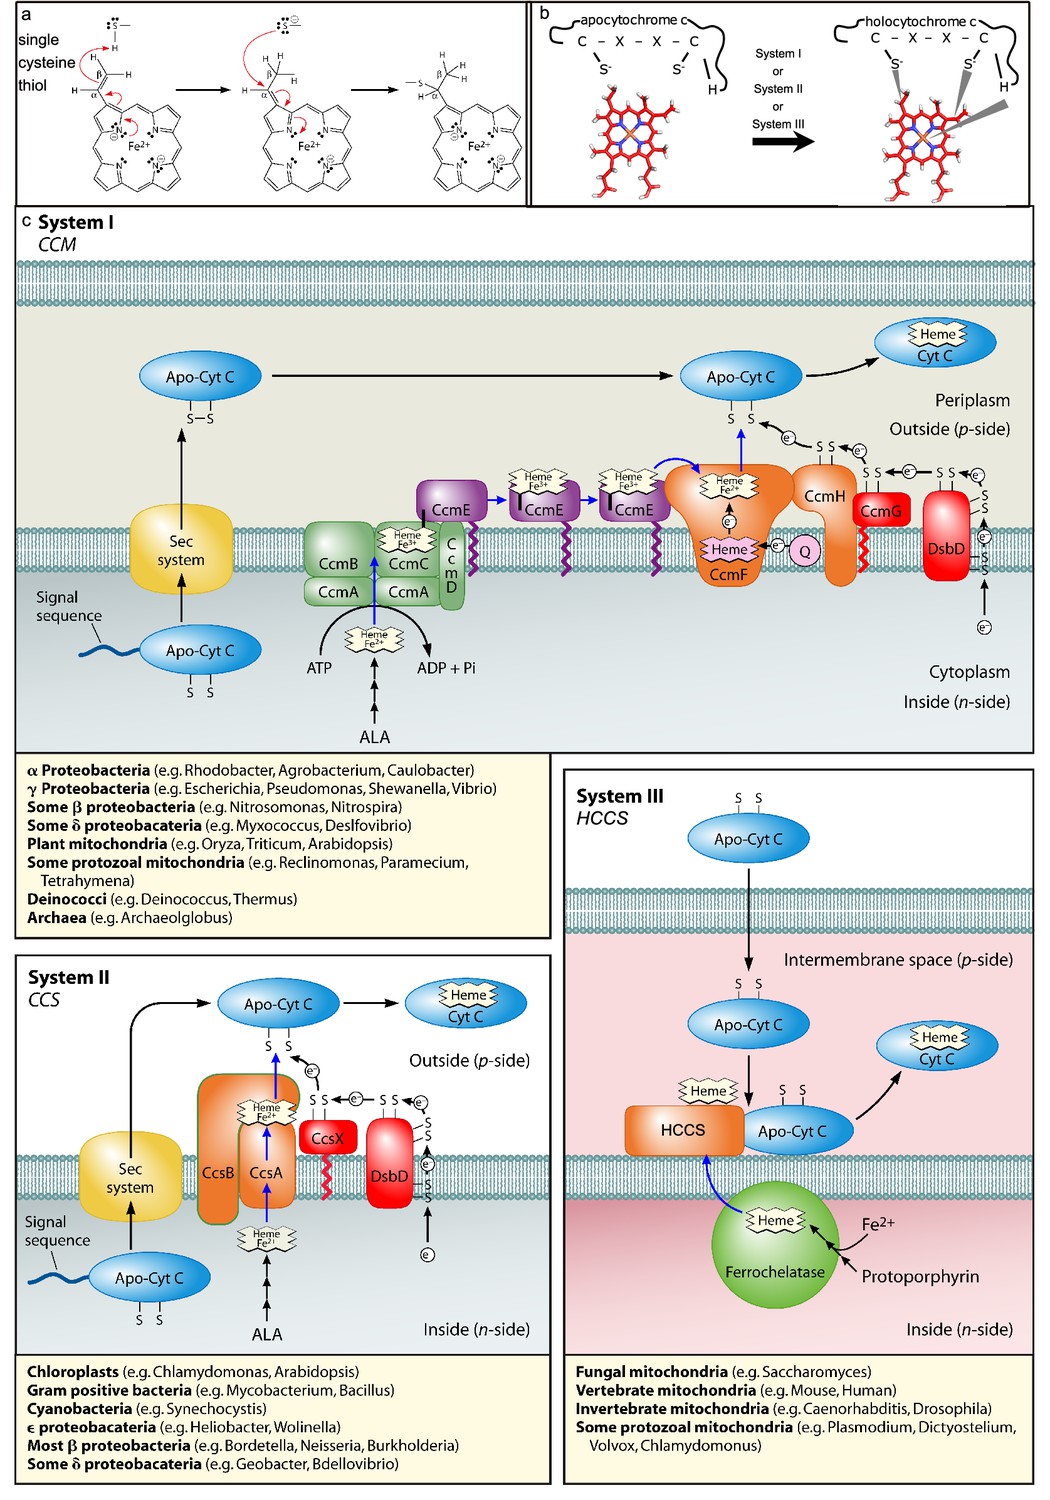
Cyt c attachment to heme and cyt c biogenesis pathways (Systems I, II, and III).
(a) Heme c synthesis (one vinyl group shown with one thiol of CXXCH): cys thiol attachment to carbon of the vinyl group of heme. (b) schematic of the reaction that takes place between apocyt c and heme, mediated by Systems I, II, or III. (c) Proposed models for cytochrome c biogenesis by Systems I, II, and III. Models include trafficking and oxidation states of heme, as well as the subpathways for apocytochrome reduction (in red for system I and system II). Representative genera possessing each system are listed under the models. (a, c) modified from Kranz et al., 2009 as indicated.
© 2009, American Society for Microbiology permissions. Panel a is reproduced from Figure 5, Kranz et al., 2009, with permission from the American Society for microbiology. It is not covered by the CC-BY 4.0 licence and further reproduction of this panel would need permission from the copyright holder.
© 2009, American Society for Microbiology permissions. Panel c is reproduced from Figure 2, Kranz et al., 2009, with permission from the American Society for microbiology. It is not covered by the CC-BY 4.0 licence and further reproduction of this panel would need permission from the copyright holder.
Figure 1—figure supplement 2

Titration of heme loading (HL) in GST-HCCS.
WT (blue, n = 7) and H154A (orange, n = 3). Exogenous heme at indicated concentration (x-axis) was added to GST-HCCS during batch purification with glutathione agarose for 20 hr. GST-HCCS was washed, eluted, and heme content of the final sample was measured from spectra of the purified HCCS, as determined by the Soret absorbance. Error bars are the standard deviation.
Figure 1—figure supplement 3

HCCS in vitro biosynthesized cyt c has heme attached and is properly folded.
(a) The reaction of 10 µM HCCS and 20 µM apocyt c (initial, black) was initiated with 5 mM DTT and incubated for 1 hr at 37°C (red, final). The inset shows the pyridine hemochrome assay spectra absorbance at 550 nm consistent with the attachment of two thioether bonds. This data is representative of three biological replicates. (b) Apocyt c (initial, black) was incubated with GST-HCCS glutathione agarose for 1 hr at 37°C. After centrifugation, a UV–vis spectra of the supernatant was taken exhibiting a peak at 550 nm consistent with that of cyt c. Inset: The oxidized spectra of the supernatant has a peak at 695 nm, consistent with heme Fe2+ axial coordination by cyt c Met81. This was the result of one replicate. This supports the conclusion that cyt c is released by HCCS and properly folded.
Figure 1—figure supplement 4

In-vitro biosynthesis of cyt c by HCCS is temperature dependent.
Aerobic reaction with 3 µM HCCS (+HL) and 20 µM apocyt c were initiated with 3 mM DTT and monitored over a period of 4 hr at the indicated time points and temperatures. Cyt c biosynthesis was measured using the alpha peak height (abs 550 nm – abs 535 nm). 0°C (blue), 22°C (orange), 37°C (purple), 42°C (yellow). The experiment is the average of three biological replicates. The error bars are the standard deviation.
Figure 1—figure supplement 5

HCCS function is dependent on the presence of DTT (aerobic conditions).
(a) 0 mM, (b) 0.1 mM, (c) 1 mM, and (d) 3 mM DTT were added to a reaction of 3 µM HCCS and 6.5 µM apocyt c. Cyt c biosynthesis was monitored by appearance of a 550 nm peak. The initial (black) sample represents the reaction prior to DTT addition and final (red) is after a 1 hr incubation with DTT at 37°C. This is a single replicate.
Figure 1—figure supplement 6

Aerobic in vitro reaction with HCCS + apocyt c.
(a) As in Figure 1b, apocyt c and HCCS (± HL) were combined (black). The reaction was initiated with 5 mM DTT and allowed to react for 1 hr at 37°C (red). HCCS matured apocyt c, while HCCS H154A did not. (b) Heme stain showed evidence of matured cyt c in lanes 3 and 9. This data is representative of three biological replicates.
Figure 1—figure supplement 7

Model for HCCS function proposed previously based on in vivo results (Babbitt et al., 2015; San Francisco et al., 2013).
(a) Four-step model of HCCS function. UV–vis spectra corresponding to each step are shown. Step 1, HCCS binds to heme via residue H154. Step 2, HCCS binds to apocyt c and His19 (of CXXCH) forms the second axial ligand to heme, positioning the cysteine residues for attachment. Step 3, thioether formation between cysteine residues and heme vinyl groups to form covalent attachment to heme. Step 4, Holocyt c is released from HCCS and folds into its native structure with M81 forming the second axial ligand. (b) The reduced spectra of a heme attached 11-mer derived from apocyt c (microperoxidase-11 [MP-11] is a commercially available purified proteolyzed cyt c peptide [Sigma]).
© 2015, Elsevier permissions. Panel a is reproduced with permission from Figure 2, Babbitt et al., 2015, with permission from Elsevier. It is not covered by the CC-BY 4.0 licence and further reproduction of this figure would need permission from the copyright holder.
Figure 2
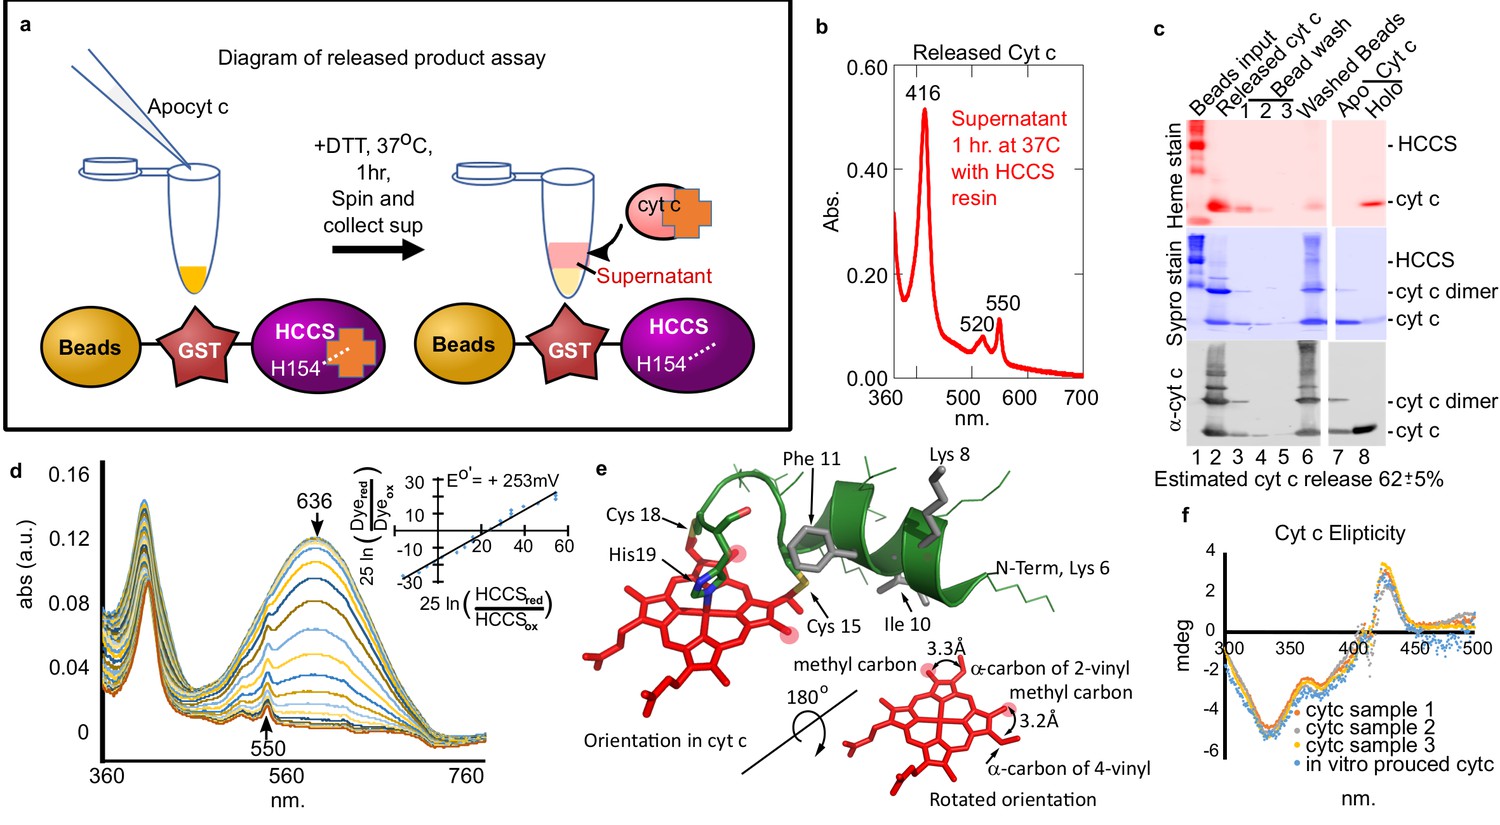
Cyt c biosynthesized in vitro is released by mitochondrial HCCS.
(a) Schematic of HCCS released product assay. In vitro reaction is carried out with bead tethered GST-HCCS. Centrifugation separates the beads (GST-HCCS) and supernatant (e.g. released products). (b) UV–vis spectra of supernatant from the released product assay shows characteristic 550 nm cyt c peak, indicating cyt c is matured and released from GST-HCCS beads. (c) SDS–PAGE analysis of released product assay fractions. Lane two shows released cyt c as compared to purified holocyt c (lane 8). (b) and (c) are representative of three biological replicates. The standard deviation is provided. (d) The redox potential of the released cyt c was determined by a modified Massey method (Efimov et al., 2007) and determined to be +253 mV, similar to the published value for cyt c. This is data from one of three biological replicates. (e) Schematic of heme attached to cyt c from PDB: 3ZCF with heme rotated 180o (from Babbitt et al., 2015). (f) Circular dichroism (CD) spectra of in vivo (orange, gray, yellow) vs in vitro (blue) biosynthesized cyt c. In vivo cyts c represent three independent preparations.
© 2015, Elsevier permissions. Panel e is reproduced with permission from Figure 1, Babbitt et al., 2015, with permission from Elsevier. It is not covered by the CC-BY 4.0 licence and further reproduction of this figure would need permission from the copyright holder.
Figure 3 with 3 supplements
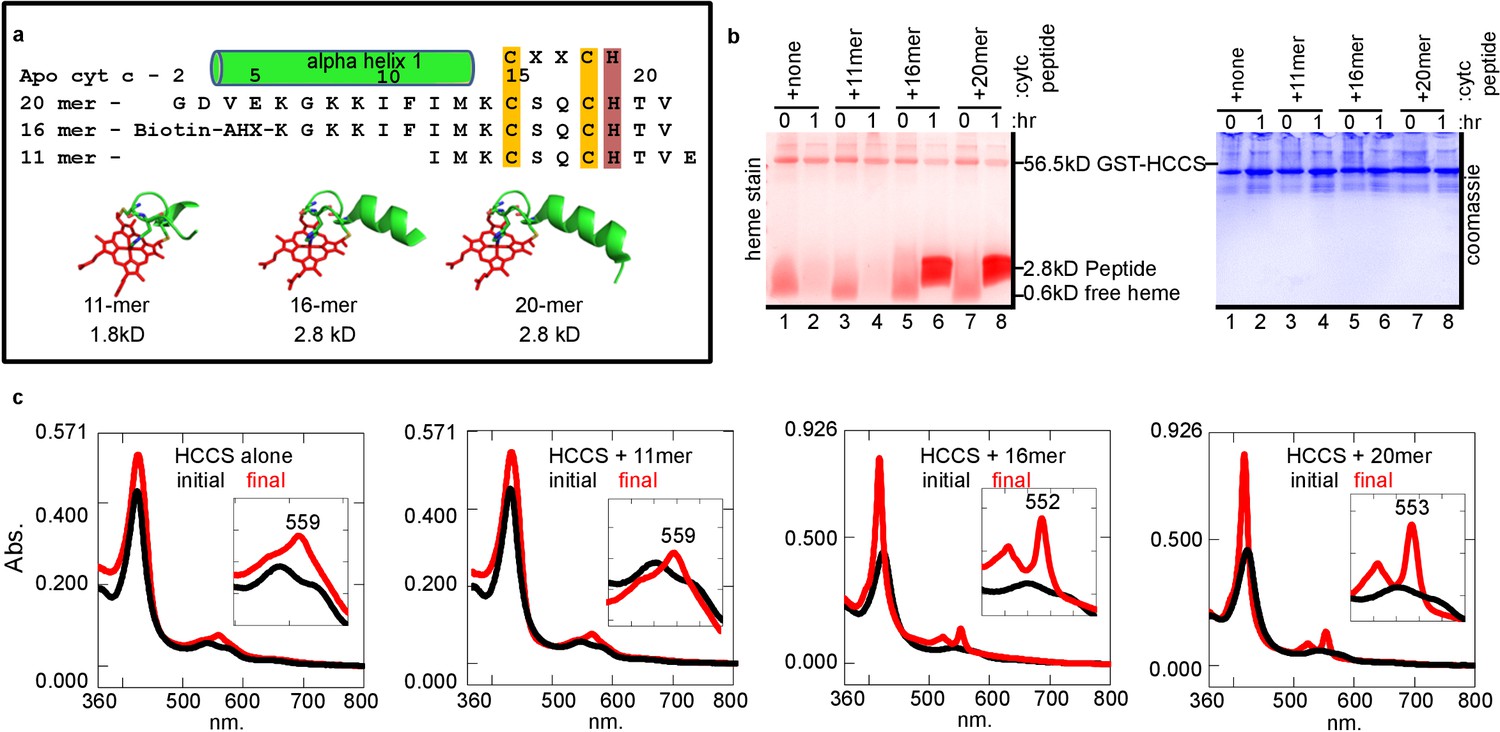
HCCS requires alpha helix 1 of cyt c for heme attachment to peptides containing CXXCH.
(a) Sequence of three CXXCH containing peptides with alpha helix 1 and CXXCH designated. Three-dimensional structures of peptides with heme were generated from the cyt c 3D crystal structure PDB: 3ZCF, alpha helical structure is predicted, but not experimentally confirmed. In vitro reaction (as in Figure 1a) of HCCS and the peptides in 3 (a) was performed and analyzed by (b) SDS–PAGE followed by heme stain and (c) UV–vis spectra to assess heme signal. Black – initial, red – 1 hr post-addition of DTT. Inset shows magnification of the region. Data is representative of three biological replicates.
Figure 3—figure supplement 1

Attachment of heme to peptides by HCCS.
(a) In vitro assay was performed with HCCS with the labeled peptides. The final UV–vis heme spectra is shown. A peak at 550–555 nm indicates that heme has covalently bound to cyt c peptide. Peaks at 560 nm indicate the presence of b-heme. (b) In-gel heme stains of initial and final samples separated on a 15% Tris–tricine gel demonstrate heme attachment when present. Coomassie stain was performed after heme staining and shows total protein levels in the in vitro reactions in addition to some staining left over from the heme stain. (c) ImageJ quantitation of three sets of heme-stained gels represented in (b). Error bars are the standard deviation of the data.
-
Figure 3—figure supplement 1—source data 1
ImageJ Pixel analysis of heme stained bands.
- https://cdn.elifesciences.org/articles/64891/elife-64891-fig3-figsupp1-data1-v1.xlsx
Figure 3—figure supplement 2

HCCS anaerobic in vitro attachment of heme to CXXCH variant peptides.
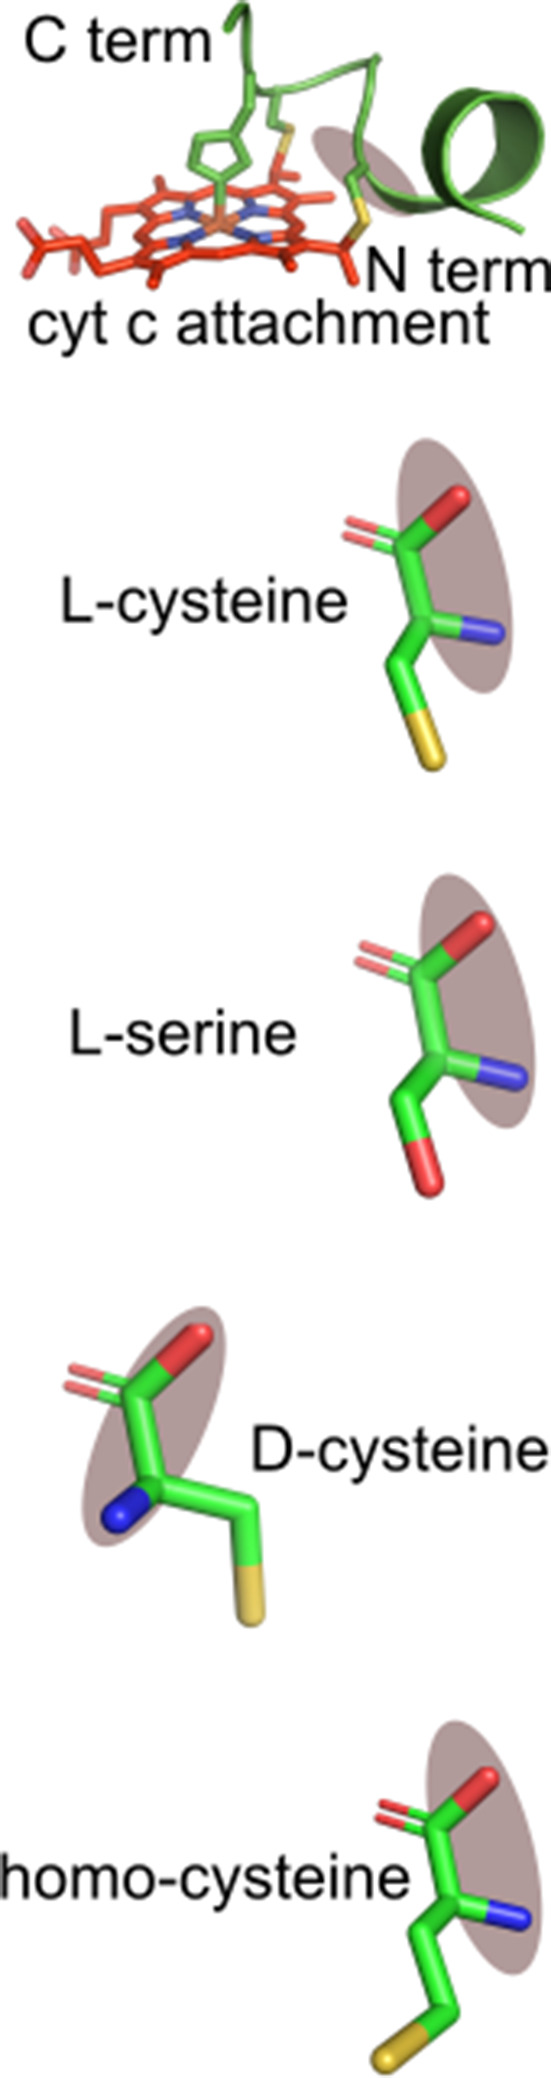
C15S refers to Cys15Ser; DC15 refers to Cys15 D-Cys15 replacing L-Cys15; HoC15 refers to homocysteine replacing L-Cys15. (a) Heme stain and Coomassie showing that 20mer peptides WT (lane 2), C15S (lane 4), DC15 (lane 6), -HoC15 (lane 8), C18S (lane 10), HoC18 (lane 14) are heme attached, while C15S/C18S is not (lane 16). (b–h) Spectra of the respective peptide reactions with HCCS. The inset contains the pyridine of the final sample. A value of 550 nm indicates two thioether bonds are formed with heme, while 555 nm indicates no thioether bond formation. A value of 552–553 nm indicates a single thioether bond. These data are representative of three biological replicates.
Figure 3—figure supplement 3

In vitro HCCS attachment of heme to C15S 20mer and analysis of release.
(a) Release assay as in Figure 4b. Briefly, C15S 20mer is added to HCCS bound to glutathione agarose (beads) and reacted for 1 hr. Heme staining shows that the majority of matured C15S 20mer remains on the beads and is eluted with HCCS, indicating that matured C15S is mostly complexed with HCCS. (b) The UV–vis absorbance of the supernatant shows some absorbance at 555 and 560 nm, but much more is present in the eluted HCCS fraction. Remarkably, the 555/560 nm doublet is also observed in a C15S variant of cyt c in vivo, co-purified with HCCS (Babbitt et al., 2017; San Francisco et al., 2013). (c) HPLC separation by the Agilent bio sec-3 of the respective reactions. In each case, the HCCS eluted before the released substrate (if present). The spectra shown were taken as the sample was eluted from the column in real time. The C15S 20mer has a peak of 555 and 560 nm and elutes at 6.5 min indicating a complex with HCCS. (d) A summary table of matured released substrate as quantitated by comparing the heme densitometry in the supernatant to the signal was found on the beads, or eluted, from the beads. n provides the number of biological replicates performed on each peptide and the standard deviation is provided.
-
Figure 3—figure supplement 3—source data 1
Summary of percent released substrate.
- https://cdn.elifesciences.org/articles/64891/elife-64891-fig3-figsupp3-data1-v1.xlsx
Figure 4
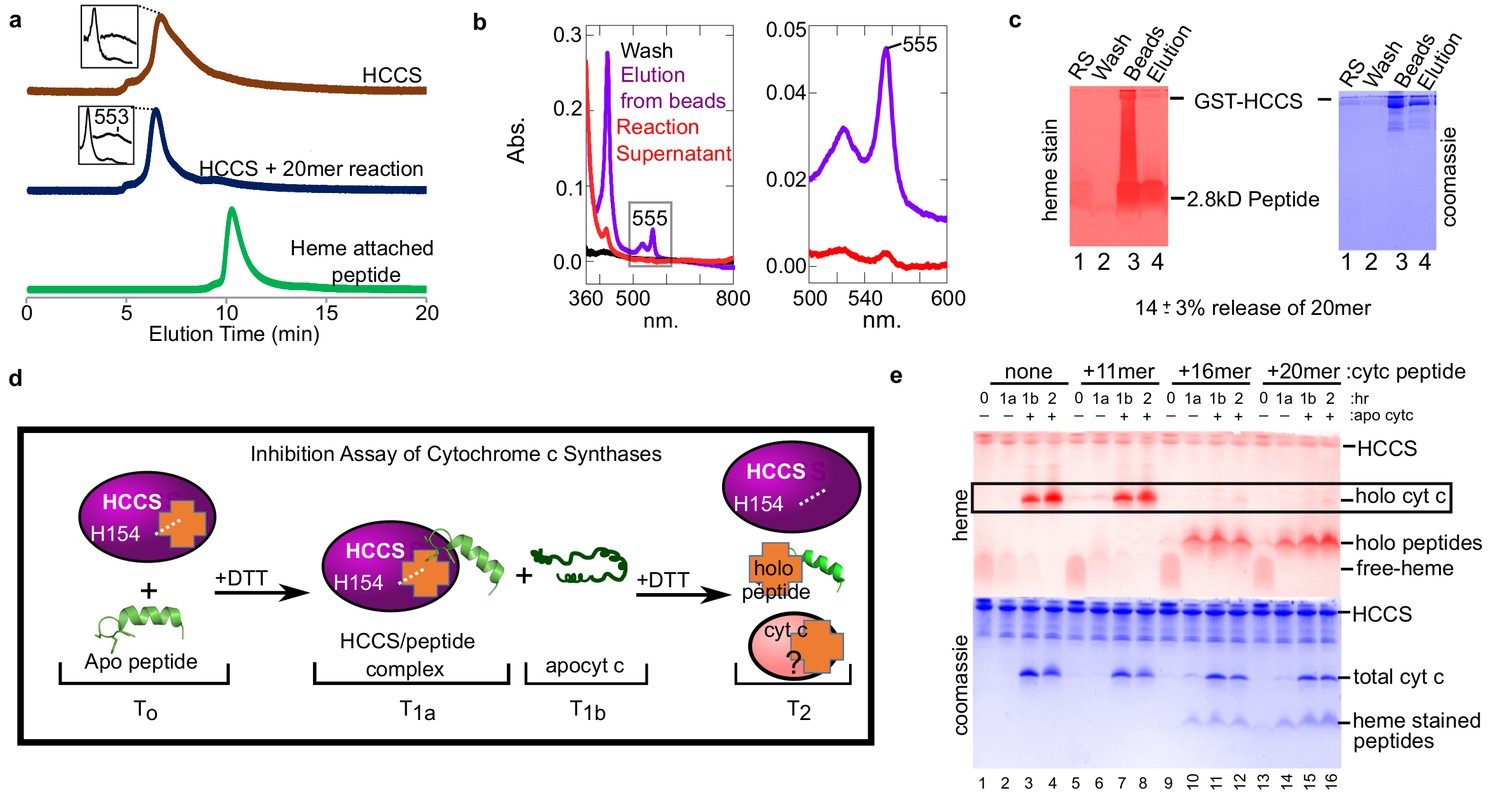
Peptides not released by HCCS can inhibit HCCS in vitro biosynthesis of cyt c.
(a) The 20mer reaction was analyzed by SEC-HPLC (blue) and compared to HCCS alone (brown). The ‘heme attached peptide’ serves as a positive control for a released peptide (green). It is commercially available MP-11 (Sigma), an 11mer with heme attached that is purified from trypsinized cyt c. Insets show the spectra of the respective peaks. (b) The ‘released product assay’ (see Figure 2a) was performed with HCCS and the 20mer peptide. Glutathione eluted beads had a heme signal of 555 nm (purple) indicating a complex of HCCS with 20mer. The supernatant has little heme signal (red). (c) Tris–Tricine SDS–PAGE of the reaction supernatant (lane 1) and the elution from the beads (lane 4) shows that 14 ± 3% of the 20mer is released from HCCS. (b and c) are representative of seven trials and the estimated release is based on all trials. The standard deviation is provided. (d) Schematic of peptide inhibition assay with HCCS. T0 – The in vitro reaction components HCCS and peptide are combined under anaerobic conditions, T1a – Addition of DTT initiates the reaction. Reaction incubates for 1 hr at 37 C, then the reaction is measured. T1b– Apocyt c is added to the reaction to determine whether the peptide inhibits HCCS heme attachment to apocyt c. DTT is added to the reaction after T1b and incubated at 37 C for 1 hr. T2– The final reaction products were analyzed by SDS–PAGE to determine if holocyt c was matured. (e) Reactions were separated by Tris–tricine SDS–PAGE and heme- and protein-stained. The 16 and 20mers inhibit HCCS maturation of apocyt c (lanes 11, 12, 15, 16). The 11mer or no peptide do not inhibit maturation of apocyt c (lanes 3, 4, 7, 8) (see boxed bands with holocyt c). The data is representative of three biological replicates.
Figure 5
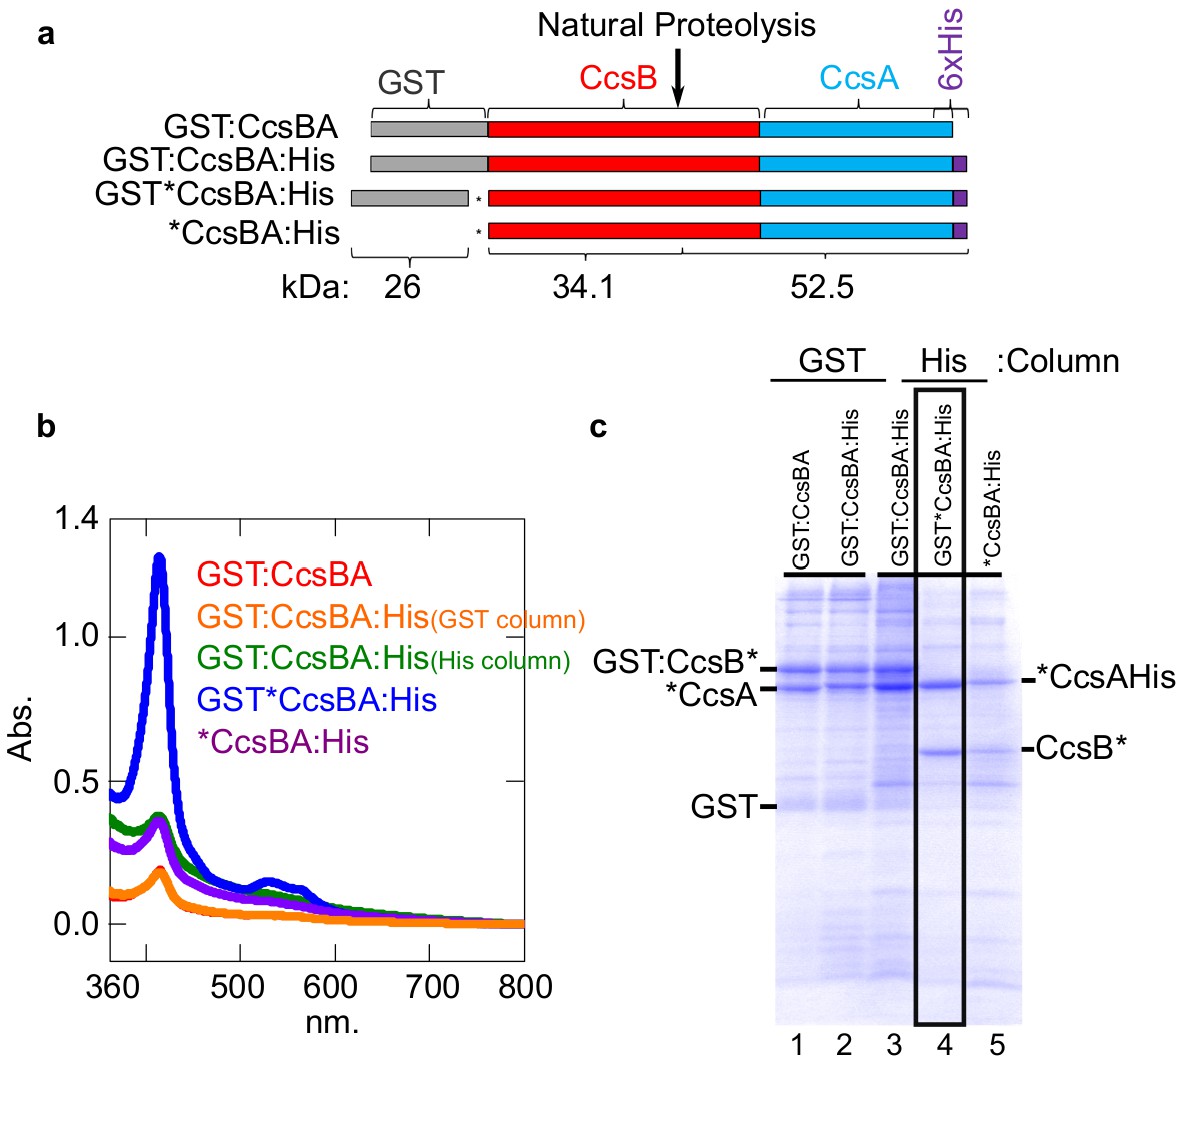
Construction of CcsBA with a C-terminal 6XHis affinity tag.
(a) Schematics of CcsBA constructs used for overexpression and affinity purification. Gray, GST ORF; red, ccsB; blue ccsA; purple, C-terminal 6XHis tag. Site of natural proteolysis is shown with expected molecular weights of polypeptides. *Insertion of a stop/RBS/start cassette. UV–vis spectra Soret (~412 nm) is used to determine relative heme levels of 50 µg of purified CcsBA protein from the indicated construct. Spectra are representative of three independent purifications. (b) Affinity purifications of constructs in a. Affinity tag used for purification and relevant polypeptides are labeled. Boxed lane four is the His-tagged CcsBA used for these studies (except in Figure 6b). Data is representative of three biological replicates.
Figure 6
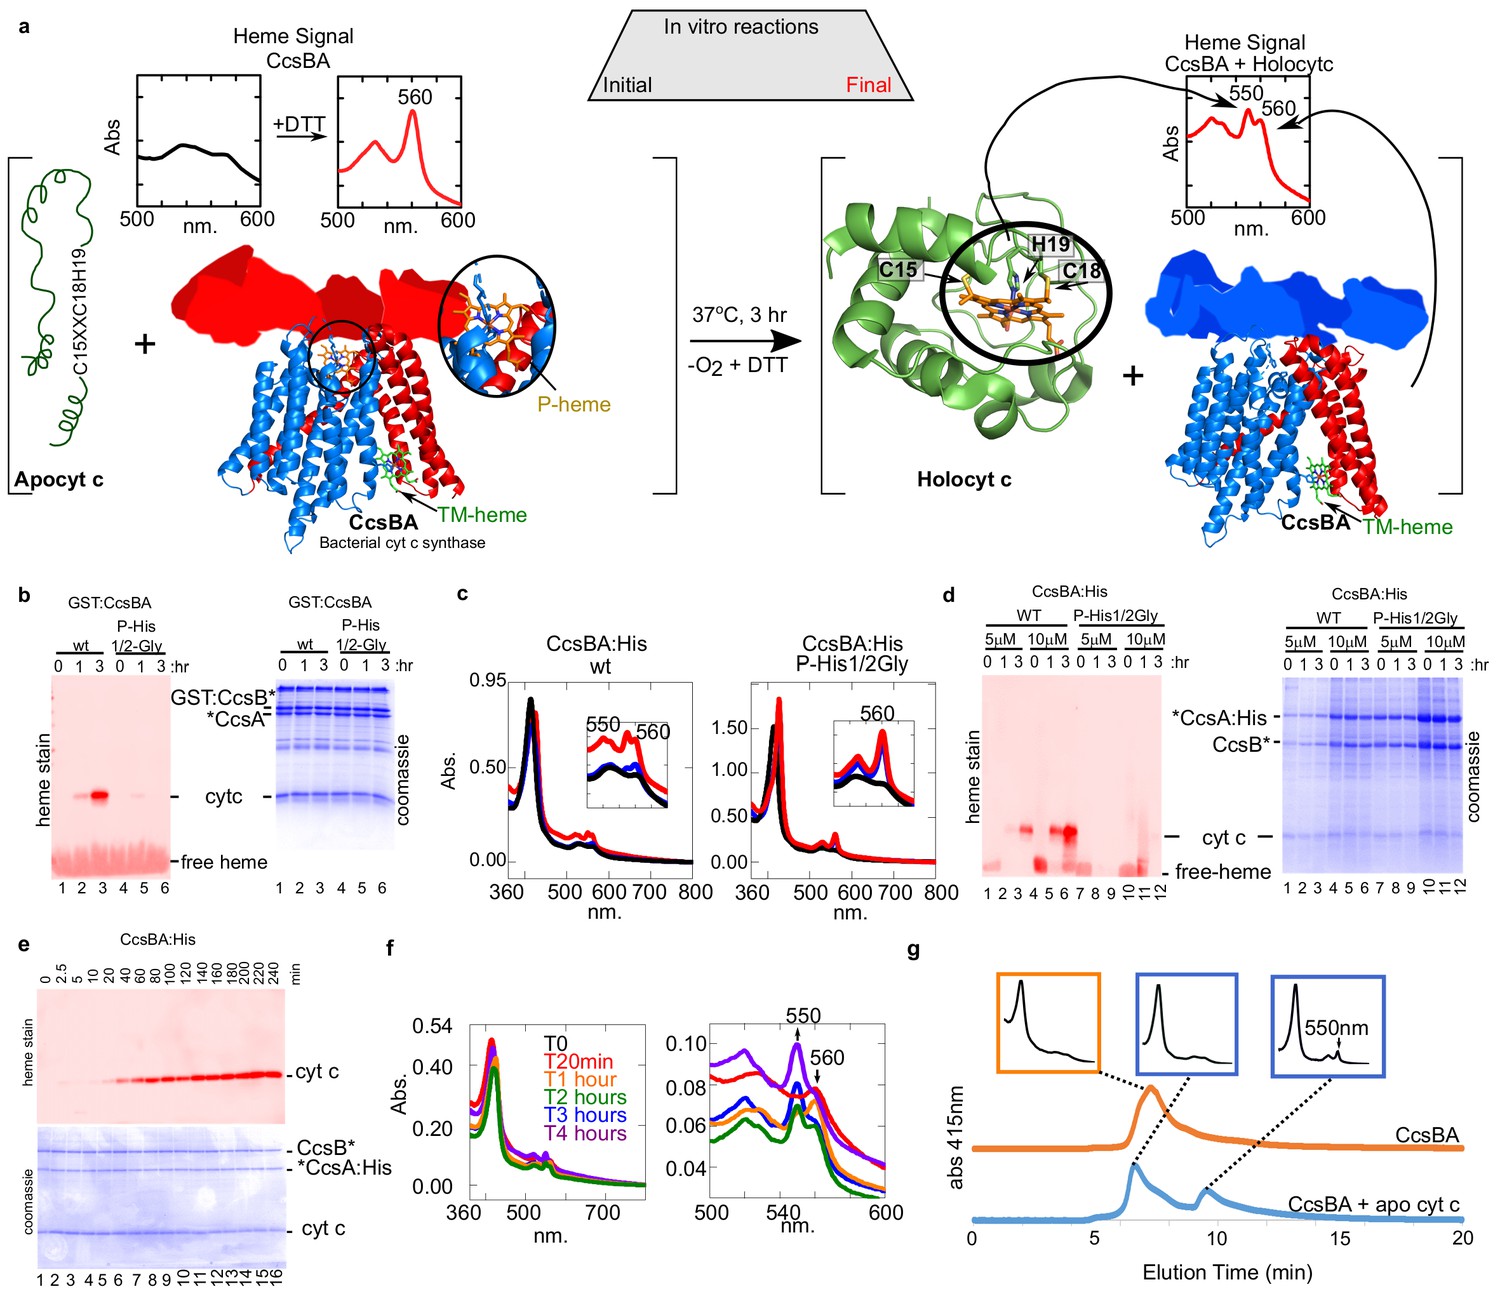
In vitro biosynthesis of cyt c by the bacterial synthase, CcsBA.
(a) Schematic of the heme attachment reaction of CcsBA with apocyt c. Note, CcsBA has two heme binding sites, one in the periplasmic WWD domain (P-heme site, orange heme) and one in the transmembrane region (TM-heme site, green heme). CcsBA is proposed to traffick heme from the TM-heme site to the P-heme site for attachment to apocyt c. CcsBA model was generated by docking the TM-region (Sutherland et al., 2018b), with a cartoon of the periplasmic region. CcsBA is combined with apocyt c under anaerobic conditions and the reaction is initiated with DTT. UV–vis spectra (insets) show the initial reaction before (black) and after addition of DTT (red). After 3 hr, reaction products are holocyt c and monoheme CcsBA. (b) In vitro reaction with WT and P-His1/2Gly GST:CcsBA (5 µM) and apocyt c (20 µM). Samples were analyzed at 0, 1, 3 hr post-addition of DTT, separated by SDS–PAGE and maturation of holocyt c monitored by heme stain. CcsBA P-His1/2Gly is defective for heme binding in the P-heme site. (c) In vitro reaction with CcsBA:His (5 or 10 µM) and apocyt c (20 µM). Black, initial spectra; blue, 1 hr; red, 3 hr; 550 nm peak indicative of holocyt c; inset shows magnification of the region. (d) Samples from (c) were analyzed at 0, 1, 3 hr post-DTT addition and analyzed as in (b, e), time course of in vitro reaction with CcsBA:His (5 µM) and apocytc (20 µM). Samples were taken at indicated timepoints and analyzed as in (b, f), UV–vis spectra of selected timepoints from (e), 550 nm peak indicative of holocyt c. Magnification of the region is shown. (g), HPLC SEC separation of CcsBA (orange) and an in vitro reaction (blue). Monitored at 412 nm to detect heme. Insets show full spectra of indicated fractions.
Figure 7 with 3 supplements
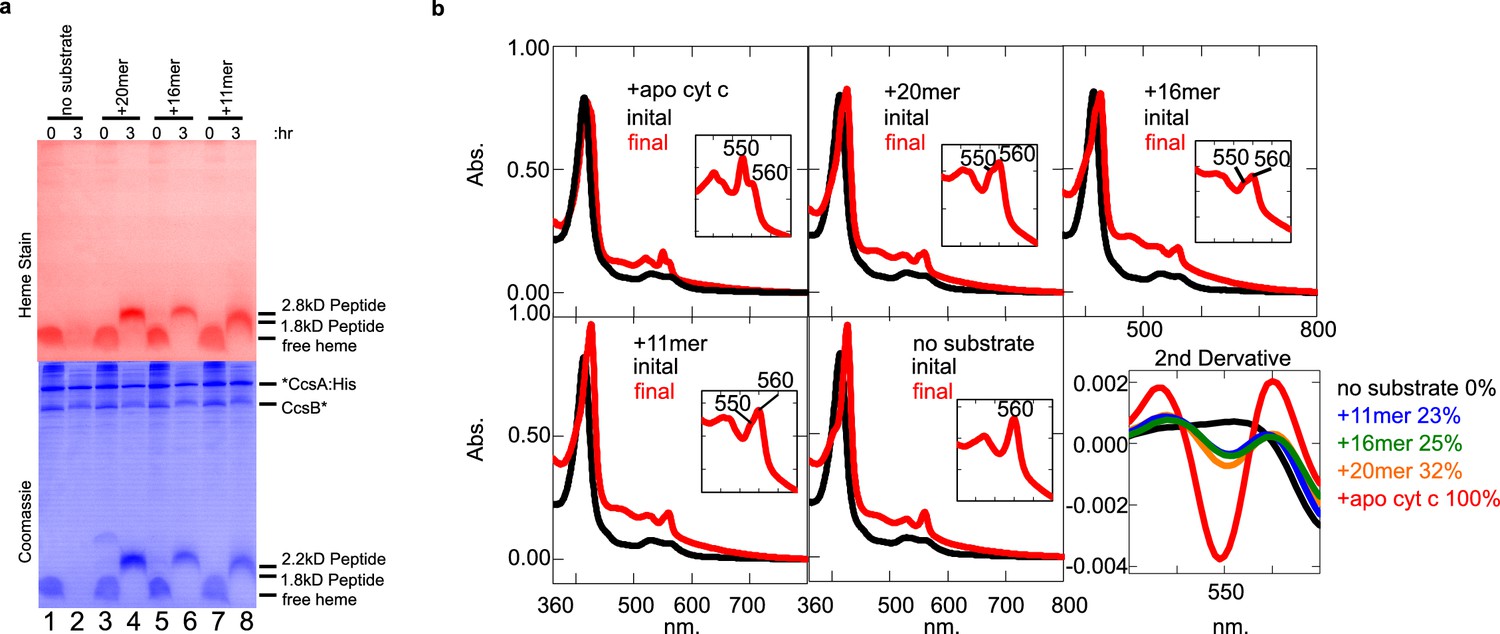
CcsBA recognition of peptides containing CXXCH for heme attachment.
Peptides are described in Figure 3a. (a) Ten micromolar of CcsBA was incubated with 20 µM of the indicated peptide for 3 hr. Samples were taken at 0 and 3 hr and separated by Tris–tricine SDS–PAGE. Heme attached peptides were detected in lanes 4, 6, and 8 of the heme-stained gel (red). Total protein stain was completed after heme stain. Thus, coomassie stain shows signal from the heme, as well as total protein (blue). (b) UV–vis spectra of the samples in (a). Peaks at 550 nm are indicative of heme attached peptides while the peak at 560 nm reflects CcsBA-bound heme, possibly in the transmembrane domain Inset shows magnification of the region. The second derivative of the spectra at 3 hr (‘final’) quantifies the signal at 550 nm, indicative of covalently attached heme. (a) and (b) are representative of three biological replicates.
Figure 7—figure supplement 1

Attachment of heme to peptides by CcsBA.
(a) In vitro assay was performed with CcsBA with the indicated peptides. The final UV–vis heme spectra is shown. A peak at 550–555 nm indicates that heme has covalently bound to cyt c peptide. Peaks at 560 nm indicate the presence of b-heme. (b) In-gel heme stains of initial and final samples separated on a 15% Tris–tricine gel demonstrate heme attachment when present. Coomassie stain was performed after heme staining and shows total protein levels in the in vitro reactions in addition to some staining left over from the heme stain. (c) ImageJ Quantitation of three sets of heme-stained gels represented in (b). Error bars are the standard deviation of the data.
-
Figure 7—figure supplement 1—source data 1
Image J Pixel analysis of heme-stained bands.
- https://cdn.elifesciences.org/articles/64891/elife-64891-fig7-figsupp1-data1-v1.xlsx
Figure 7—figure supplement 2

CcsBA and HCCS in vitro heme attachment to peptides.
(a) Heme and coomassie stain of anaerobic in vitro reactions of CcsBA and HCCS showing that CcsBA matures the 20, 16, and 11mers, while HCCS matures the 16 and 20mers under the same conditions at 3 hr. (b) The second derivative of the heme absorbance spectra of the CcsBA and peptide reactions. Minima between 550–555 is due to heme attached peptides. (c) Second derivative of HCCS and peptide reactions, showing 552–553 nm peaks due to heme-attached peptides remaining bound to HCCS, as described in the text. (d–g) CcsBA and peptide spectra initially (black) and after 3 hr (red). (h–k) HCCS and peptide spectra initially (black) and after 3 hr (red). These reactions have been performed with more than three biological replicates.
Figure 7—figure supplement 3

CcsBA anaerobic in vitro attachment of heme to CXXCH peptide variants.
C15S refers to Cys15Ser; DC15 refers to Cys15 d-Cys15 replacing l-Cys15; HoC15 refers to homocysteine replacing l-Cys15. (a) Heme stain of CcsBA and CXXCH variant 20mer peptides (red) showing that WT 20mer (lane 2) and HoC15 (lane 8) are matured. (b) The second derivative of the final reaction absorbance spectra of peptide CcsBA reactions. The matured peptides in a exhibit corresponding peaks at 550 nm in the respective spectra. (c–j) UV–vis spectra of anaerobic reaction spectra of CcsBA and CXXCH variants. The initial spectra is black and the final spectra after 3 hr is red. Peaks at 560 nm correspond to heme bound by CcsBA, while a peak shoulder at 550 nm correspond to a heme-peptide reaction. Insets magnify the -peak of the same spectra. These data are representative of three biological replicates.
Figure 8
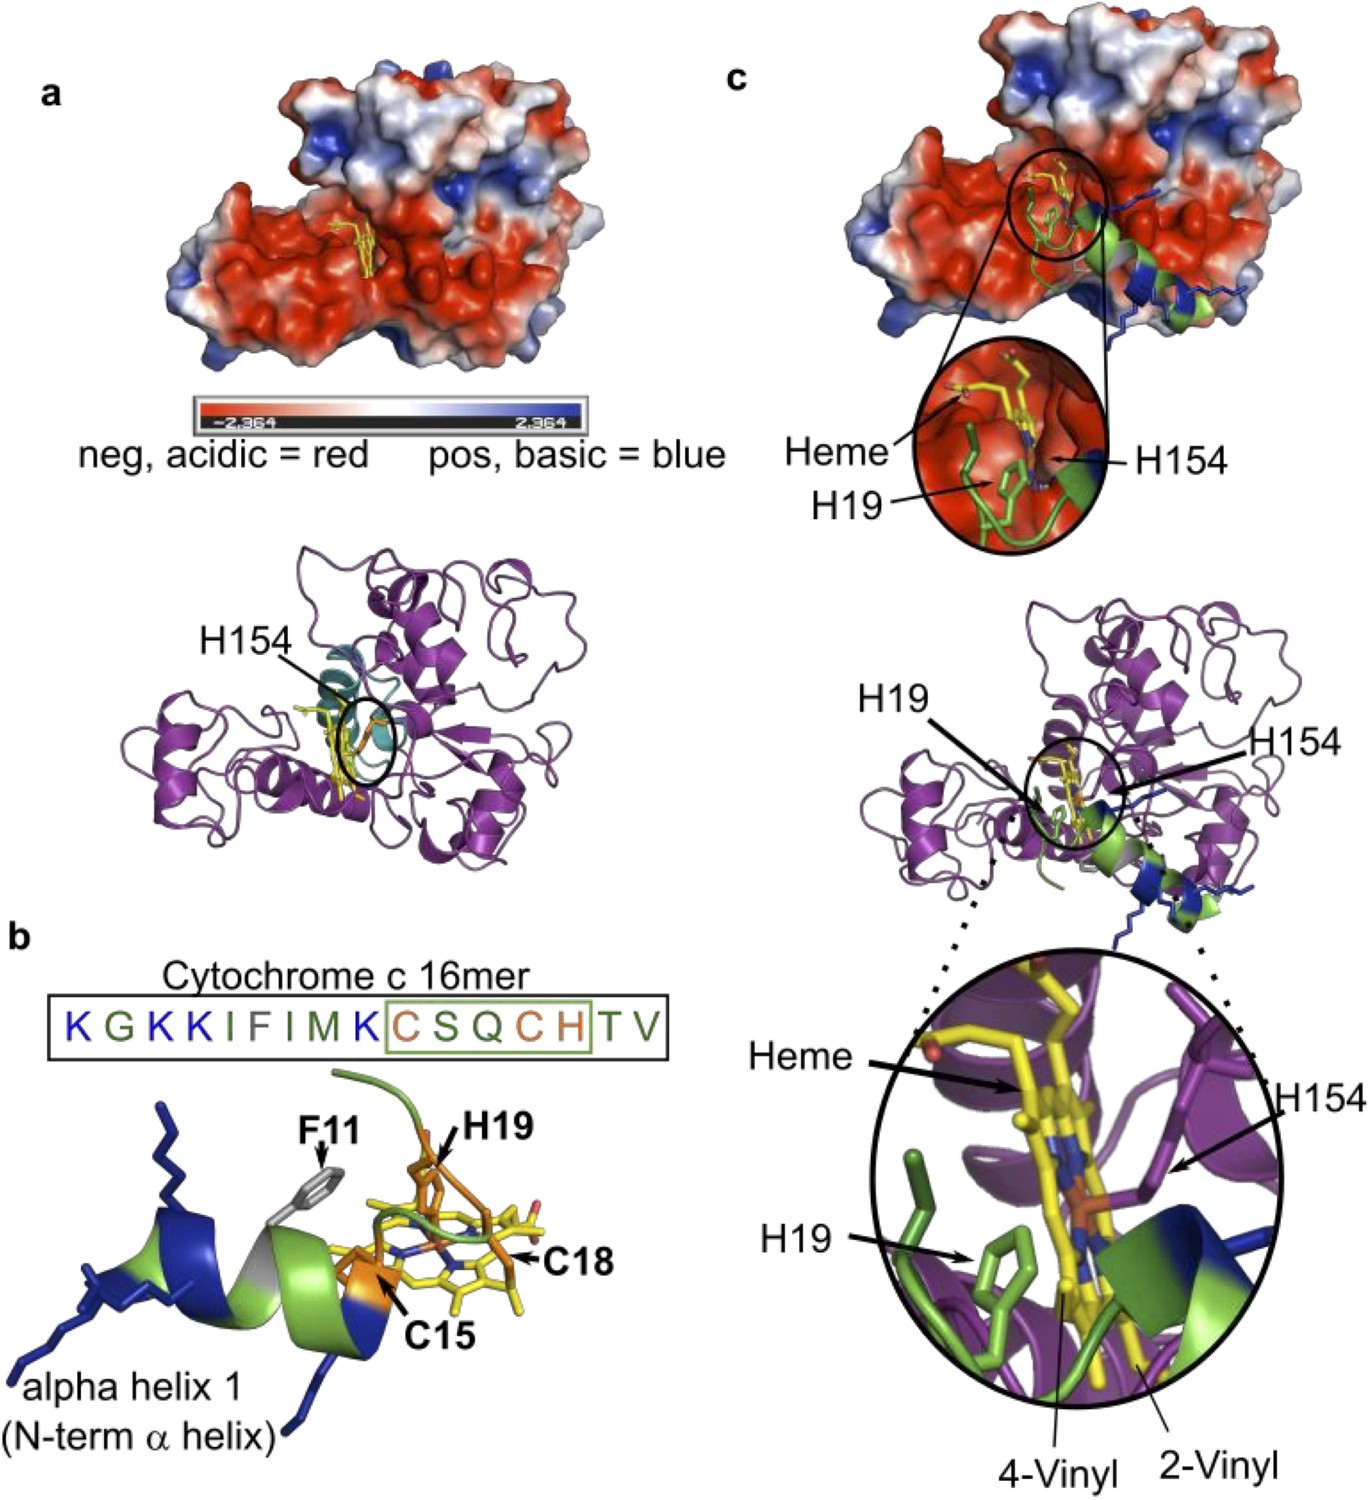
Modeled structure of HCCS using GREMLIN/Rosetta approach.
(a) Electrostatic view of HCCS structure. Acidic surfaces are red; basic surfaces are blue. Heme is modeled with H154 ligand, within a pocket surrounded by acidic residues. Ribbon diagram of HCCS structure with domain II shown in teal and heme in yellow. The axial heme ligand H154 (orange) is shown. (b) Sequence and structure of the 16mer peptide substrate from cytochrome c; structure derived from PBD 3ZCF. Heme is shown in yellow, thioether bonds to Cys15 and Cys18 are indicated in orange with His19 serving as the axial ligand to heme. Positively charged (basic) residues (K) are blue. (c) Binding of the 16mer (or apocyt c), (step 2 of the four-step model) is displayed whereby H19 of cyt c ligands heme and positions cysteines for thioether attachment. (Top) Electrostatic view and interactions of HCCS structure and 16mer cyt c peptide with key interactions with HCCS and heme (yellow) and the 16mer peptide (green). (Bottom) A ribbon diagram with key interactions between HCCS H154 (purple) and heme (yellow), as well as formation of holo16mer peptide (green).
Tables
Table 1
Attachment of heme to peptides* by HCCS and CcsBA.
| HCCS | CcsBA | |||||||
|---|---|---|---|---|---|---|---|---|
| Peptide name | Peptide sequence | Attachment | α-Peak (nm) | # cov attachments** |
Attachment | α-Peak (nm) | # cov attachments** |
|
|
Minimal recognition primary/secondary sequences (lengths) | |||||||
| HH Cyt c | …GDVEKGKKIFVQK AQHTVE… | Attached | 550 | 2 | Attached | 550, 560 | 2 | |
| 56-mer | GDVEKGKKIFIMK SQHTVEKGGKHKTGPNLHGLFGRKTGQAPGYSYTAANKNKG | Attached | 555 | 2 | Attached | 550, 560 | 2 | |
| 20 mer | GDVEKGKKIFIMK SQHTV | Attached | 553–554 | 2*** | Attached | 550, 560 | 2 | |
| 16 mer | KGKKIFIMK SQHTV | Attached | 552 | 2 | Attached | 551, 560 | 2 | |
| 11 mer | IMK SQHTVE | Not attached | 559 | 0 | Attached | 550, 560 | 2 | |
| nine mer | K SQHTVE | Not attached | 559 | 0 | Attached | 550, 560 | 2 | |
| Cysteine substitutions | ||||||||
| 20 mer Cys15S | GDVEKGKKIFIMK SQHTV | Attached | 555,559.5 | 1*** | Not attached | n.a. | 0 | |
| 20 mer DCys15 | GDVEKGKKIFIMK()SQHTV | Attached | 555 | 2*** | Not attached | 560 | 0 | |
| 20 mer HoCys15 | GDVEKGKKIFIMK SQHTV | Attached | 555 | 1*** | Attached | 550, 560 | 2 | |
| 20 mer Cys18S | GDVEKGKKIFIMK SQHTV | Attached | 559 | 1*** | Not attached | 560 | 0 | |
| 20 mer DCys18 | GDVEKGKKIFIMK SQ(HTV | Attached | 554 | 1*** | Not attached | 560 | 0 | |
| 20 mer HoCys18 | GDVEKGKKIFIMK SQHTV | Attached | 558 | 1*** | Not attached | 560 | 0 | |
| 20 mer Cys15S/Cys18S | GDVEKGKKIFIMK SQHTV | Not attached | 559 | 0 | Not attached | 560 | 0 | |
| Histidine (of CXXCH) and lysine (K→D) substitutions for testing interaction models | ||||||||
| 20mer H19A | GDVEKGKKIFIMK SQATV | Not attached | 560 | 0 | Not attached | 560 | 0 | |
| 20mer H19M | GDVEKGKKIFIMK SQMTV | Attached | 559 | 2 | Not attached | 560 | 0 | |
| 20mer H19K | GDVEKGKKIFIMK SQKTV | Not attached | 560 | 0 | Not attached | 560 | 0 | |
| 20mer K6A, K8D, K9D, K14D | GDVEAGDDIFIMD SQHTV | Not attached | 560 | 0 | Not attached | 560 | 0 | |
-
*Supplementary file 2 contains additional information about peptides, eg. purity, synthesis co, and presence or absence of an N-terminal biotin-AHX tag.
**Number of covalent attachments determined by the final reaction spectra absorbance blue shifted from 560 nm and the presence of a heme stainable peptide.
-
***Pyridine hemochrome was performed to determine this number.
Key resources table
| Reagent type (species) or resource |
Designation | Source or reference | Identifiers | Additional information |
|---|---|---|---|---|
| Strain, strain background (Escherichia coli) | NEB 5-α | New England Biolabs | fhuA2 Δ(argF-lacZ)U169 phoA glnV44 Φ80 Δ(lacZ)M15 gyrA96 recA1 relA1 endA1 thi-1 hsdR17 | Electrocompetent cells |
| Strain, strain background (E. coli) | C43(DE3) | doi:10.1006/jmbi.1996.0399; Miroux and Walker, 1996 | F – ompT hsdSB (rB- mB-) gal dcm (DE3) | Electrocompetent cells |
| Strain, strain background (E. coli) | RK103 | doi:10.1111/j.1365–2958.2006.05132.x | MG1655 Δccm::kanR , deleted for all ccm genes | Electrocompetent cells, protein expression, functional assays |
| Strain, strain background (E. coli) | MS36 | doi:10.1128/mBio.02134–18 | C43 Δccm::kanR , deleted for all ccm genes | Electrocompetent cells, protein expression, functional assays |
| Antibody | Anti-equine heart cytochromec (Rabbit polyclonal) | doi:10.1074/jbc.M116.741231 | (1:10,000) | |
| Recombinant DNA reagent | pRGK332 (plasmid) | doi:10.1111/j.1365–2958.2006.05132.x | pBAD Bordetella pertussis cytochrome c4:His | |
| Recombinant DNA reagent | pRGK368 (plasmid) | doi:10.1128/JB.01388–06; Richard-Fogal et al., 2007 | pGEX Helicobacter hepaticus GST:CcsBA | |
| Recombinant DNA reagent | pRGK403 (plasmid) | doi:10.1073/pnas.1213897109 | pGEX GST:HCCS | |
| Recombinant DNA reagent | pRGK420 (plasmid) | doi:10.1073/pnas.1213897109 | pGEX GST:HCCS H154A | |
| Recombinant DNA reagent | pMCS97 (plasmid) | This study | pGEX H. hepaticus GST:CcsBA:His | See Materials and Methods and Supplementary file 1 |
| Recombinant DNA reagent | pMCS64 (plasmid) | This study | pGEX H. hepaticus GST*CcsBA:His | See Materials and Methods and Supplementary file 1 |
| Recombinant DNA reagent | pMCS154 (plasmid) | doi:10.1128/mBio.02134–18 | pGEX H. hepaticus GST:CcsBA:His | |
| Recombinant DNA reagent | pMCS558 (plasmid) | This study | pGEX H. hepaticus *CcsBA:His | See Materials and Methods and Supplementary file 1 |
| Recombinant DNA reagent | MCS598 (plasmid) | This study | pGEX H. hepaticus GST*CcsBA:His P-His1/2G | See Materials and Methods and Supplementary file 1 |
| Sequence-based reagent | pGEX GST*F | This study | PCR Primer | tcggatctggttccgcgttgaaggaggaaggatccatgatgaat |
| Sequence-based reagent | pGEX GST*R | This study | PCR Primer | attcatcatggatccttcctccttcaacgcggaaccagatccga |
| Sequence-based reagent | pGEX CcsBA 6HisF | This study | PCR Primer | gagtgcttgatatgccccatttacatcaccatcaccatcactaactcgagcggc |
| Sequence-based reagent | pGEX CcsBA 6HisR | This study | PCR Primer | gccgctcgagttagtgatggtgatggtgatgtaaatggggcatatcaagcactc |
| Sequence-based reagent | MSP5 | This study | PCR Primer | gtgcttaaatcttattggctcaacattggcgtctccgtcatca |
| Sequence-based reagent | MSP6 | This study | PCR Primer | tgatgacggagacgccaatgttgagccaataagatttaagcac |
| Sequence-based reagent | MSP7 | This study | PCR Primer | ttattatctcacaggtatgggcagctatgccgcaggagaa |
| Sequence-based reagent | MSP8 | This study | PCR Primer | ttctcctgcggcatagctgcccatacctgtgagataataa |
| Peptide, recombinant protein | Holo-MP11 | Sigma-Aldrich | Cat. #M6756 | See Supplementary file 2 |
| Peptide, recombinant protein | Biotin-56-mer | RS-synthesis | See Supplementary file 2 | |
| Peptide, recombinant protein | Biotin-20 mer | RS-synthesis | See Supplementary file 2 | |
| Peptide, recombinant protein | 20-mer | RS-synthesis | See Supplementary file 2 | |
| Peptide, recombinant protein | Biotin-16 mer | RS-synthesis | See Supplementary file 2 | |
| Peptide, recombinant protein | 11 mer | RS-synthesis | See Supplementary file 2 | |
| Peptide, recombinant protein | nine mer-biotin | RS-synthesis | See Supplementary file 2 | |
| Peptide, recombinant protein | 20 mer Cys15S | RS-synthesis | See Supplementary file 2 | |
| Peptide, recombinant protein | 20 mer DCys15 | CS Bio Co | See Supplementary file 2 | |
| Peptide, recombinant protein | 20 mer HoCys15 | CS Bio Co | See Supplementary file 2 | |
| Peptide, recombinant protein | 20 mer Cys18S | CS Bio Co | See Supplementary file 2 | |
| Peptide, recombinant protein | 20 mer DCys18 | CS Bio Co | See Supplementary file 2 | |
| Peptide, recombinant protein | 20 mer HoCys18 | CS Bio Co | See Supplementary file 2 | |
| Peptide, recombinant protein | 20 mer Cys15S/Cys18S | CS Bio Co | See Supplementary file 2 | |
| Peptide, recombinant protein | 20mer H19A | RS-synthesis | See Supplementary file 2 | |
| Peptide, recombinant protein | 20mer H19M | RS-synthesis | See Supplementary file 2 | |
| Peptide, recombinant protein | 20mer H19K | RS-synthesis | See Supplementary file 2 | |
| Peptide, recombinant protein | 20mer K6A, K8D, K9D, K14D | RS-synthesis | See Supplementary file 2 | |
| Peptide, recombinant protein | Pierce-glutathione agarose | Thermo Scientific | Cat. #16101 | |
| Peptide, recombinant protein | Talon Resin | TaKaRa | Cat. #635503 | |
| Chemical compound, drug | Hematin | Fisher | Cat. #AAA1851803 | |
| Chemical compound, drug | N, N, N’, N’-tetramethylbenzidine (TMBZ) | Sigma | Cat. #1086220001 | |
| Chemical compound, drug | Equine horse-heart cytochrome c | Sigma | Cat. #C2506 | |
| Chemical compound, drug | 2,6-dichloroindophenolate hydrate (DCPIP) | Sigma | Cat. #D-1878 | |
| Commercial assay or kit | Pierce-SuperSignal West Femto ECL reagent | Thermo Scientific | Cat. #PI34096 |
Additional files
-
Supplementary file 1
Relevant strains, plasmids, and primers.
- https://cdn.elifesciences.org/articles/64891/elife-64891-supp1-v1.docx
-
Supplementary file 2
Apo peptides used for in vitro assays.
- https://cdn.elifesciences.org/articles/64891/elife-64891-supp2-v1.docx
-
Transparent reporting form
- https://cdn.elifesciences.org/articles/64891/elife-64891-transrepform-v1.docx
Download links
A two-part list of links to download the article, or parts of the article, in various formats.
Downloads (link to download the article as PDF)
Open citations (links to open the citations from this article in various online reference manager services)
Cite this article (links to download the citations from this article in formats compatible with various reference manager tools)
In vitro reconstitution reveals major differences between human and bacterial cytochrome c synthases
eLife 10:e64891.
https://doi.org/10.7554/eLife.64891


