The Prop1-like homeobox gene unc-42 specifies the identity of synaptically connected neurons
- Department of Biological Sciences, Columbia University, Howard Hughes Medical Institute, United States
- Department of Statistics, Zuckerman Institute, Columbia University, United States
- Dominick P. Purpura Department of Neuroscience, Albert Einstein College of Medicine, United States
- Department of Biological Sciences, University at Buffalo, The State University of New York, United States
Figures
Figure 1 with 2 supplements
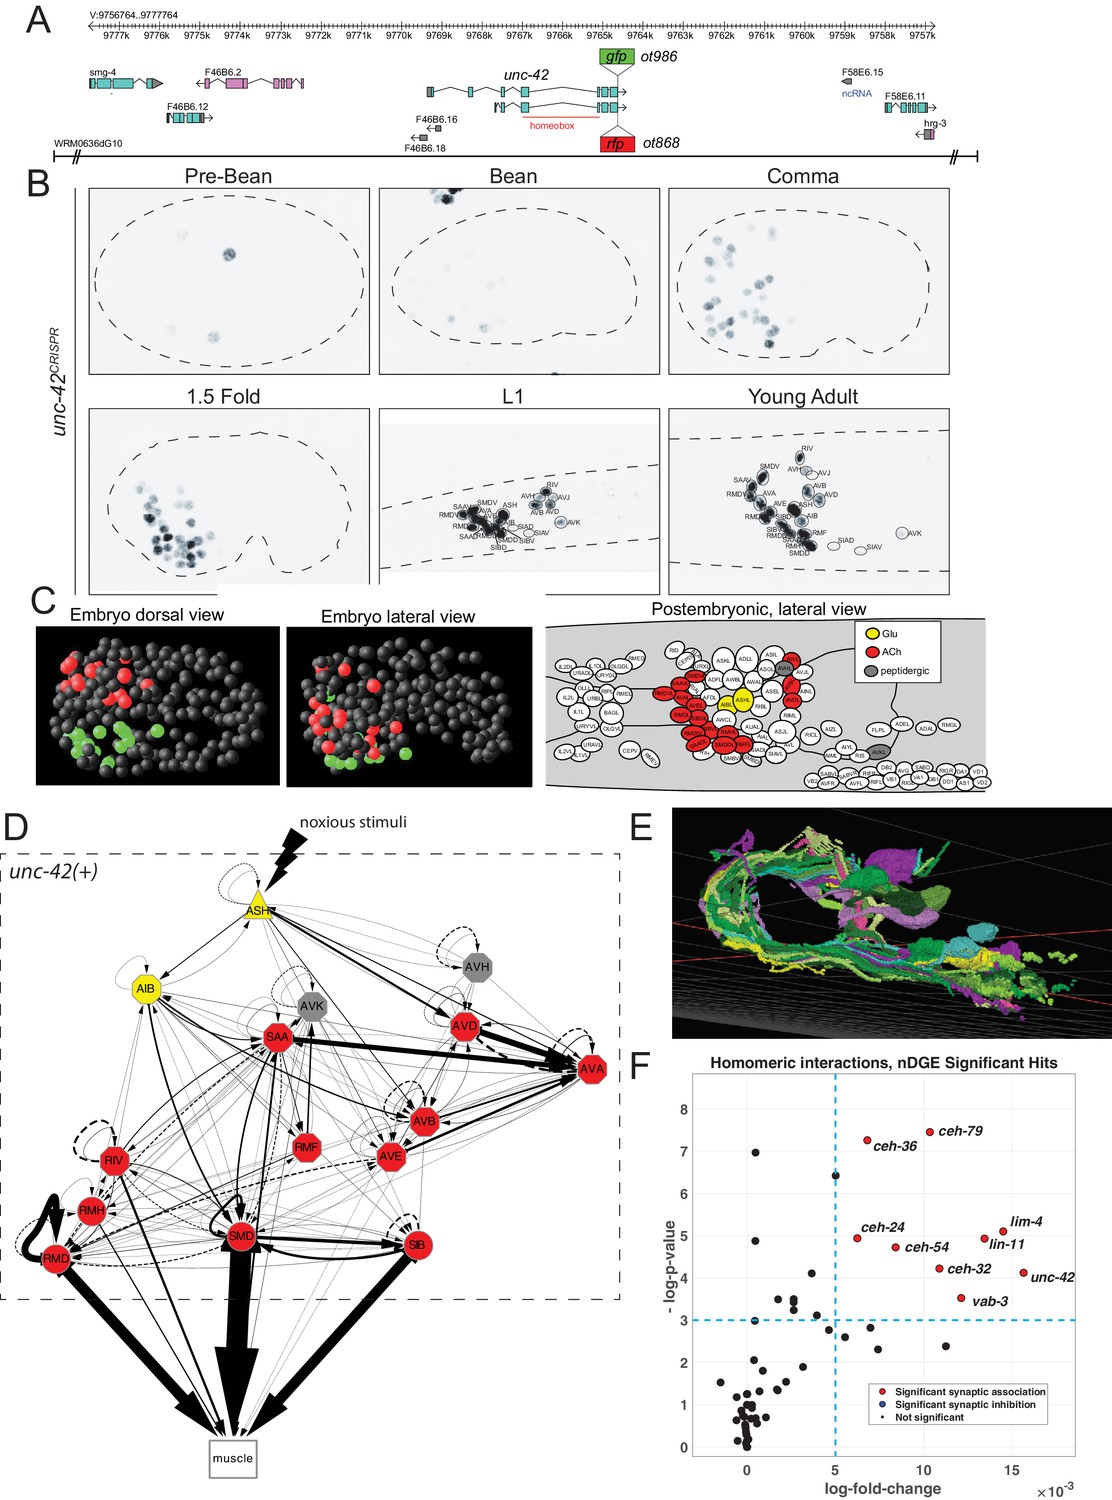
unc-42 is expressed in synaptically connected neurons of a nociceptive reflex circuit.
(A) unc-42 reporters used in this study. (B) unc-42 CRISPR-engineered reporter (ot986) expression over the course of development. The unc-42 fosmid reporter shows the same expression in the adult (Reilly et al., 2020). Incomplete expression patterns of unc-42 were previously reported (Baran et al., 1999; Pereira et al., 2015). See also Supplementary file 1. (C) Summary of unc-42-positive cells in embryonic and postembryonic stages. Color coding in the right panel (lateral view of postembryonic stage) indicates neurotransmitter identity, while the color coding in the embryo (middle, left panel) indicates left vs. right bilaterally homologous neurons. (D) Circuit diagram showing all unc-42-postive neurons by neuron class (note that only one neuron per class is shown, all neurons are at least bilaterally, in some cases, fourfold-radially symmetric, hence the total of 40 neurons that fall into 15 classes). Color coding is again based on neurotransmitter identity. The display is by Cytoscape (https://cytoscape.org/). Nodes are arranged hierarchically, as described (Cook et al., 2019). Node shapes are shown as triangles, sensory neurons; hexagons, interneurons; circles, motor neurons; rectangle, head and neck muscles. Directed edges (arrows) represent chemical synapses. Undirected edges (dashed lines) represent electrical synapses. The width of the edge is proportional to the weight of the connection (the number of serial section electron micrographs where a synaptic specialization is observed). (E) All unc-42(+) neurons project to the same neuropil, the nerve ring, where synaptic connections are made. The 3D rendering, which only shows all neurons on the left side of the animal (many of which projecting in the neuropil to the contralateral side of the animal), is based on EM reconstructions and has been generated using at https://www.wormwiring.org (Cook et al., 2019). (F) Volcano plot of network differential gene expression (NDGE) analysis on the homeobox gene family, showing the significant homomeric gene interactions associated with synaptic linking (red circles). The X-axis denotes the log-fold gene co-expression difference in synaptically partnered neurons versus non-synaptic neuron pairs. Y-axis shows the negative log-p-value. Red dots indicate gene interactions that have survived the false discovery rate procedure (p<0.05) and log-fold change thresholding (log-FC > 6e-3), while black dots indicate those who did not. Note that log-fold change threshold is lower than traditional thresholding in standard differential gene expression analysis due to the requirement that the selected genes are present in both neurons, a combinatorically rarer event. unc-42 is indicated to be a significant homomeric gene interaction that is associated with synaptic linking.
Figure 1—figure supplement 1
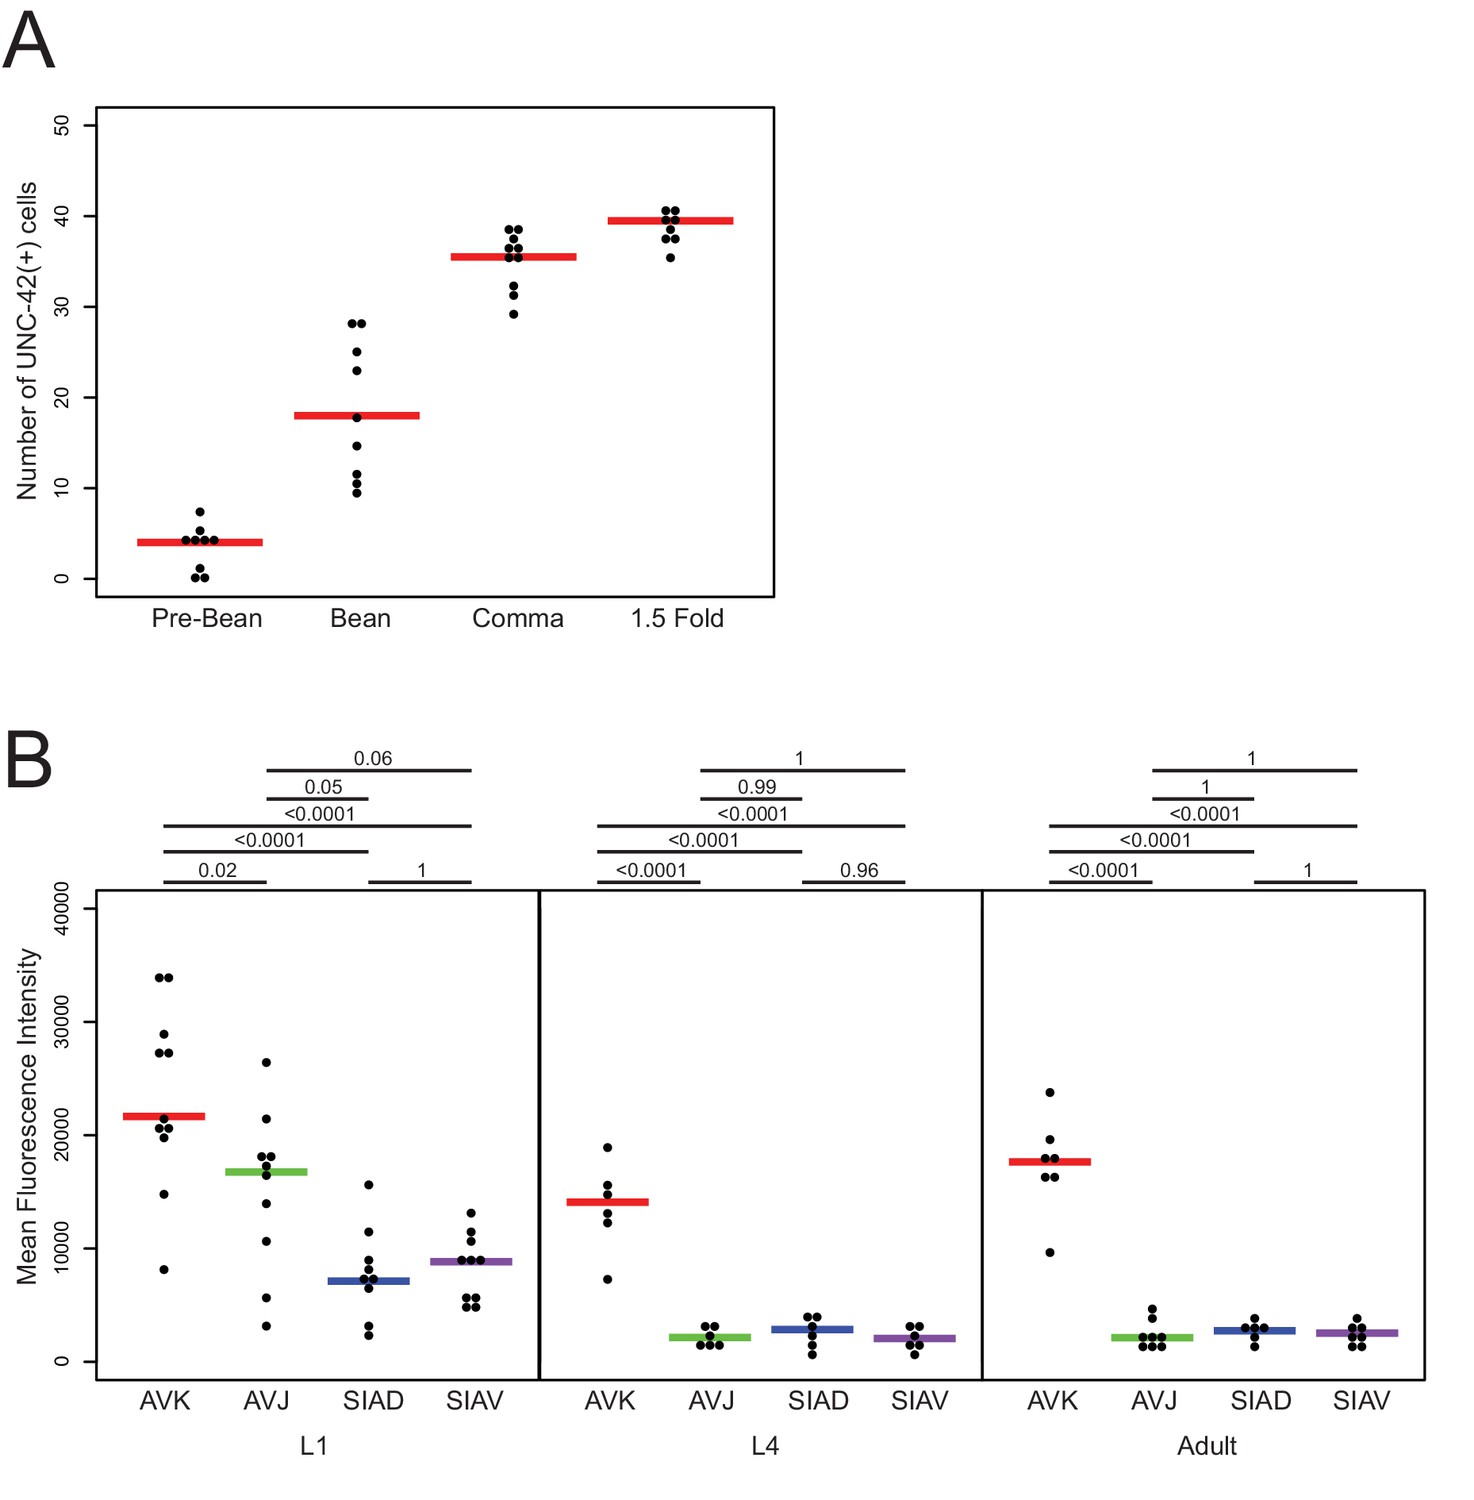
unc-42 expression quantification.
(A) Quantification of the number of neurons observed at each embryonic stage in the unc-42 CRISPR reporter (ot986). Each circle represents one animal. Red lines indicate the median. (B) Quantification of the mean fluorescence intensity of the AVK, AVJ, SIAD, and SIAV neurons at L1, L4, and adult in the unc-42 CRISPR reporter (ot986). Each circle represents one animal. Colored lines indicate the median. p-values shown by one-way ANOVA followed by Tukey’s multiple comparisons test.
Figure 1—figure supplement 2
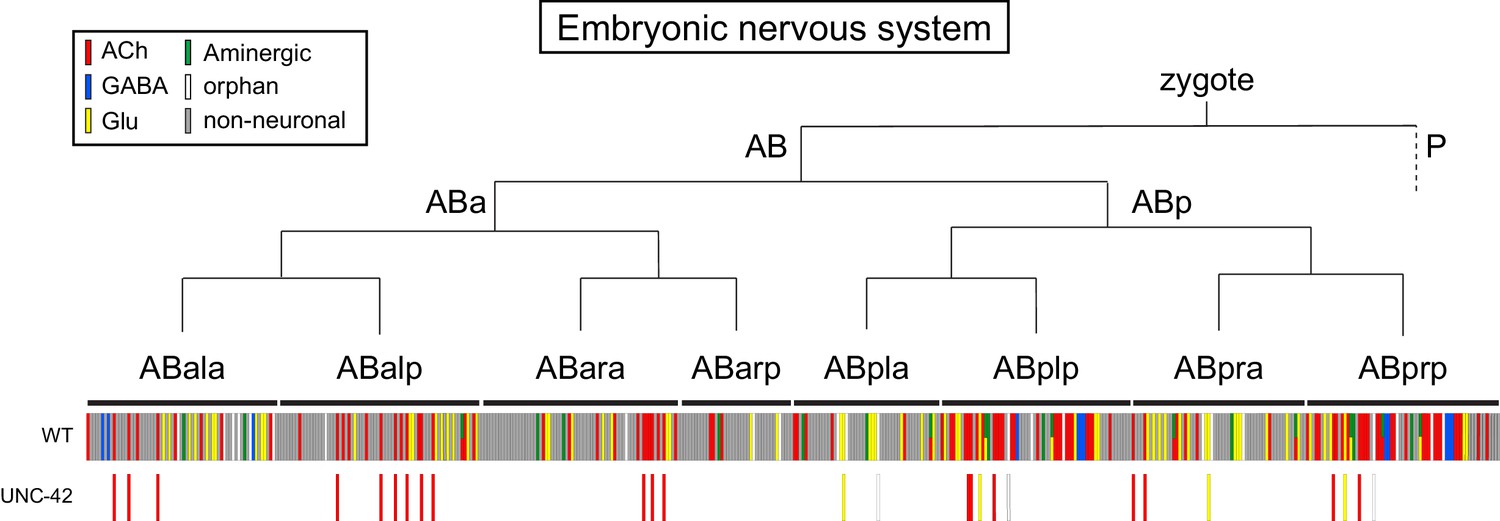
unc-42 expression does not follow lineage history.
unc-42 expression is superimposed on the embryonic lineage of C. elegans (Sulston et al., 1983), with each line indicating one cell.
Figure 2

Motion and posture defects in unc-42 mutants.
Individual motion and posture features were compared between wild type, unc-42(e419), and unc-42(e419) rescue (unc-42(e419); otEx7280[unc-42fosmid]) using the WormTracker. Each circle represents the experimental mean of a single worm. Red lines indicate the median of means. One-way ANOVA followed by Tukey’s multiple comparisons test is shown for each comparison. Time ratio = (total time spent performing behavior)/(total assay time).
Figure 3
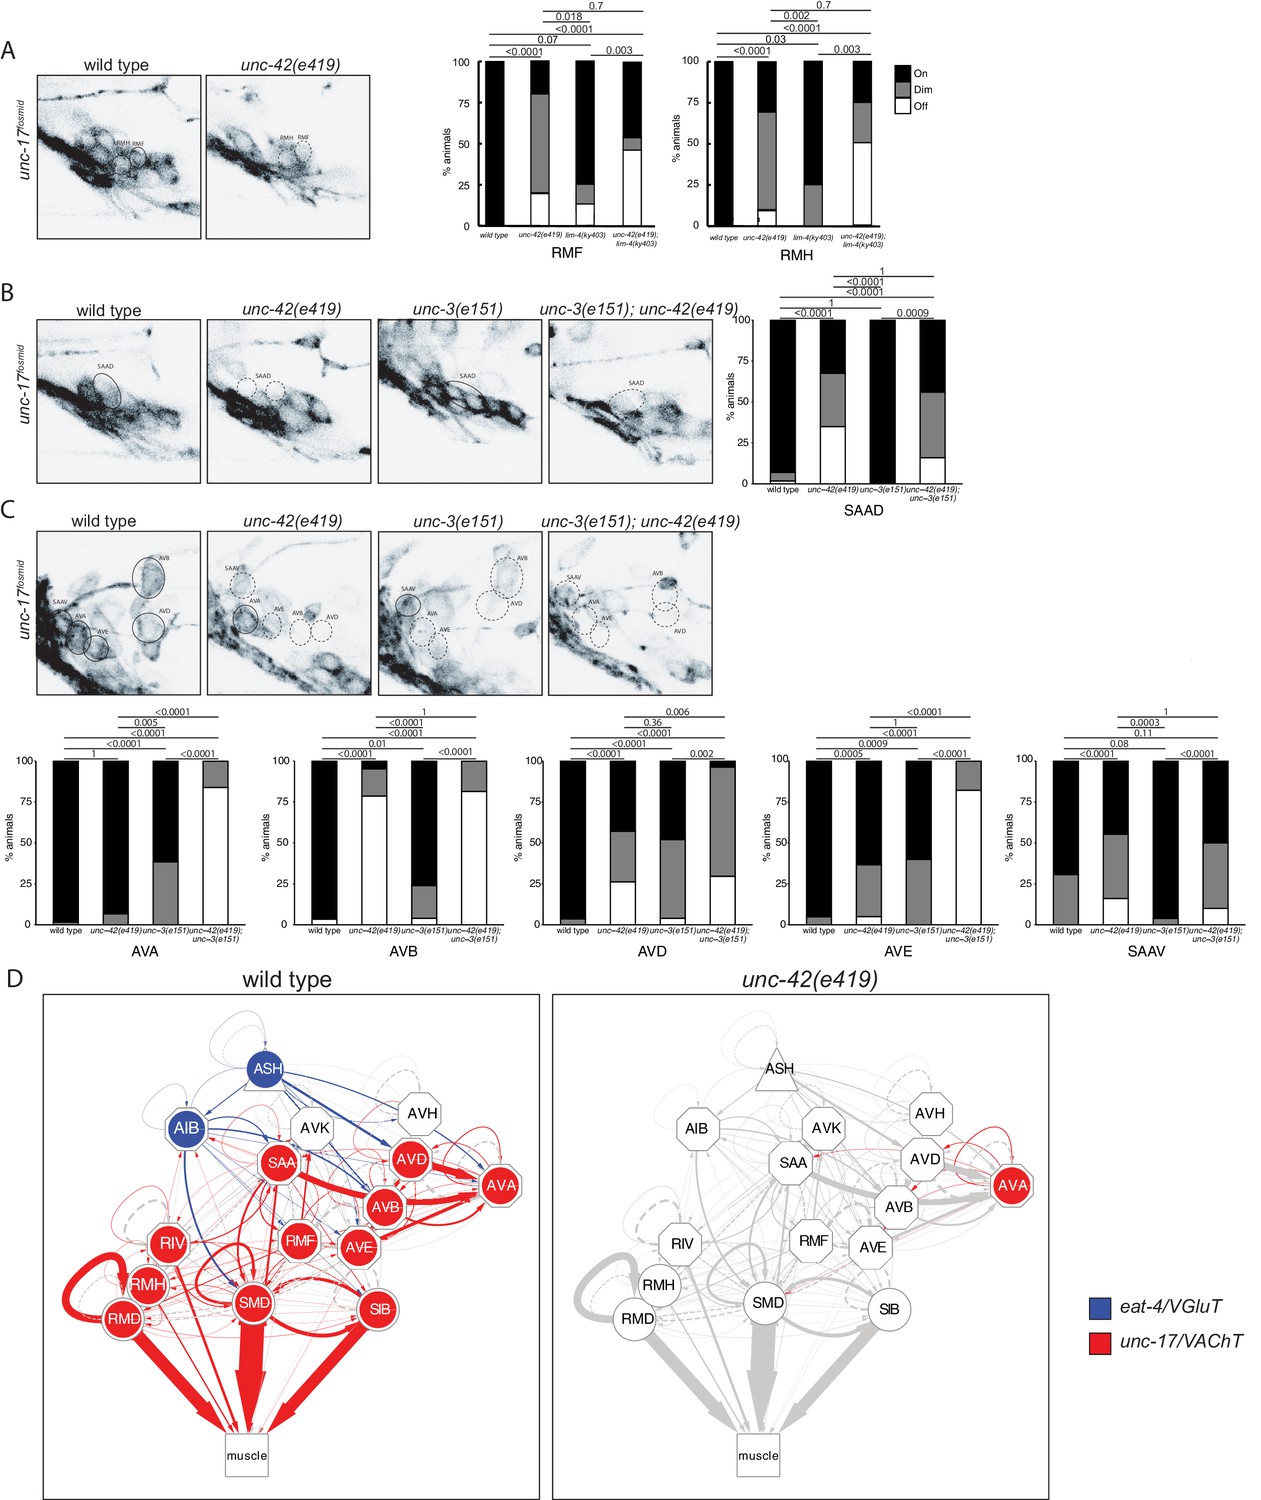
unc-42 affects neurotransmitter identity.
(A) The expression of the unc-17/VAChT fosmid reporter in RMF and RMH neurons is mildly affected in unc-42 and lim-4 single mutants, but enhanced in unc-42; lim-4 double mutants. (B, C) The expression of the unc-17 fosmid reporter in unc-42 and unc-3 single mutants and in unc-42; unc-3 double mutants. (A–C) A solid circle indicates expression, and a dashed circle indicates absence of expression. p-values shown by Fisher’s exact test. n = 62 wild type, 12 unc-42(e419), 14 lim-4(ky403), 14 unc-42(e419); lim-4(ky403), 26 unc-3(e151), and 32 unc-42(e419); unc-3(e151) animals. (D) Circuit diagram summarizing the effect of unc-42 on neurotransmitter identity. eat-4 data is from Serrano-Saiz et al., 2013 and Bhattacharya et al., 2019. unc-17 data in SIB, SMD, RIV, and RMD is from Pereira et al., 2015. The display is by Cytoscape (https://cytoscape.org/). Nodes are colored to illustrate eat-4 (blue) and unc-17 (red) expression. Nodes lose coloring when eat-4 or unc-17 expression is affected in an unc-42 mutant. Edges are colored if the source neuron expresses either eat-4 or unc-17. Edges lose coloring when eat-4 or unc-17 expression is affected in the source neuron in unc-42 mutants (irrespective of whether those effects are partial effects or not). However, note that in this and ensuing circuit diagrams, the existence of gray edges does not indicate whether those edges are generated properly in unc-42 mutants. Nodes are arranged hierarchically, as described (Cook et al., 2019). Node shapes are shown as triangles, sensory neurons; hexagons, interneurons; circles, motor neurons; rectangle, head and neck muscles. Directed edges (arrows) represent chemical synapses. Undirected edges (dashed lines) represent electrical synapses. The width of the edge is proportional to the weight of the connection (the number of serial section electron micrographs where a synaptic specialization is observed).
Figure 4

unc-42 affects ionotropic glutamate receptor expression.
(A) The expression of a nmr-1 transgene reporter is lost in the AVD neurons in unc-42 mutants. n = 8 wild type and 69 unc-42(e419) animals. (B) A glr-2 reporter transgene shows expression defects in the AIB neurons in the absence of unc-42. n = 26 wild type and 28 unc-42(e419) animals. (C) In the absence of unc-42, the AIB, RMD, RMDD, RMDV, SMDD, and SMDV neurons do not show glr-1 transgene reporter expression. (D) The AVD neurons lose expression of the glr-1 transgene reporter in unc-42 and unc-42; unc-3 mutants, but not in unc-3 mutants. (C, D) n = 22 wild type and 24 unc-42(e419) animals, 14 unc-3(e151), and 10 unc-42(e419); unc-3(e151) animals. (E) The expression of a glr-4 reporter transgene is lost in the SAAD, SAAV, SMDD, and SMDV neurons in unc-42 mutants. n = 26 wild type and 28 unc-42(e419) animals. (F) The AVB and SAAV neurons lose expression of the glr-5 fosmid transgene reporter in unc-42 and unc-42; unc-3 mutants, but not in unc-3 mutants. The expression of the glr-5 fosmid transgene reporter in the AVD and SAAD neurons is lost in unc-42, unc-3, and unc-42; unc-3 mutants. (G) In the absence of unc-42, the AIB, AVK, RMD, RMDD, RMDV, RMH, SIBD, SIBV, SMDD, and SMDV neurons do not show glr-5 fosmid transgene reporter expression. (F, G) n = 24 wild type, 34 unc-42(e419), and 7 unc-3(e151) and 22 unc-42(e419); unc-3(e151) animals. (A–G) A solid circle indicates expression, and a dashed circle indicates absence of expression. p-values shown by Fisher’s exact test.
Figure 5
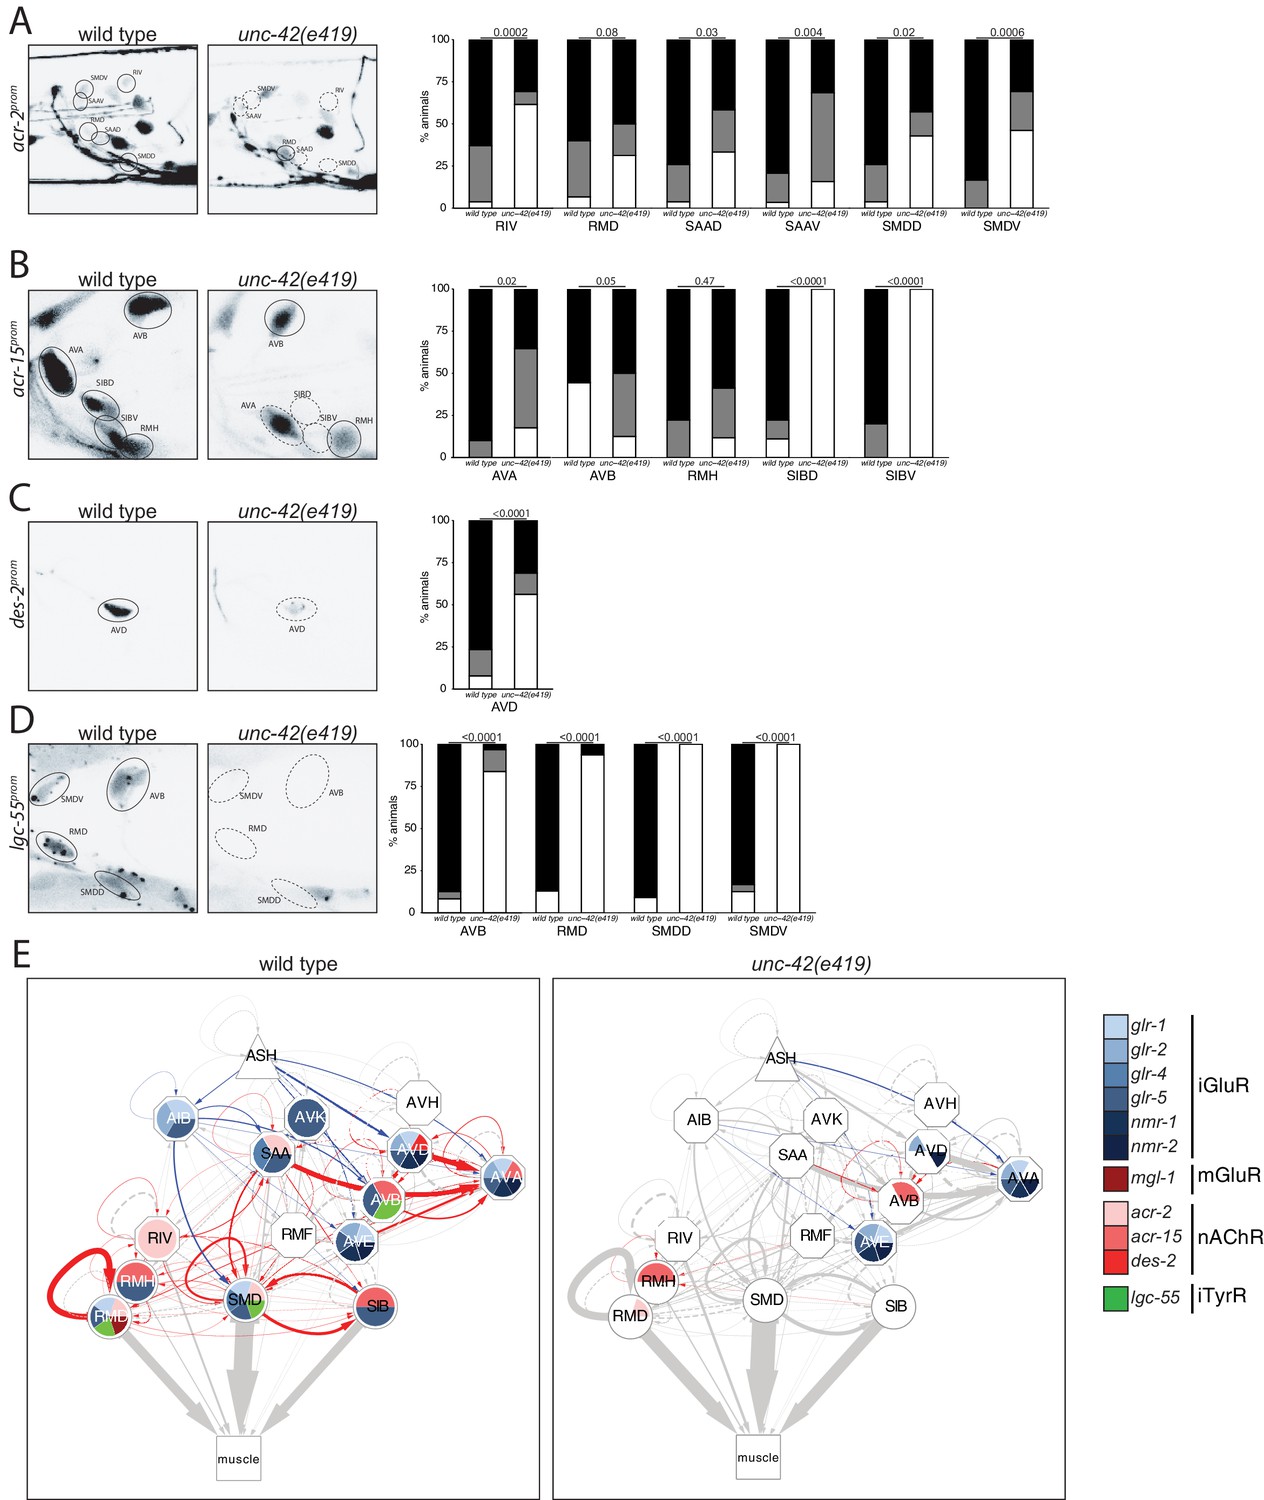
unc-42 affects ionotropic acetylcholine and tyramine receptor expression.
(A) In the absence of unc-42, the RIV, SAAD, SAAV, SMDD, and SMDV neurons do not show acr-2 transgene reporter expression. n = 30 wild type and 20 unc-42(e419) animals. (B) An acr-15 reporter transgene shows expression defects in the AVA, SIBD, and SIBV neurons in the absence of unc-42. n = 10 wild type and 18 unc-42(e419) animals. (C) The expression of a des-2 transgene reporter is affected in the AVD neurons in unc-42 mutants. n = 64 wild type and 64 unc-42(e419) animals. (D) A lgc-55 reporter transgene shows expression defects in the AVB, RMD, SMDD, and SMDV neurons in the absence of unc-42. n = 26 wild type and 37 unc-42(e419) animals. (A–D) A solid circle indicates expression, and a dashed circle indicates absence of expression. p-values shown by Fisher’s exact test. (E) Circuit diagram summarizing the effect of unc-42 on neurotransmitter receptor expression as shown in Figure 4. nmr-2 data is from Brockie et al., 2001, and mgl-1 data is from Pereira et al., 2015. See legend to Figure 3 for more information on features of circuit diagram. Edges are colored when the source neuron expresses either eat-4 or unc-17 and the target neuron has the appropriate neurotransmitter receptor (see Figure 3).
Figure 6
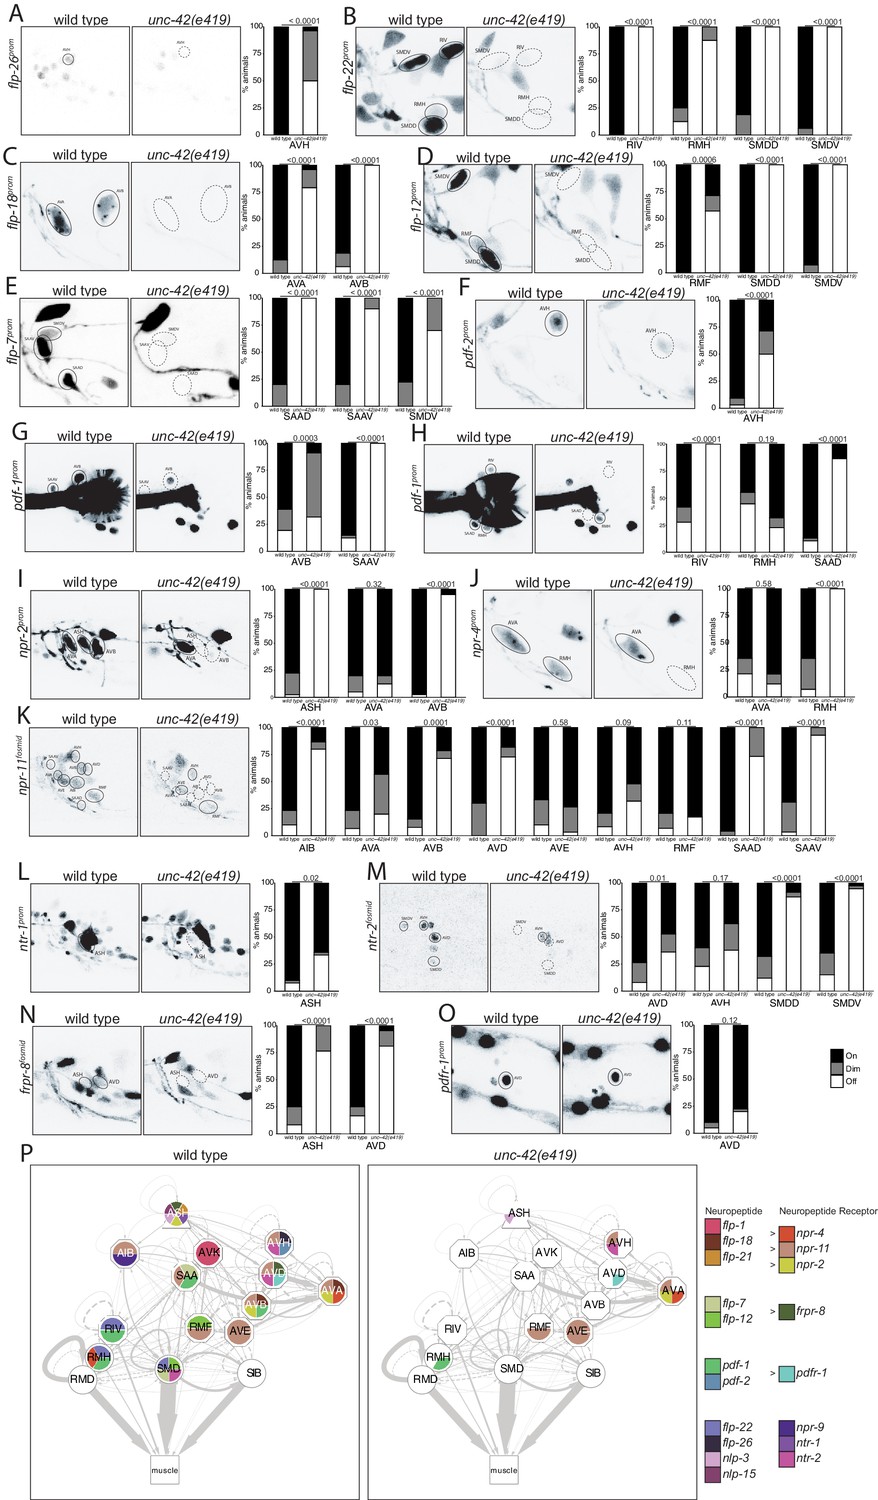
unc-42 affects peptidergic communication .
(A) A flp-26 reporter transgene shows expression defects in the AVH neurons in the absence of unc-42. n = 22 wild type and 26 unc-42(e419) animals. (B) A flp-22 reporter transgene shows expression defects in the RIV, RMH, SMDD, and SMDV neurons in the absence of unc-42. n = 16 wild type and 20 unc-42(e419) animals. (C) The expression of a flp-18 transgene reporter is affected in the AVA and AVB neurons in unc-42 mutants. n = 32 wild type and 24 unc-42(e419) animals. (D) In the absence of unc-42, the RMF, SMDD, and SMDV neurons do not show flp-12 transgene reporter expression. n = 14 wild type and 16 unc-42(e419) animals. (E) In the absence of unc-42, the SAAD, SAAV, and SMDV neurons do not show flp-7 transgene reporter expression. n = 10 wild type and 20 unc-42(e419) animals. (F) The AVH neurons lose expression of a pdf-2 reporter transgene in unc-42 mutants. n = 32 wild type and 14 unc-42(e419) animals. (G, H) A pdf-1 transgene reporter loses expression in AVB, SAAV, RIV, RMH, and SAAD neurons in the absence of unc-42. n = 44 wild type and 34 unc-42(e419) animals. (I) A npr-2 reporter transgene shows expression defects in the ASH and AVB neurons in the absence of unc-42. n = 40 wild type and 40 unc-42(e419) animals. (J) The expression of a npr-4 reporter transgene is lost in RMH neurons in unc-42 mutants. n = 14 wild type and 34 unc-42(e419) animals. (K) An npr-11 fosmid transgene reporter shows expression defects in the AIB, AVA, AVB, AVD, SAAD, and SAAV neurons in the absence of unc-42. n = 30 wild type and 30 unc-42(e419) animals. (L) In the absence of unc-42, the ASH neurons do not show ntr-1 transgene reporter expression. n = 40 wild type and 39 unc-42(e419) animals. (M) The AVD, SMDD, and SMDV neurons lose expression of a ntr-2 fosmid transgene reporter in unc-42 mutants. n = 40 wild type and 40 unc-42(e419) animals. (N) In the absence of unc-42, the ASH and AVD neurons do not show frpr-8 fosmid transgene reporter expression. n = 24 wild type and 24 unc-42(e419) animals. (O) The expression of a pdfr-1 reporter transgene in the AVD neurons is unaffected in an unc-42 mutant. n = 40 wild type and 40 unc-42(e419) animals. (A–O) A solid circle indicates expression, and a dashed circle indicates absence of expression. p-values shown by Fisher’s exact test. (P) Circuit diagram summarizing the effect of unc-42 on neuropeptide and neuropeptide receptor expression. flp-1 data is from Wightman et al., 2005, flp-21 data is from Serrano-Saiz et al., 2013, nlp-15 and nlp-3 data is in unc-42(gk598) mutants and from Wood and Ferkey, 2019, and npr-9 data is from Bhattacharya et al., 2019. See legend to Figure 3 for more information on features of circuit diagram. Nodes lose coloring when neuropeptide and neuropeptide receptor expression is affected in an unc-42 mutant.
Figure 7 with 3 supplements
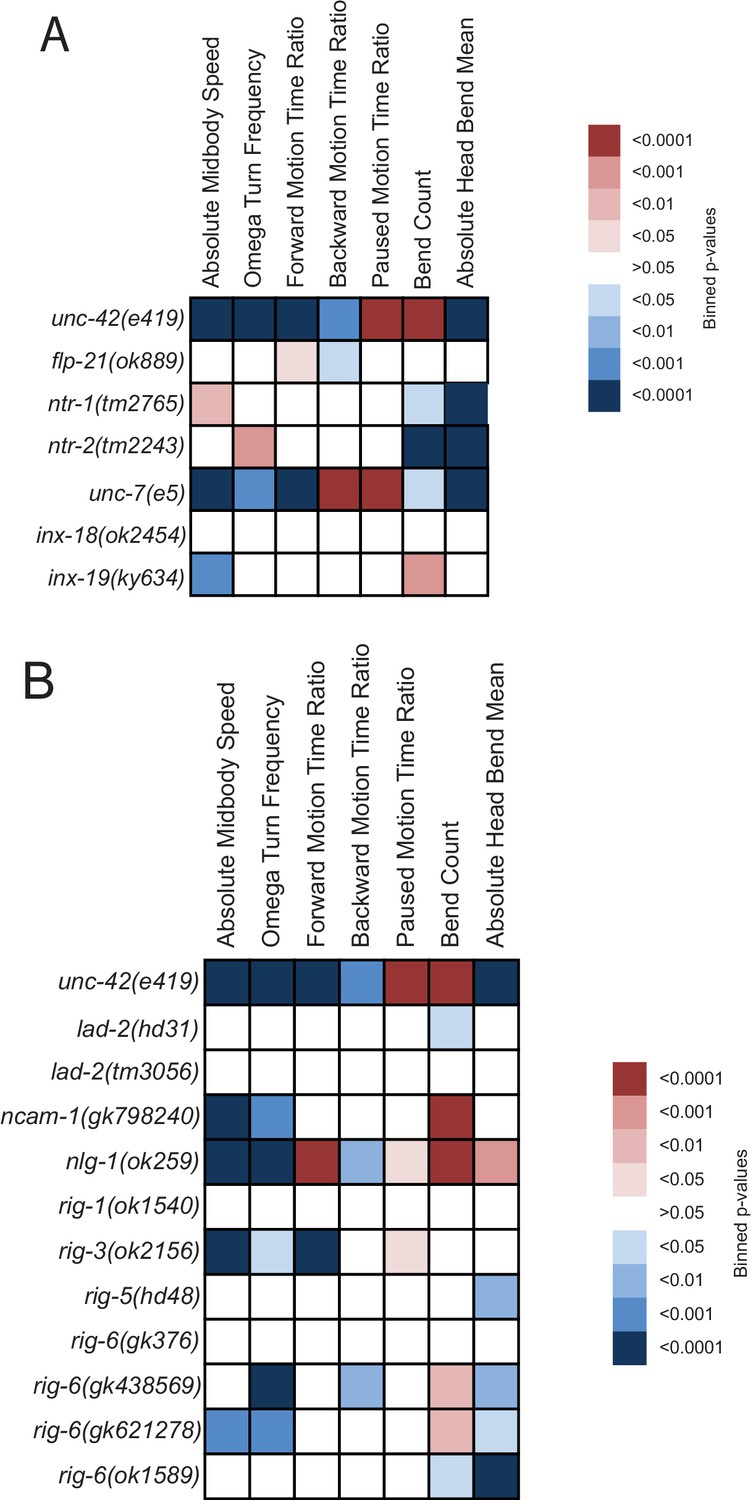
Behavioral defects of unc-42 target genes.
(A, B) Behavioral phenotypic summaries of the individual motion and posture features identified in Figure 2 for neuropeptide and neuropeptide receptor mutants (A) and for putative cell/cell recognition molecule mutants (B). Heat map colors indicate the p-value for each feature for the comparison between each of the mutant strains and the wild type strain. Red indicates significantly higher p-values while blue indicates significantly lower p-values . See more details in Figure 7—figure supplement 1.
Figure 7—figure supplement 1
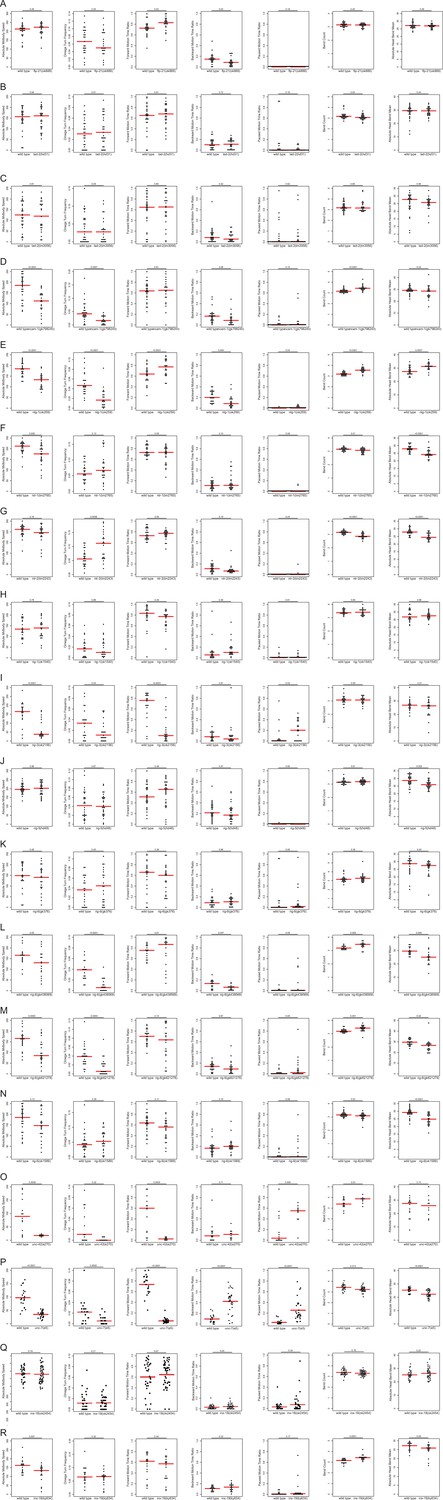
Loss of neuropeptide, neuropeptide receptors, and putative cell/cell recognition molecules affects locomotion.
In each panel (A-R), the individual motion and posture features identified in Figure 2 were compared between wild type and neuropeptide, neuropeptide receptor, cell/cell recognition molecule, and innexin mutants using the WormTracker. Each circle represents the experimental mean of a single worm. Red lines indicate the median of means. One-way ANOVA followed by Tukey’s multiple comparisons test is shown for each comparison. Time ratio = (total time spent performing the respective behavior)/(total assay time).
Figure 7—figure supplement 2

Effects of unc-42 on sra-11 expression.
In the absence of unc-42, the AVB neurons fail to express a sra-11 reporter. n = 28 wild type and 36 unc-42(e419) animals. p-values shown by Fisher’s exact test.
Figure 7—figure supplement 3
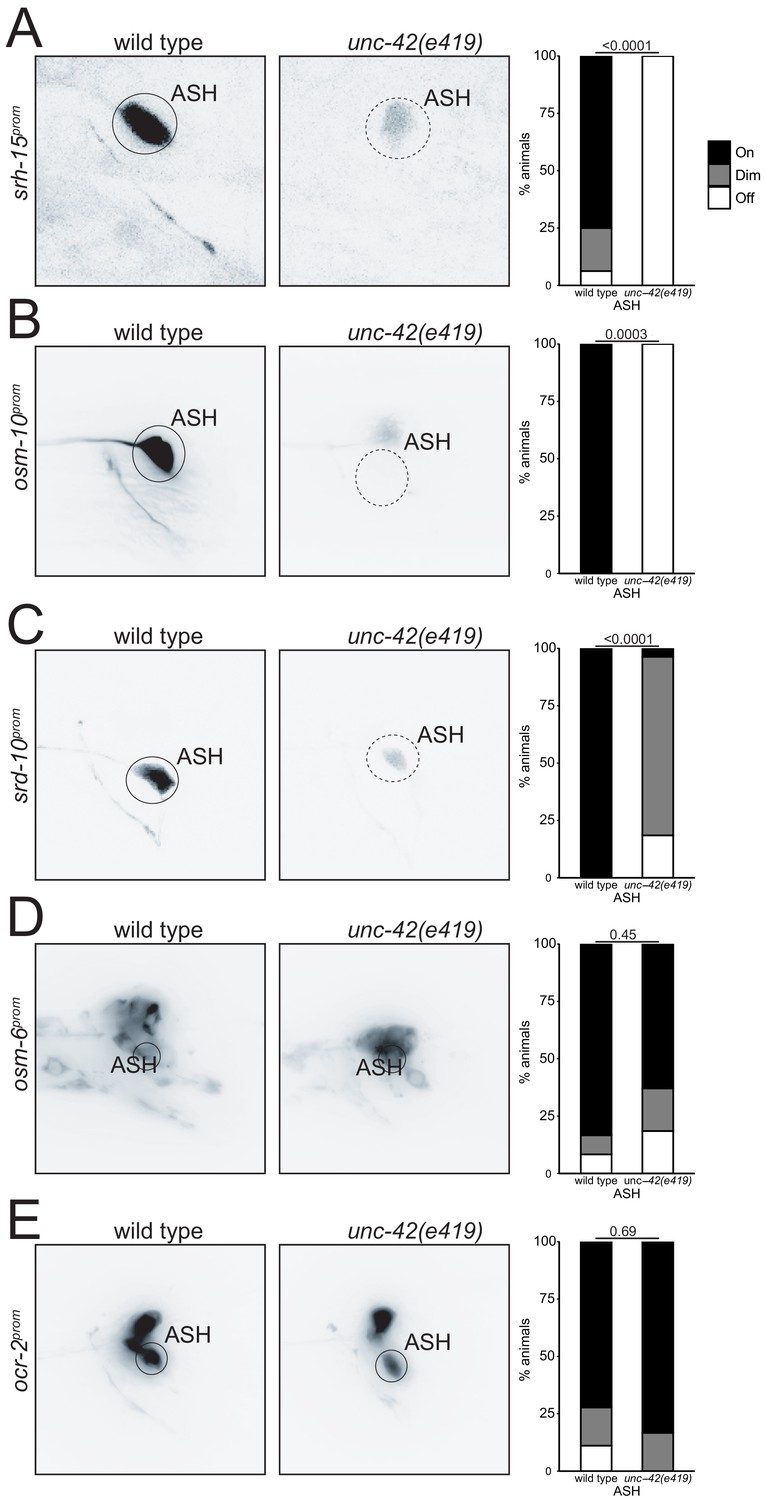
Effects of unc-42 loss on ASH differentiation.
In the absence of unc-42, the ASH fails to express reporter transgenes for (A) srh-15 (n = 16 wild type and 20 unc-42(e419) animals), (B) osm-10 (n = 10 wild type and 12 unc-42(e419) animals), and (C) srd-10 (n = 15 wild type and 27 unc-42(e419) animals). Transgene reporters for (D) osm-6 (n = 12 wild type and 27 unc-42(e419) animals) and (E) ocr-2 (n = 18 wild type and 6 unc-42(e419) animals) are not affected in the unc-42 mutant. (A–E) A solid circle indicates expression, and a dashed circle indicates absence of expression. p-values shown by Fisher’s exact test.
Figure 8 with 3 supplements
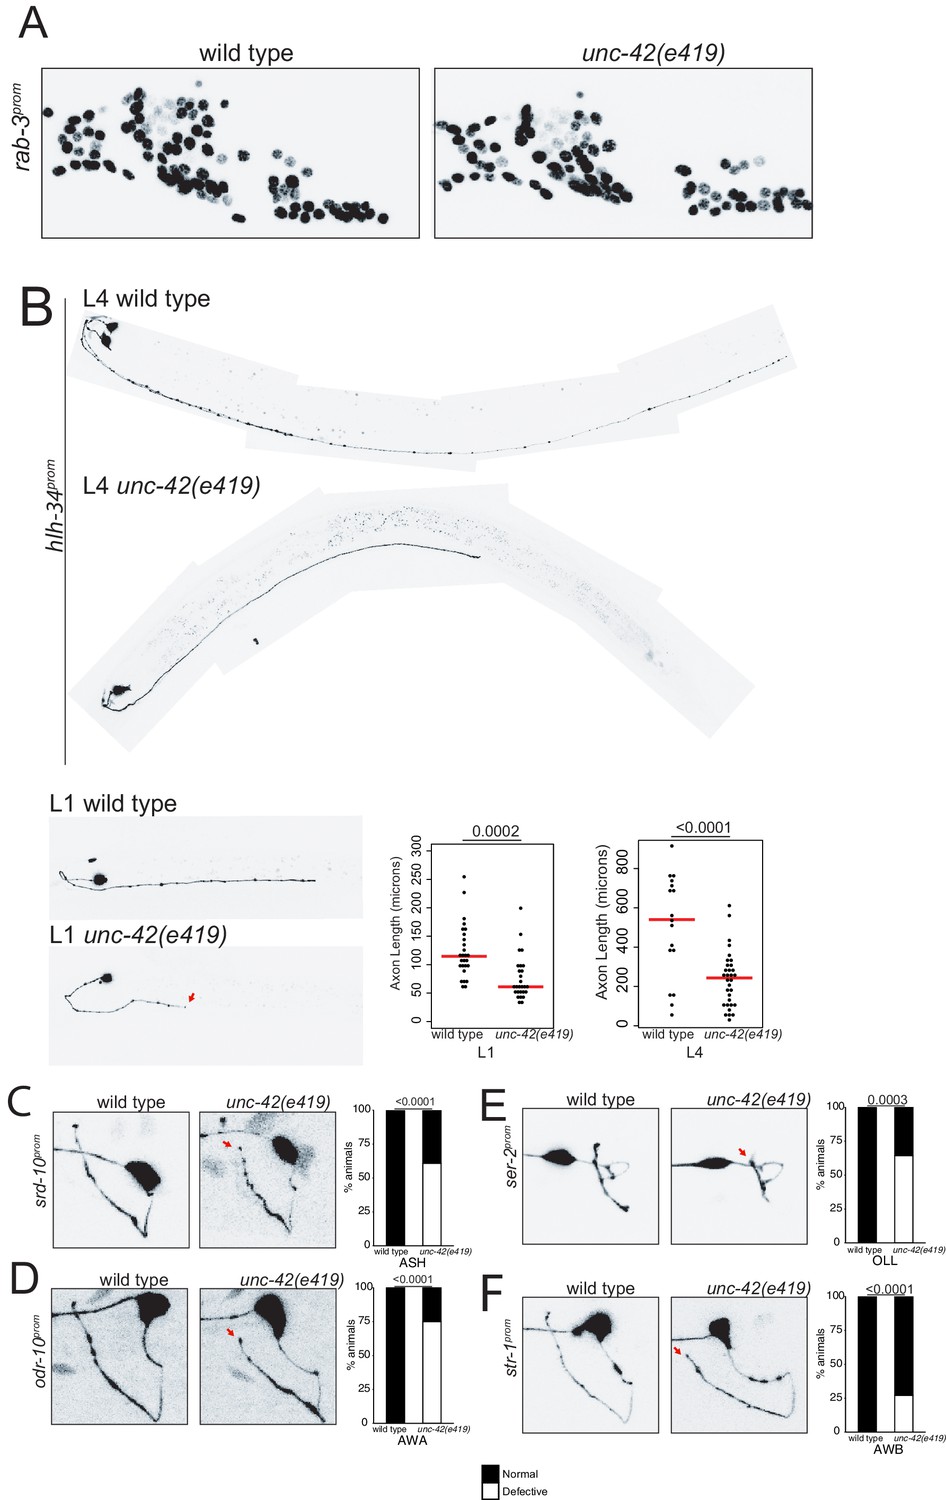
unc-42 does not affect generation of relative soma position of neurons but partially affects axon extension of some neuron classes.
(A) A rab-3 pan-neuronal reporter transgene does not show defects in neuron generation and relative soma position in the absence of unc-42. See also Figure 8—figure supplement 1. (B) In the absence of unc-42, AVH neurons display axon extension defects in the ventral nerve cord at the L1 and L4 larval stages. Each circle represents one animal. Red lines indicate the median. p-values shown by one-way ANOVA followed by Tukey’s multiple comparisons test. (C–F) ASH, AWA, OLL, and AWB neurons display nerve ring axon extension defects in unc-42 mutants. Arrow indicates the axon extension defects. p-values shown by Fisher’s exact test. (C) n = 29 wild type and 46 unc-42(e419) animals. (D) n = 30 wild type and 32 unc-42(e419) animals. (E) n = 18 wild type and 14 unc-42(e419) animals. (F) n = 68 wild type and 70 unc-42(e419) animals. See also Figure 8—figure supplement 3.
Figure 8—figure supplement 1
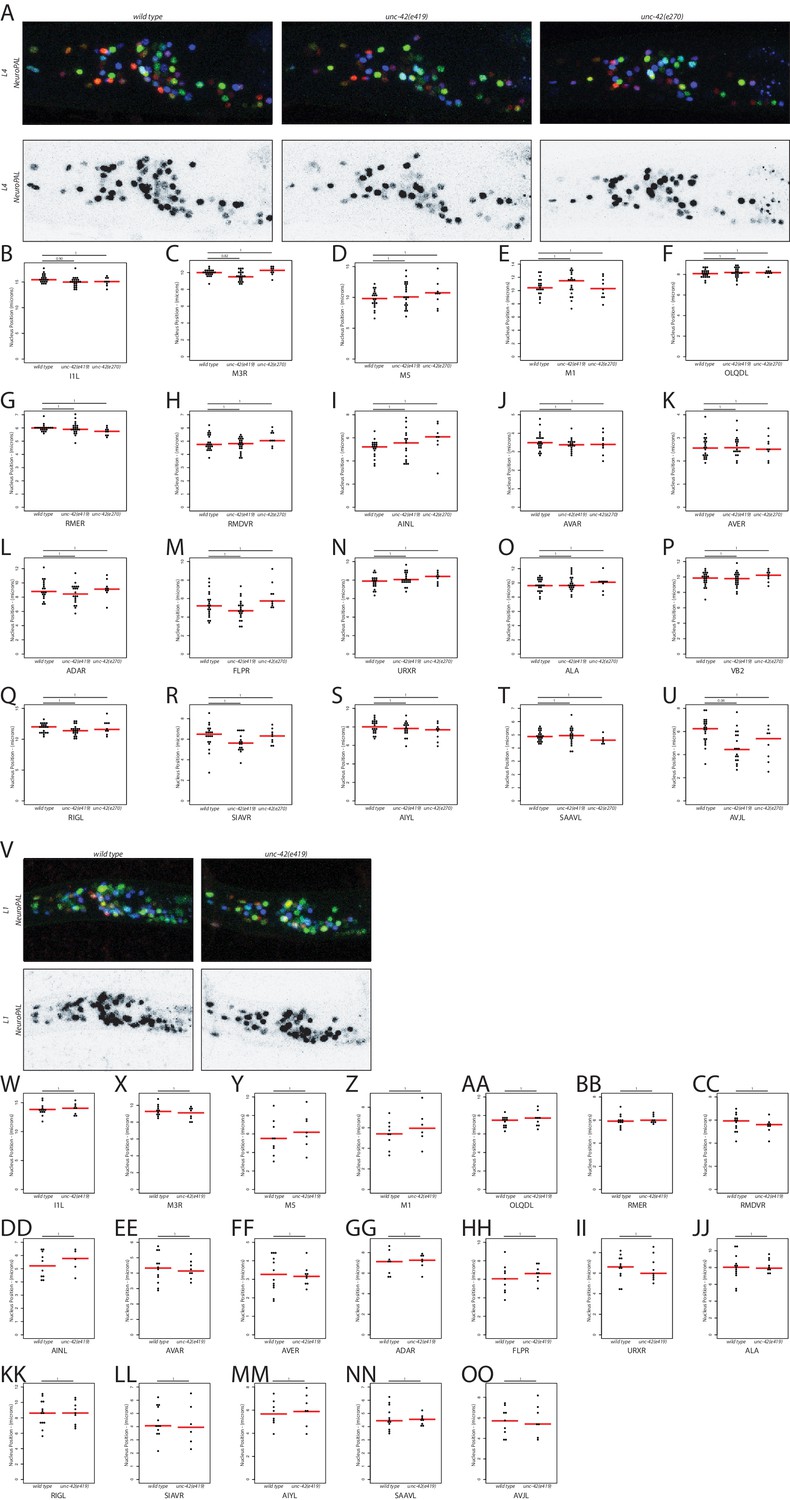
unc-42 does not control cell soma position.
(A, V) In the absence of unc-42, the NeuroPAL reporter transgene does not show defects in neuron generation and relative soma position at the L1 and L4 larval stages. (B–U, W–OO) Quantification of neuronal soma displacement in unc-42 mutants at L1 and L4 larval stages. Each circle represents one animal. Red lines indicate the median. p-values are shown by one-way ANOVA followed by Tukey’s multiple comparisons test and are corrected for multiple testing by false discovery rate.
Figure 8—figure supplement 2
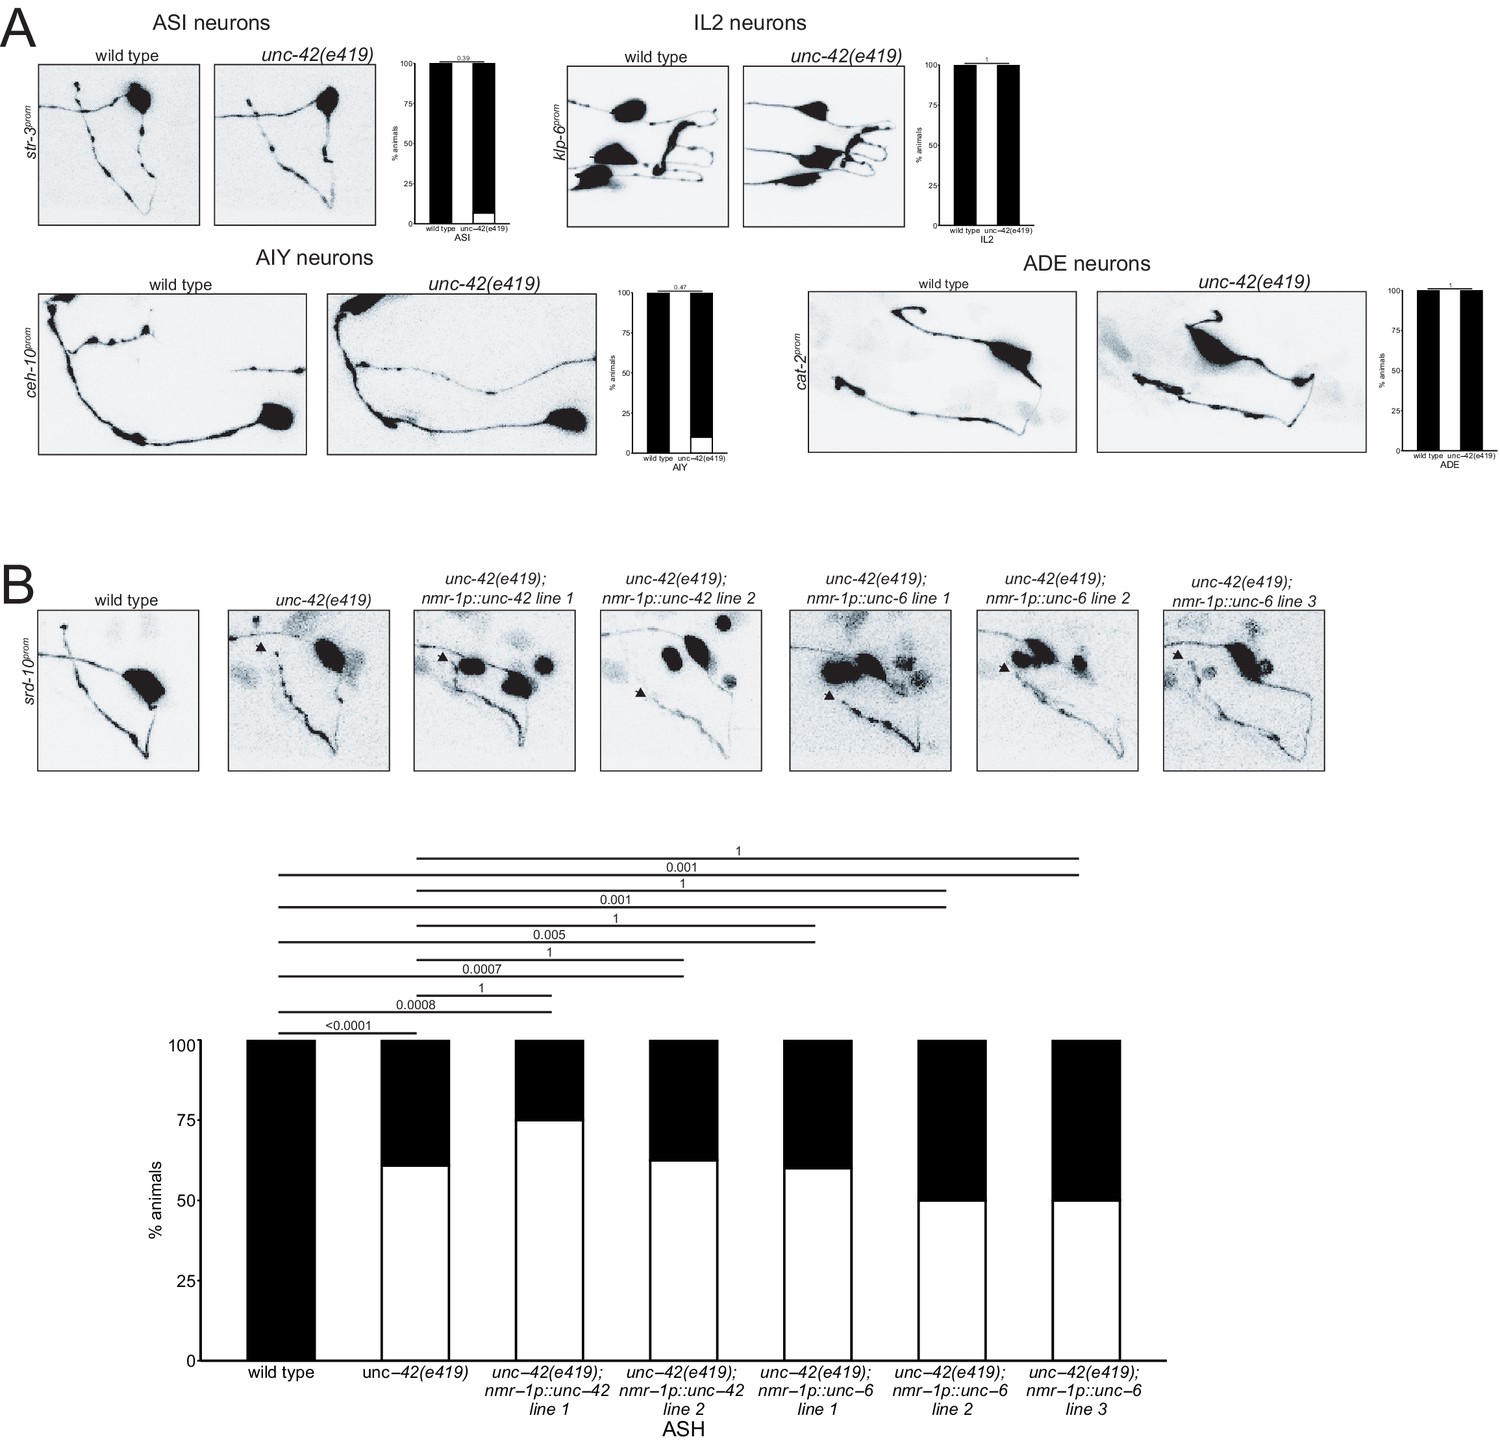
Rescue of unc-42 in the command interneurons does not restore axon anatomy, and loss of unc-42 does not affect axon anatomy in all neurons.
(A) ASI, AIY, ADE, and IL2 neurons do not show nerve ring axon outgrowth defects in unc-42 mutants. p-values shown by Fisher’s exact test. n > 20 for wild type and unc-42(e419) animals. (B) Overexpressing unc-42 and unc-6 under a command interneuron promoter in an unc-42(e419) background does not restore ASH axon anatomy. n = 29 wild type, 46 unc-42(e419), 4 unc-42(e419);nmr-1p::unc-42 line 1, 8 unc-42(e419);nmr-1p::unc-42 line 2, 5 unc-42(e419);nmr-1p::unc-6 line 1, 20 unc-42(e419);nmr-1p::unc-6 line 2, 20 unc-42(e419);nmr-1p::unc-6 line 3 animals. p-values are shown by Fisher’s exact test and are corrected for multiple testing by false discovery rate.
Figure 8—figure supplement 3
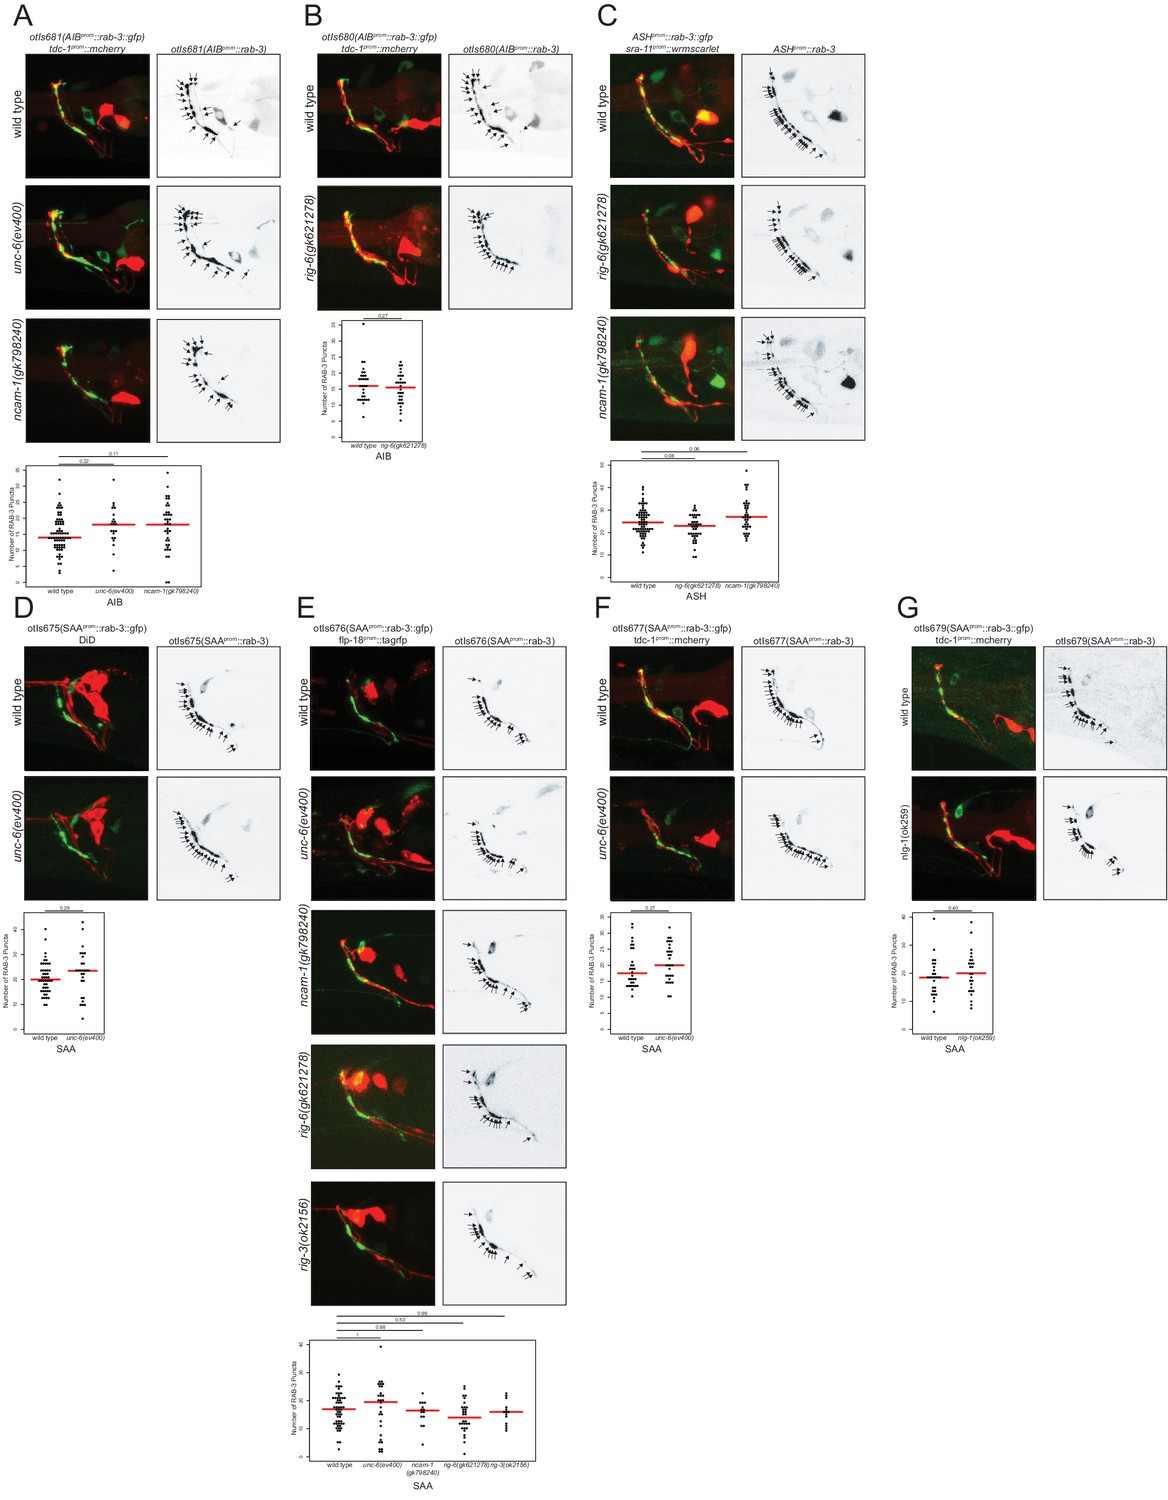
Putative cell/cell recognition molecules and the unc-6 netrin guidance cue do not affect presynaptic specializations.
(A) The number and position of presynaptic specializations of the AIB neurons is not affected in the absence of unc-6 or ncam-1 (transgene otIs681). (B) In rig-6 mutants, the number and position of presynaptic specializations in the AIB neurons is not affected (transgene otIs680). (C) rab-3 presynaptic specializations do not show defects in number or location in the ASH neurons in rig-6 or ncam-1 mutants. (D–F) The number and position of presynaptic specializations of the SAA neurons is not affected in the absence of unc-6 (transgenes otIs675, otIs676, and otIs677). (E) In ncam-1 and rig-6 mutants, the number and position of presynaptic specializations of the SAA neurons is not affected (transgene otIs676). (G) rab-3 presynaptic specializations do not show defects in number or location in the SAA neurons in nlg-1 mutants (transgene otIs679). (A–G) Arrows indicate rab-3 presynaptic specializations. Each circle represents one animal. Red lines indicate the median. p-values shown by one-way ANOVA followed by Tukey’s multiple comparisons test.
Figure 9

unc-42 affects synaptic connectivity.
(A) A transverse section of the right ventral ganglion in wild type (N2U, section 142) is compared to the corresponding section in unc-42(e270). The following processes are shown: AINL, AVAL, AVBL, AVHR, AVJR, SAAVL, and SMDVL. Scale bar, 500 nm. (B) Three-dimensional renderings of all identified neurons in unc-42(e270) are compared to wild type (N2U). Transverse view, posterior is to the back. (C) Three-dimensional renderings of SAAVL and AVAL in wild type and unc-42(e270). (D) Tabular summary of synaptic contacts and adjacencies of all identified neurons in unc-42(e270) compared to wild type (N2U). Gray cells are unc-42-expressing neurons.
Figure 10
unc-42 affects electrical synaptic communication (innexins).
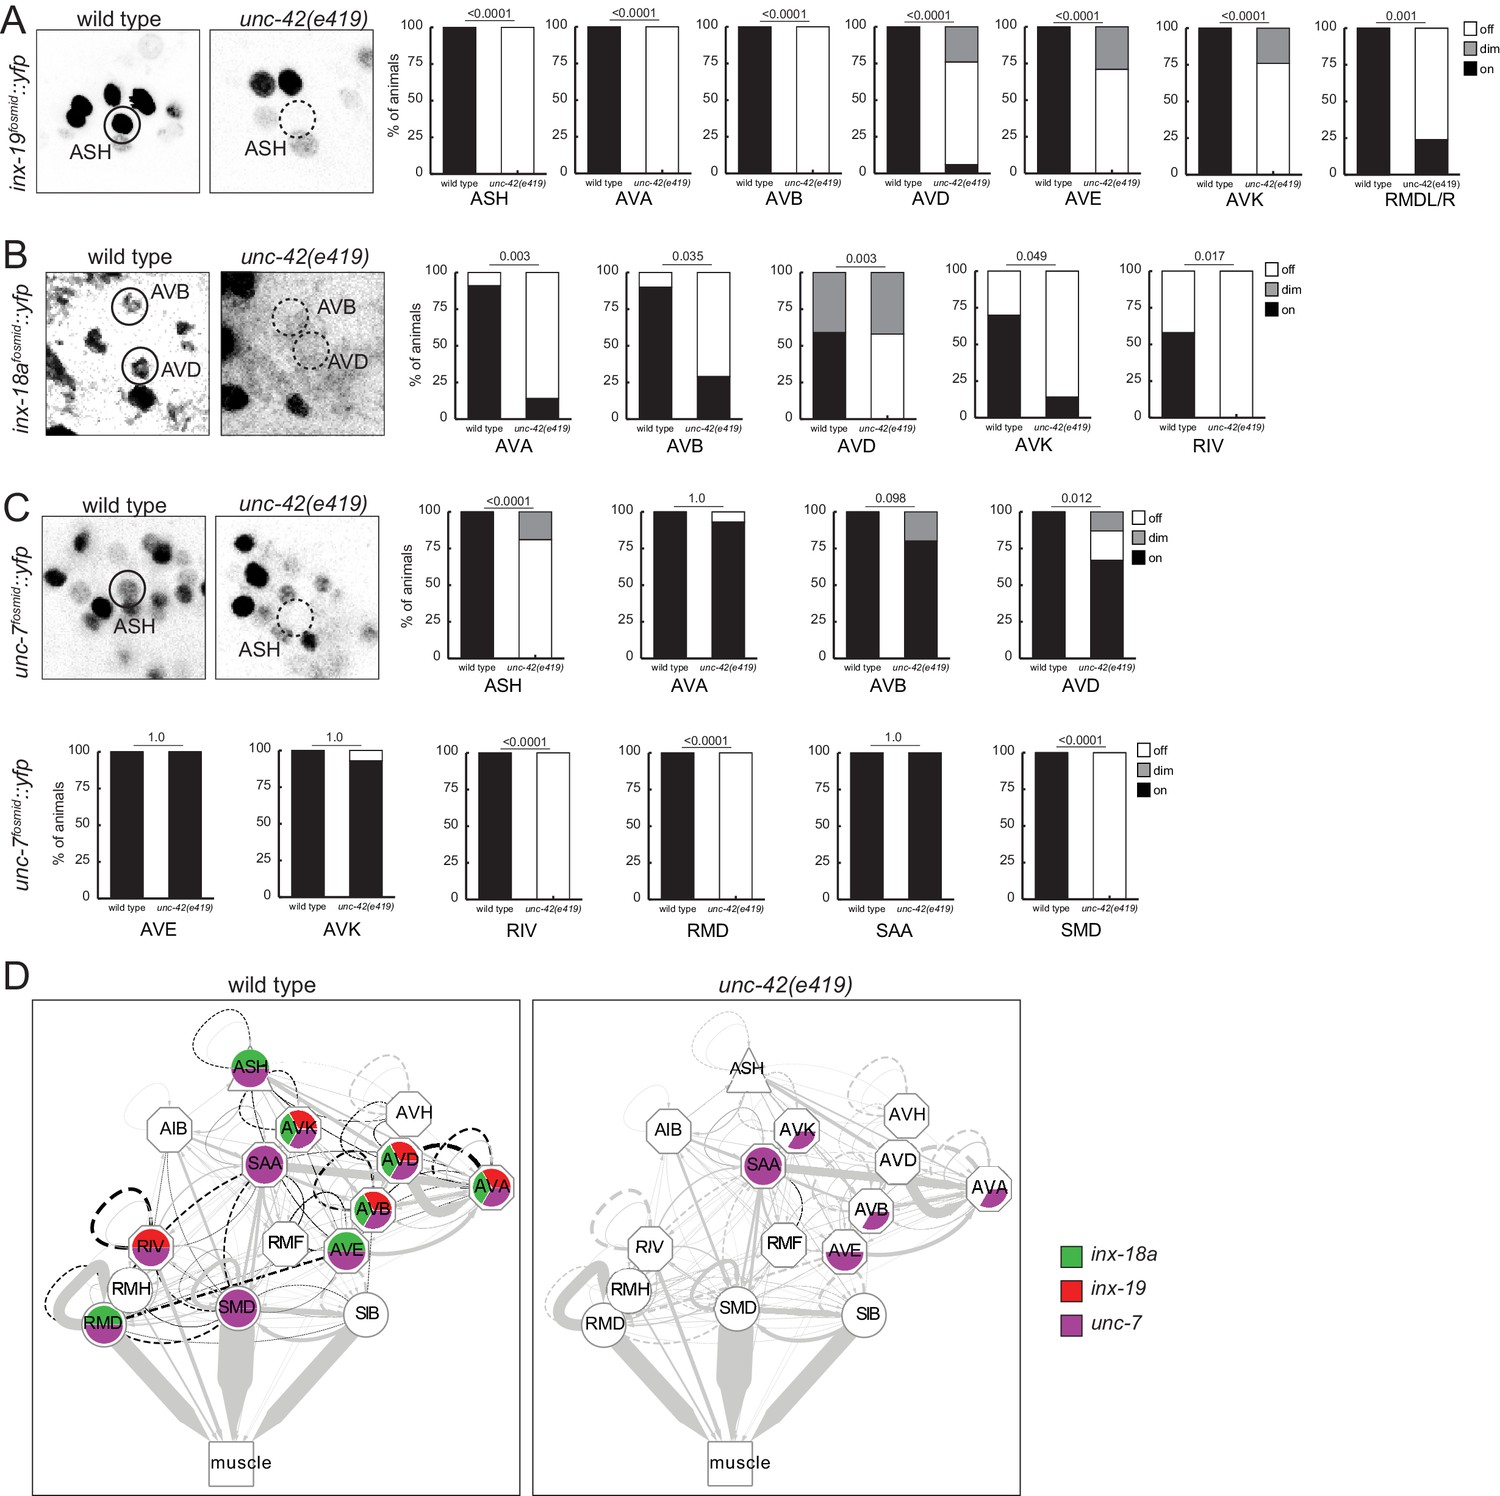
(A) A inx-19 reporter transgene shows expression defects in the ASH, AVA, AVB, AVD, AVE, AVK, and RMDL/R neurons in the absence of unc-42. (B) A inx-18a reporter transgene shows expression defects in the AVA, AVB, AVD, AVK, and RIV neurons in the absence of unc-42. (C) A unc-7 reporter transgene shows expression defects in the ASH, RIV, RMD, and SMD neurons in the absence of unc-42. Expression of unc-7 reporter remained unaffected in the AVA, AVB, AVD, AVE, AVK, and SAA neurons in the absence of unc-42 (cells were identified by relative position). p-values shown by Fisher’s exact test. (D) Circuit diagram summarizing the effect of unc-42 on innexin expression. See legend to Figure 3 for more information on features of circuit diagram. Edges are colored in black to indicate electrical synaptic connections between neurons that were examined in this analysis. Edges lose coloring when inx-18a, inx-19, or unc-7 expression is affected in either neuron in unc-42 mutants (irrespective of whether those effects are partial effects or not).
Figure 11
unc-42 affects putative cell/cell recognition molecules (IgSFs) and the unc-6 netrin guidance cue.
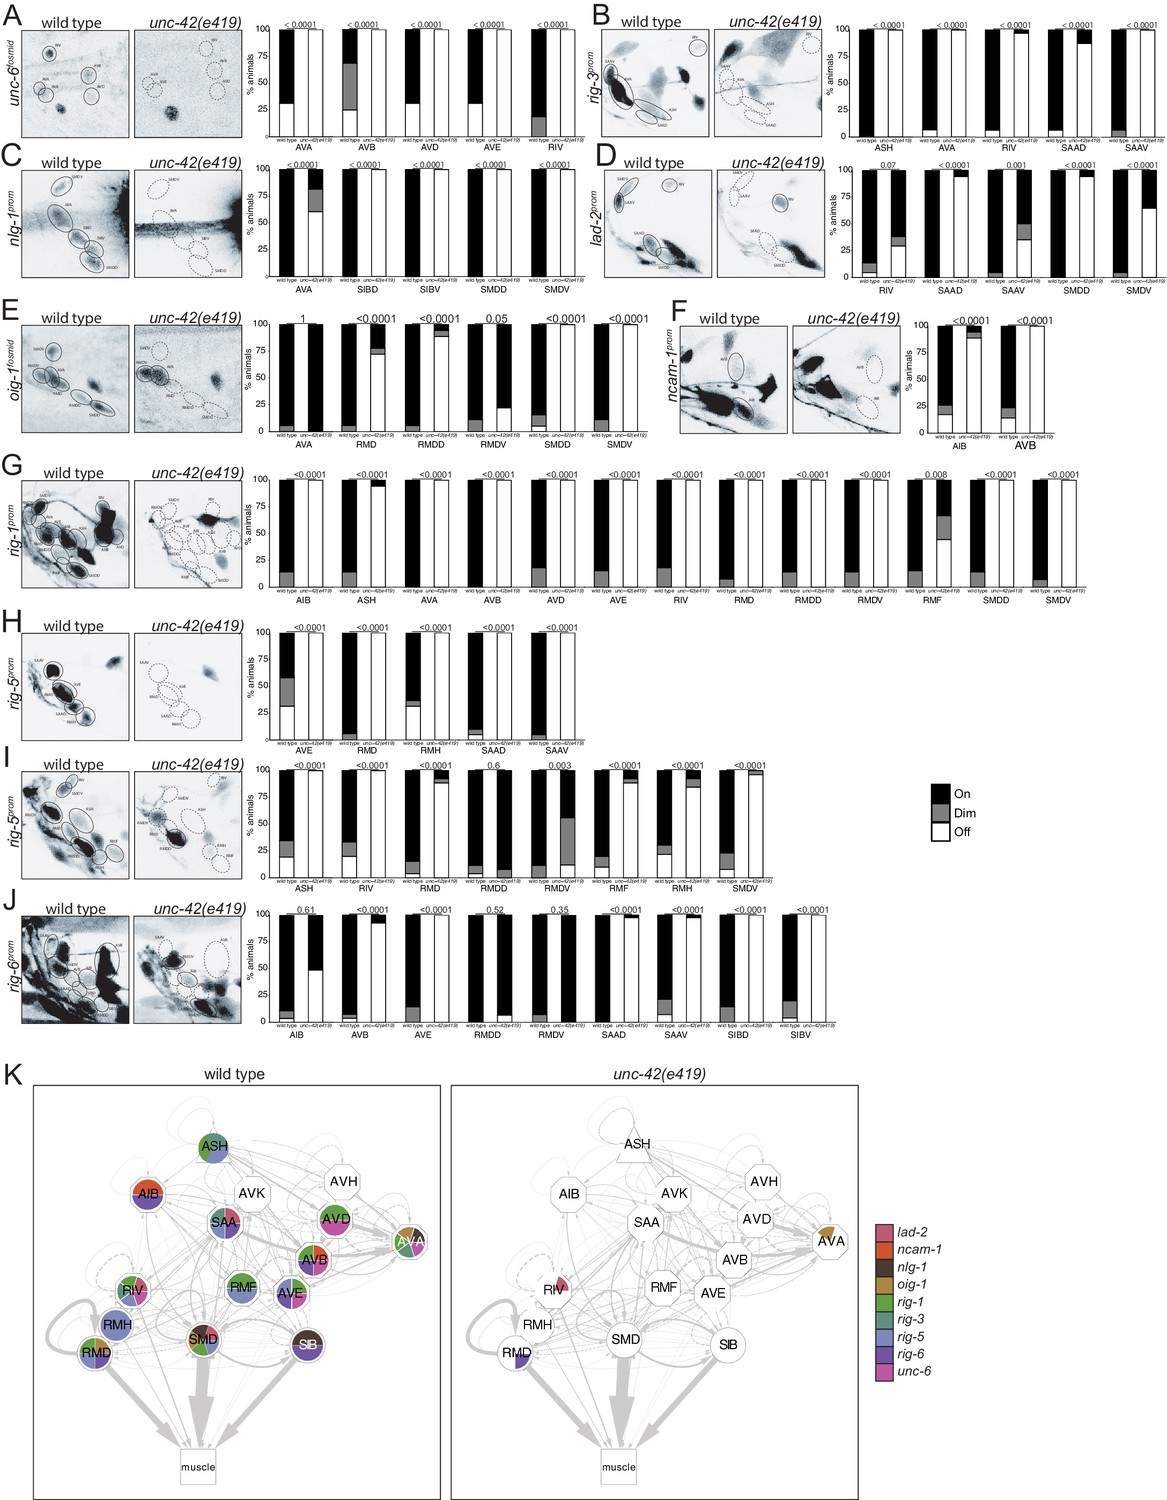
(A) In the absence of unc-42, the AVA, AVB, AVD, AVD, and RIV neurons do not show unc-6 fosmid transgene reporter expression. n = 16 wild type and 24 unc-42(e419) animals. (B) A rig-3 reporter transgene shows expression defects in the ASH, AVA, RIV, SAAD, and SAAV neurons in unc-42 mutants. n = 15 wild type and 32 unc-42(e419) animals. (C) A nlg-1 reporter transgene shows expression defects in the AVA, SIBD, SIBV, SMDD, and SMDV neurons in the absence of unc-42. n = 20 wild type and 38 unc-42(e419) animals. (D) The SAAD, SAAV, SMDD, and SMDV neurons lose expression of a lad-2 reporter transgene in unc-42 mutants. n = 21 wild type and 34 unc-42(e419) animals. (E) In unc-42 mutants, the RMD, RMDD, SMDD, and SMDV neurons do not show oig-1 fosmid transgene reporter expression. n = 16 wild type and 18 unc-42(e419) animals. (F) A ncam-1 reporter transgene show expression defects in AIB and AVB in the absence of unc-42. n = 24 wild type and 36 unc-42(e419) animals. (G) A rig-1 reporter transgene shows expression defects in the AIB, ASH, AVA, AVB, AVD, AVE, RIV, RMD, RMDD, RMDV, RMF, SMDD, and SMDV neurons in the absence of unc-42. n = 16 wild type and 18 unc-42(e419) animals. (H) A rig-5 reporter transgene (otEx5883) show expression defects in AVE, RMD, RMH, SAAD, and SAAV neurons in unc-42 mutants. n = 26 wild type and 20 unc-42(e419) animals. (I) The expression of a rig-5 reporter transgene (hdEx332) is lost in the ASH, RIV, RMD, RMDV, RMF, RMH, and SMDV neurons in the absence of unc-42. n = 26 wild type and 28 unc-42(e419) animals. (J) The AVB, AVE, SAAD, SAAV, SIBD, and SIBV neurons lose expression of a rig-6 reporter transgene in unc-42 mutants. n = 28 wild type and 52 unc-42(e419) animals. (A–J) A solid circle indicates expression, and a dashed circle indicates absence of expression. p-values shown by Fisher’s exact test. (K) Circuit diagram summarizing the effect of unc-42 on the expression of putative cell/cell recognition molecules and the unc-6 netrin guidance cue. See legend to Figure 3 for more information on features of circuit diagram. Nodes lose coloring when the expression of putative cell/cell recognition molecules and the unc-6 netrin guidance cue is affected in an unc-42 mutant (irrespective of whether those effects are partial effects or not).
Figure 12
unc-42 cooperates with cofactors in distinct neuron types on the level of target gene promoters.
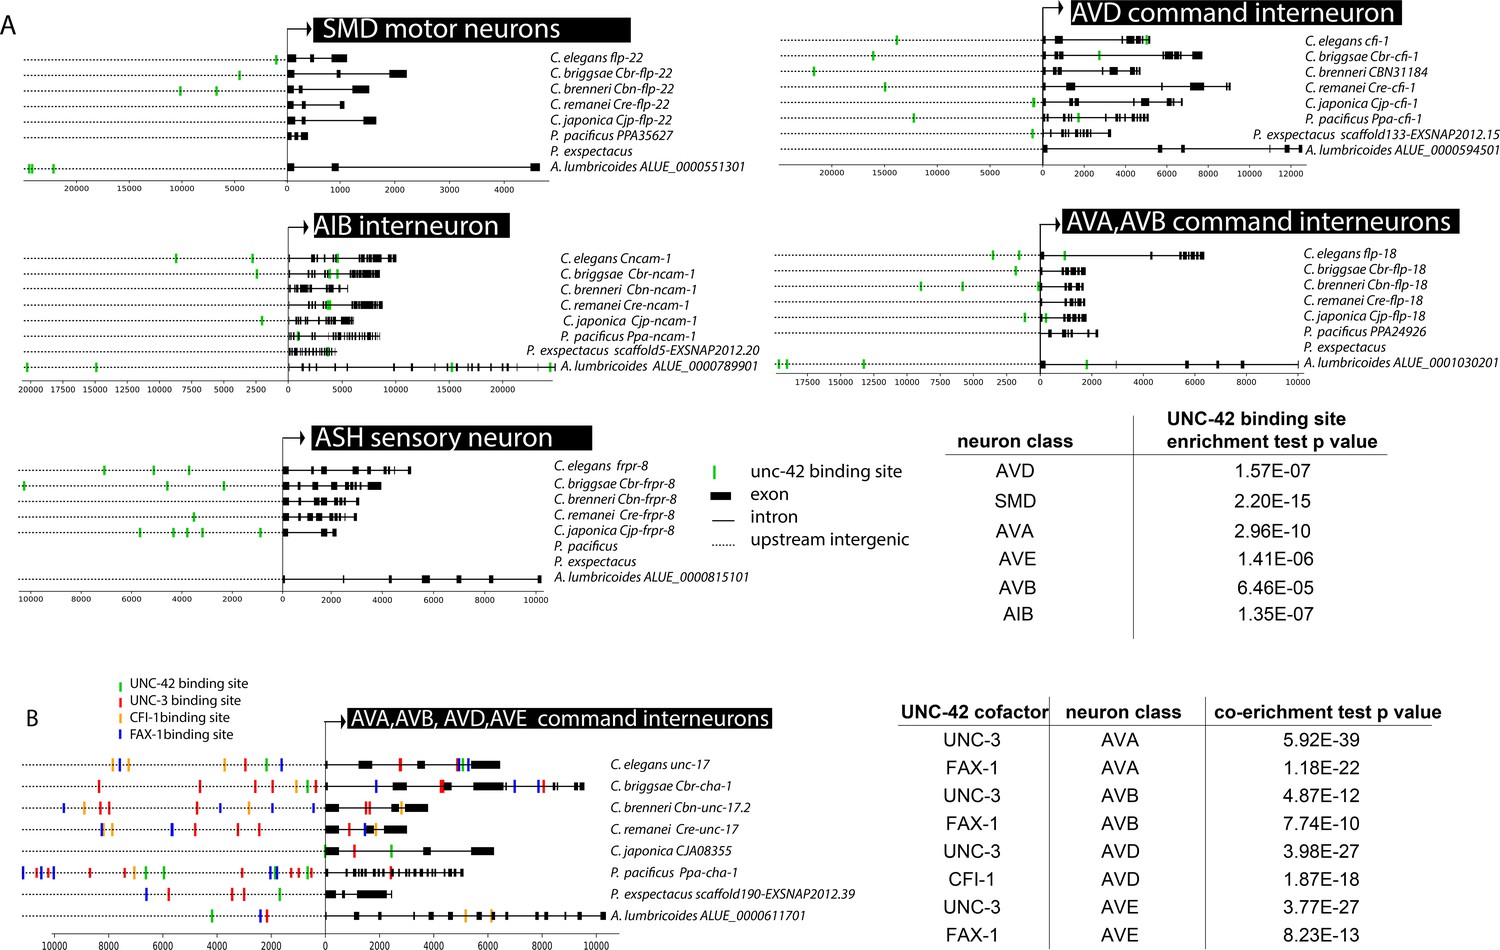
(A) Predicted UNC-42 binding sites among orthologs in eight nematode species in unc-42 expressing neuron classes. Text on right: species name, ortholog name. Table: UNC-42 binding site enrichment in neuron class reporter genes compared to genome-wide binding site data. p-values are from the hypergeometric test for enrichment. (B) Predicted unc-42 cofactor binding sites among unc-17 orthologs in eight nematode species. Table: co-enrichment of UNC-42 cofactor binding sites in neuron class reporter genes from hypergeometric test comparing genome-wide cofactor binding data.
Figure 13 with 2 supplements

hlh-34, ceh-20/Pbx, and unc-62/Meis are collaborators of unc-42.
(A) The loss-of-function syb2697 allele of hlh-34 is a 410 bp deletion. (B) hlh-34(syb2697) mutant animals show an occasional loss of flp-26::BFP expression in the AVH neuron in a NeuroPAL(otIs696) background. (C) hlh-34(syb2697) mutant animals show an occasional loss of pdf-2::GFP expression in the AVH neuron, while hlh-34(syb2697) unc-42(e419) double mutants lose or show dim expression in most animals. (D) Expression of an inx-6 reporter allele, which is expressed in AIB neurons at the dauer stage, is lost in unc-62(e644) mutant dauer animals. (E) Expression of an inx-1 reporter transgene is lost in unc-62(e644) mutant animals. (F) Expression of eat-4/VGLUT reporter transgene is lost in unc-62(e644) mutant animals. (G) Expression of an inx-1 reporter transgene is lost in ceh-20(ok541) mutant animals (scored as arrested larvae). (H) Expression of eat-4/VGLUT reporter transgene is lost in ceh-20(ok541) mutant animals (scored as arrested larvae). (I) Expression of a neuropeptide receptor, npr-9 reporter transgene is lost in ceh-20(ok541) mutant animals (scored as arrested larvae). p-values shown by Fisher’s exact test.
Figure 13—figure supplement 1

ceh-24 affects SMB motor neuron, not SMD motor neuron differentiation.
In the absence of ceh-24, the NeuroPAL reporter transgene is absent from the SMBs, not SMD, as previously reported. A solid circle indicates expression, and a dashed circle indicates absence of expression. p-values are shown by Fisher’s exact test (on vs. off).
Figure 13—figure supplement 2
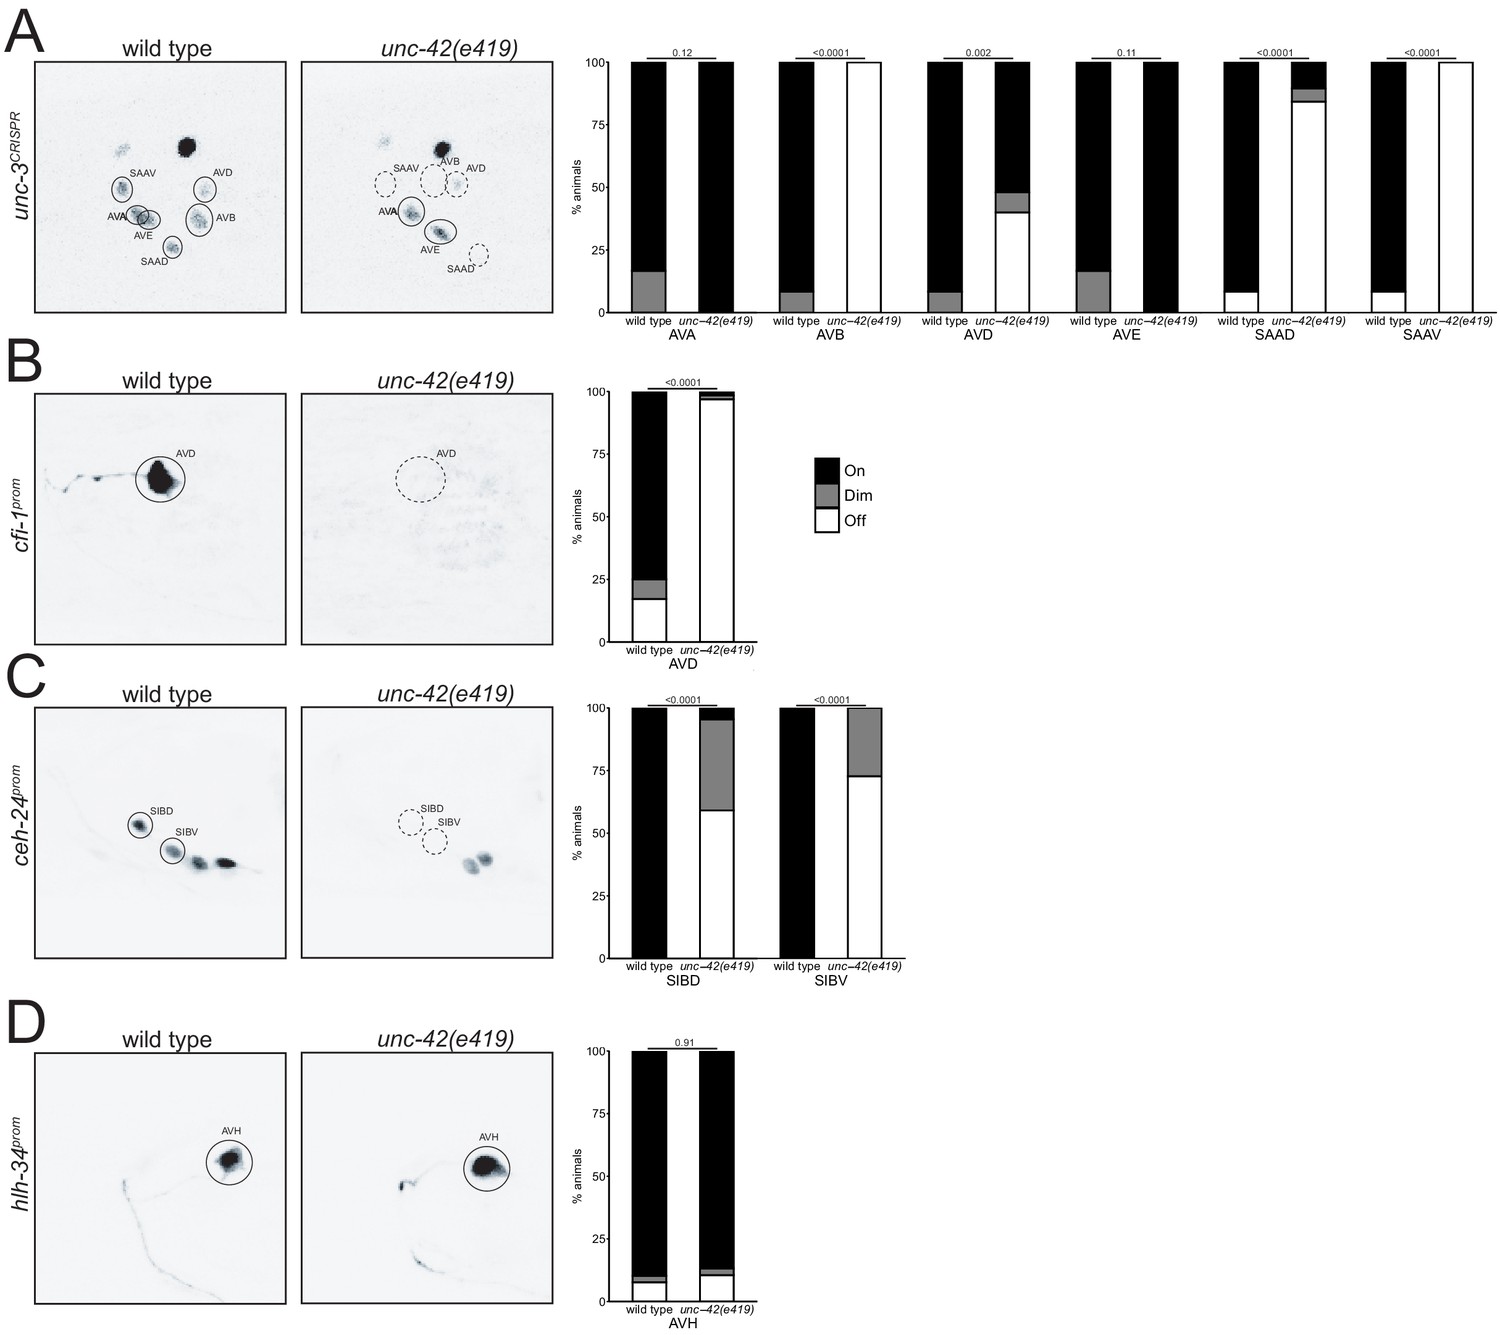
unc-42 controls expression of collaborating transcription factors.
In the absence of unc-42, (A) the unc-3 CRISPR reporter show expression defects in the AVB, AVD, SAAV, and SAAD neurons (n = 24 wild type and 26 unc-42(e419) animals), (B) the cfi-1 transgene reporter shows expression defects in the AVD neurons (n = 64 wild type and 64 unc-42(e419) animals), and (C) the ceh-24 transgene reporter shows expression defects in the SIBD and SIBV neurons (n = 4 wild type and 22 unc-42(e419) animals). (D) The transgene reporter for hlh-34 (leEx1692) is not affected in the AVH neuron in the unc-42 mutant. n = 39 wild type and 38 unc-42(e419) animals. (A–D) A solid circle indicates expression, and a dashed circle indicates absence of expression. p-values shown by Fisher’s exact test comparing expression (on vs. off).
Figure 14

Overlapping circuit organizers may assemble individual circuits into larger-scale connectomes.
(A) Summary of cofactors for UNC-42. Each colored box indicates where the respective transcription factor is expressed within the set of UNC-42(+) neurons and required, like unc-42, for its proper specification. The function of lim-4 in the SMD neuron is discussed in the accompanying manuscript by Glenwinkel et al. lim-4 is also expressed in SIB, where its function has not yet been examined. In addition to the factors shown here, each neuron class shown here expresses a unique combination of homeobox genes (Reilly et al., 2020), which are candidates to be additional cofactors of unc-42. (B) Circuit diagram showing neurons that express unc-42, unc-3, and ceh-24 and require these factors for their identity specification. Nodes are colored to illustrate transcription factor expression. Edges are colored if both the source and target neurons express the respective transcription factor. Edges are colored in black if more than one transcription factor is expressed in both the source and target neurons. The display is by Cytoscape (https://cytoscape.org/). Nodes are arranged hierarchically, as described (Cook et al., 2019). lim-4-expressing neurons are not shown here, in part because the function of lim-4 is not currently known for all lim-4-expressing neurons, but also to not further complicate the diagram.
Additional files
-
Supplementary file 1
UNC-42(+) neurons and their function.
- https://cdn.elifesciences.org/articles/64903/elife-64903-supp1-v1.docx
-
Supplementary file 2
Strata placement of UNC-42(+) neurons.
Clustering outputs of Brittin et al., 2021, Moyle et al., 2021 are shown for each neuron. Discordant clustering results of neuronal subclasses are shown for RMD and SIB.
- https://cdn.elifesciences.org/articles/64903/elife-64903-supp2-v1.xlsx
-
Supplementary file 3
Homeobox gene expression correlating with synaptic connectivity.
See Materials and methods for details of this analysis. p-values were calculated using the binomial distribution probability mass function and were adjusted for multiple testing using a false discovery rate correction (see Materials and methods). All genes passing the p<0.05 significance threshold are shown here. Overlap with network differential gene expression analysis shaded in yellow. Red font: genes shown to be involved in neuronal identity regulation (Reilly et al., 2020; Hobert, 2016).
- https://cdn.elifesciences.org/articles/64903/elife-64903-supp3-v1.xlsx
-
Supplementary file 4
List of motion behaviors examined in wild type and unc-42(e419) animals.
Green indicates motion features that are not significantly different, while red indicates motion features that are significantly different (p<0.05) between wild type and unc-42(e419) animals. Motion features were measured for the entire animal, and in the head, tail, and midbody regions. They were measured when the animal was moving forward, backward, or paused. Features were measured accounting for when the data is signed, by absolute data values (‘absolute’), positive data values only (‘positive’), and negative data values only (‘negative’). Motion features are described by the frequency, the time spent, and the distance covered. The animal's velocity is described in two parts: speed and motion direction. Crawling, an undulation of the animal's body used for movement, is described as an amplitude and a frequency. Foraging, a rapid movement of the nose as the animal explores its environment, is described as an amplitude and a speed. An omega turn is when the animal bends sharply such that the head touches the tail in order to reverse direction. An upsilon turn is when the animal bends shallowly in order to reverse direction. Time ratio is defined as the total time spent in a particular behavior divided by the total time. See Yemini et al., 2013 for more detailed feature descriptions.
- https://cdn.elifesciences.org/articles/64903/elife-64903-supp4-v1.xls
-
Supplementary file 5
Strains used in this study.
- https://cdn.elifesciences.org/articles/64903/elife-64903-supp5-v1.docx
-
Supplementary file 6
Methods for neuron identification in electron micrographs of unc-42(e270).
- https://cdn.elifesciences.org/articles/64903/elife-64903-supp6-v1.docx
-
Transparent reporting form
- https://cdn.elifesciences.org/articles/64903/elife-64903-transrepform-v1.docx
Download links
A two-part list of links to download the article, or parts of the article, in various formats.
Downloads (link to download the article as PDF)
Open citations (links to open the citations from this article in various online reference manager services)
Cite this article (links to download the citations from this article in formats compatible with various reference manager tools)
The Prop1-like homeobox gene unc-42 specifies the identity of synaptically connected neurons
eLife 10:e64903.
https://doi.org/10.7554/eLife.64903


