Shape deformation analysis reveals the temporal dynamics of cell-type-specific homeostatic and pathogenic responses to mutant huntingtin
- Sorbonne Université, Centre National de la Recherche Scientifique UMR 8256, INSERM ERL U1164, France
- Sorbonne Université, Centre National de la Recherche Scientifique, Laboratoire Jacques-Louis Lyons (LJLL), France
- MIT, Broad Institute, MIT, Picower Institute for Learning and Memory, United States
- CHDI Foundation, United States
Figures
Figure 1 with 4 supplements

Application of shape deformation concepts to the detection of molecular responses in the striatum of Huntington’s disease (HD) knock-in model mice.
The Geomic protocol integrates three main steps for the integration of transcriptomic and cell survival data into a model that distinguishes the nature and temporal evolution of gene deregulation and molecular responses in a cell-type-specific manner. In step 2, a gene's cell type(s) expression is assigned to the bulk RNA-seq gene deregulation surface (GDS) by using the shape deformation cost for matching the data across expanding CAG repeats at the 6-month timepoint. It is noticeable that in many instances a gene that is downregulated across CAG repeats in a linear manner can be dysregulated across time in a non-linear manner, that is, increased then decreased expression (or vice versa), underlying the reduction of homeostatic responses or that of pathogenic responses over time. The data generated by Geomic analysis including the detection of cell types associated with whole-striatum gene deregulation, cell-type-specific GDS cluster centroids and identification of the type and temporal dynamics of molecular responses across cell types are available at http://www.broca.inserm.fr/geomic/index.php.
Figure 1—figure supplement 1
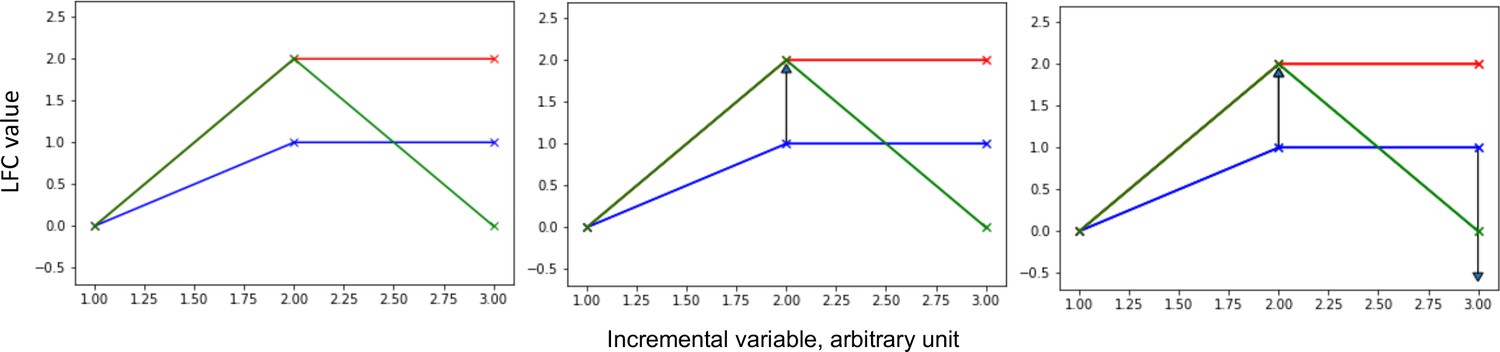
Shape deformation principle applied to the comparison of curves defined by genomic data.
This figure illustrates the shape deformation principle, applied to the comparison of curves defined by genomic data, that to map the blue curve onto the red curve (left panel), only one deformation (arrow) is needed, the one illustrated on the middle panel, whereas to map the blue curve onto the green curve (left panel), two deformations (arrows) are needed, including the one illustrated on the middle panel and the one illustrated on the right panel. The length of the arrows is proportional to the cost needed to transform the source curve into the target curve.
Figure 1—figure supplement 2
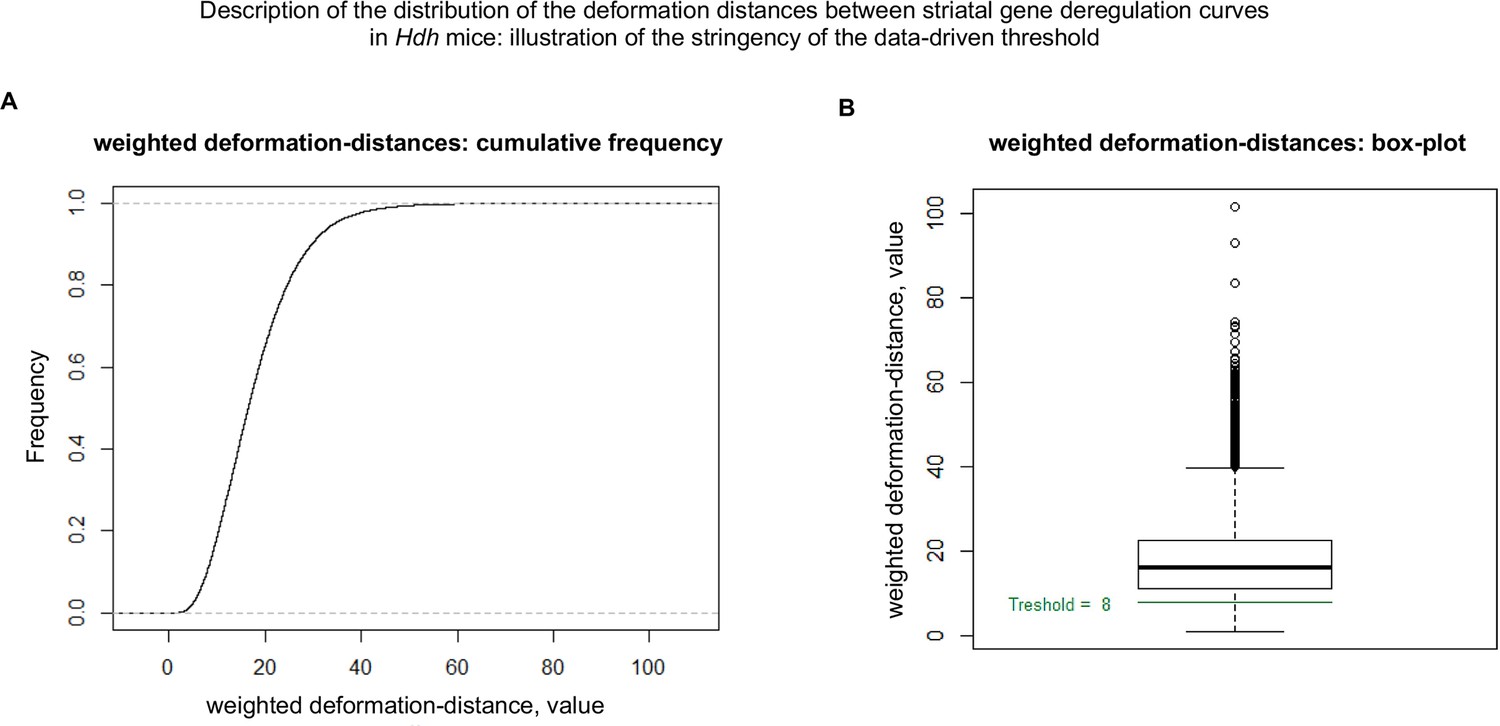
Cumulative distribution of the deformation distances between gene deregulation curves in the striatum of Hdh model mice.
This figure shows that the data-driven threshold (see Materials and methods) used for matching the whole-striatum gene deregulation curves to the cell-type-specific curves, that is, a threshold value of 8, is rather stringent. (A) Cumulative distribution of the deformation distances. (B) Box plot for the deformation distances.
Figure 1—figure supplement 3

Centroids of the gene deregulation surface clusters associated with specific cell types in the striatum of Hdh model mice.
This figure is related to step 2 in Figure 1.
Figure 1—figure supplement 4
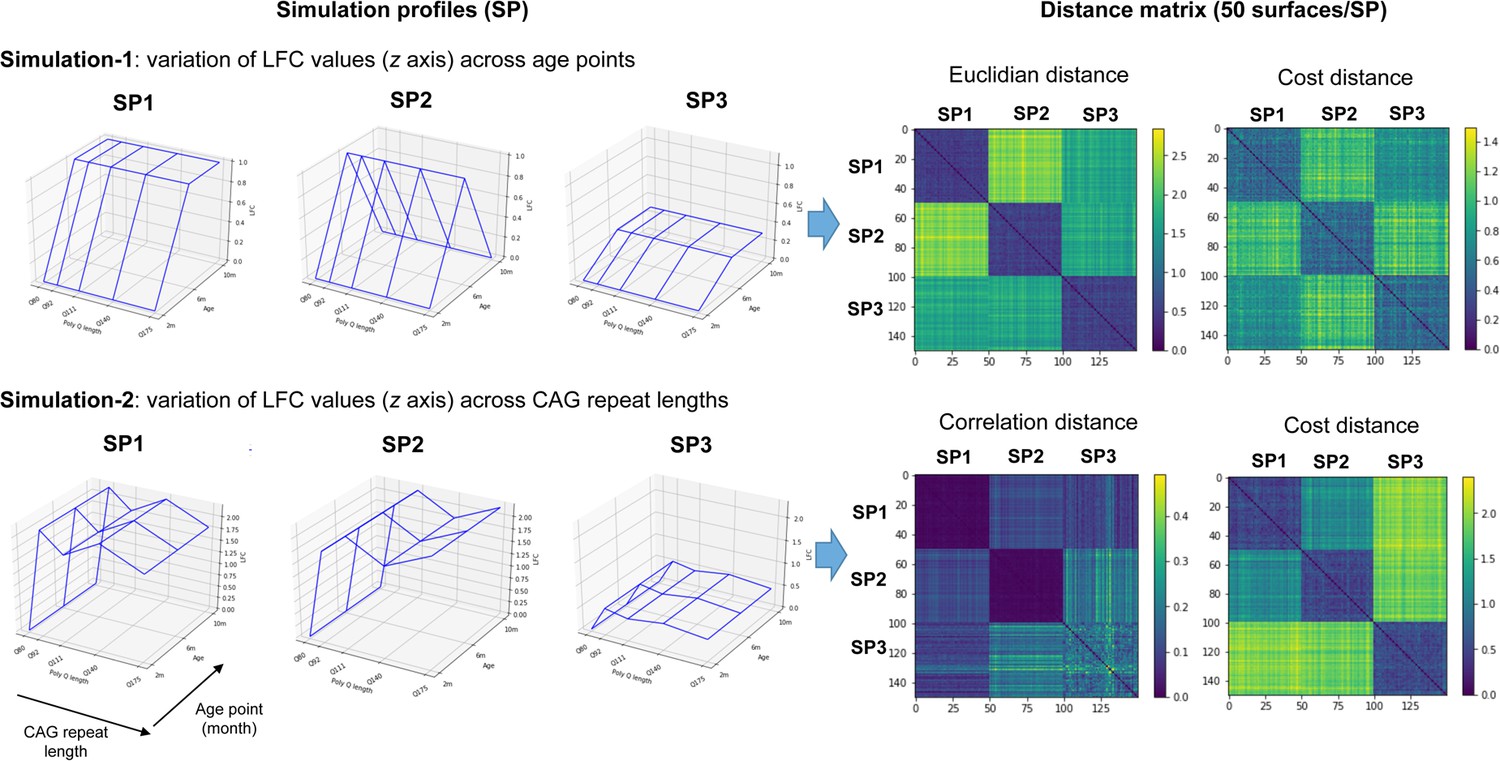
Validation studies of the cost distance for clustering gene expression surfaces.
Shown are the two types of simulation performed, each simulation involving three simulation profiles (SPs), where each profile contains 50 toy surfaces that resemble the reference surface associated to each SPs (left). Simulation 1 is devoted to test the superiority of the cost distance over the Euclidean distance, where the variation of log-fold-change (LFC) values is dependent on age and independent of the CAG repeat lengths. Simulation 2 is devoted to test the superiority of the cost distance over the correlation distance, where the variation of LFC values is dependent on CAG repeat lengths and independent of age points. Also shown are the distance matrices obtained upon using the cost distance versus the Euclidean distance (simulation 1) or the correlation distance (simulation 2) for clustering simulation surfaces (right). The x axis and y axis of the distance matrices represent the 50 surfaces in each SP, for a total of 150 surfaces.
Figure 2
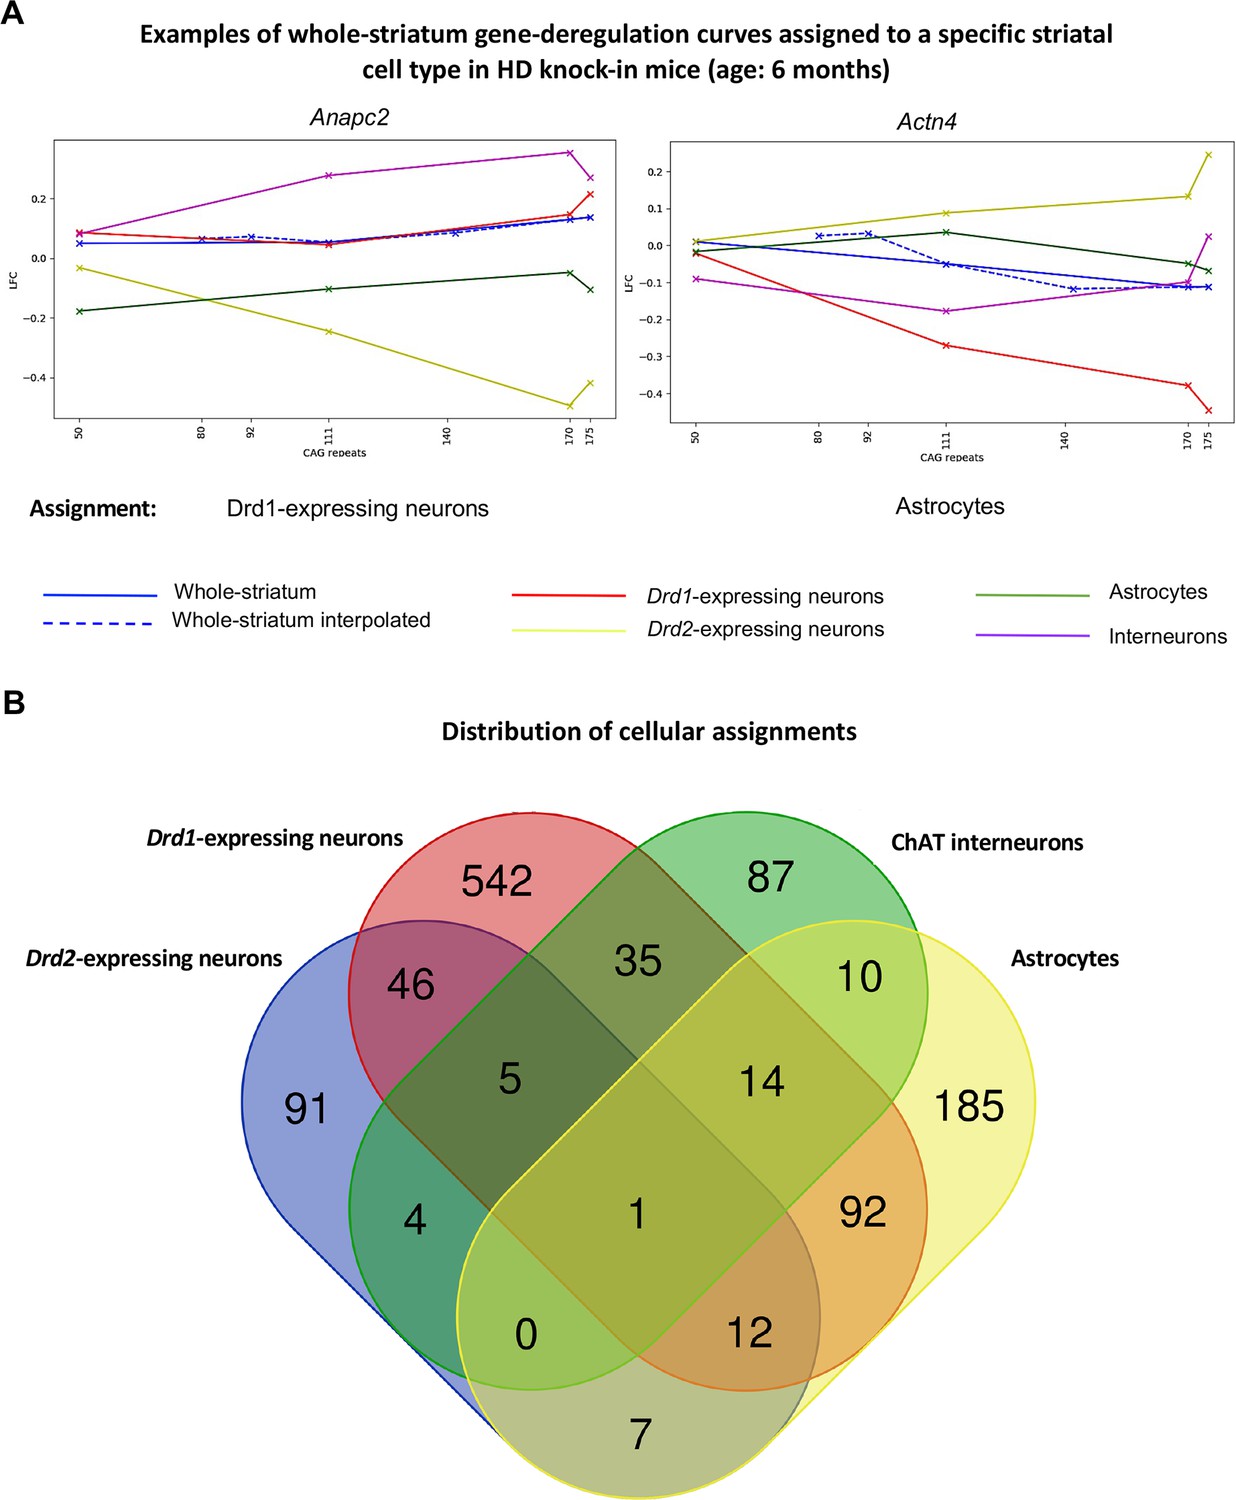
Mapping of whole-striatum gene deregulation surfaces to striatal cell types in Huntington’s disease (HD) knock-in model mice.
Geomic analysis of whole-striatum and cell-type-specific RNA-seq data using gene deregulation curves at 6 months of age (see Figure 1) attributed a total of 1390 whole-striatum gene deregulation surfaces to at least one striatal cell type (see Supplementary file 2). (A) Examples of genes for which whole-striatum deregulation was specifically mapped to Drd1-expressing neurons or to astrocytes (see also http://www.broca.inserm.fr/geomic/index.php). (B) Distribution of cellular assignment. Most expression surfaces recapitulating gene deregulation across CAG repeats and age points in the striatum of Hdh model mice were assigned to one cell type. Cellular assignment suggests that 64 genes may be similarly deregulated across CAG repeat lengths in Drd2- and Drd1-expressing neurons and that 111 genes may be similarly deregulated across CAG repeat lengths in astrocytes and either Drd2- or Drd1-expressing neurons. The Venn diagram was generated using the Venn tool at http://bioinformatics.psb.ugent.be/webtools/Venn/.
Figure 3 with 1 supplement
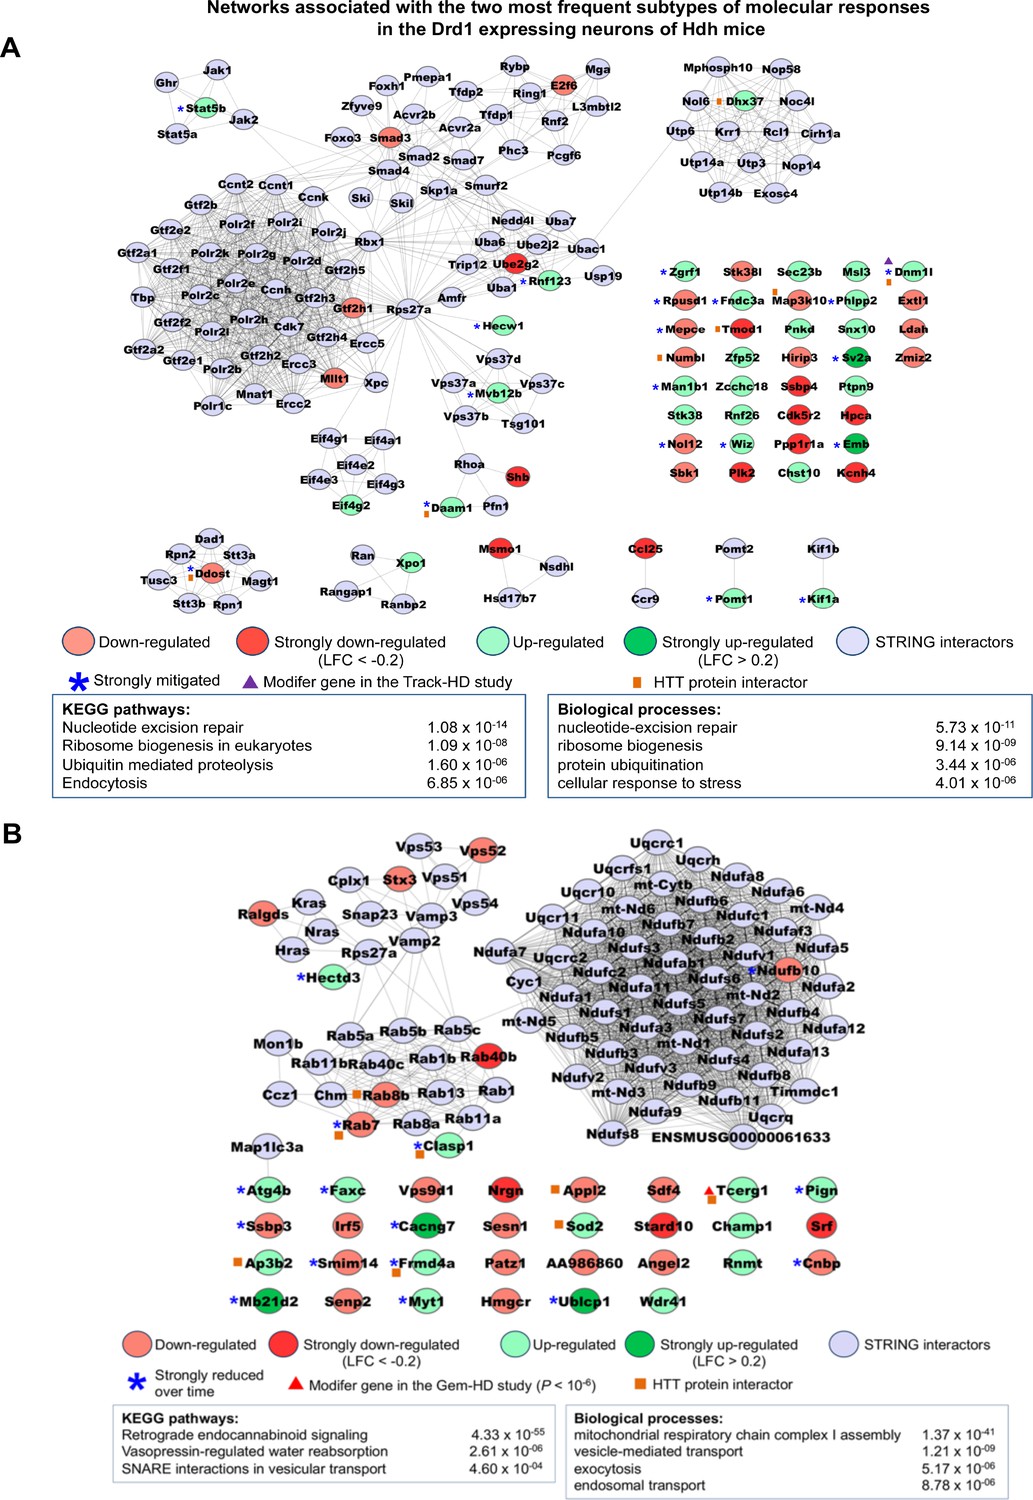
Networks associated with the most frequent temporal subtypes of molecular responses in the Drd1-expressing neurons of Huntington’s disease (HD) knock-in model mice.
Network representations of the most frequent subtypes (i.e., increased-then-reduced responses) of molecular responses that developed in Drd1-expressing neurons in the striatum of Hdh model mice. The genes retained in each of these subtypes of molecular responses (see Supplementary file 3) were used as seeds to build networks comprising high-confidence neighbors added on the first shell as inferred from the STRING database (see Materials and methods). Top 2–4 enrichments for biological annotations (KEGG pathways, gene ontology [GO] biological processes) are shown where top annotations have the smallest p-values for the largest numbers of genes as indicated by the STRING database. The networks for all subtypes of molecular responses developed by Drd1-expressing neurons can also be seen at http://www.broca.inserm.fr/geomic/index.php. (A) Pathogenic responses that are mitigated over time (n = 55 seed genes). (B) Compensatory responses that are increased then reduced (n = 39 seed genes).
Figure 3—figure supplement 1
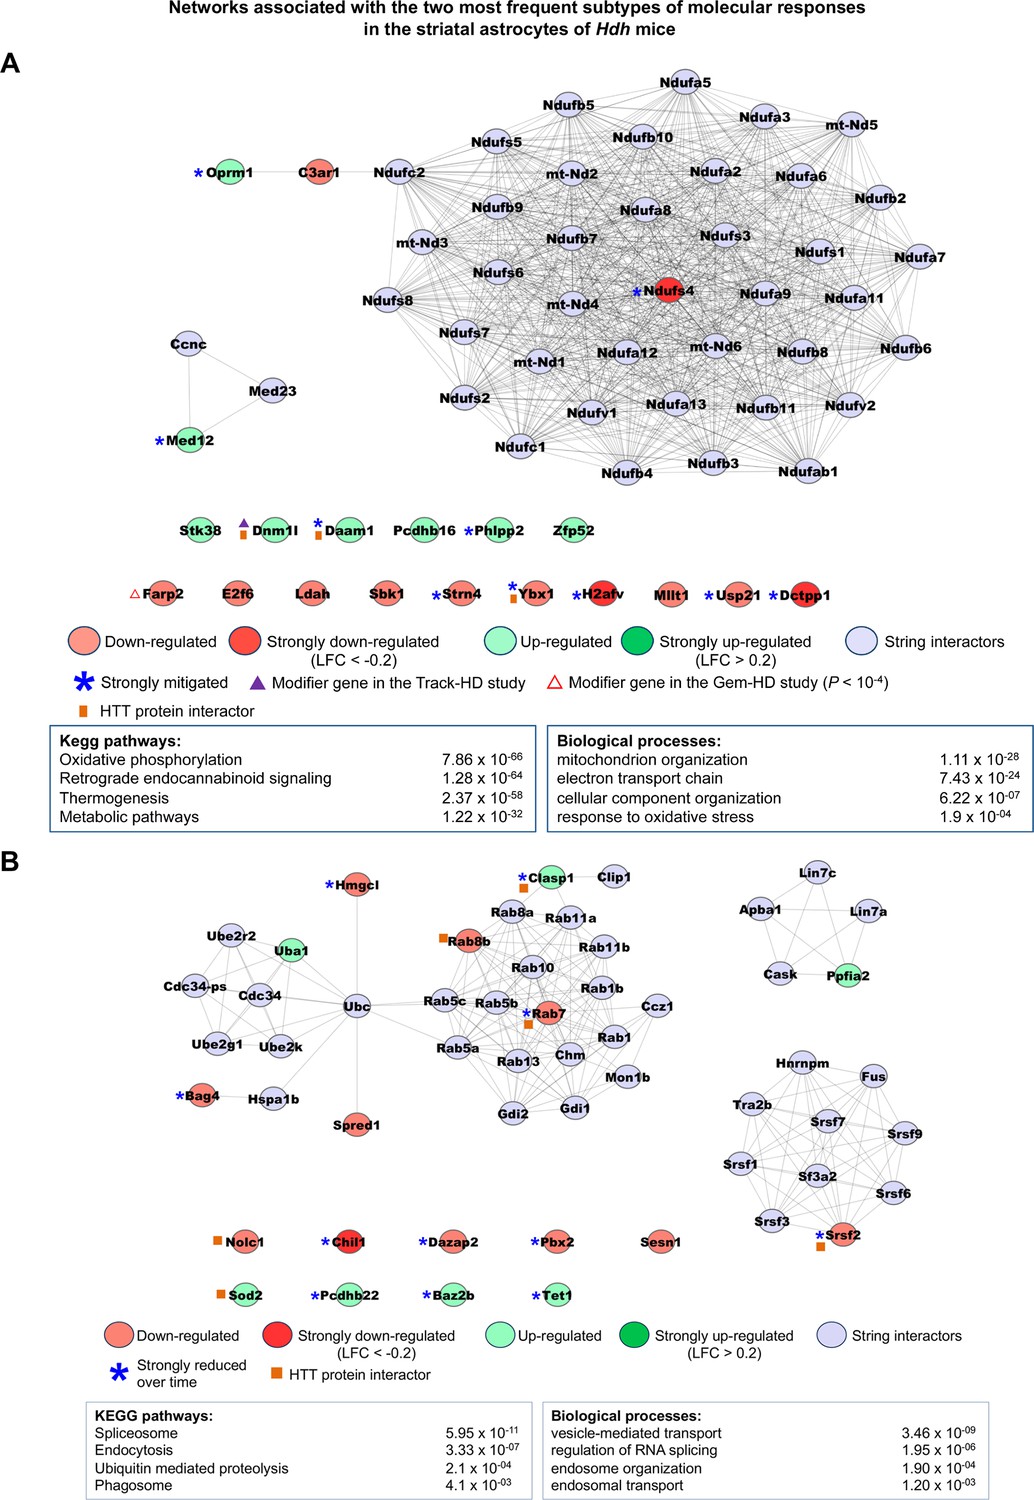
Networks associated with the most frequent temporal subtypes of molecular responses in the astrocytes of Hdh model mice.
Network representations of the most frequent subtypes (i.e., increased-then-reduced responses) of molecular responses developed by astrocytes in the striatum of Hdh model mice. The genes retained in each of these subtypes of molecular responses (see Supplementary file 3) were used as seeds to build networks comprising high-confidence neighbors added on the first shell as inferred from the STRING database (see Materials and methods). Top 2–4 enrichments for biological annotations (KEGG pathways, gene ontology [GO] biological processes) are shown where top annotations have the smallest p-values for the largest numbers of genes as indicated by the STRING database. The networks for all subtypes of molecular responses developed by astrocytes can also be seen at http://www.broca.inserm.fr/geomic/index.php. (A) Pathogenic responses that are mitigated over time (n = 20 seed genes). (B) Compensatory responses that are increased then reduced (n = 18 seed genes).
Figure 4
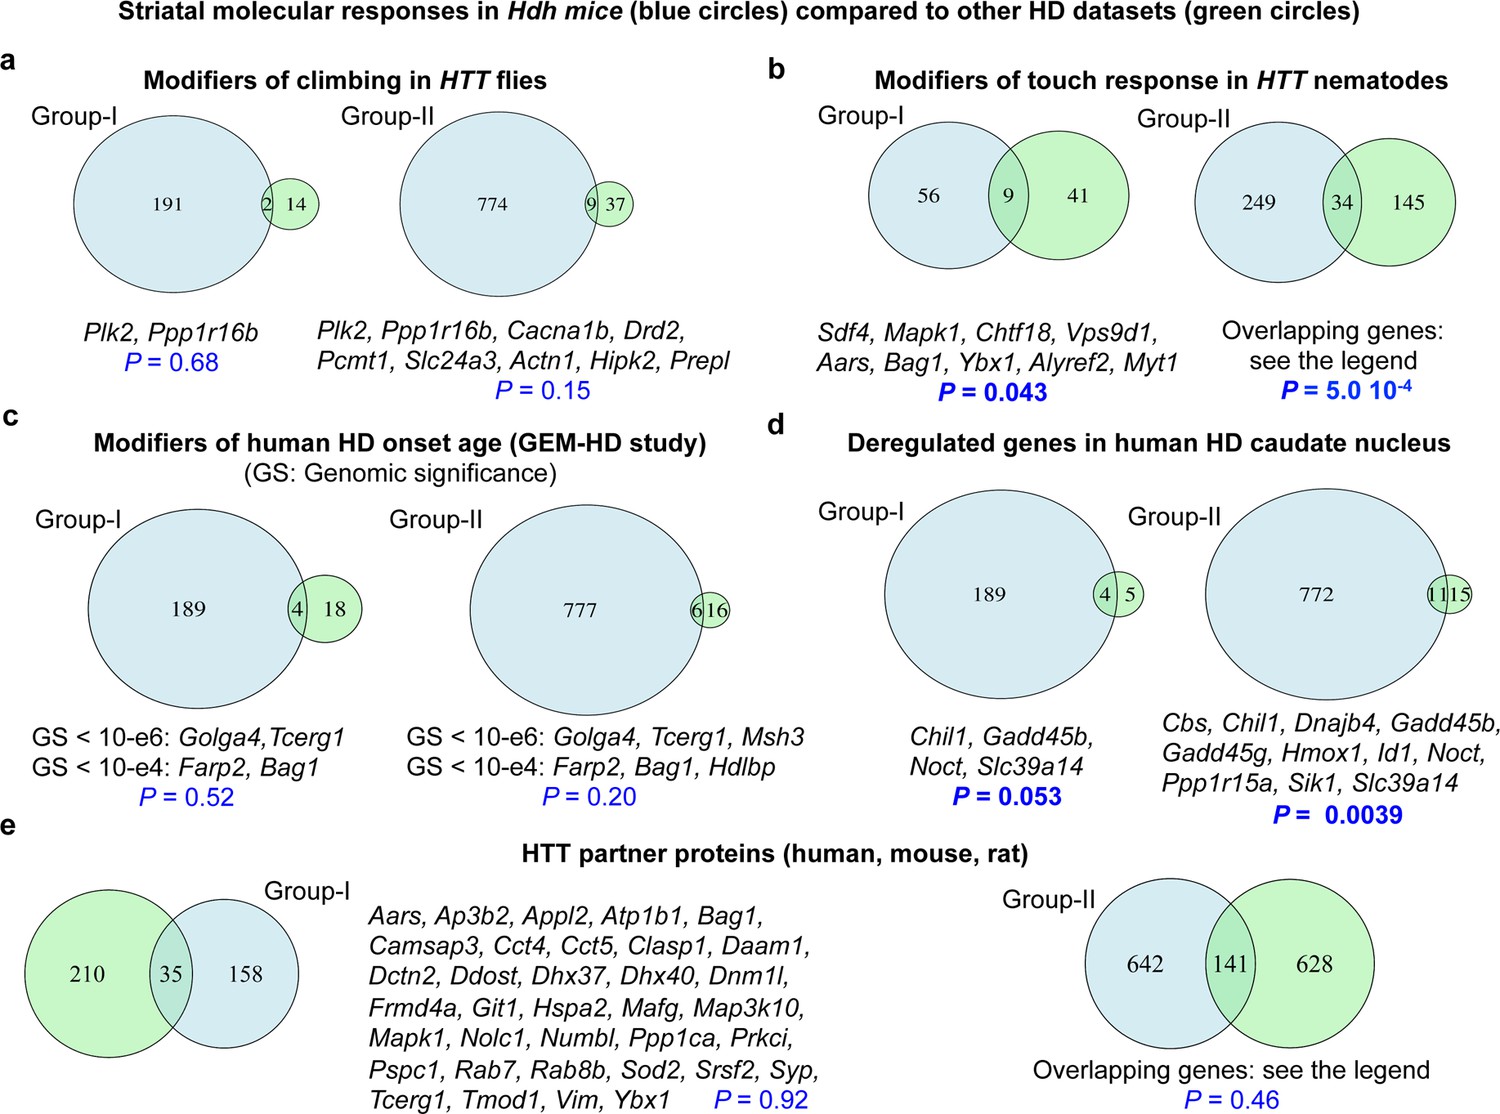
Comparison of molecular responses in the striatum of Hdh model mice to Huntington’s disease (HD) datasets.
Overlaps between the molecular responses identified by Geomic analysis in the striatum of Hdh model mice and other HD datasets. We performed these comparisons for the genes implicated in molecular responses defined at the cellular level (group I) and a larger group (group II) involving the union of group I genes and the genes that modulate neuronal survival but for which cellular assignment is not available (see Materials and methods). (A) Overlaps with genes that are conserved in Drosophila and that modify climbing in transgenic flies with pan-neuronal expression of human Htt species (Al-Ramahi et al., 2018). (B) Overlaps with genes that are conserved in Caenorhabditis elegans and that modify light-touch response in transgenic nematodes with expression of human N-terminal HTT in touch receptor neurons (Lejeune et al., 2012). Genes in overlap with group II are L3mbtl2, Slc17a6, Bche, Ugp2, Col25a1, Sdf4, Mapk1, Ccne1, Kctd3, Gabbr1, Slc23a2, Atp6v0a1, Ip6k2, Snw1, Chtf18, Pax6, Pak3, Pak1, Ltbp4, Snrpb, Vps9d1, Aars, Bag1, Lta4h, Tpo, Ybx1, Cope, Alyref2, Kbtbd4, Plscr3, Tbce, Nhp2, Uqcc1, and Myt1. (C) Overlaps with genes that are conserved in humans and that are associated with the modification of age at motor onset of HD (p<10−4) in the GEM-HD participants (Genetic Modifiers of Huntington’s Disease (GeM-HD) Consortium, 2019). (D) Overlaps with genes that are conserved in humans and that are deregulated in the caudate nucleus of HD patients (N = 2) compared to control participants (Agus et al., 2019). (E) Overlaps with established or putative HTT protein interactors, here those identified using human, mouse, and rat libraries (see the HINT resource at https://chdifoundation.org/hdinhd/). HTT protein interactors in overlap with group II are Aars, Abi2, Actn1, Actr2, Adgrg1, Akr7a5, Alg2, Ank2, Ap3b1, Ap3b2, Appl2, Arpc5, Ascc3, Atp1b1, Atp6v0a1, Atp6v1b2, Bag1, Bin1, Cacna1b, Camk2a, Camk2g, Camsap3, Cbs, Cct4, Cct5, Clasp1, Cldn11, Copa, Coro2a, Csnk2b, Cyc1, Daam1, Dapk1, Dctn1, Dctn2, Ddost, Dhx37, Dhx40, Dnajc4, Dnm1l, Drd2, Eef2, Ehbp1, Eno3, Epb41, Erap1, Fahd2a, Fbl, Fhl2, Fis1, Flot2, Frmd4a, Galnt13, Git1, Gpd2, Grm3, Hdac8, Hdlbp, Hsp90b1, Hspa2, Hspa8, Kars, Kif5c, Kpna2, Lyar, Mafg, Man1a2, Map1lc3a, Map3k10, Map6, Map7d1, Mapk1, Mbd4, Med14, Msh3, Myo1b, Nckap1, Ndufaf4, Ndufv1, Nedd4, Nf1, Nhp2, Nolc1, Nos1, Numbl, Pabpc1, Pabpn1, Pacsin3, Pak1, Pard3, Pde4b, Pex11b, Pex5l, Picalm, Pip5k1c, Pop4, Ppil3, Ppp1ca, Ppp1r12c, Prdx2, Prkci, Pspc1, Rab7, Rab8b, Rbm39, Rgs4, Rpl10a, Rps19, Rps6ka2, Rps6ka5, Rpsa, Satb1, Scarb2, Setdb1, Sfxn5, Slc17a6, Snd1, Snrpb, Snw1, Sod2, Sqstm1, Srrm1, Syp, Syt12, Taok1, Tcerg1, Tecr, Tmod1, Tpm3, Tram1, Ubtf, Uso1, Utp15, Vdac3, Vim, Vsnl1, Wdr12, Wrnip1, Ybx1, Zdbf2, and Zfp169.
Additional files
-
Supplementary file 1
List of genes for which the whole-striatum gene deregulation in Hdh model mice is assigned to a specific cell type with false discovery rate (FDR) < 0.1.
Cellular assignments are based on matching whole-striatum gene expression dysregulation curves to cell-type-specific gene expression dysregulation curves in the striatum of Hdh model mice at 6 months of age using the cost distance, after linear interpolation (see Figure 1: step 1). Data are shown for each cell type with indication of p-values and FDR values.
- https://cdn.elifesciences.org/articles/64984/elife-64984-supp1-v1.xlsx
-
Supplementary file 2
List of genes recruited in the clusters of gene deregulation surfaces and their centroids.
Data are shown for each striatal cell type in Hdh model mice. Top biological annotations (KEGG pathways and gene ontology biological processes upon STRING database analysis; see Materials and methods) are also indicated for each gene deregulation surface cluster and each cell type.
- https://cdn.elifesciences.org/articles/64984/elife-64984-supp2-v1.xlsx
-
Supplementary file 3
List of genes underlying the molecular responses defined by the integration of cluster centroid data and in vivo functional data in the striatum of Hdh model mice.
Data are shown for compensatory responses and for pathogenic responses, with indication of the evolution (increased then maintained, increased then reduced, transition) over time. The three columns labeled ‘Information on cellular assignment’ provides the cell type(s) to which gene deregulation in the whole striatum at 6 months is attributed, the weighted distance between whole-striatum and cell-type-specific log-fold-change (LFC) curves, and the false discovery rate (FDR) for the cellular assignments of gene deregulation. The six columns labeled ‘Information on molecular response in Q175 mice’ provide information on the functional effect of shRNA treatment (p-value and rank), the identity number of the gene deregulation surface (GDS) centroid to which the gene belongs, temporal subtype of molecular response, strength of mitigation (if applicable), and maximum deregulation of gene expression across age points.
- https://cdn.elifesciences.org/articles/64984/elife-64984-supp3-v1.xlsx
-
Transparent reporting form
- https://cdn.elifesciences.org/articles/64984/elife-64984-transrepform-v1.docx
Download links
A two-part list of links to download the article, or parts of the article, in various formats.
Downloads (link to download the article as PDF)
Open citations (links to open the citations from this article in various online reference manager services)
Cite this article (links to download the citations from this article in formats compatible with various reference manager tools)
Shape deformation analysis reveals the temporal dynamics of cell-type-specific homeostatic and pathogenic responses to mutant huntingtin
eLife 10:e64984.
https://doi.org/10.7554/eLife.64984


