Adiponectin preserves metabolic fitness during aging
- Touchstone Diabetes Center, Department of Internal Medicine, The University of Texas Southwestern Medical Center, United States
- Department of Endocrinology and Metabolism, Tianjin Medical University General Hospital, China
- Department of Radiology, University of Texas Southwestern Medical Center, United States
- Department of Comparative Medicine and Immunobiology, Yale School of Medicine, United States
- Yale Center for Research on Aging, Yale School of Medicine, United States
- Department of Cell Biology, The University of Texas Southwestern Medical Center, United States
Figures
Figure 1 with 1 supplement
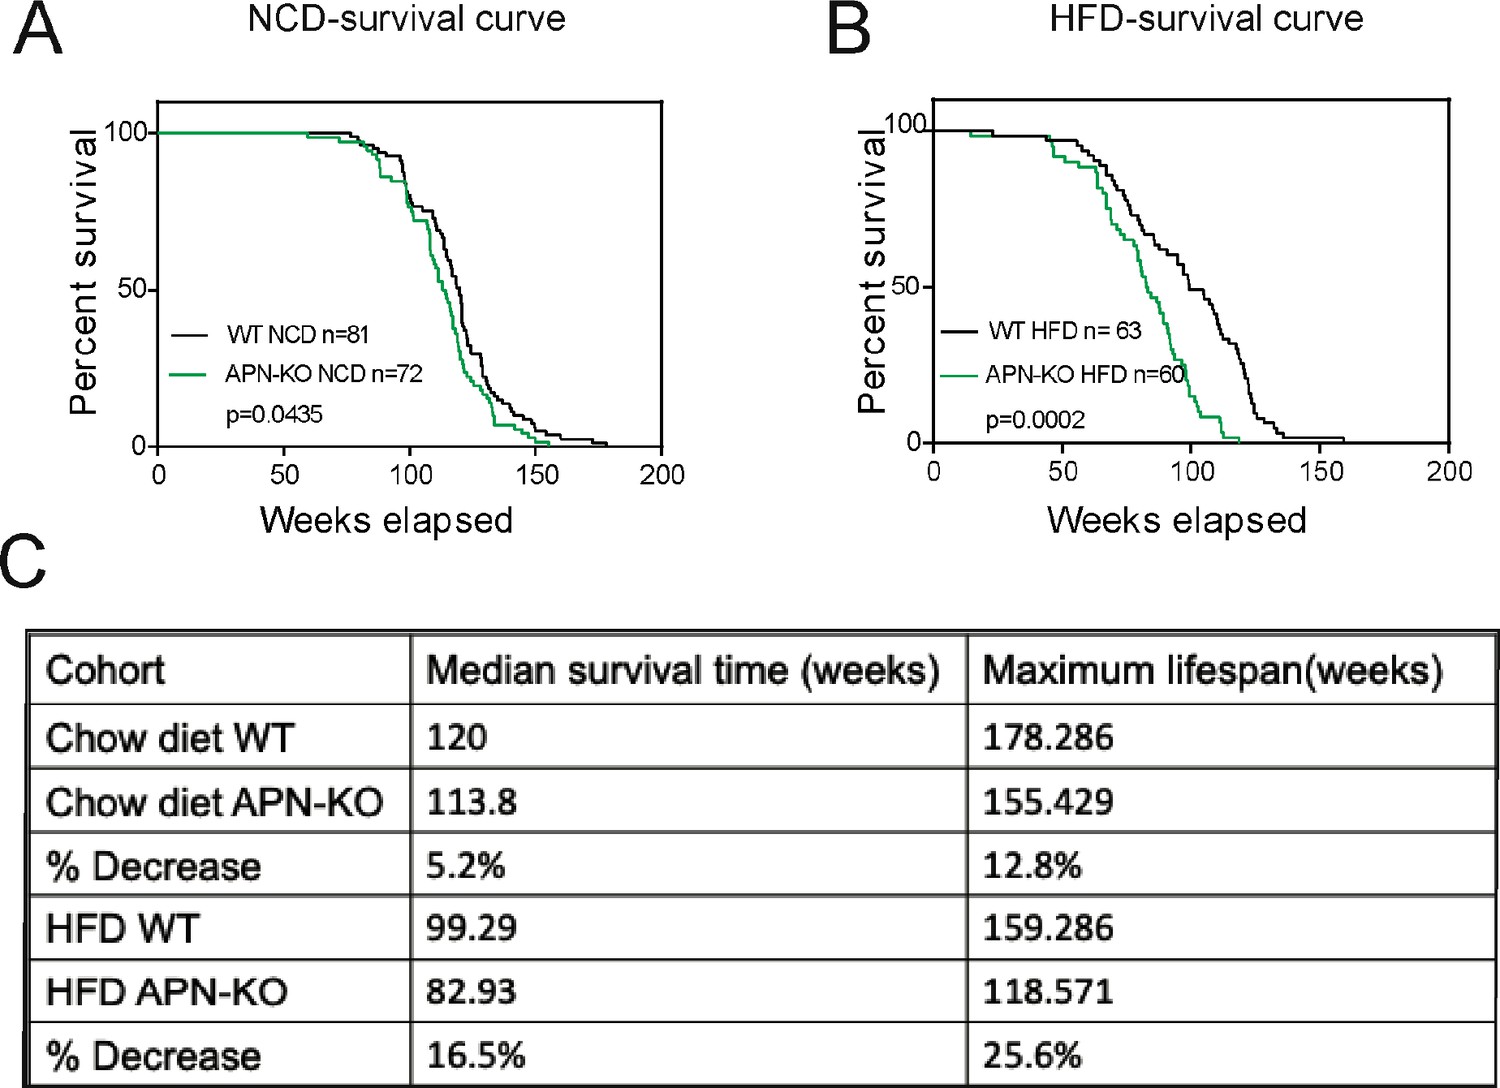
Lack of adiponectin (APN) in aging mice shortens lifespan.
(A) Kaplan–Meier survival curves for wild-type (WT) and adiponectin null (APN-KO) mice on chow diet. (B) Kaplan–Meier survival curves for WT and APN-KO mice on high-fat diet (HFD). (C) Median survival time and maximum lifespan for each cohort. n denotes the number of mice per group.p-Values were determined by log-rank (Mantel–Cox) test.
Figure 1—figure supplement 1
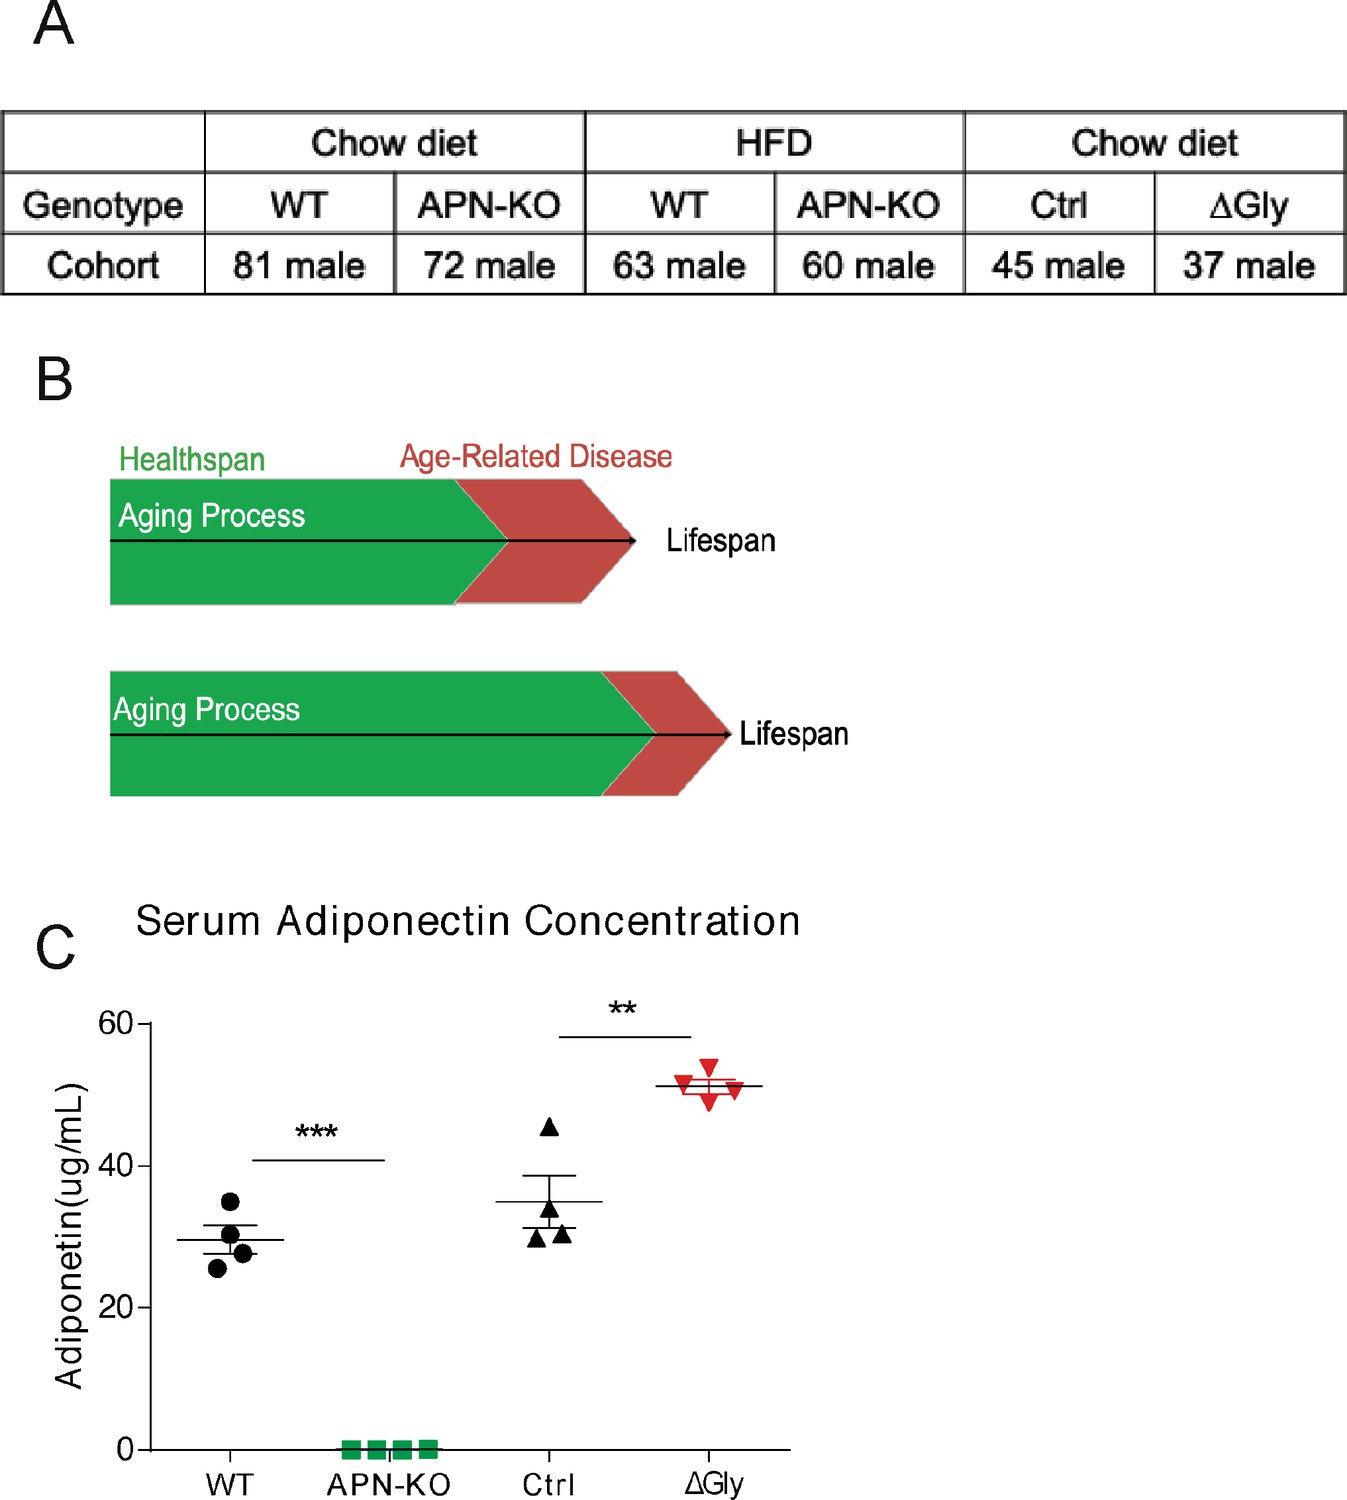
Mouse models used for longevity studies: adiponectin null (APN-KO) mice and adiponectin transgenic (ΔGly) mice.
(A) Experimental strategy for longevity experiments. (B) Diagram of the aging process. Lifespan and healthspan are always strongly coupled. (C) Circulating adiponectin levels measured in 50-week-old APN-KO and ΔGly mice with their controls fed on chow diet, respectively (n = 4 per group).
Figure 2 with 1 supplement
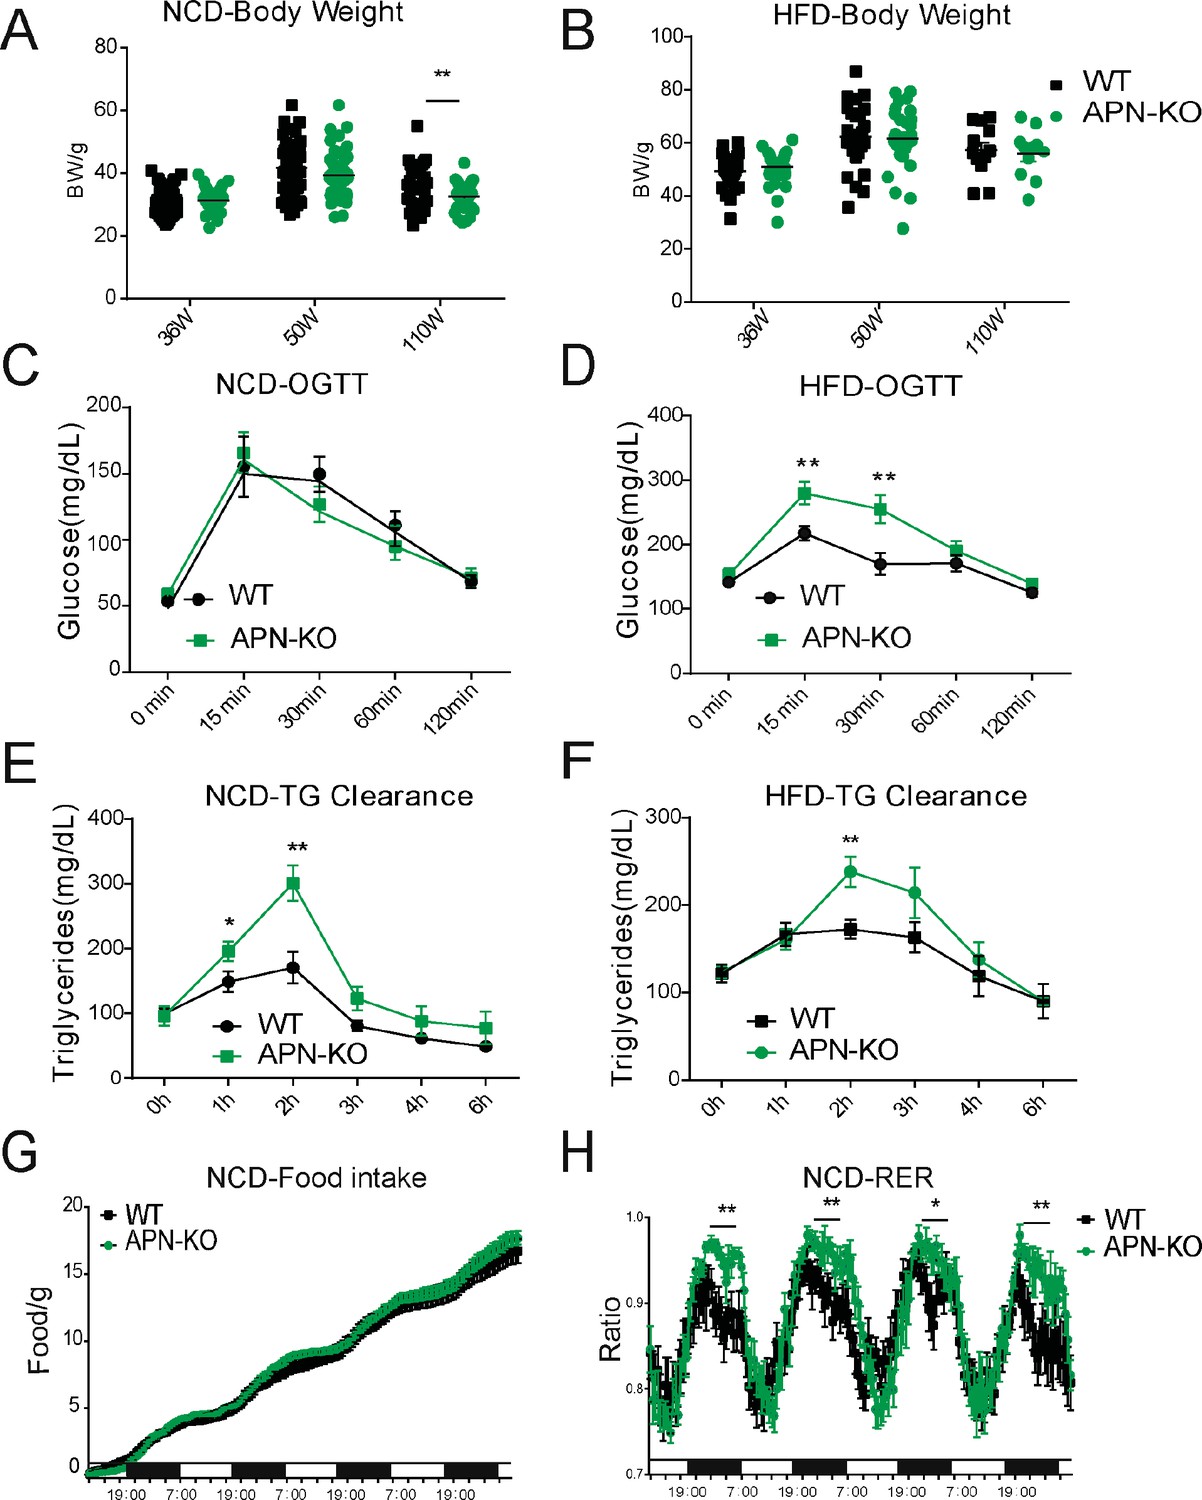
Lack of adiponectin (APN) in aging mice worsens glucose and lipid homeostasis.
(A) Body weights during aging processes for wild-type (WT) and adiponectin null (APN-KO) mice fed on chow diet. (B) Body weights during aging processes for WT and APN-KO mice fed on high-fat diet (HFD). (C) An oral glucose tolerance test (OGTT) (2 g kg−1 body weight; single gavage) on chow diet-feeding WT and APN-KO mice at 110 weeks old (n = 7 per group). (D) An OGTT (1.25 g kg−1 body weight; single gavage) on HFD-feeding WT and APN-KO mice at 85-weeks old (n = 8 for WT, n = 7 for APN-KO mice). (E) Triglyceride (TG) clearance test (20% intralipid; 15 μl g−1 body weight; single gavage) in chow diet-feeding WT and APN-KO mice at 110 weeks old (n = 9 for WT, n = 10 for APN-KO mice). (F) TG clearance test (20% intralipid; 15 μl g−1 body weight; single gavage) in HFD-feeding WT and APN-KO mice at 85 weeks old (n = 8 per group). (G) Metabolic cage analyses showing food intake for chow diet-feeding WT in APN-KO mice at 110 weeks old (n = 8 for WT, n = 7 for APN-KO mice). Data are mean ± SEM. Student’s t test: *p<0.05, **p<0.01, ***p<0.001 for WT vs. APN-KO. (H) Metabolic cage analyses showing respiratory exchange rate (RER) chow diet-feeding WT and APN-KO mice at 110 weeks old (n = 8 for WT, n = 7 for APN-KO mice). Data are mean ± SEM. Student’s t test: *p<0.05, **p<0.01, ***p<0.001 for WT vs. APN-KO.
Figure 2—figure supplement 1
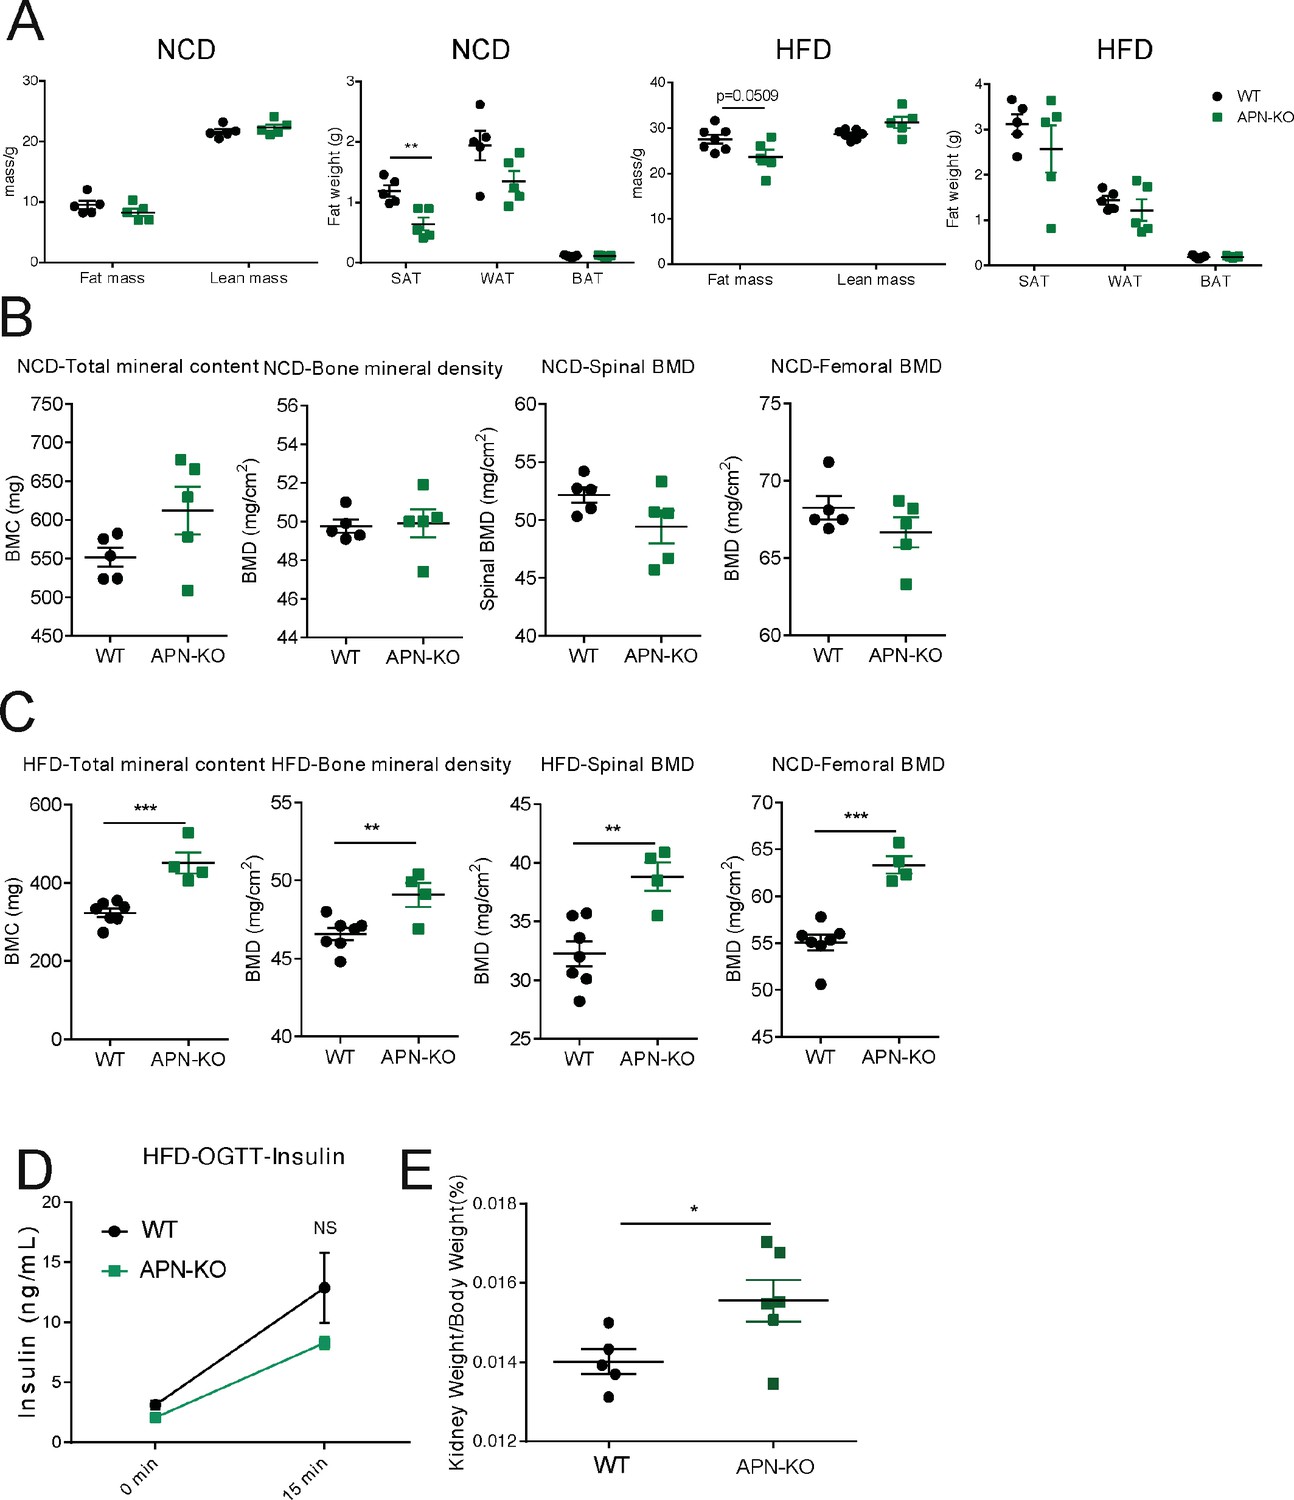
Body composition of wild-type (WT) mice and adiponectin null (APN-KO) mice.
(A) Fat mass, lean mass, and relative subcutaneous, visceral, and brown fat pad weights of 140-weeks old WT(n=5) and APN-KO (n=5) mice fed chow diet or 100-week-old WT (n = 5–7) and APN-KO mice (n = 5) fed on high-fat diet (HFD) (B) Bone mineral content, bone mineral density, spinal bone mineral density, and femoral bone mineral density of 140-week-old WT and APN-KO mice fed on chow diet (n = 5 per group). (C) Bone mineral content, bone mineral density, spinal bone mineral density, and femoral bone mineral density of 100-week-old WT (n = 7) and APN-KO mice (n = 4) fed HFD. (D) No difference in insulin levels during oral glucose tolerance tests (OGTTs) in aged WT and APN-KO mice on HFD (n = 8 for WT, n = 7 for APN-KO mice). (E) The relative wet kidney weight with respect to body weight of 140-week-old WT and APN-KO mice fed on chow diet (n = 5 for WT, n = 6 for APN-KO mice). Bar, 100 μm. Data are mean ± SEM. Student’s t test: *p<0.05, **p<0.01, ***p<0.001 for WT vs. APN-KO.
Figure 3
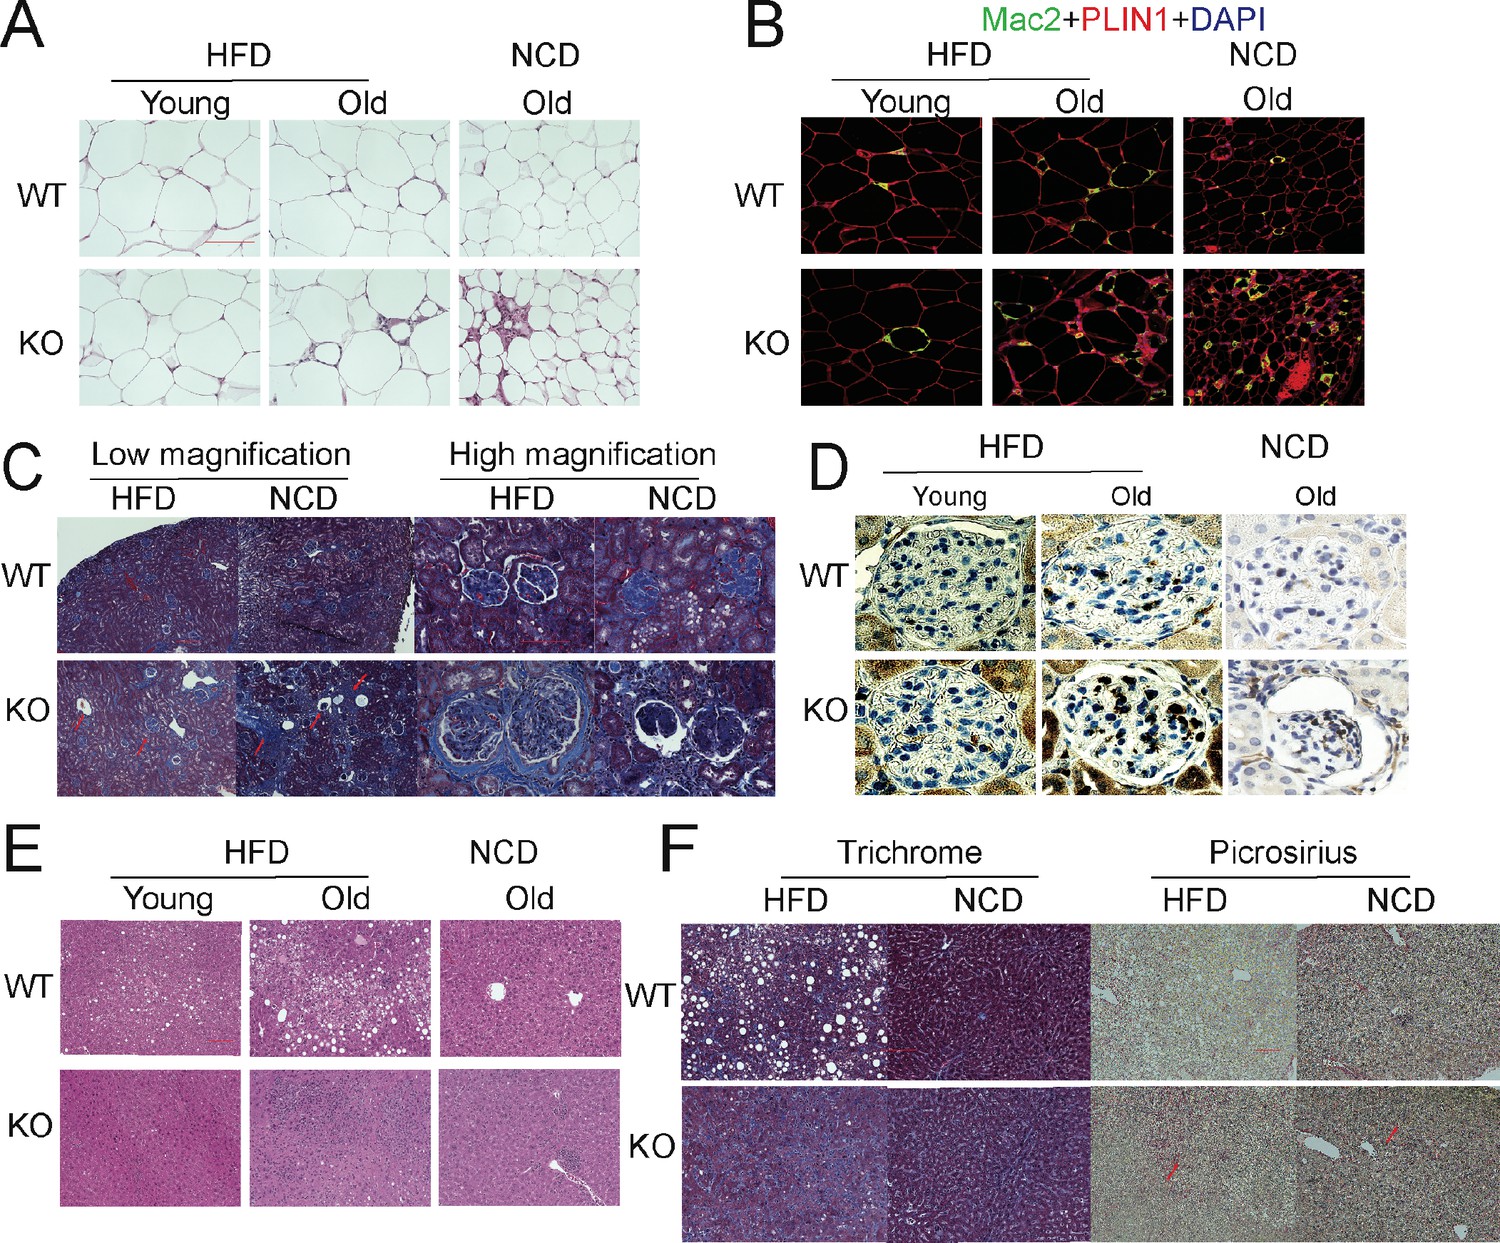
Deletion of adiponectin (APN) in aged mice exacerbates functional decline.
(A) H&E staining of an Epi fat depot of 20-week-old and 100-week-old wild-type (WT) and adiponectin null (APN-KO) mice fed on high-fat diet (HFD) or 140-week-old WT and APN-KO mice on chow diet. (B) Mac2 staining of an Epi fat depot of 20-week-old and 100-week-old WT and APN-KO mice fed on HFD or 140-week-old WT and APN-KO mice on chow diet. (C) Trichrome staining of kidney sections reveals severe interstitial and periglomerular fibrosis in 110-week-old APN-KO mice fed on HFD and 140-week-old APN-KO mice fed on chow diet. Collapsed tufts are seen inside widened Bowman’s capsules forming glomerular cysts (red arrow). (D) Mac2 staining of kidney sections of 20-week-old and 100-week-old WT and APN-KO mice fed on HFD or chow diet. (E) H&E staining of liver of 20-week-old and 100-week-old WT and APN-KO mice fed on HFD, 140-week-old WT and APN-KO mice on chow diet. Note the extensive inflammatory cell infiltrates in the liver of the aged APN-KO mice fed on HFD. (F) Trichrome and Picrosirius stains of liver sections from 100-week-old WT and APN-KO mice fed on HFD or 140-week-old WT and APN-KO mice on chow diet examine liver fibrosis. Bar, 100 μm. Data are mean ± SEM. Student’s t test: *p<0.05, **p<0.01, ***p<0.001 for WT vs. APN-KO.
Figure 4 with 1 supplement

Absence of adiponectin (APN) in aged mice exacerbates inflammation and accelerates aging.
(A) Expression of inflammatory markers in epididymal fat depots of 140-week-old wild-type (WT) and adiponectin null (APN-KO) mice fed on chow diet and 100-week-old WT and APN-KO fed on HFD(n = 10 per group). (B) Expression of inflammatory markers in kidneys of 140-week-old WT and APN-KO mice fed on chow diet and 100-week-old WT and APN-KO HFD (n = 8–10 per group). (C) FACS analysis of percentages of total macrophages, Kupffer cells, and monocytes-derived macrophages isolated from 100-week-old WT and APN-KO mice fed on HFD (n = 3 per group). (D) Expression of inflammatory and fibrosis markers in liver tissues of 20-week-old and 100-week-old WT and APN-KO mice fed on HFD (n = 5 per group of young cohorts, n = 6 per group of aged cohorts). (E) Serum AST and ALT activities in 100-week-old WT and APN-KO mice fed on HFD (n = 6 per group). (F) β-Galactosidase staining of kidney and liver sections from 100-week-old WT and APN-KO mice fed on HFD or 140-week-old WT and APN-KO mice on chow diet examines cellular senescence. (G) Expression of senescence biomarkers in kidneys and livers of 140-week-old WT (n = 6 or 10) and APN-KO mice fed on chow diet (n = 10). (H) Expression of senescence biomarkers in kidneys and livers of 100-week-old WT (n = 7–10) and APN-KO mice fed on HFD (n = 8–10). Bar, 100 μm. Data are mean ± SEM. Student’s t test: *p<0.05, **p<0.01, ***p<0.001 for WT vs. APN-KO.
Figure 4—figure supplement 1
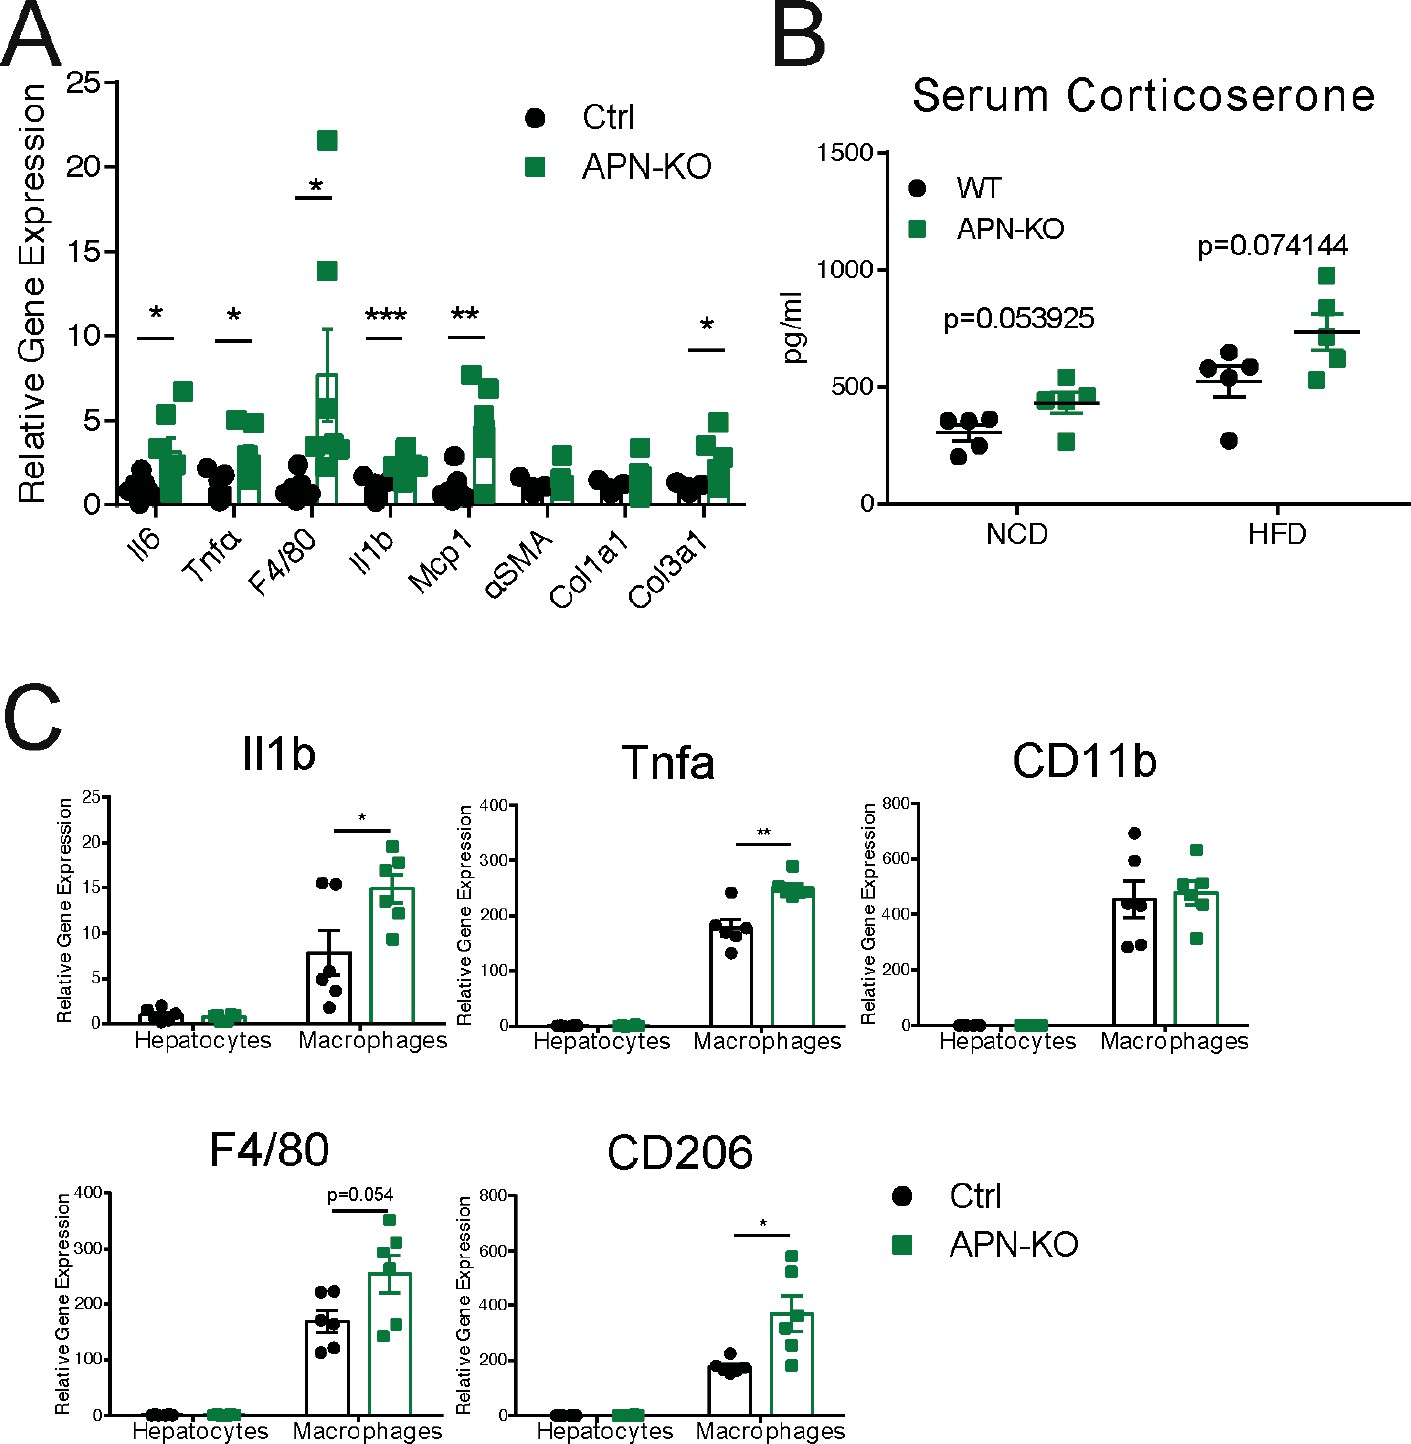
Adiponectin deficiency in aged mice exacerbates inflammation and accelerates aging.
(A) Expression of inflammatory and fibrosis markers in liver of 140-week-old wild-type (WT) and adiponectin null (APN-KO) mice fed on chow diet (n = 7 for WT, n = 7 for APN-KO mice). (B) Serum corticosterone level in 100-week-old WT and APN-KO mice fed on HFD or 140-week-old WT and APN-KO mice fed on chow diet (n = 5 per group). (C) IL1β, TNFα, CD11b, F4/80, CD206, Chil3 mRNA expression were measured from FACS-sorted hepatocytes and macrophages isolated from 100-week-old WT and APN-KO mice fed on HFD (n = 6 per group). Bar, 100 μm. Data are mean ± SEM. Student’s t test: *p<0.05, **p<0.01, ***p<0.001 for WT vs. APN-KO.
Figure 5
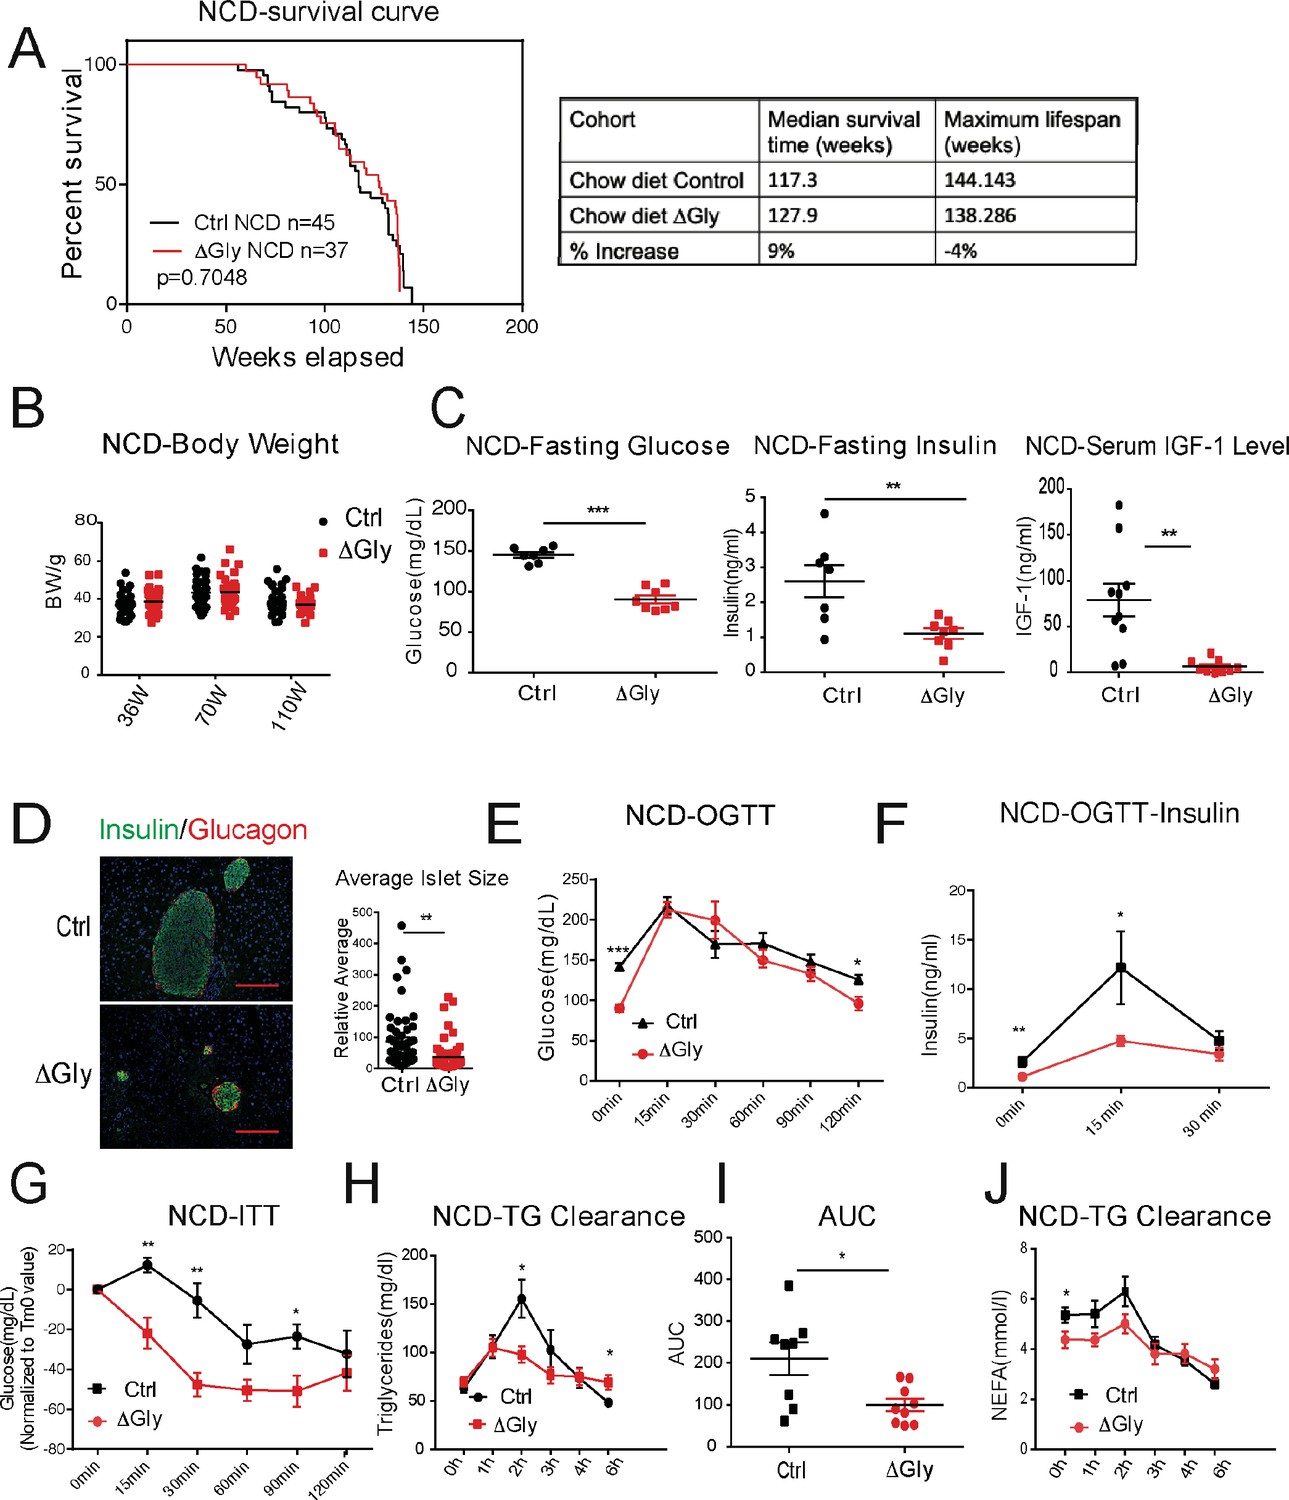
Increasing adiponectin protects against aging-induced metabolic disturbance.
(A) Kaplan–Meier survival curves for controls and ΔGly mice on chow diet. Median survival time and maximum lifespan for each cohort. n denotes the number of mice per group. p-Values were determined by log-rank (Mantel–Cox) test. (B) Body weights during aging processes for controls and ΔGly mice fed on chow diet. (C) Systemic glucose, insulin, and insulin-like growth factor 1 (IGF-1) levels in 50-week-old controls and ΔGly mice after fasting 16 hr. (D) Insulin and glucagon IF staining of pancreases from controls and ΔGly mice at 140 weeks old (left). Right: Relative average islet size. (E) An oral glucose tolerance test (OGTT) (2 g kg−1 body weight; single gavage) revealed marginally improved glucose tolerance in 50-week ΔGly compared with controls (n = 8 per group). (F) Serum insulin levels during glucose tolerance test performed in panel E (n = 7 for controls, n = 8 for ΔGly mice). (G) Insulin tolerance test (ITT) in controls and ΔGly mice at 50 weeks old (n = 8 per group). (H) Triglyceride (TG) clearance test in controls and ΔGly mice at 50 weeks old (n = 8 for controls, n = 9 for ΔGly mice). (I) Area under curve (AUC) calculated based on H. (J) Circulating free fatty acid (FFA) levels in controls and ΔGly mice at 50 weeks old during TG clearance performed in panel H (n = 8 for controls, n = 9 for ΔGly mice). Bar, 100 μm. Data are mean ± SEM. Student’s t test: *p<0.05, **p<0.01, ***p<0.001 for controls vs. ΔGly.
Figure 6
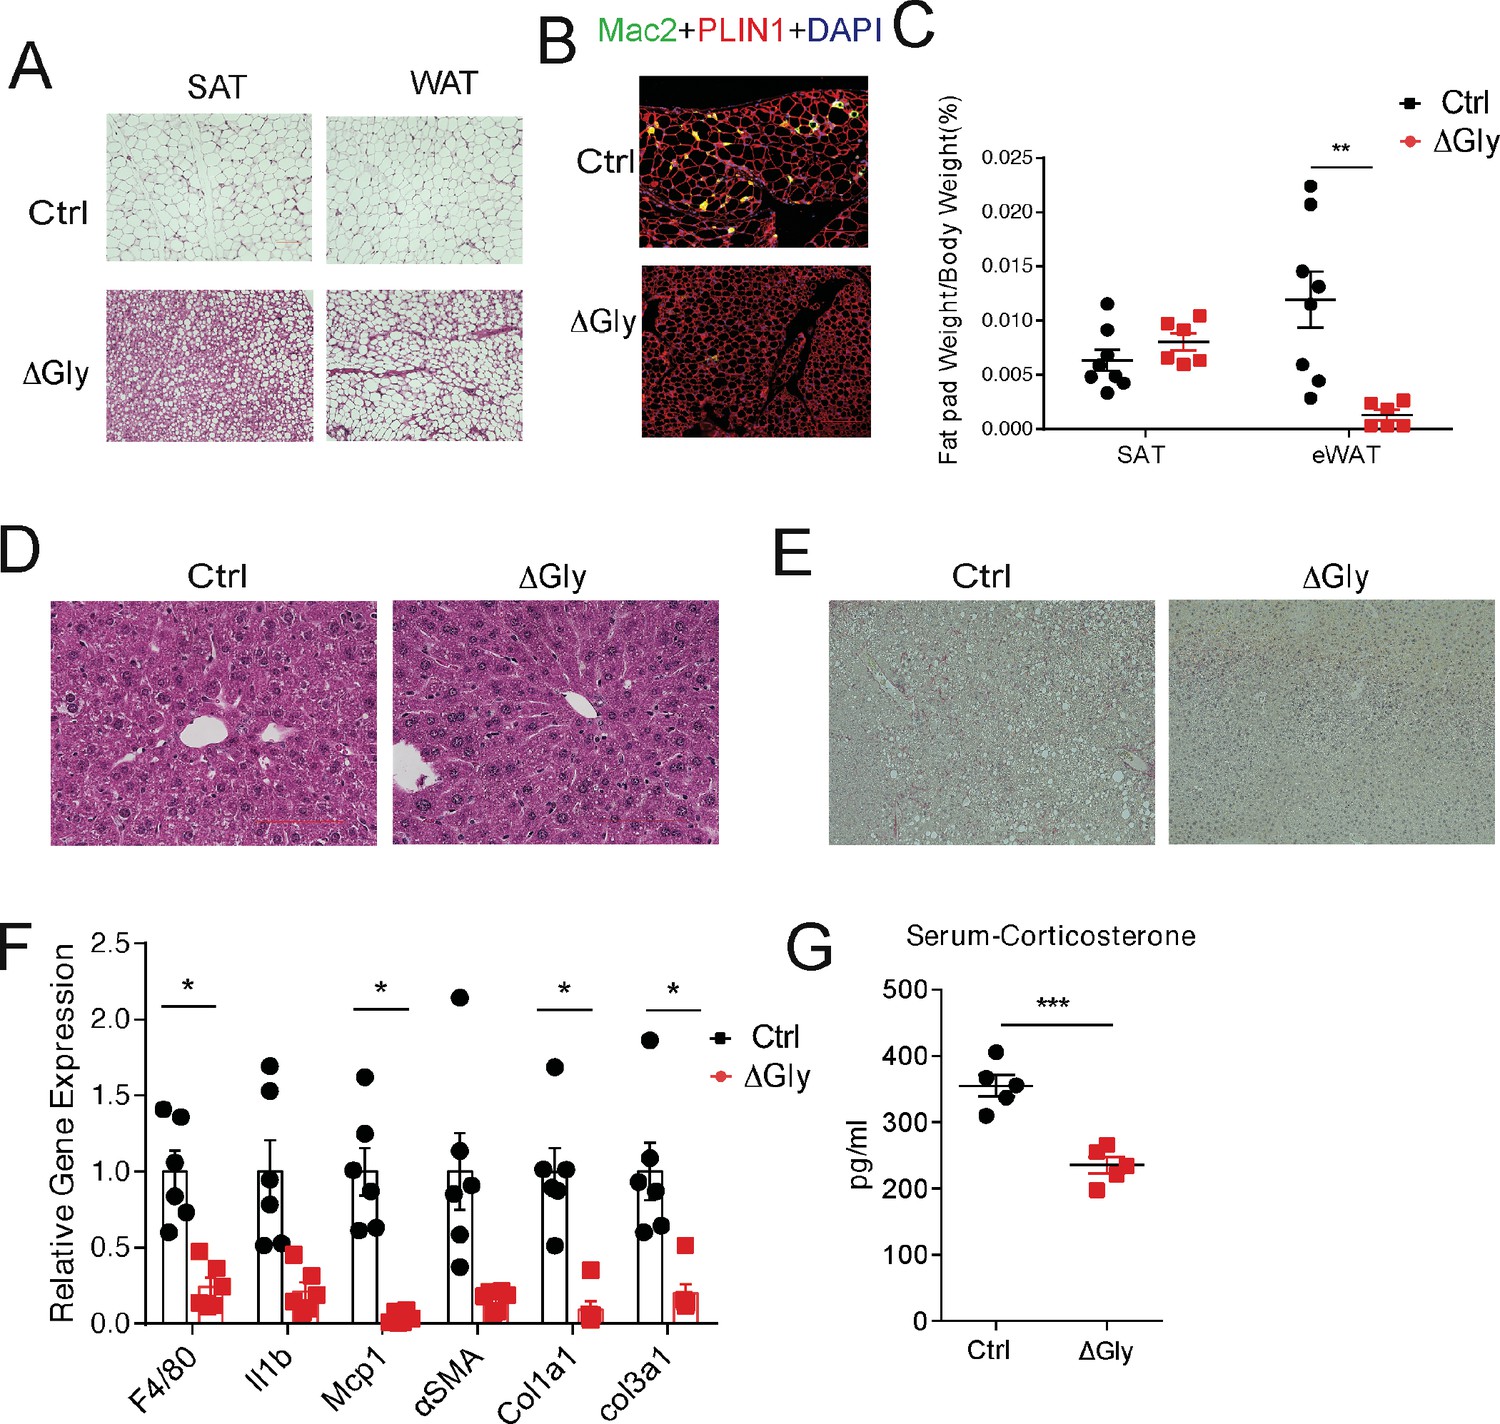
Old adiponectin overexpressing mice exhibit improved glucose and lipid homeostasis.
(A) H&E staining of SubQ fat depot and Epi fat depot of 140-week-old controls and ΔGly mice fed on chow diet. (B) Mac2 staining of epididymal fat sections in 140-week-old controls and ΔGly mice. (C) Relative subcutaneous and visceral fat pad weights of 140-week-old controls and ΔGly mice fed on chow diet (n = 8 for controls, n = 6 for ΔGly mice). (D) H&E staining of liver from 140-week-old controls and ΔGly mice fed on chow diet. (E) Picrosirius red staining of livers from 140-week-old controls and ΔGly mice fed on chow diet. (F) Expression of inflammatory and fibrosis markers in liver of 140-week-old controls and ΔGly mice fed on chow diet (n = 8 for controls, n = 6 for ΔGly mice). (G) Serum corticosterone level in 140-week-old controls and ΔGly mice fed on chow diet (n = 5 per group). Bar, 100 μm. Data are mean ± SEM. Student’s t test: *p<0.05, **p<0.01, ***p<0.001 for controls vs. ΔGly.
Tables
Key resources table
| Reagent type (species) or resource | Designation | Source or reference | Identifiers | Additional information |
|---|---|---|---|---|
| Genetic reagent (Mus musculus) | WT C57BL/6J | Jackson Laboratory | JAX 000664 RRID:IMSR_JAX:000664 | N/A |
| Genetic reagent (Mus musculus) | APN-KO | PMID:16326714 | N/A | N/A |
| Genetic reagent (Mus musculus) | ΔGly | PMID:14576179 | N/A | N/A |
| Chemical compound, drug | TRIzolTM Reagent | Thermo Fisher | Cat# 15596018 | N/A |
| Chemical compound, drug | Insulin | Eli Lilly | Product ID: A10008415 | N/A |
| Chemical compound, drug | Dulbecco’s phosphate buffered saline | Sigma-Aldrich | Cat# D806552 | N/A |
| Chemical compound, drug | High-fat diet (HFD) | Research Diets | Cat# D12492 | N/A |
| Chemical compound, drug | DAPI | Life Technology | Cat# P36941 | N/A |
| Chemical compound, drug | Bovine serum albumin | Sigma | Cat# A9418 | N/A |
| Commercial assay or kit | Adiponectin ELISA kit | Invitrogen | Cat# EZMADP-60K RRID:AB_2651034 | N/A |
| Commercial assay or kit | Insulin ELISA Jumbo kit | ALPCO | Cat# 80-INSMS-E10 | N/A |
| Commercial assay or kit | Mouse/rat IGF-1 Quantikine ELISA kit | R and D | R and D Systems, Inc, Minneapolis, MN | N/A |
| Commercial assay or kit | Corticosterone Competitive ELISA kit | Invitrogen | Cat# EIACORT | N/A |
| Commercial assay or kit | iScript cDNA synthesis kit | BIO-RAD | Cat# 170–8891 | N/A |
| Commercial assay or kit | Sybr Green Master Mix | Thermo Fisher | Cat# A25778 | N/A |
| Commercial assay or kit | Senescence detection kit | Abcom | Cat#: AB65351 | N/A |
| Antibody | Mac2 (rat monoclonal) | BioLegend | Cat# 125401 RRID:AB_1134237 | IF(1:500) IHC(1:500) |
| Antibody | Perilipin (goat polyclonal) | Novus | Cat# NB100-60554 RRID:AB_922242 | IF(1:500) |
| Antibody | Insulin (guinea pig polyclonal) | Dako | Cat# A0564 RRID:AB_10013624 | IF(1:500) |
| Antibody | Glucagon (rabbit polyclonal) | Invitrogen | Cat# 15954–1-AP RRID:AB_2878200 | IF(1:500) |
| Antibody | Alexa Fluor 488 goat anti-guinea pig IgG (HCL) | Invitrogen | Cat# A-11073 RRID:AB_2534117 | IF(1:250) |
| Antibody | Alexa Fluor 594 donkey anti-rabbit IgG (HCL) | Invitrogen | Cat# A32754 RRID:AB_2762827 | IF(1:250) |
| Antibody | Alexa Fluor 594 donkey anti-goat IgG (HCL) | Invitrogen | Cat# A32758 RRID:AB_2762828 | IF(1:250) |
| Antibody | Alexa Fluor 488 goat anti-rat IgG (HCL) | Invitrogen | Cat# A48262 | IF(1:250) |
| Antibody | CD45-PerCP/Cyanine5.5 (rat monoclonal) | Biolegend | Cat# 103132 RRID:AB_893340 | FACS(1:400) |
| Antibody | CD11b-Pacific Blue (rat monoclonal) | Biolegend | Cat# 101224 RRID:AB_755986 | FACS(1:200) |
| Antibody | F4/80 -PE (rat monoclonal) | Biolegend | Cat# 123110 RRID:AB_893486 | FACS(1:200) |
| Antibody | CD11c -APC (Armenian Hamster monoclonal) | Biolegend | Cat# 117310 RRID:AB_313779 | FACS(1:200) |
| Antibody | CD206 -FITC (rat monoclonal) | Biolegend | Cat# 141703 RRID:AB_10900988 | FACS(1:200) |
| Sequence-based reagent | Gapdh _F | This paper | PCR primers | TGTGAACGGATTTGGCCGTA |
| Sequence-based reagent | Gapdh _R | This paper | PCR primers | ACTGTGCCGTTGAATTTGCC |
| Sequence-based reagent | F4/80_F | This paper | PCR primers | TGACTCACCTTGTGGTCCTAA |
| Sequence-based reagent | F4/80_R | This paper | PCR primers | CTTCCCAGAATCCAGTCTTTCC |
| Sequence-based reagent | IL-6_F | This paper | PCR primers | CCAGAGATACAAAGAAATGATGG |
| Sequence-based reagent | IL-6_R | This paper | PCR primers | ACTCCAGAAGACCAGAGGAAAT |
| Sequence-based reagent | TNFα_F | This paper | PCR primers | GAGAAAGTCAACCTCCTCTCTG |
| Sequence-based reagent | TNFα_R | This paper | PCR primers | GAAGACTCCTCCCAGGTATATG |
| Software, algorithm | Prism | GraphPad Software | GraphPad Software | N/A |
| Software, algorithm | Illustrator | Adobe | N/A | N/A |
| Other | Keyence BZ-X700 fluorescence microscope | Keyence | N/A | N/A |
| Other | Zeiss Axioskop FS2 microscope | Zeiss | N/A | N/A |
Additional files
-
Source data 1
All raw datasets of each figure for this study.
- https://cdn.elifesciences.org/articles/65108/elife-65108-data1-v2.xls
-
Supplementary file 1
Statistical information in each figure.
Table displaying the sample size, statistical test method, and p-value for the list figures.
- https://cdn.elifesciences.org/articles/65108/elife-65108-supp1-v2.docx
-
Transparent reporting form
- https://cdn.elifesciences.org/articles/65108/elife-65108-transrepform-v2.docx
Download links
A two-part list of links to download the article, or parts of the article, in various formats.
Downloads (link to download the article as PDF)
Open citations (links to open the citations from this article in various online reference manager services)
Cite this article (links to download the citations from this article in formats compatible with various reference manager tools)
Adiponectin preserves metabolic fitness during aging
eLife 10:e65108.
https://doi.org/10.7554/eLife.65108


